Abstract
Exosomes distributed by extracellular vesicles carry various information highly consistent with cells, becoming a new type of biomarker for tumor screening. However, although conventional characterization technologies can quantify size and morphology for exosomes, they are limited in related fields such as function tracing, protein quantification at unit point, and microstructural information. In this paper, firstly, different exosome characterization methods are systematically reviewed, such as dynamic light scattering, nanoparticle tracking analysis, flow cytometry, electron microscope, and emerging super-resolution imaging technologies. Then, advances in applications are described one by one. Last but not least, we compare the features of different technologies for exosomes and propose that super-resolution imaging technology can not only take into account the advantages of conventional characterization techniques but also provide accurate, real-time, and super-resolution quantitative analysis for exosomes. It provides a fine guide for exosome-related biomedical research, as well as application in liquid biopsy and analysis techniques.
1. Introduction
Exosomes, a novel tumor biomarker after circulating tumor cells and circulating tumor DNA [1,2,3], can be used in tumor diagnosis [4]. Biosignaling molecules of exosomes are exchanged by endocytosis, and thereby tumor cell activities such as growth, metastasis, drug resistance, and immune evasion are regulated [5,6]. Therefore, exosomes have important value in the early diagnosis of tumors, the monitoring of treatment progress, and prognosis as shown in Figure 1 [4,7,8,9].

Figure 1.
Exosome information transfer process and application [4].
Exosomes are membranous extracellular vesicles (EV) secreted by cells with a particle size of 30 to 150 nm [10]. The study found that the function of exosomes depends on the cell type from which they are derived, while it maintains the same genetic material as the donor cells [11]. Different analyses become one of the tumor-specific research targets during exosome activity. For example, exosomes derived from tumor cells carry many types of proteins, such as surface proteins, inclusions, enzymes, etc. Among them, the surface proteins such as CD9, CD63, and CD81 and the inclusion factors such as HSP70 and Alix are representative proteins for the isolation and identification of exosomes [12,13,14]. The differences in proteins can reflect information exchange between tumor cells and basal cells and between tumor cells and tumor cells, which regulates immune response, migration, differentiation, and other basic cellular functions [15,16,17,18]. For example, studies have found that exosomes derived from different cells are different in size, morphology, and composition [19]. The exosomes derived from tumor cells are large and contain more lipids and outer membrane proteins, which promote tumor cell growth, invasion, and metastasis [20]. The surface proteins of cancer exosomes are often different in different stages, which indicates that these proteins are closely related to the process of cancer. Similarly, the surface proteins of cancer exosomes from different sources are also different, which can be used for the early diagnosis of cancer [21,22]. Research has proven that ADAM10, metalloprotease, CD9, Annexin-1, and HSP70 are enriched in exosomes isolated from the pleural effusion or serum of breast cancer patients [23]. However, the exosomes derived from immune cells are smaller and include a variety of immune molecules, such as cytokines, antigens, antibodies, etc., which could regulate immune responses and antitumor effects [24]. More importantly, quantitative analysis is necessary to identify exosomes accurately. In addition, some studies believe that the morphology, quantity, and concentration of exosomes are different in the process of secretion [25], so real-time tracking and quantification can objectively analyze the delicate mechanism to achieve optimal anti-tumor effect. In conclusion, the morphological characterization and function of exosomes are the basis for exploring the fine physiological information and biochemical mechanisms in cellular biology [26,27].
Exosomes are emerging biomarkers of tumor liquid biopsy, and therefore it is particularly important to explore their biological information such as function tracing, protein quantification at unit point, and microstructural changes [28,29]. At present, much attention has been paid to their basic characteristics such as concentration, diameter, morphology, and particle tracking in high-throughput samples [30,31,32]. In this review, we propose that the characterization techniques for obtaining this information are exosome detection techniques. Conventional characterization methods can achieve the basic characterization of exosomes, yet they are subject to certain limitations. DLS can only obtain the size distribution of exosomes but cannot detect concentration [33]. Although flow cytometry (FCM) realizes multi-parameter detection, the analysis results are based on high-throughput samples and cannot obtain the morphological characteristics of a single EV [34]. EM can visually observe the morphological characteristics of a single EV, but it is not suitable for living cells, and the direction is limited in biological research [35]. Therefore, there is an urgent need for an exosome detection technique that can preserve the fluorescence specificity and achieve high-throughput sample single-molecule detection. In recent years, researchers have paid more attention to fluorescence microscopy. The fluorescence microscope has the advantage of live cell imaging and specific labeling; however, its resolution ranges from 200 nm to 500 nm, which cannot be applied to detecting exosomes. Therefore, how to improve the imaging resolution of optical microscopy and apply it to the imaging observation of subcellular structures such as exosomes has become a research hotspot in recent years. With the development of fluorescence microscopy, super-resolution imaging technology breaks through the diffraction limitation, which is conducive to the field of exosomes [26,36]. Compared with others, it has the advantages of high resolution, specific detection, and live-cell imaging to realize the qualitative and quantitative analysis of proteins of living or fixed cells and track the mechanism of exosomes [36].
In order to better guide the research on exosomes, we systematically discussed and compared characterization techniques for exosomes. This review system elaborates on the principles and applications of conventional characterization technologies for exosomes such as dynamic light scattering (DLS), nanoparticle tracking analysis (NTA), flow cytometry (FCM), electron microscopy (EM), and scanning electron microscopy (SEM), as well as super-resolution technologies represented by stochastic optical reconstruction microscopy (STORM), photoactivated localization microscopy (PALM), stimulated emission depletion (STED), and structured illumination microscopy (SIM). More importantly, this paper discusses the medical problems and characterization techniques of exosomes from morphological characterization to the functional expression of exosomes, from complex samples to single exosomes, and from multiple protein quantification to a single protein of a single exosome. The mechanism and information communication of exosomes were systematically settled from the perspective of technology development, which provides more systematic and comprehensive guidance in the field of basic research.
2. Conventional Characterization Technologies
Due to the unique biological function of exosomes, an increasing amount of basic research is being concentrated on it [37,38,39,40,41]. Characterization technologies play important roles in the study of exosomes [30]. Generally speaking, various approaches for analysis are categorized into two primary types: biochemical analysis and physical analysis. Biochemical analysis mainly determines the source and composition of exosomes, including Western blot and enzyme-linked immunosorbent assay (ELISA), in which the specific binding of antibody antigens decides the effect qualitatively or quantitatively [42]. However, the disadvantage is that the morphological characteristics and concentration of exosomes cannot be obtained. We introduce electron technologies such as tunable resistive pulse sensing (TRPS) and electron microscope (EM) in the first section. Then, we compare optical analysis technologies including dynamic light scattering (DLS), nanoparticle tracking analysis (NTA), and flow cytometry (FCM). Last but not least, we discuss the main parameters of different technologies, providing technical guidance for the fundamental research on exosome characterization.
2.1. Tunable Resistive Pulse Sensing
Tunable Resistive Pulse Sensing (TRPS) is based on Coulter’s principle. The suspension was mixed in the electrolyte, which could go through the nanopore chip with a specific aperture. The resistance between the two electrodes inside and outside changes instantaneously at the moment of passing through the nanopore, the result of which is a pulse signal as shown in Figure 2a. The intensity and frequency of the signal are related to the size and number of exosomes. The expression of exosomes was counted by the pulse signal. In 2014, Maas proposed a method to characterize the concentration and size of EVs by the TRPS based on the qNano system [43]. In 2017, researchers pointed out that TRPS has promise in the quantitative and dimensional analysis of single-particle EV [44]. In 2018, Durak-Kozica analyzed EVs from endothelial cells for a short time and found that the diameter of EVs was 121.84 ± 0.08 and 115.82 ± 0.96 nm from microvascular and big vessels, respectively [45]. This technology enables the efficient quantification of size and number, which cannot be specifically analyzed for exosomes due to the principle of potential pulses.
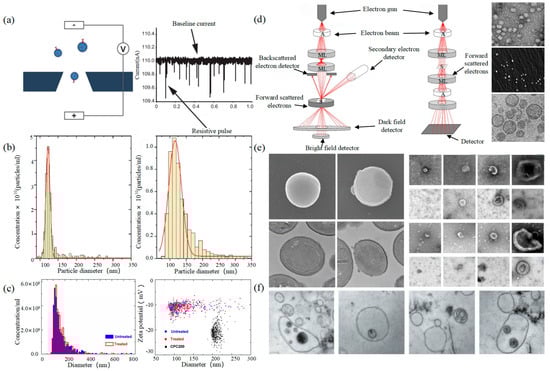
Figure 2.
TRPS and EM (a) The principle of TRPS [43]. (b) TRPS reveals the size distribution of EVs derived from the TIME cell line (left) and the HUVEC line (right) [45]. (c) Particle concentration and size measurements for EV samples before and after INTERCEPT treatment (left), Simultaneous size and zeta potential measurements of untreated and INTERCEPT-treated EV samples and carboxylated polystyrene standard particles (right) [46]. (d) The principle of SEM (left) and TEM (middle) [47] and EVs scans of TEM [48], SEM [49], cryo-TEM [50] (right). (e) EM images of S. aureus without EVs and with EVs (left) [51]. Examples of EM images of individual cup-shaped EVs of different origins [19]. (f) Multivesicular bodies (MVBs) contained in cultured HMC-1 cells and extracellular vesicles in the surrounding growth medium [52].
2.2. Electron Microscope
Electron Microscope (EM) is the most direct method to measure the size and morphology of a single EV [42]. It is divided into scanning electron microscope (SEM), transmission electron microscope (TEM), and cryo-transmission electron microscope (cryo-TEM). It is noted that EM can characterize the particle morphology and size of a single EV [53,54].
The outer membrane of EVs was imaged by a focusing electron beam, the results of which were secondary electrons with different emission amounts. The principle is shown on the left of Figure 2d. Min Kyo Jung et al. observed the detailed structure and specific protein of EVs stained by the negative staining technique [55]. Boz et al. observed the mechanism and morphology of hbEV by SEM [56]. Sokolova et al. obtained the morphological characteristics of exosomes derived from different cells including HEK110T, ECFC, and MSC [57]. The principle of TEM is that the electron beam collides with atoms of EVs, and the scattering angle is converted to acquire the changes in structure, as shown in the middle of Figure 2d. Compared with SEM, TEM has a higher resolution and can realize the imaging analysis of a single EV at the nanoscale [58]. Liu et al. successfully characterized exosomes extracted from breast tumor cells including their morphology and distribution [59]. Park et al. found the morphology of EVs derived from prostate cancer cells (PCa) was round and that the number of these EVs was significantly higher than that of normal cells [60]. It is worth noting that sample protocol is complicated and that the sample is in a vacuum during the process of imaging. In order to reduce the complexity of the protocol, the researchers further developed cryo-TEM to maintain the integrity and authenticity of the sample to the greatest extent [52]. This element changes the structure of the exosome from a round to a cup-like shape as shown in the right of Figure 2d. Conde-Vancells et al. realized the morphological characterization of exosomes derived from hepatocytes [50]. Kurtjak et al. identified the single, double, and multi-membrane morphology of CSF extracellular vesicles by combining cryo-TEM with atomic force microscopy (AFM) [61]. This proves that the cryo-TEM technique can not only restore the EV shape but also allow the analysis of the EV interior.
2.3. Dynamic Light Scattering
Dynamic light scattering (DLS) is an optical analysis method for measuring the size and distribution of sub-micron particles, and its basic principle is shown in Figure 3a. The Brownian motion of the particles causes the change in the light scattering signal, which is monitored by a digital autocorrelator to calculate the diffusion velocity and particle distribution of the particles [62]. The motion rate of small particles is higher, and its intensity fluctuation is larger. As a result, there is a swift and pronounced decline in the correlation curve. The sensitivity and FOV of DLS are better than the above papers, which can realize the basic characterization of large-size exosome nanoparticles. For smaller particles, the behavior of self-polymerization interferes with the light-intensity signal. Thus, it is impossible to realize the precision analysis and detection of high-concentration samples. In 2009, Lawrie et al. used DLS to characterize the size distribution of EV derived from red blood cells [63]. DLS analyzes all particles in a sample simultaneously, and therefore the information on the number or concentration of a certain category of particle cannot be provided [64]. For example, DLS provides a clear range of the diameter of EVs derived from ovarian cancer cells, but the concentration is difficult to analyze [65]. Therefore, DLS technology is often combined with other technologies to complete the characterization of EVs. For example, Tajik T combined DLS technology with electron microscopy, showed cannabis-derived EVs (CDEVs) can be considered exosome-like nanovesicles, and highlighted that CDEVs can be an ideal natural vehicle for bioactive phytocannabinoids, promoting the research of EVs in cancer diagnosis [66].
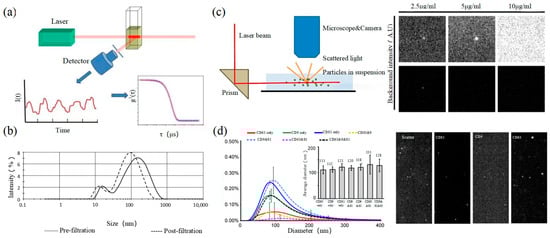
Figure 3.
DLS and NTA (a) The principle of DLS [67]. (b) DLS to characterize the size distributions of microparticles within fresh-frozen plasma [68]. (c) The principle of NTA (left) [69] and EVs of fluorescent labeling on extracellular vesicles and fluorescence detection ability of NTA [70]. (d) Size distributions of three CD markers (CD9, CD63, and CD81) in multifluorescence by NTA (left) and fluorescent images of particles by NTA (right) [70].
2.4. Nanoparticle Tracking Analysis
Nanoparticle tracking analysis (NTA) is an optical method to assess nanoparticles [71]. When the laser irradiates a single nanoparticle, light intensity scattered from the sample is captured by a high-speed camera as shown in the left of Figure 3c. Compared with DLS, NTA can locate and track a single nanoparticle, so this technology has advantages in analyzing the particle size of complex samples. It is worth mentioning that NTA has the ability of fluorescence analysis. Different fluorescent particles can be measured by the relevant parameters, which can identify the sizes of various exosomes at the same time. In 2011, Dragovic et al. applied quantum dot-labeled fluorescent cell tracking peptide with NTA to confirm the origin of common vesicles in plasma [72]. In 2014, Gardiner et al. novelly proposed the refractive index (RI) counted by the relative light scattering intensity (rLSI) could identify the heterogeneity of EV [73]. Saari, H. et al. achieved the distribution of EV in different subpopulations of prostate cancer cells [74]. Huilin Shao et al. tracked the dynamic activity of EVs’ distribution with NTA [75].
2.5. Flow Cytometry
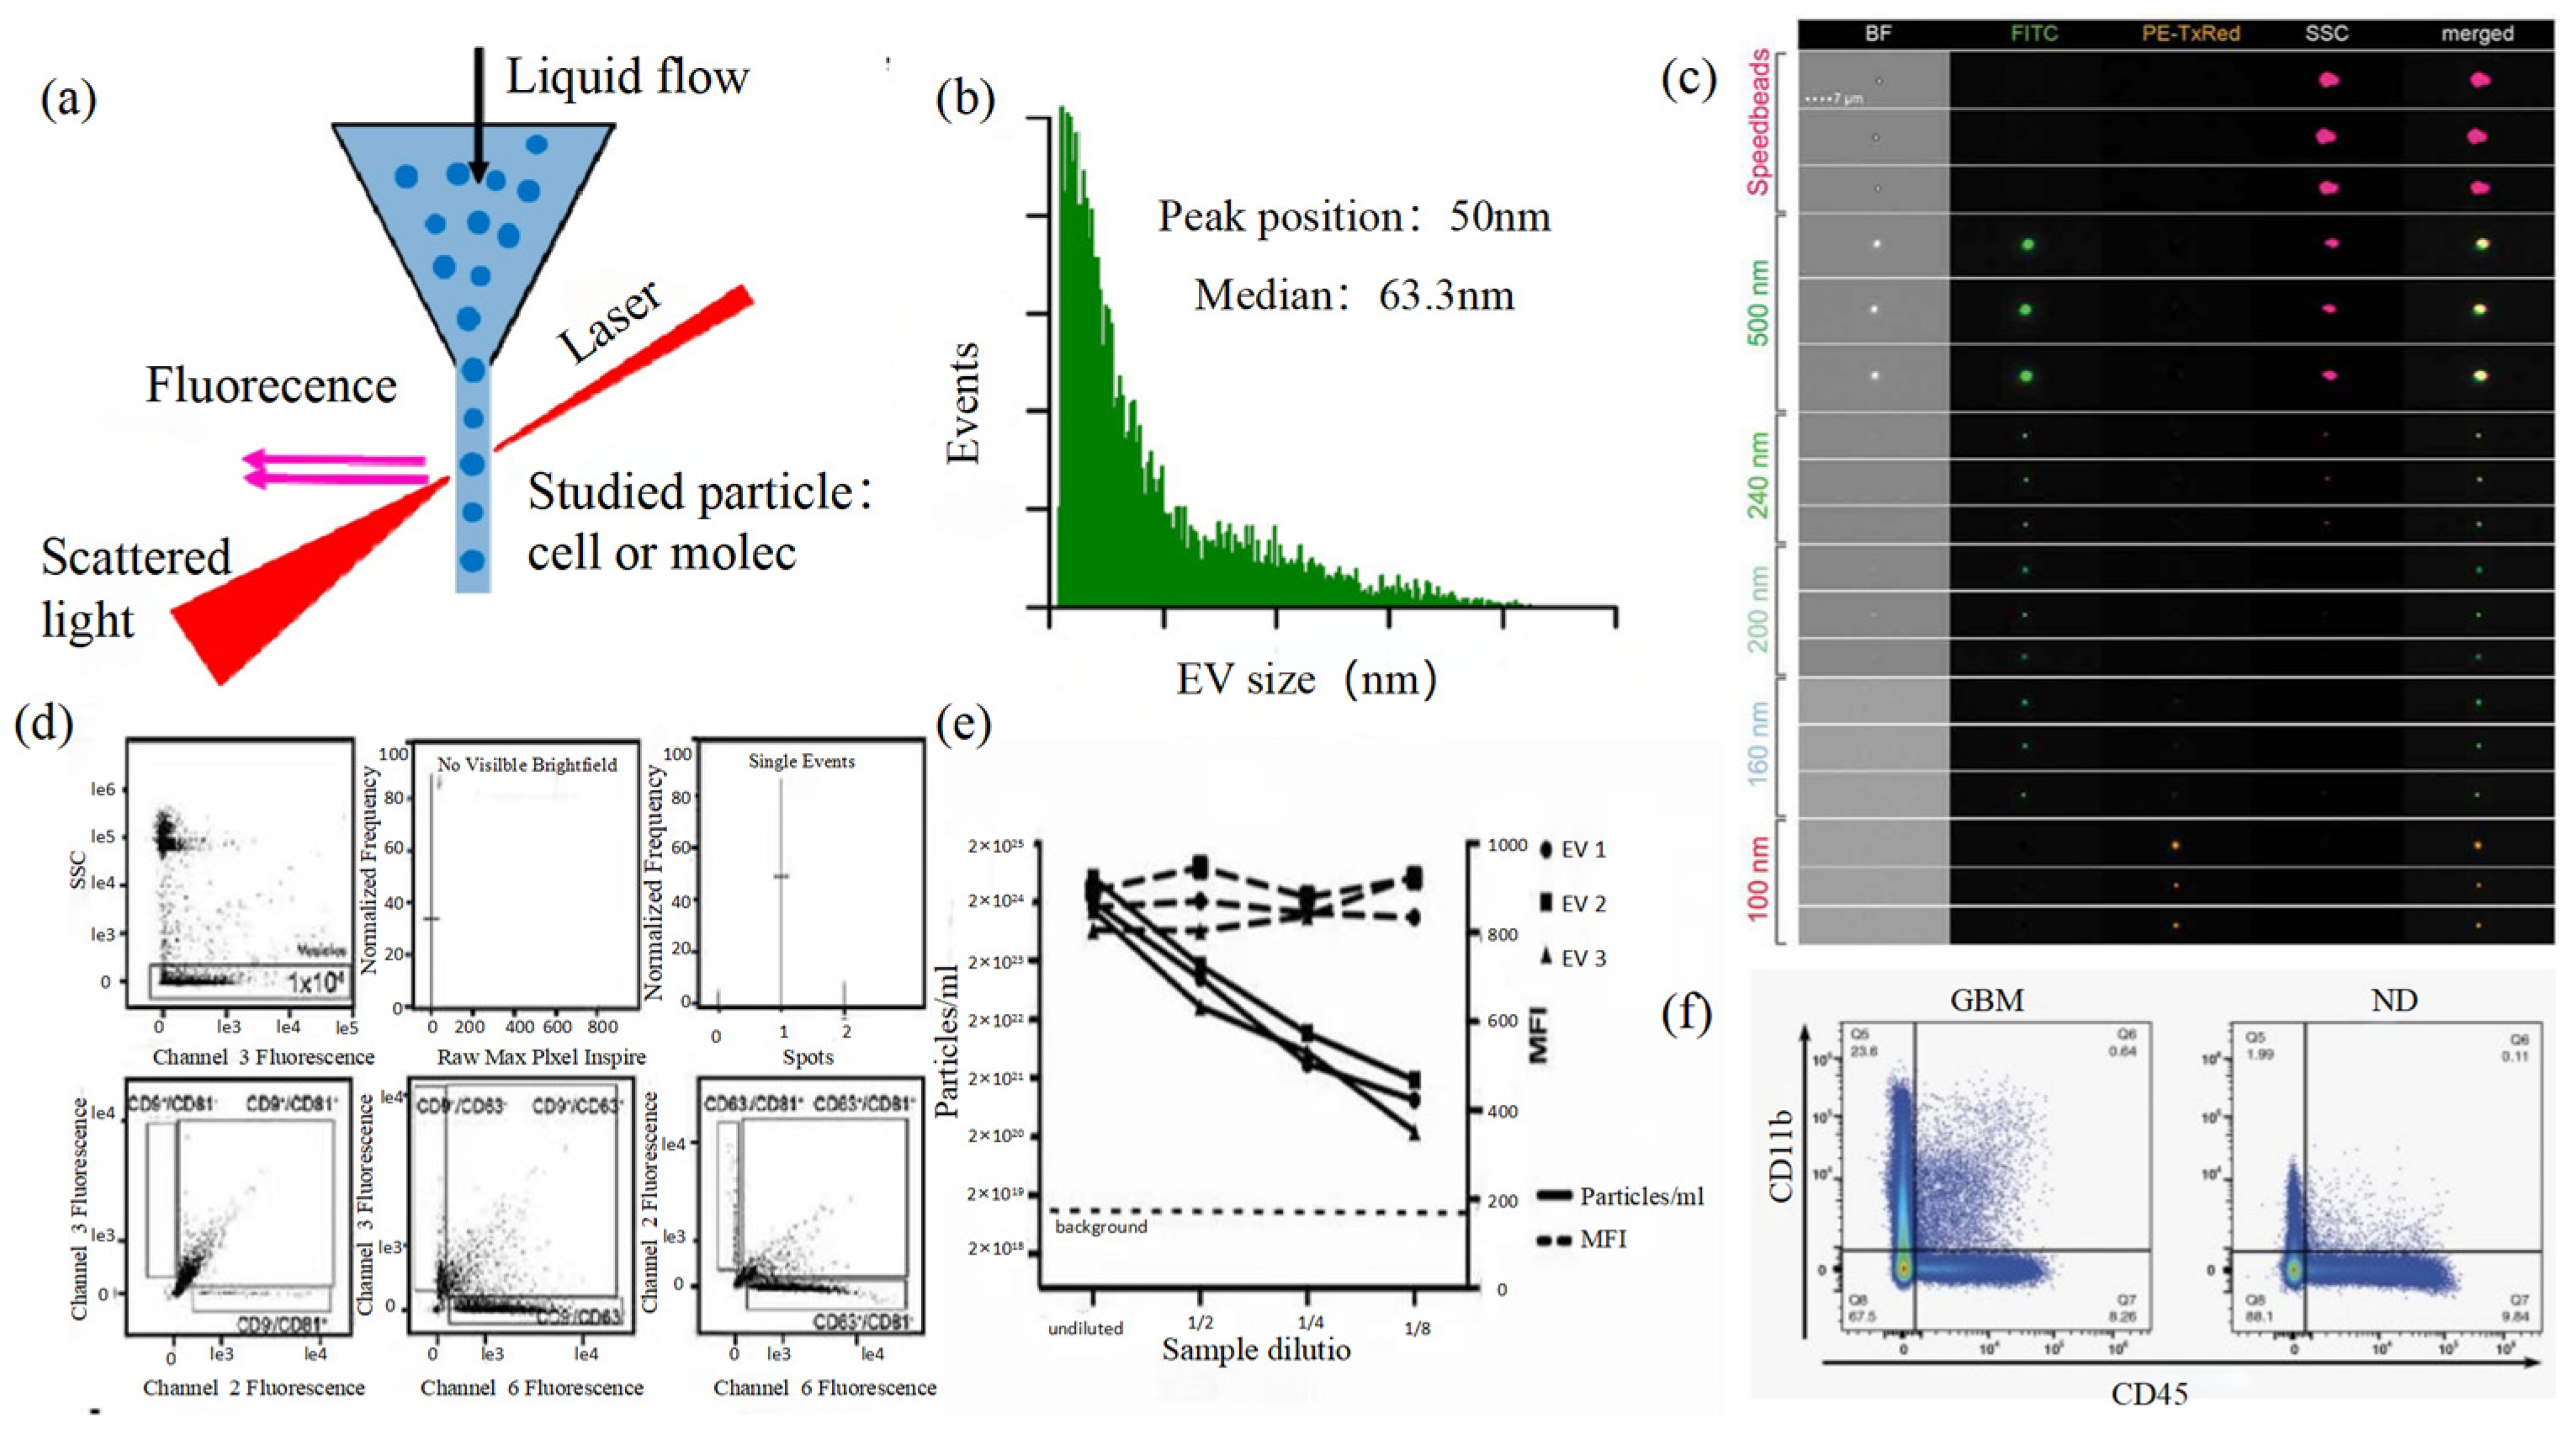
Size and morphology are the basic parameters for the characterization of exosomes. The characterization of functional parameters such as surface protein quantitative expression and signal transduction mode is of paramount importance. Flow Cytometry (FCM) realizes the rapid multi-parameter quantitative analysis of cells or submicron particles based on light scattering changes, and its basic principle is shown in Figure 4a. Scatters of light from particles suspended in a sheath stream reflect the size and density of the cells or particles, and they were acquired by a detector array. At the same time, the specific gene expression, protein expression, enzyme activity, ion concentration, and other biomolecular substances labeled by fluorescent dyes were specifically measured by different channels.
The sensitivity of traditional flow cytometry is limited to 300 to 500 nm [76], so it is obviously difficult to measure exosomes. Yan Xiaomei’s team developed nFCM by combining Rayleigh scattering with sheath flow single-molecule fluorescence detection technology, which enables the high-throughput analysis of exosomes with a size of 40 nm, as shown in Figure 4b [77,78]. Compared with traditional flow cytometry, the scattered light detection sensitivity of nFCM is improved by four to six orders. More importantly, nFCM can detect the scattered light signal of a single nanoparticle at a rate of 10,000 particles per minute [79]. The advantages of this technology are high sensitivity and high throughput, which is suitable for analyzing the size, concentration, and biochemical properties of EVs. In 2022, Haisheng Liu et al. provided evidence for the relationship between DNA and EVs, which confirmed that genetic information in EVs is consistent with cells [78].

Figure 4.
FCM (a) The principle of FCM [69]. (b) Histogram of particle size for an EV sample of HCT-15 cells [78]. (c) Heterogeneous fluorescent beads were analyzed by FCM [80]. (d) FCM detects CD9, CD63, and CD81 positive EVs [80]. (e) FCM analyzes the EV concentration and mean fluorescence intensity (MFI) of the anti-CD9-PE-stained EVs of the three individual EV preparations [80]. (f) Analysis of plasma EVs expressing CD45 and CD11b in GBM and normal donors [81].
The detection method based on electronic technology and optical technology can realize the analysis and quantification of exosomes and provide the necessary quantification technology for the basic research of exosomes. The comparison of the advantages and disadvantages of each method is shown in Table 1. FCM and TRPS can achieve high-precision detection for high-throughput samples. EM is the only characterization method that can reveal the three-dimensional structure of exosomes, but it is not suitable for the detection of high-throughput samples because of the sampling protocol. NTA and FCM enable the functional evaluation of exosomes by fluorescence-specific labeling. According to Table 1, it is obvious that FCM can achieve the structural and functional characterization of exosomes. However, the analysis results are based on high-throughput samples, and the morphological characteristics of a single exosome cannot be obtained easily, so it is difficult to apply in more biomedical fields. Although EM could achieve imaging for samples at low concentrations, cumbersome protocols place greater demands on researchers.

Table 1.
Comparison of conventional characterization techniques.
3. Super-Resolution Imaging Technology
The development of modern biology has promoted the rapid progress of microscopic imaging technology. Due to the limitation of optical diffraction, the minimum resolution of the traditional optical microscope is about half of the wavelength of incident light. Therefore, scientists have been constantly trying to break through it. The resolution of super-resolution imaging technology is below 200 nm, which obtains the same level of resolution as EM. Super-resolution microscopy can achieve real-time super-resolution imaging for organelle structure, interaction, protein function, etc. It provides a new analytical method for cell biology and breaks through the biomedical research status from the nano-scale.
At present, super-resolution imaging technology is divided into two categories. One is a single molecule localization imaging technique (SMLM) based on the random switching of the excited light of the fluorophores between on and off states, which includes stochastic optical reconstruction microscopy (STORM) and photoactivated localization microscopy (PALM). The other is the super-resolution imaging technology achieved based on light field regulation such as stimulated emission depletion (STED) and structured illumination microscopy (SIM). In this section, the application and development of super-resolution technology in exosomes are discussed.
3.1. Single Molecule Localization Imaging Technology
The basic principle of SMLM is based on the flicker of a single fluorescent molecule to locate a single molecule and then reconstruct super-resolution images. Compared with other technologies, SMLM has the advantages of low phototoxicity and low cell damage. It is more suitable for living cells, thus becoming a new super-resolution analysis method for exosomes in vivo observation. SMLM opens a new observation perspective for exosome-related studies.
3.1.1. Stochastic Optical Reconstruction Microscopy and Photoactivated Localization Microscopy Technology
PALM and STORM technologies are classical technologies in SMLM. In 2006, Eric Betzig et al. proposed the PALM technology [82], and Xiaowei Zhuang et al. proposed the STORM technology [83] at the same time. Both of them are based on single-molecule localization technology to achieve the super-resolution imaging of subcellular structure molecules. One of the key elements is the switched fluorophores. For example, PALM uses photoactivated green fluorescent protein (PA-GFP) to label the protein and irradiate the cell surface with different lasers so as to cause the fluorescence molecule cycle to complete the excitation localization process, as shown in the left of Figure 5d. STORM relies on Cy3-Cy5 to change the status of Cy5 to achieve optical switching. Therefore, the intensity should be controlled at a low level as shown in Figure 5a. With the application of fluorescent probe screening, van de Linde et al. found that Alexa Fluor647 does not rely on other dyes to activate light, but it could directly achieve the switching process of fluorophores by high-intensity excitation lights [84]. That means direct stochastic optical reconstruction imaging (dSTORM) can be achieved.
One of the key points is the spatial and temporal resolution for SMLM. That requires more than 10,000 frames of images during the process of reconstruction, which needs much more time. The rapid development of EMCCD cameras has greatly improved imaging speed. In 2011, Zhuang Xiaowei’s group pictured extracellular vesicles with a high-speed EMCCD. The temporal resolution was improved to 0.5 s, which means that STORM has the potential to monitor live cell imaging in real-time [85]. Zhuang et al. also proposed a high-density algorithm based on compressed sensing (CSSTORM), which successfully reduced the original data needed in constructing a super-resolution image to 169 frames [86]. In 2020, Qu’s team combined noise-corrected principal component analysis (NC-PCA) with CSSTORM to decrease the original data noise, the results of which were that the hyperfine structure and dynamic processes of mitochondria were successfully observed in living Hela cells at different time points [87]. In addition, SMLM combined with deep learning also greatly improves temporal resolution. In 2021, Wei Ouyang et al. combined PALM with deep learning, reducing the number of sampling frames from 30,000 to 300 frames and increasing the time resolution of the system by 100 times [88]. All of this means that the development and application of algorithms play an important role in improving the temporal resolution of SMLM technology.
The optimization of the single-molecule localization algorithm is a great help to the development of SMLM technology. Meanwhile, the development of fluorescent probes also promotes the development of SMLM. With the combination of the above, spatial resolution is greatly improved, even reaching less than 10 nm [89], which makes it possible for us to observe the fine structure of exosomes through optical microscopy.
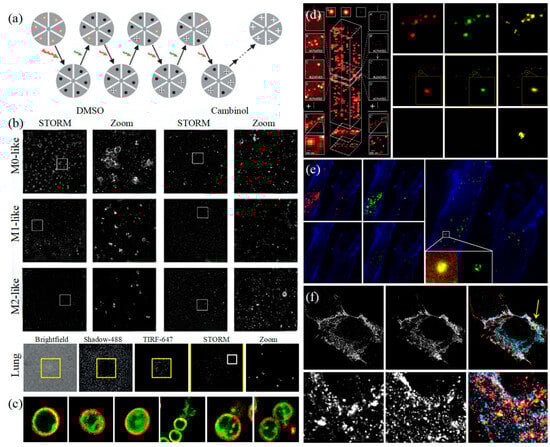
Figure 5.
STORM and PALM (a) The principle of STORM [83]. (b) STORM observes that EVs colocalize with wells in the actin reticulum and can be inhibited by Cambinol (above), and human lung macrophages secrete EVs upon activation through their FcγRI (below) [90]. (c) Multi-color STORM images for the various compositions of EVs in gram-positive bacteria [51]. (d) The principle of PALM [82] (left) and Dual-color super-resolution imaging of CD63 and HER2 in SKBR3-derived exosomes [91] (right). (e) PALM/STORM was used to observe the colocalization of SKBR3 exosomes and MRC-5 lysosomes [91]. (f) CD63-GFP and CD81-mCherry U-2 OS expressing cells were visualized by dSTORM [48].

In 2011, Zhuang’s team used the stage-specific neurite-associated protein (SNAP) label to label the Alexa Flour 467 optical switching probe to clathrin in living BS-C-1 cells. STORM technology was successfully used to obtain a 30 nm horizontal resolution and a 50 nm vertical resolution [85]. In 2012, Shim et al. determined the STORM membrane probe for live cell imaging through a large number of experiments and performed the super-resolution imaging of organelle membranes in live cells, reaching a spatial resolution of 20~60 nm [92]. In 2018, Zong Shenfei et al. discovered that silicon quantum dots (Si QD) have fluorescent scintillation behavior and applied them as SMLM imaging nanoprobes to stain CD63 of breast cancer cell (SKBR3)-derived EVs using CD63 aptamers fused with Si QD, achieving an imaging accuracy of about 30 nm. They demonstrated that Si QD can be used for the SMLM imaging of small objects such as exosomes. Moreover, Si QD has the characteristics of high biocompatibility and low cytotoxicity, which makes it a better choice of fluorophores for SMLM live cell imaging [93].
At present, SMLM provides a fast and high-precision optical detection method for exosome structural characterization. The implementation of high-speed STORM/PALM makes it possible to analyze the functional communication effects of intracellular or intercellular information and substance exchange in exosomes. In 2016, Chen et al. verified the possibility of PALM/STORM in exosome imaging by labeling extracellular proteins [91]. On the one hand, the imaging of exosomes obtained by PALM/STORM can be obtained with authenticity. On the other hand, bicolor STORM imaging revealed the intercellular transport of exosomes, suggesting that cellular exosome uptake depends on endocytosis and phagocytosis. In 2018, Chen et al. observed the entire process of the transport of entotic exosomes to lysosome degradation, with a time resolution of 4 s. It has been verified that this time resolution is sufficient to reveal the movement process of exosomes [94]. At the same time, they also observed that the contents of exosomes reached the cytoplasm through the endocytosis process and revealed the mechanism of the action and movement of exosomes in a more detailed manner. Those results effectively promoted the development of biomedical research on exosomes as drug carriers. In 2019, Mondal et al. achieved the effective tracking of EV by PKH67 dye to label Neuroplasma-derived EV’s surface markers such as CD63 and inter-vesicle markers such as TSG101 and HSP70 and observed that EV was effectively internalized by recipient cells [95]. In 2022, Jeong et al. successfully visualized the EVs biogenesis of Gram-positive bacteria through super-resolution imaging technology, which examined the ultrastructure and three main mechanisms of biogenesis that emphasized the important role of cell wall degradation in these mechanisms [51]. In the same year, McNamara et al. visualized hundreds of single EVs in 3D and digitally located the four transmembrane proteins (CD9, CD63, and CD81) on the surface of EVs, which revealed the heterogeneity of EVs [48]. In 2023, Saftics et al. comprehensively evaluated EV subsets in human plasma and compared EV in the plasma of pancreatic cancer patients with healthy plasma and found that there were unique EV subsets in pancreatic cancer patients, which was beneficial to the research of EV as a basis for cancer diagnosis [96].
SMLM technology also provides direct evidence for EVs as a novel tumor biomarker. First, it confirmed that EVs are related to the pathological process of tumor metastasis. Oleksiuk et al. demonstrated for the first time the visualization of miRNA in the exosomes of colon cancer cells (SW480) at the single-molecule level in 2015. Most of the highly metastatic SW480 exosomes have higher molecular weight miR-31, which has a profound impact on the identification of key metastatic subgroups in heterogeneous cancer cell populations [97]. In 2018, Zong Shenfei’s team tracked the miRNA of exosomes in HeLa cells, which is crucial for studying the influence of exosomes on cancer cell metastasis [94]. Recently, the team also proposed that exosomes were amplified by combining amplification microscopy (ExM) with SMLM to achieve a localization accuracy of about 30 nm. Successfully, they observed the nanoscale substructure of proteins on the exosomes of human breast cancer (SKBR3) cells and HeLa cells, providing a new idea for visualization exosome superresolution imaging research [98]. What is more, the research of EVS by SMLM technology shows great potential in cancer diagnosis. In 2019, Lennon et al. evaluated EVs in cells and plasma by dSTORM, effectively distinguishing pancreatic cancer-enriched EVs in cancer diagnosis [99]. In 2022, Dechantsreiter et al. located a single EV derived from human macrophages (MDM) by combining STORM with proteomic analysis, revealing the EV content of different sizes and the differences between EVs secreted by different MDM. The study found that the frequency and intensity of HLA-DR expression in the MMD-secreted EV derived from the lungs of cancer patients was higher, suggesting the enrichment of macrophages in the lungs of cancer patients [90]. In the same year, Wei et al. proposed a fluorescence detection method for EDIL3-overexpressed exosomes through SMLM and proposed that EDIL3-overexpressed exosomes are novel biomarkers for the early diagnosis of triple-negative breast cancer (TNBC), which have great potential in the clinical diagnosis of TNBC [100].
3.1.2. DNA-PAINT Technology
Similar to the STORM/PALM technology, DNA-PAINT also achieves super-resolution imaging by controlling the flicker of individual fluorophores. In 2014, Ralf Jungmann et al. proposed the DNA-PAINT technology, which uses reversible binding between complementary DNA sequences to produce an effect similar to the “flicker” of fluorescent molecules [101]. In double-strand DNA, one strand is connected to the fluorophores, called the imager strand, and the other is connected to the target molecule, called the docking strand. Due to the highly specific binding of the double-strand DNA, the imaging strand and the docking strand are bound spontaneously, producing single-molecule fluorescence in the focal plane [102] as shown in Figure 6a. In addition, multi-channel fluorescence imaging can be realized by different proteins labeled with various docking strands.
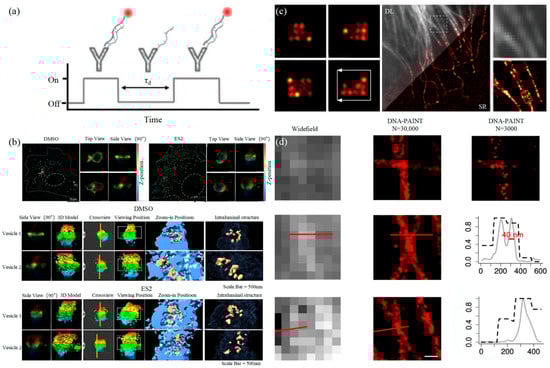
Figure 6.
DNA-PAINT (a) The principle of DNA-PAINT [103]. (b) 3D DNA-PAINT images of COS-7 cells treated with DMSO or ES2 [104]. (c) Representative super-resolution images of 20 nm grid structures (left) and Diffraction-limited (DL) alongside the super-resolution (SR) of the microtubule network in a HeLa cell [105]. (d) Comparison of the widefield images and DNA-PAINT images [106].
The DNA-PAINT technology focused on reducing the resolution to the molecular level early. Then, it focused on the limitation of long acquisition times [107]. Long collection time is a basic limitation of SMLM technology, which is due to the need to collect enough photons to determine the central position of the fluorophores [108]. The common idea is to increase the binding frequency at a high concentration of the docking strand, but the concentration of the imaging strand influences the SNR of technology [109]. In 2017, Auer et al. developed a FRET-based imaging probe, which not only alleviated the limitation of the concentration of the imaging strand and successfully increased the image acquisition speed by several orders of magnitude but also performed a 30 s super-resolution imaging of microtubules, demonstrating usability in living cell imaging [105]. In 2020, Strauss et al. proposed a method to optimize the docking strand sequence, which increased the image acquisition speed of DNA-PAINT by 100 times compared to traditional methods, and then they extended this method to six orthogonal sequence mods to achieve fast multiple imaging [110].
Proteins on exosomes can be quantitatively analyzed with high precision by DNA-PAINT. The different contents of proteins carried by exosomes such as CD9, CD63, CD81, HER2, EpCAM, and EGFR could achieve the classification of the course of tumorigenesis [111]. Chen et al. combined DNA-PAINT with machine learning to identify tumor cell types in two steps [103]. The first step is to distinguish between healthy cells and tumor cells and then to perform cross-typing on different types of tumor cells, among which the comparison results of breast cancer and pancreatic cancer show that the system can accurately and quickly distinguish the two types of cancer, which makes it possible for exosomes to achieve an early diagnosis of cancer through optical detection. Coincidentally, Zhu et al. also combined machine learning with DNA-PAINT to develop a neural network based on U-Net, U-PAINT, which successfully compressed tens of thousands of frames of raw data required for traditional DNA-PAINT imaging to one-tenth of its original size and is expected to achieve faster DNA-PAINT imaging of living cells in the future [106]. In addition, Bai et al., in a study on exosome biogenesis and release in head and neck cancer cells (HNC) in 2021, pointed out that extracellular sacs may be involved in exosome biogenesis [112]. Recently, a 3D super-resolution imaging using DNA-PAINT examined the multivesicular endosomes (MVE) of COS-2 cells and confirmed that phosphoinositol mediated extracellular vesicles to guide MVEs’ fusion with the plasma membrane to release exosomes [104].
3.2. Stimulated Emission Depletion Technology
In 1994, Hell et al. proposed stimulated emission depletion technology (STED) for the first time in theory. The principle of STED is that two laser beams are used for microscopic imaging, with one as excitation light for photon excitation and the other as loss light, which is a ring laser with zero central intensity [113]. The loss light should be coaxial with the excitation light, and the wavelength should match the emission wavelength of the fluorescence molecule as shown in the left of Figure 7a. STED is a super-resolution imaging technology developed based on laser scanning confocal microscopy. Fast, direct imaging characteristics and a nanoscale observation scale are ideal for living cell research. However, the resolution of STED is affected by the ratio of lost optical power to probe saturation excitation power. The higher the relative power, the higher the imaging resolution, but it will also cause the rapid photobleaching of fluorophores, causing serious photodamage to cells. Therefore, the application of STED to live cell super-resolution requires the development of fluorescent probes.
Many research teams are committed to developing photobleach-resistant fluorescent probes that can be used in STED live cell imaging studies. In 2016, Butkevich et al. discovered Rhodamine dye capable of penetrating cell membranes and used it to achieve the STED super-resolution imaging of live cells [114]. However, the dynamic monitoring of the dynamic processes of living cells is of great significance in biological research. In 2019, several new probes were developed by the Pajk team for STED live cell imaging. Compared with the same type of fluorescent probes on the market, they not only have higher resolution but also have no obvious toxicity and can enter cells relatively quickly, promoting the super-resolution imaging and dynamic monitoring of living cell organelles [115]. In the same year, Valcz et al. specifically tagged CD63 and ALIX proteins and determined that the in situ release of EVs from colorectal cancer cells was caused by the fusion of MVB with plasma membrane by STED-assisted detection [116]. On this basis, the researchers further sought to improve the resolution of STED. In 2020, Yang et al. developed an enhanced aromatic acid variant dye (MitoESq-635) and successfully achieved the STED imaging of the mitochondrial inner membrane of HeLa cells with a resolution of 35.2 nm thanks to the dye’s low saturation and high light stability, promoting STED research on the long-term imaging observation of tumor cells [117]. In addition, Alvelid et al. developed a new adaptive microscopic imaging method called etSTED in 2022, which combines fast wide-field imaging with STED imaging to achieve 3DSTED nanoimaging acquisition, and successfully observed different EVs and membrane fusion events in tumor cells, promoting the exosome study of STED [118]. In the development of fluorescence probes, upconversion nanoparticles (UCNPs), as a new class of nonlinear optical probes, can emit stable and bright visible light at various optional wavelengths under near-infrared excitation and have single particle sensitivity; therefore they can be used in optical microscopy imaging [119]. In 2020, Yongtao Liu successfully used UCNPs to track single nanoparticles inside tumors with a resolution of 55 nm of STED and proposed an application to track single nanoparticles and monitor drug release in the 3D multicellular environment [120]. In 2022, Huang et al. applied UCNPs to the STED super-resolution imaging of EVs by specifically binding UCNP to antigens on tumor EVs, reaching a resolution of 41.9 nm and successfully distinguishing neighboring UCNPs on a single EV. As the size of UCNP decreases, the number of UCNP observed on a single EV increases. Although the absolute characterization of the number of all antibodies cannot be achieved, the trend in their number can be characterized, which can be considered for the detection of tumor growth and cancer metastasis in the future [121]. In 2023, Liu et al. used UCNPs to successfully achieve the highest resolution of STED, i.e., sub-40 nm, with the assistance of nonsaturated confocal super-resolution results [122]. At present, the research on UCNPS is still in progress, which will promote the application of STED to EV imaging.
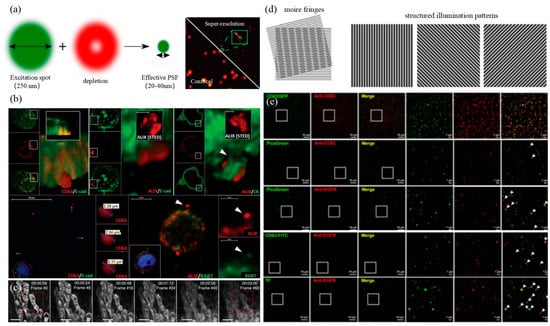
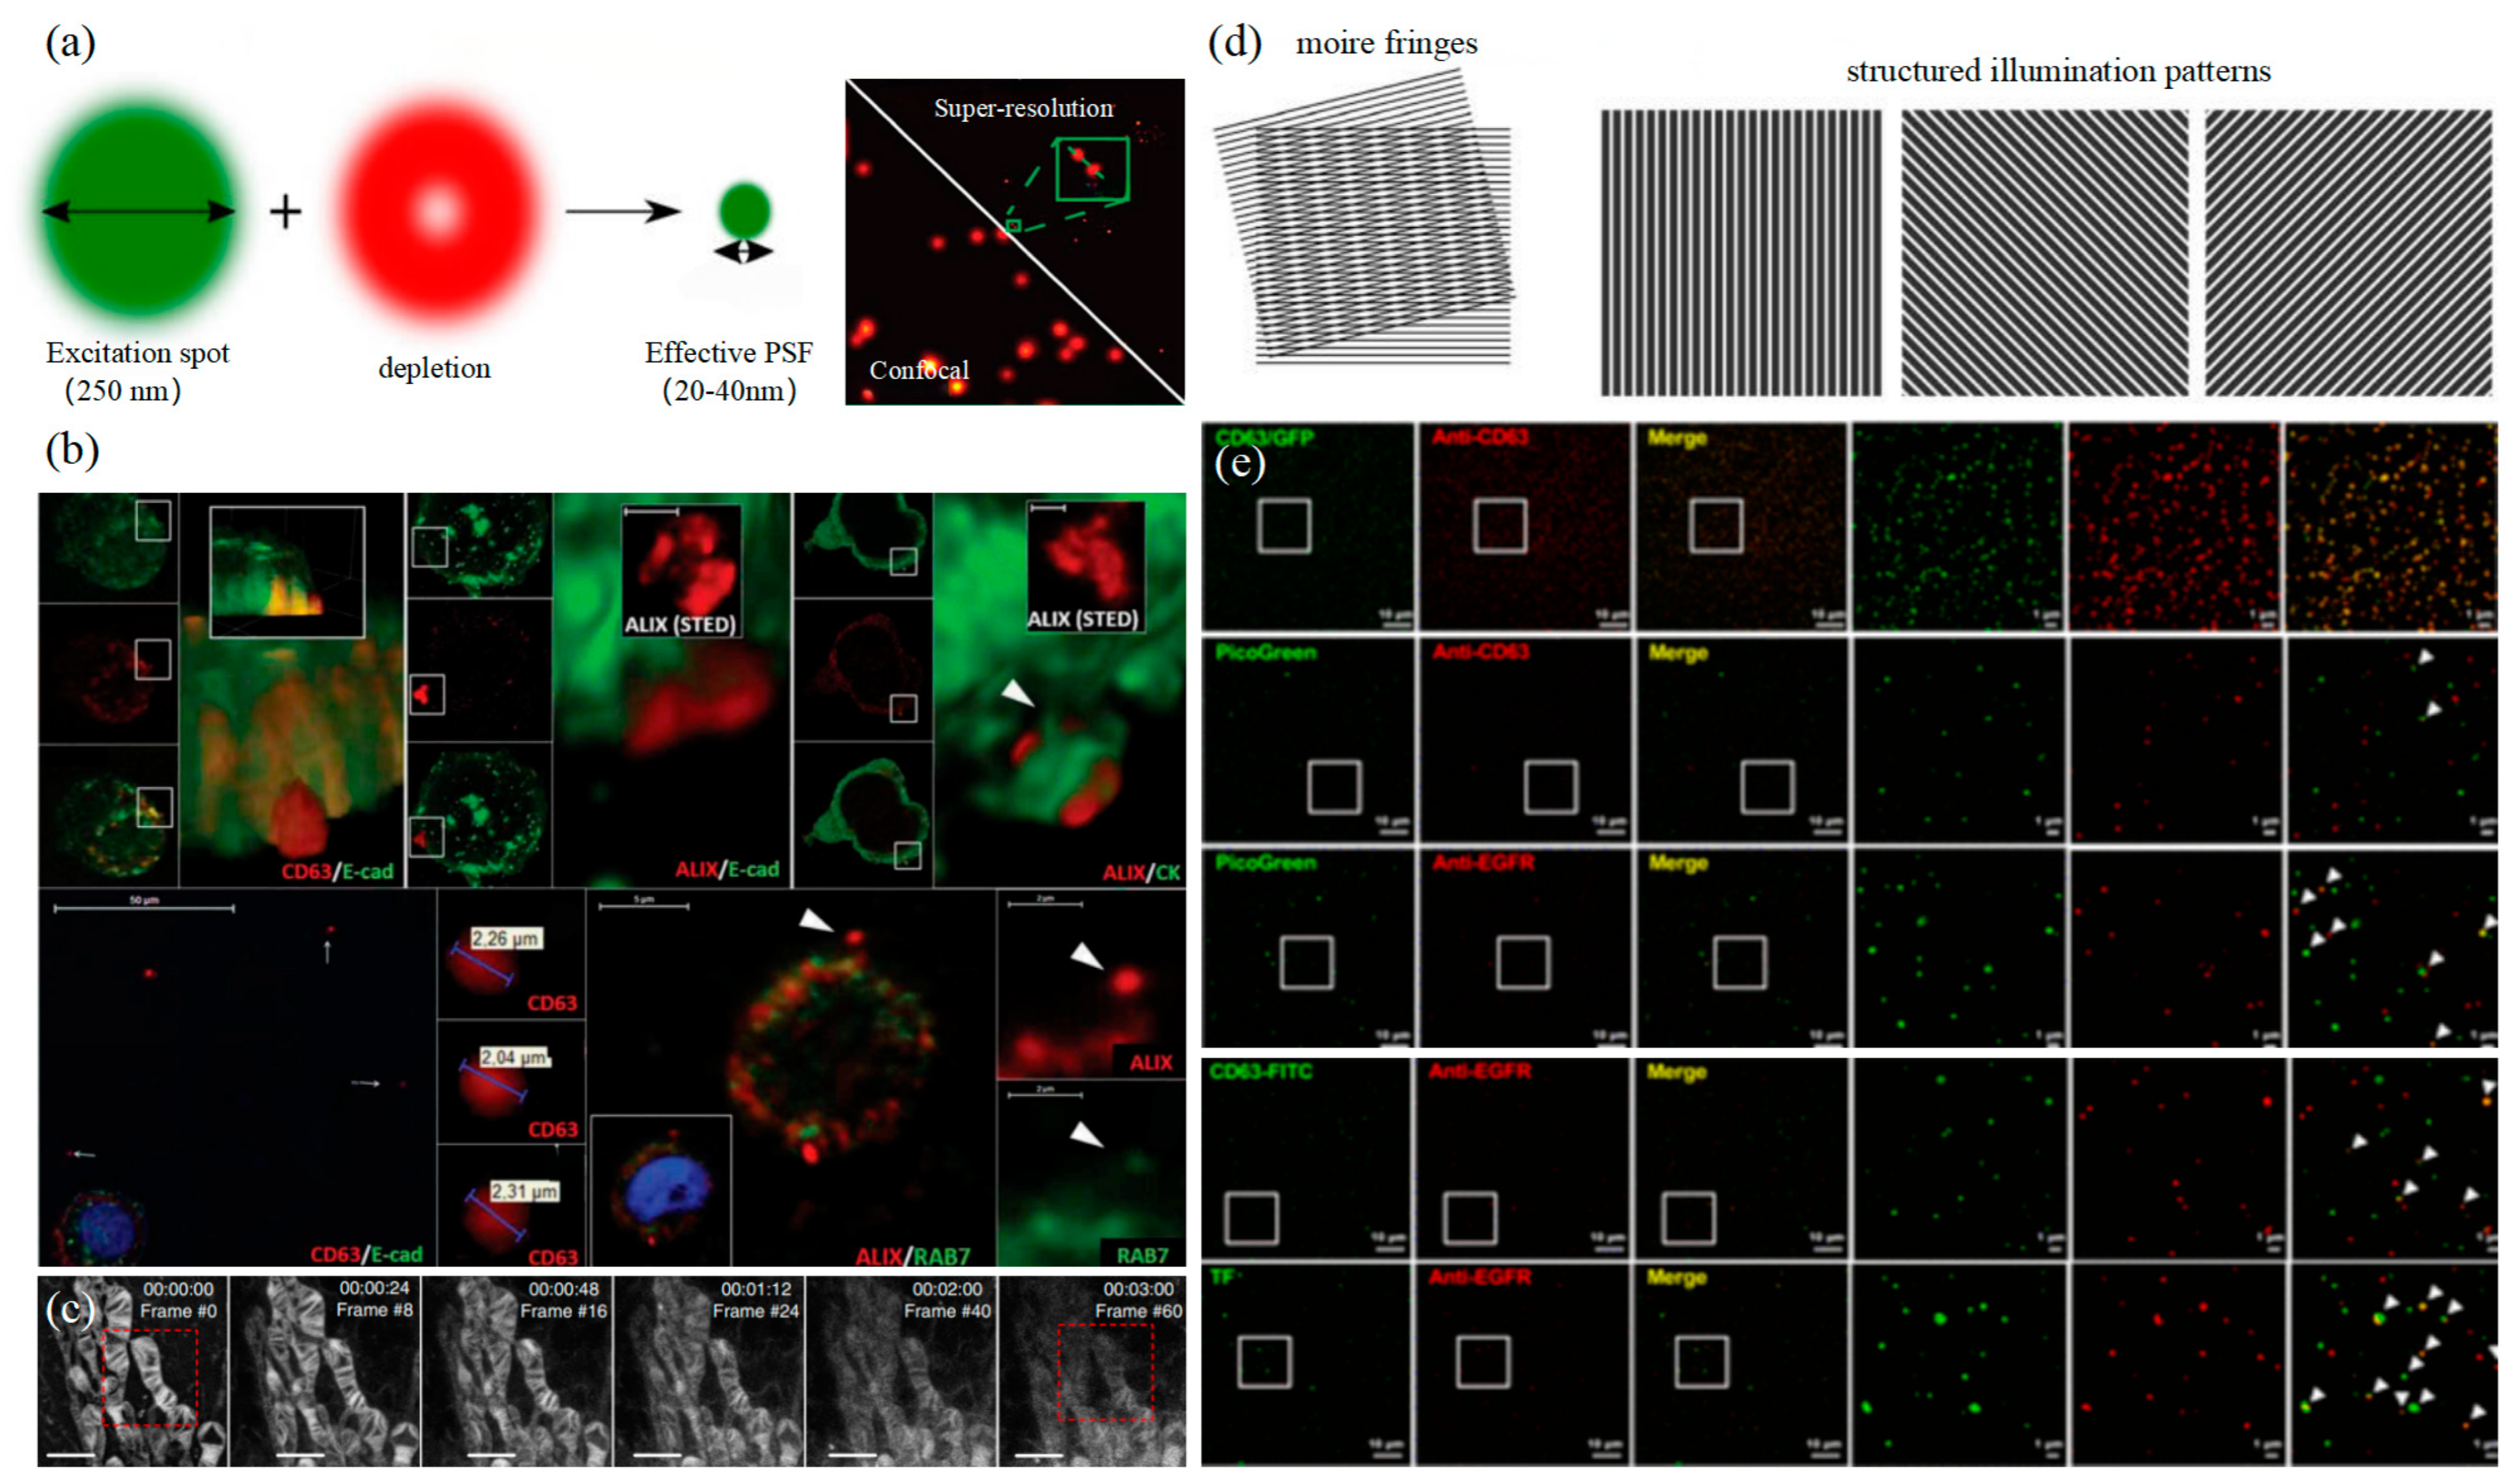
Figure 7.
STED and SIM (a) The principle of STED (left) [123] and characterization of single EVs by UCNPs labeling using STED (right) [121]. (b) Visualization of extracellular sEVCs in HT29 colorectal carcinoma cell [116]. (c) Time-lapse STED imaging of the mitochondria [117]. (d) The principle of SIM (left) [123]. (e) SIM resolution was validated by a complete co-localization between genetic tag-based (CD63-GFP) and immunofluorescent imaging for the CD63 [124].
3.3. Structured Illumination Microscopy Technology
Structured illumination microscopy technology (SIM) is a super-resolution imaging technology based on frequency domain modulation proposed by Gustafsson in 2000 [125]. A Moire fringe is used to transfer high-frequency information beyond the system cutoff frequency to the low-frequency part to realize signal detection and improve imaging resolution. Excited light can generate sinusoidal fringe patterns through the grate to irradiate the sample as shown in the left of Figure 7d. SIM usually only needs to capture nine frames of image, and the time resolution is much higher. In addition, excitation light intensity is also relatively low, which is suitable for living cells. However, as SIM is limited by the imaging principle, the lateral resolution can only reach about 150 nanometers, which means that although SIM has the advantage of temporal resolution compared with other super-resolution imaging technologies, it is limited by the spatial resolution and cannot meet the detection requirements of exosomes. In 2005, Gustafsson achieved a transverse resolution of 50 nm using Saturated Structured Illumination Microscopy (SSIM, Northrop Grumman PolyScientific, Charlotte, NC, US), but at the cost of severe light damage and reduced imaging speed [126]. Therefore, in recent years, researchers have tried to improve the spatial resolution of SIM while retaining the advantages of live-cell imaging.
At present, the two best-optimized SIM are patterned activation nonlinear SIM (PA NL-SIM) and Glazing Incidence SIM (GI-SIM). However, the resolution of both is better than 100 nm and cannot reach 50 nm. In 2015, Li et al. successfully observed images for F-actin in living COS-7 cells at the spatial resolution of 62 nm by PANL-SIM [127]. In recent years, researchers have tried to optimize algorithms to expand SIM resolution. In 2021, Boland et al. used a deep learning model to enlarge images and proposed a method to reconstruct a 3D SIM image stack to increase the axial resolution of SIM by two times [128]. In 2022, He et al. introduced deep image prior (DIP) during the process of post-processing to design an untrained convolutional network to recover high-frequency information lost in SIM, which successfully achieved a 1.4-fold increase in horizontal resolution [129]. In the same year, Butola et al. proposed a new algorithm that eliminated the requirement of illumination peak clarity and an understanding of illumination patterns, making the instrument simple and flexible to be used with various micro-objectives, achieving an increase in resolution of 2.6 to 3.4 times [130]. Due to the limitation of resolution, SIM is rarely used in exosome studies. In 2019, Choi et al. revealed the molecular morphology of a single EV, which is expected to be used in the exploration of cancer cell EV by combining with nanoflow cytometry [124]. It is believed that SIM technology will be widely used in exosome research after breaking through the limitation of spatial resolution.
The super-resolution imaging techniques have broken through the optical diffraction limit and been successfully applied to live-cell imaging. Based on the above description, we believe that SMLM has more advantages in exosome-related imaging research from the perspective of fluorescent probe requirements, imaging spatiotemporal resolution, and the advantages of live-cell imaging. Especially, the imaging resolution of SMLM could meet the requirement for observing the diameters of exosomes, so it is widely popular in exosome imaging research in live cells. STED technology has no special requirements for fluorescent probes, and the imaging resolution also meets the requirement for observing the diameters of exosomes, but the photodamage decreases the activity of live cells because of high power loss. As a result, it is not suitable for cells in vivo. Thus, it is urgent for STED to develop new fluorescent probes that are resistant to bleaching or low-loss optical thresholds. SIM technology with universal probes has superior imaging temporal resolution compared with the other two technologies. Due to the limitation of imaging principles, the imaging resolution cannot meet the requirement for observing exosomes at present. Some researchers found that nonlinear SIM may improve the resolution of traditional technology, which is good for exosomes. Above all, SMLM is currently the most effective super-resolution imaging technique for exosome research, and STED or SIM has also been optimized. It is promising for super-resolution imaging technology to explore more detailed biomedical issues such as subcellular structures and functional mechanisms with the advancement of various fields.
4. Summarize the Outlook
With developments in science and technology, optical technology has become the main means to explore exosome biogenesis and mechanisms of action, especially super-resolution imaging technology. It not only breaks through the diffraction limitation but also realizes three-color and multicolor imaging. It greatly combines the advantages of conventional characterization techniques and facilitates various biomedical studies based on exosomes, such as early diagnosis and typing of tumors. SIM and STED may limit the further study and application of exosomes due to photobleaching, phototoxicity, and a lack of resolution. Both algorithm optimization and the development of fluorescent probes have promoted the optimization of both, especially the development of nonlinear SIM technology, which promotes its application in exosomes. In contrast, SMLM research on exosomes has a wide range of application prospects. For example, the STORM technology can clearly and intuitively analyze the three-dimensional morphology of exosomes and functional information inside and outside cells with the advantages of super-resolution and rapid and real-time analysis. The results of basic research can lead to more medical applications. Chen Chen’s team has set a good example for us. At present, researchers are also actively developing various methods to improve super-resolution imaging technology to facilitate precision medicine about exosomes.
In the future, we can expect not only the development of various characterization techniques but also the combination of exosome characterization techniques with machine learning to greatly shorten the image reconstruction time and expand the possible directions of scientific technology and biomedical applications. In addition, nanoscale characterization imaging analysis provides a new observation for the structure and function analysis of exosomes and accelerates the process of basic research on exosomes. It objectively and systematically reveals the information exchange mechanism and interaction effect of exosome-based cell biology. We hope that the related research on exosomes can broaden our horizon for the treatment of major diseases and contribute to the solution of human health problems.
Funding
This research was funded by the National Natural Science Foundation of China grant number No. 62275125 and 62227818, the Fundamental Research Funds for the Central Universities (grant No. 30922010313), Shenzhen Sami Medical Center High-level Clinical Research Voyage Team Project (grant number SSMC-2024-TB5).
Conflicts of Interest
The authors declare no conflict of interest.
References
- Wan, J.C.M.; Massie, C.; Garcia-Corbacho, J.; Mouliere, F.; Brenton, J.D.; Caldas, C.; Pacey, S.; Baird, R.; Rosenfeld, N. Liquid biopsies come of age: Towards implementation of circulating tumour DNA. Nat. Rev. Cancer 2017, 17, 223–238. [Google Scholar] [CrossRef]
- Alix-Panabières, C.; Pantel, K. Circulating tumor cells: Liquid biopsy of cancer. Clin. Chem. 2013, 59, 110–118. [Google Scholar] [CrossRef] [PubMed]
- Guo, L.C.; He, B. Extracellular vesicles and their diagnostic and prognostic potential in cancer. Transl. Cancer Res. 2017, 6, 599–612. [Google Scholar] [CrossRef]
- Huang, T.; Deng, C.X. Current Progresses of Exosomes as Cancer Diagnostic and Prognostic Biomarkers. Int. J. Biol. Sci. 2019, 15, 1–11. [Google Scholar] [CrossRef] [PubMed]
- Im, E.J.; Lee, C.H.; Moon, P.G.; Rangaswamy, G.G.; Lee, B.; Lee, J.M.; Lee, J.C.; Jee, J.G.; Bae, J.S.; Kwon, T.K.; et al. Sulfisoxazole inhibits the secretion of small extracellular vesicles by targeting the endothelin receptor A. Nat. Commun. 2019, 10, 1387. [Google Scholar] [CrossRef]
- Junker, K.; Heinzelmann, J.; Beckham, C.; Ochiya, T.; Jenster, G. Extracellular Vesicles and Their Role in Urologic Malignancies. Eur. Urol. 2016, 70, 323–331. [Google Scholar] [CrossRef]
- Akers, J.C.; Ramakrishnan, V.; Kim, R.; Phillips, S.; Kaimal, V.; Mao, Y.; Hua, W.; Yang, I.; Fu, C.C.; Nolan, J.; et al. miRNA contents of cerebrospinal fluid extracellular vesicles in glioblastoma patients. J. Neuro-Oncol. 2015, 123, 205–216. [Google Scholar] [CrossRef] [PubMed]
- Minciacchi, V.R.; Freeman, M.R.; Di Vizio, D. Extracellular vesicles in cancer: Exosomes, microvesicles and the emerging role of large oncosomes. Semin. Cell Dev. Biol. 2015, 40, 41–51. [Google Scholar] [CrossRef]
- Ciardiello, C.; Cavallini, L.; Spinelli, C.; Yang, J.; Reis-Sobreiro, M.; de Candia, P.; Minciacchi, V.R.; Di Vizio, D. Focus on Extracellular Vesicles: New Frontiers of Cell-to-Cell Communication in Cancer. Int. J. Mol. Sci. 2016, 17, 175. [Google Scholar] [CrossRef]
- Liu, J.; Ren, L.; Li, S.; Li, W.; Zheng, X.; Yang, Y.; Fu, W.; Yi, J.; Wang, J.; Du, G. The biology, function, and applications of exosomes in cancer. Acta Pharm. Sin. B 2021, 11, 2783–2797. [Google Scholar] [CrossRef]
- Duijvesz, D.; Luider, T.; Bangma, C.H.; Jenster, G. Exosomes as biomarker treasure chests for prostate cancer. Eur. Urol. 2011, 59, 823–831. [Google Scholar] [CrossRef] [PubMed]
- Kimiz-Gebologlu, I.; Oncel, S.S. Exosomes: Large-scale production, isolation, drug loading efficiency, and biodistribution and uptake. J. Control. Release 2022, 347, 533–543. [Google Scholar] [CrossRef] [PubMed]
- Andreu, Z.; Yáñez-Mó, M. Tetraspanins in extracellular vesicle formation and function. Front. Immunol. 2014, 5, 442. [Google Scholar] [CrossRef] [PubMed]
- Berditchevski, F.; Odintsova, E. Tetraspanins as regulators of protein trafficking. Traffic 2007, 8, 89–96. [Google Scholar] [CrossRef] [PubMed]
- Rezaie, J.; Akbari, A.; Rahbarghazi, R. Inhibition of extracellular vesicle biogenesis in tumor cells: A possible way to reduce tumorigenesis. Cell Biochem. Funct. 2022, 40, 248–262. [Google Scholar] [CrossRef]
- Boucheix, C.; Rubinstein, E. Tetraspanins. Cell. Mol. Life Sci. 2001, 58, 1189–1205. [Google Scholar] [CrossRef]
- He, C.; Zheng, S.; Luo, Y.; Wang, B. Exosome Theranostics: Biology and Translational Medicine. Theranostics 2018, 8, 237–255. [Google Scholar] [CrossRef]
- He, M.; Crow, J.; Roth, M.; Zeng, Y.; Godwin, A.K. Integrated immunoisolation and protein analysis of circulating exosomes using microfluidic technology. Lab Chip 2014, 14, 3773–3780. [Google Scholar] [CrossRef]
- Nikishin, I.; Dulimov, R.; Skryabin, G.; Galetsky, S.; Tchevkina, E.; Bagrov, D. ScanEV—A neural network-based tool for the automated detection of extracellular vesicles in TEM images. Micron 2021, 145, 103044. [Google Scholar] [CrossRef]
- Kahlert, C.; Kalluri, R. Exosomes in tumor microenvironment influence cancer progression and metastasis. J. Mol. Med. 2013, 91, 431–437. [Google Scholar] [CrossRef]
- Wang, X.; Huang, J.; Chen, W.; Li, G.; Li, Z.; Lei, J. The updated role of exosomal proteins in the diagnosis, prognosis, and treatment of cancer. Exp. Mol. Med. 2022, 54, 1390–1400. [Google Scholar] [CrossRef]
- Hoshino, A.; Kim, H.S.; Bojmar, L.; Gyan, K.E.; Cioffi, M.; Hernandez, J.; Zambirinis, C.P.; Rodrigues, G.; Molina, H.; Heissel, S.; et al. Extracellular Vesicle and Particle Biomarkers Define Multiple Human Cancers. Cell 2020, 182, 1044–1061. [Google Scholar] [CrossRef]
- Risha, Y.; Minic, Z.; Ghobadloo, S.M.; Berezovski, M.V. The proteomic analysis of breast cell line exosomes reveals disease patterns and potential biomarkers. Sci. Rep. 2020, 10, 13572. [Google Scholar] [CrossRef]
- Haraszti, R.A.; Didiot, M.C.; Sapp, E.; Leszyk, J.; Shaffer, S.A.; Rockwell, H.E.; Gao, F.; Narain, N.R.; DiFiglia, M.; Kiebish, M.A.; et al. High-resolution proteomic and lipidomic analysis of exosomes and microvesicles from different cell sources. J. Extracell. Vesicles 2016, 5, 32570. [Google Scholar] [CrossRef] [PubMed]
- Zaborowski, M.P.; Balaj, L.; Breakefield, X.O.; Lai, C.P. Extracellular Vesicles: Composition, Biological Relevance, and Methods of Study. Bioscience 2015, 65, 783–797. [Google Scholar] [CrossRef] [PubMed]
- Yang, B.; Chen, Y.; Shi, J. Exosome Biochemistry and Advanced Nanotechnology for Next-Generation Theranostic Platforms. Adv. Mater. 2019, 31, e1802896. [Google Scholar] [CrossRef] [PubMed]
- Yu, D.; Li, Y.; Wang, M.; Gu, J.; Xu, W.; Cai, H.; Fang, X.; Zhang, X. Exosomes as a new frontier of cancer liquid biopsy. Mol. Cancer 2022, 21, 56. [Google Scholar] [CrossRef] [PubMed]
- Hsu, M.T.; Wang, Y.K.; Tseng, Y.J. Exosomal Proteins and Lipids as Potential Biomarkers for Lung Cancer Diagnosis, Prognosis, and Treatment. Cancers 2022, 14, 732. [Google Scholar] [CrossRef]
- Lee, Y.R.; Kim, G.; Tak, W.Y.; Jang, S.Y.; Kweon, Y.O.; Park, J.G.; Lee, H.W.; Han, Y.S.; Chun, J.M.; Park, S.Y.; et al. Circulating exosomal noncoding RNAs as prognostic biomarkers in human hepatocellular carcinoma. Int. J. Cancer 2019, 144, 1444–1452. [Google Scholar] [CrossRef]
- Zhu, L.; Sun, H.T.; Wang, S.; Huang, S.L.; Zheng, Y.; Wang, C.Q.; Hu, B.Y.; Qin, W.; Zou, T.T.; Fu, Y.; et al. Isolation and characterization of exosomes for cancer research. J. Hematol. Oncol. 2020, 13, 152. [Google Scholar] [CrossRef]
- Liu, Y.; Zhou, Z.; Wang, F.; Kewes, G.; Wen, S.; Burger, S.; Ebrahimi Wakiani, M.; Xi, P.; Yang, J.; Yang, X.; et al. Axial localization and tracking of self-interference nanoparticles by lateral point spread functions. Nat. Commun. 2021, 12, 2019. [Google Scholar] [CrossRef] [PubMed]
- Wu, H.J.; Huang, C.L.; Wang, L.W.; Li, Q.H.; Li, Y.J.; Zhang, L.H.; Zhu, D.W. Folate-targeted co-delivery polymersomes for efficient photo-chemo-antiangiogenic therapy against breast cancer and in vivo evaluation via OCTA_NIRF dual-modal imaging-3. Chin. Chem. Lett. 2022, 33, 5035–5041. [Google Scholar] [CrossRef]
- Filipe, V.; Hawe, A.; Jiskoot, W. Critical evaluation of Nanoparticle Tracking Analysis (NTA) by NanoSight for the measurement of nanoparticles and protein aggregates. Pharm. Res. 2010, 27, 796–810. [Google Scholar] [CrossRef] [PubMed]
- Libregts, S.; Arkesteijn, G.J.A.; Németh, A.; Nolte-'t Hoen, E.N.M.; Wauben, M.H.M. Flow cytometric analysis of extracellular vesicle subsets in plasma: Impact of swarm by particles of non-interest. J. Thromb. Haemost. 2018, 16, 1423–1436. [Google Scholar] [CrossRef] [PubMed]
- Arraud, N.; Linares, R.; Tan, S.; Gounou, C.; Pasquet, J.M.; Mornet, S.; Brisson, A.R. Extracellular vesicles from blood plasma: Determination of their morphology, size, phenotype and concentration. J. Thromb. Haemost. 2014, 12, 614–627. [Google Scholar] [CrossRef] [PubMed]
- Lai, J.J.; Chau, Z.L.; Chen, S.Y.; Hill, J.J.; Korpany, K.V.; Liang, N.W.; Lin, L.H.; Lin, Y.H.; Liu, J.K.; Liu, Y.C.; et al. Exosome Processing and Characterization Approaches for Research and Technology Development. Adv. Sci. 2022, 9, e2103222. [Google Scholar] [CrossRef]
- Mashouri, L.; Yousefi, H.; Aref, A.R.; Ahadi, A.M.; Molaei, F.; Alahari, S.K. Exosomes: Composition, biogenesis, and mechanisms in cancer metastasis and drug resistance. Mol. Cancer 2019, 18, 75. [Google Scholar] [CrossRef]
- Dai, J.; Su, Y.; Zhong, S.; Cong, L.; Liu, B.; Yang, J.; Tao, Y.; He, Z.; Chen, C.; Jiang, Y. Exosomes: Key players in cancer and potential therapeutic strategy. Signal Transduct. Target. Ther. 2020, 5, 145. [Google Scholar] [CrossRef]
- Jiang, C.; Zhang, N.; Hu, X.; Wang, H. Tumor-associated exosomes promote lung cancer metastasis through multiple mechanisms. Mol. Cancer 2021, 20, 117. [Google Scholar] [CrossRef]
- Zhao, S.; Mi, Y.; Guan, B.; Zheng, B.; Wei, P.; Gu, Y.; Zhang, Z.; Cai, S.; Xu, Y.; Li, X.; et al. Tumor-derived exosomal miR-934 induces macrophage M2 polarization to promote liver metastasis of colorectal cancer. J. Hematol. Oncol. 2020, 13, 156. [Google Scholar] [CrossRef]
- Zhang, L.; Yu, D. Exosomes in cancer development, metastasis, and immunity. Biochim. Biophys. (BBA) Acta Rev. Cancer 2019, 1871, 455–468. [Google Scholar] [CrossRef] [PubMed]
- Hartjes, T.A.; Mytnyk, S.; Jenster, G.W.; van Steijn, V.; van Royen, M.E. Extracellular Vesicle Quantification and Characterization: Common Methods and Emerging Approaches. Bioengineering 2019, 6, 7. [Google Scholar] [CrossRef] [PubMed]
- Maas, S.L.; De Vrij, J.; Broekman, M.L. Quantification and size-profiling of extracellular vesicles using tunable resistive pulse sensing. J. Vis. Exp. 2014, 92, e51623. [Google Scholar] [CrossRef]
- Maas, S.L.; Broekman, M.L.; de Vrij, J. Tunable Resistive Pulse Sensing for the Characterization of Extracellular Vesicles. Methods Mol. Biol. 2017, 1545, 21–33. [Google Scholar] [CrossRef] [PubMed]
- Durak-Kozica, M.; Baster, Z.; Kubat, K.; Stępień, E. 3D visualization of extracellular vesicle uptake by endothelial cells. Cell. Mol. Biol. Lett. 2018, 23, 57. [Google Scholar] [CrossRef] [PubMed]
- Vogel, R.; Pal, A.K.; Jambhrunkar, S.; Patel, P.; Thakur, S.S.; Reátegui, E.; Parekh, H.S.; Saá, P.; Stassinopoulos, A.; Broom, M.F. High-Resolution Single Particle Zeta Potential Characterisation of Biological Nanoparticles using Tunable Resistive Pulse Sensing. Sci. Rep. 2017, 7, 17479. [Google Scholar] [CrossRef] [PubMed]
- Malenica, M.; Vukomanović, M.; Kurtjak, M.; Masciotti, V.; Dal Zilio, S.; Greco, S.; Lazzarino, M.; Krušić, V.; Perčić, M.; Jelovica Badovinac, I.; et al. Perspectives of Microscopy Methods for Morphology Characterisation of Extracellular Vesicles from Human Biofluids. Biomedicines 2021, 9, 603. [Google Scholar] [CrossRef]
- McNamara, R.P.; Zhou, Y.; Eason, A.B.; Landis, J.T.; Chambers, M.G.; Willcox, S.; Peterson, T.A.; Schouest, B.; Maness, N.J.; MacLean, A.G.; et al. Imaging of surface microdomains on individual extracellular vesicles in 3-D. J. Extracell. Vesicles 2022, 11, e12191. [Google Scholar] [CrossRef]
- Fakhredini, F.; Mansouri, E.; Mard, S.A.; Valizadeh Gorji, A.; Rashno, M.; Orazizadeh, M. Effects of Exosomes Derived from Kidney Tubular Cells on Diabetic Nephropathy in Rats. Cell J. 2022, 24, 28–35. [Google Scholar] [CrossRef]
- Conde-Vancells, J.; Rodriguez-Suarez, E.; Embade, N.; Gil, D.; Matthiesen, R.; Valle, M.; Elortza, F.; Lu, S.C.; Mato, J.M.; Falcon-Perez, J.M. Characterization and comprehensive proteome profiling of exosomes secreted by hepatocytes. J. Proteome Res. 2008, 7, 5157–5166. [Google Scholar] [CrossRef]
- Jeong, D.; Kim, M.J.; Park, Y.; Chung, J.; Kweon, H.S.; Kang, N.G.; Hwang, S.J.; Youn, S.H.; Hwang, B.K.; Kim, D. Visualizing extracellular vesicle biogenesis in gram-positive bacteria using super-resolution microscopy. BMC Biol. 2022, 20, 270. [Google Scholar] [CrossRef] [PubMed]
- Zabeo, D.; Cvjetkovic, A.; Lässer, C.; Schorb, M.; Lötvall, J.; Höög, J.L. Exosomes purified from a single cell type have diverse morphology. J. Extracell. Vesicles 2017, 6, 1329476. [Google Scholar] [CrossRef] [PubMed]
- Gardiner, C.; Di Vizio, D.; Sahoo, S.; Théry, C.; Witwer, K.W.; Wauben, M.; Hill, A.F. Techniques used for the isolation and characterization of extracellular vesicles: Results of a worldwide survey. J. Extracell. Vesicles 2016, 5, 32945. [Google Scholar] [CrossRef] [PubMed]
- Issman, L.; Brenner, B.; Talmon, Y.; Aharon, A. Cryogenic transmission electron microscopy nanostructural study of shed microparticles. PLoS ONE 2013, 8, e83680. [Google Scholar] [CrossRef] [PubMed]
- Jung, M.K.; Mun, J.Y. Sample Preparation and Imaging of Exosomes by Transmission Electron Microscopy. J. Vis. Exp. 2018, 131, e56482. [Google Scholar] [CrossRef]
- Božič, D.; Hočevar, M.; Kisovec, M.; Pajnič, M.; Pađen, L.; Jeran, M.; Bedina Zavec, A.; Podobnik, M.; Kogej, K.; Iglič, A.; et al. Stability of Erythrocyte-Derived Nanovesicles Assessed by Light Scattering and Electron Microscopy. Int. J. Mol. Sci. 2021, 22, 12772. [Google Scholar] [CrossRef] [PubMed]
- Sokolova, V.; Ludwig, A.K.; Hornung, S.; Rotan, O.; Horn, P.A.; Epple, M.; Giebel, B. Characterisation of exosomes derived from human cells by nanoparticle tracking analysis and scanning electron microscopy. Colloids Surf. B Biointerfaces 2011, 87, 146–150. [Google Scholar] [CrossRef]
- Cizmar, P.; Yuana, Y. Detection and Characterization of Extracellular Vesicles by Transmission and Cryo-Transmission Electron Microscopy. Methods Mol. Biol. 2017, 1660, 221–232. [Google Scholar] [CrossRef]
- Liu, Z.; Xue, H.; Chen, Q.; Yang, G. A method for extraction of exosomes from breast tumour cells and characterisation by transmission electron microscopy. J. Microsc. 2023, 292, 117–122. [Google Scholar] [CrossRef]
- Park, Y.H.; Shin, H.W.; Jung, A.R.; Kwon, O.S.; Choi, Y.J.; Park, J.; Lee, J.Y. Prostate-specific extracellular vesicles as a novel biomarker in human prostate cancer. Sci. Rep. 2016, 6, 30386. [Google Scholar] [CrossRef]
- Kurtjak, M.; Kereïche, S.; Klepac, D.; Križan, H.; Perčić, M.; Krušić Alić, V.; Lavrin, T.; Lenassi, M.; Wechtersbach, K.; Kojc, N.; et al. Unveiling the Native Morphology of Extracellular Vesicles from Human Cerebrospinal Fluid by Atomic Force and Cryogenic Electron Microscopy. Biomedicines 2022, 10, 1251. [Google Scholar] [CrossRef] [PubMed]
- Stetefeld, J.; McKenna, S.A.; Patel, T.R. Dynamic light scattering: A practical guide and applications in biomedical sciences. Biophys. Rev. 2016, 8, 409–427. [Google Scholar] [CrossRef] [PubMed]
- Palmieri, V.; Lucchetti, D.; Gatto, I.; Maiorana, A.; Marcantoni, M.; Maulucci, G.; Papi, M.; Pola, R.; De Spirito, M.; Sgambato, A. Dynamic light scattering for the characterization and counting of extracellular vesicles: A powerful noninvasive tool. J. Nanopart. Res. 2014, 16, 2583. [Google Scholar] [CrossRef]
- Perpetuo, L.; Ferreira, R.; Thongboonkerd, V.; Guedes, S.; Amado, F.; Vitorino, R. Urinary exosomes: Diagnostic impact with a bioinformatic approach. Adv. Clin. Chem. 2022, 111, 69–99. [Google Scholar] [CrossRef] [PubMed]
- Gercel-Taylor, C.; Atay, S.; Tullis, R.H.; Kesimer, M.; Taylor, D.D. Nanoparticle analysis of circulating cell-derived vesicles in ovarian cancer patients. Anal. Biochem. 2012, 428, 44–53. [Google Scholar] [CrossRef] [PubMed]
- Tajik, T.; Baghaei, K.; Moghadam, V.E.; Farrokhi, N.; Salami, S.A. Extracellular vesicles of cannabis with high CBD content induce anticancer signaling in human hepatocellular carcinoma. Biomed. Pharmacother. 2022, 152, 113209. [Google Scholar] [CrossRef]
- Hassan, P.A.; Rana, S.; Verma, G. Making sense of Brownian motion: Colloid characterization by dynamic light scattering. Langmuir 2015, 31, 3–12. [Google Scholar] [CrossRef]
- Lawrie, A.S.; Albanyan, A.; Cardigan, R.A.; Mackie, I.J.; Harrison, P. Microparticle sizing by dynamic light scattering in fresh-frozen plasma. Vox Sang. 2009, 96, 206–212. [Google Scholar] [CrossRef]
- Szatanek, R.; Baj-Krzyworzeka, M.; Zimoch, J.; Lekka, M.; Siedlar, M.; Baran, J. The Methods of Choice for Extracellular Vesicles (EVs) Characterization. Int. J. Mol. Sci. 2017, 18, 1153. [Google Scholar] [CrossRef]
- Cho, S.; Yi, J.; Kwon, Y.; Kang, H.; Han, C.; Park, J. Multifluorescence Single Extracellular Vesicle Analysis by Time-Sequential Illumination and Tracking. ACS Nano 2021, 15, 11753–11761. [Google Scholar] [CrossRef]
- Vestad, B.; Llorente, A.; Neurauter, A.; Phuyal, S.; Kierulf, B.; Kierulf, P.; Skotland, T.; Sandvig, K.; Haug, K.B.F.; Øvstebø, R. Size and concentration analyses of extracellular vesicles by nanoparticle tracking analysis: A variation study. J. Extracell. Vesicles 2017, 6, 1344087. [Google Scholar] [CrossRef] [PubMed]
- Dragovic, R.A.; Gardiner, C.; Brooks, A.S.; Tannetta, D.S.; Ferguson, D.J.; Hole, P.; Carr, B.; Redman, C.W.; Harris, A.L.; Dobson, P.J.; et al. Sizing and phenotyping of cellular vesicles using Nanoparticle Tracking Analysis. Nanomed. Nanotechnol. Biol. Med. 2011, 7, 780–788. [Google Scholar] [CrossRef] [PubMed]
- Gardiner, C.; Shaw, M.; Hole, P.; Smith, J.; Tannetta, D.; Redman, C.W.; Sargent, I.L. Measurement of refractive index by nanoparticle tracking analysis reveals heterogeneity in extracellular vesicles. J. Extracell. Vesicles 2014, 3, 25361. [Google Scholar] [CrossRef]
- Saari, H.; Lisitsyna, E.; Rautaniemi, K.; Rojalin, T.; Niemi, L.; Nivaro, O.; Laaksonen, T.; Yliperttula, M.; Vuorimaa-Laukkanen, E. FLIM reveals alternative EV-mediated cellular up-take pathways of paclitaxel. J. Control. Release 2018, 284, 133–143. [Google Scholar] [CrossRef]
- Shao, H.; Chung, J.; Balaj, L.; Charest, A.; Bigner, D.D.; Carter, B.S.; Hochberg, F.H.; Breakefield, X.O.; Weissleder, R.; Lee, H. Protein typing of circulating microvesicles allows real-time monitoring of glioblastoma therapy. Nat. Med. 2012, 18, 1835–1840. [Google Scholar] [CrossRef] [PubMed]
- van der Pol, E.; Coumans, F.A.; Grootemaat, A.E.; Gardiner, C.; Sargent, I.L.; Harrison, P.; Sturk, A.; van Leeuwen, T.G.; Nieuwland, R. Particle size distribution of exosomes and microvesicles determined by transmission electron microscopy, flow cytometry, nanoparticle tracking analysis, and resistive pulse sensing. J. Thromb. Haemost. 2014, 12, 1182–1192. [Google Scholar] [CrossRef]
- Hu, Y.; Tian, Y.; Di, H.; Xue, C.; Zheng, Y.; Hu, B.; Lin, Q.; Yan, X. Noninvasive Diagnosis of Nasopharyngeal Carcinoma Based on Phenotypic Profiling of Viral and Tumor Markers on Plasma Extracellular Vesicles. Anal. Chem. 2022, 94, 9740–9749. [Google Scholar] [CrossRef]
- Liu, H.S.; Tian, Y.; Xue, C.F.; Niu, Q.; Chen, C.; Yan, X.M. Analysis of extracellular vesicle DNA at the single-vesicle level by nano-flow cytometry. J. Extracell. Vesicles 2022, 11, e12206. [Google Scholar] [CrossRef]
- Lees, R.; Tempest, R.; Law, A.; Aubert, D.; Davies, O.G.; Williams, S.; Peake, N.; Peacock, B. Single Extracellular Vesicle Transmembrane Protein Characterization by Nano-Flow Cytometry. J. Vis. Exp. 2022, 185, e64020. [Google Scholar] [CrossRef]
- Ricklefs, F.L.; Maire, C.L.; Reimer, R.; Dührsen, L.; Kolbe, K.; Holz, M.; Schneider, E.; Rissiek, A.; Babayan, A.; Hille, C.; et al. Imaging flow cytometry facilitates multiparametric characterization of extracellular vesicles in malignant brain tumours. J. Extracell. Vesicles 2019, 8, 1588555. [Google Scholar] [CrossRef]
- Aibaidula, A.Z.; Fain, C.E.; Garcia, L.C.; Wier, A.; Bouchal, S.M.; Bauman, M.M.; Jung, M.Y.; Sarkaria, J.N.; Johnson, A.J.; Parney, I.F. Spectral flow cytometry identifies distinct nonneoplastic plasma extracellular vesicle phenotype in glioblastoma patients. Neuro-Oncol. Adv. 2023, 5, vdad082. [Google Scholar] [CrossRef]
- Betzig, E.; Patterson, G.H.; Sougrat, R.; Lindwasser, O.W.; Olenych, S.; Bonifacino, J.S.; Davidson, M.W.; Lippincott-Schwartz, J.; Hess, H.F. Imaging intracellular fluorescent proteins at nanometer resolution. Science 2006, 313, 1642–1645. [Google Scholar] [CrossRef] [PubMed]
- Rust, M.J.; Bates, M.; Zhuang, X. Sub-diffraction-limit imaging by stochastic optical reconstruction microscopy (STORM). Nat. Methods 2006, 3, 793–795. [Google Scholar] [CrossRef] [PubMed]
- van de Linde, S.; Löschberger, A.; Klein, T.; Heidbreder, M.; Wolter, S.; Heilemann, M.; Sauer, M. Direct stochastic optical reconstruction microscopy with standard fluorescent probes. Nat. Protoc. 2011, 6, 991–1009. [Google Scholar] [CrossRef] [PubMed]
- Jones, S.A.; Shim, S.H.; He, J.; Zhuang, X. Fast, three-dimensional super-resolution imaging of live cells. Nat. Methods 2011, 8, 499–508. [Google Scholar] [CrossRef] [PubMed]
- Zhu, L.; Zhang, W.; Elnatan, D.; Huang, B. Faster STORM using compressed sensing. Nat. Methods 2012, 9, 721–723. [Google Scholar] [CrossRef]
- Chen, B.; Gong, W.; Yang, Z.; Pan, W.; Verwilst, P.; Shin, J.; Yan, W.; Liu, L.; Qu, J.; Kim, J.S. STORM imaging of mitochondrial dynamics using a vicinal-dithiol-proteins-targeted probe. Biomaterials 2020, 243, 119938. [Google Scholar] [CrossRef]
- Ouyang, W.; Aristov, A.; Lelek, M.; Hao, X.; Zimmer, C. Deep learning massively accelerates super-resolution localization microscopy. Nat. Biotechnol. 2018, 36, 460–468. [Google Scholar] [CrossRef]
- Helmerich, D.A.; Beliu, G.; Taban, D.; Meub, M.; Streit, M.; Kuhlemann, A.; Doose, S.; Sauer, M. Photoswitching fingerprint analysis bypasses the 10-nm resolution barrier. Nat. Methods 2022, 19, 986–994. [Google Scholar] [CrossRef]
- Dechantsreiter, S.; Ambrose, A.R.; Worboys, J.D.; Lim, J.M.E.; Liu, S.; Shah, R.; Montero, M.A.; Quinn, A.M.; Hussell, T.; Tannahill, G.M.; et al. Heterogeneity in extracellular vesicle secretion by single human macrophages revealed by super-resolution microscopy. J. Extracell. Vesicles 2022, 11, e12215. [Google Scholar] [CrossRef]
- Chen, C.; Zong, S.; Wang, Z.; Lu, J.; Zhu, D.; Zhang, Y.; Cui, Y. Imaging and Intracellular Tracking of Cancer-Derived Exosomes Using Single-Molecule Localization-Based Super-Resolution Microscope. ACS Appl. Mater. Interfaces 2016, 8, 25825–25833. [Google Scholar] [CrossRef] [PubMed]
- Shim, S.H.; Xia, C.; Zhong, G.; Babcock, H.P.; Vaughan, J.C.; Huang, B.; Wang, X.; Xu, C.; Bi, G.Q.; Zhuang, X. Super-resolution fluorescence imaging of organelles in live cells with photoswitchable membrane probes. Proc. Natl. Acad. Sci. USA 2012, 109, 13978–13983. [Google Scholar] [CrossRef]
- Zong, S.; Zong, J.; Chen, C.; Jiang, X.; Zhang, Y.; Wang, Z.; Cui, Y. Single molecule localization imaging of exosomes using blinking silicon quantum dots. Nanotechnology 2018, 29, 065705. [Google Scholar] [CrossRef] [PubMed]
- Chen, C.; Zong, S.; Wang, Z.; Lu, J.; Zhu, D.; Zhang, Y.; Zhang, R.; Cui, Y. Visualization and intracellular dynamic tracking of exosomes and exosomal miRNAs using single molecule localization microscopy. Nanoscale 2018, 10, 5154–5162. [Google Scholar] [CrossRef]
- Mondal, A.; Ashiq, K.A.; Phulpagar, P.; Singh, D.K.; Shiras, A. Effective Visualization and Easy Tracking of Extracellular Vesicles in Glioma Cells. Biol. Proced. Online 2019, 21, 4. [Google Scholar] [CrossRef]
- Saftics, A.; Abuelreich, S.; Romano, E.; Ghaeli, I.; Jiang, N.; Spanos, M.; Lennon, K.M.; Singh, G.; Das, S.; Van Keuren-Jensen, K.; et al. Single Extracellular VEsicle Nanoscopy. J. Extracell. Vesicles 2023, 12, e12346. [Google Scholar] [CrossRef] [PubMed]
- Oleksiuk, O.; Abba, M.; Tezcan, K.C.; Schaufler, W.; Bestvater, F.; Patil, N.; Birk, U.; Hafner, M.; Altevogt, P.; Cremer, C.; et al. Single-Molecule Localization Microscopy allows for the analysis of cancer metastasis-specific miRNA distribution on the nanoscale. Oncotarget 2015, 6, 44745–44757. [Google Scholar] [CrossRef]
- Wei, J.; Zhang, S.; Yuan, J.; Wang, Z.; Zong, S.; Cui, Y. Nanoscale imaging of tumor cell exosomes by expansion single molecule localization microscopy (ExSMLM). Talanta 2023, 261, 124641. [Google Scholar] [CrossRef]
- Lennon, K.M.; Wakefield, D.L.; Maddox, A.L.; Brehove, M.S.; Willner, A.N.; Garcia-Mansfield, K.; Meechoovet, B.; Reiman, R.; Hutchins, E.; Miller, M.M.; et al. Single molecule characterization of individual extracellular vesicles from pancreatic cancer. J. Extracell. Vesicles 2019, 8, 1685634. [Google Scholar] [CrossRef]
- Wei, Y.X.; Han, J.H.; Shen, H.M.; Wang, Y.Y.; Qi, M.; Wang, L.; Li, J. Highly sensitive fluorescent detection of EDIL3 overexpressed exosomes for the diagnosis of triple-negative breast cancer. Nanotechnology 2022, 33, 425204. [Google Scholar] [CrossRef]
- Jungmann, R.; Avendaño, M.S.; Woehrstein, J.B.; Dai, M.; Shih, W.M.; Yin, P. Multiplexed 3D cellular super-resolution imaging with DNA-PAINT and Exchange-PAINT. Nat. Methods 2014, 11, 313–318. [Google Scholar] [CrossRef]
- Tholen, M.M.E.; Tas, R.P.; Wang, Y.; Albertazzi, L. Beyond DNA: New probes for PAINT super-resolution microscopy. Chem. Commun. 2023, 59, 8332–8342. [Google Scholar] [CrossRef] [PubMed]
- Chen, C.; Zong, S.; Liu, Y.; Wang, Z.; Zhang, Y.; Chen, B.; Cui, Y. Profiling of Exosomal Biomarkers for Accurate Cancer Identification: Combining DNA-PAINT with Machine- Learning-Based Classification. Small 2019, 15, e1901014. [Google Scholar] [CrossRef] [PubMed]
- Liu, D.A.; Tao, K.; Wu, B.; Yu, Z.; Szczepaniak, M.; Rames, M.; Yang, C.; Svitkina, T.; Zhu, Y.; Xu, F.; et al. A phosphoinositide switch mediates exocyst recruitment to multivesicular endosomes for exosome secretion. Nat. Commun. 2023, 14, 6883. [Google Scholar] [CrossRef] [PubMed]
- Auer, A.; Strauss, M.T.; Schlichthaerle, T.; Jungmann, R. Fast, Background-Free DNA-PAINT Imaging Using FRET-Based Probes. Nano Lett. 2017, 17, 6428–6434. [Google Scholar] [CrossRef] [PubMed]
- Zhu, M.; Zhang, L.; Jin, L.; Chen, J.; Zhang, Y.; Xu, Y. DNA-PAINT Imaging Accelerated by Machine Learning. Front. Chem. 2022, 10, 864701. [Google Scholar] [CrossRef] [PubMed]
- van Wee, R.; Filius, M.; Joo, C. Completing the canvas: Advances and challenges for DNA-PAINT super-resolution imaging. Trends Biochem. Sci. 2021, 46, 918–930. [Google Scholar] [CrossRef]
- McEvoy, A.L.; Greenfield, D.; Bates, M.; Liphardt, J. Q&A: Single-molecule localization microscopy for biological imaging. BMC Biol. 2010, 8, 106. [Google Scholar] [CrossRef]
- Nieves, D.J.; Gaus, K.; Baker, M.A.B. DNA-Based Super-Resolution Microscopy: DNA-PAINT. Genes 2018, 9, 621. [Google Scholar] [CrossRef]
- Strauss, S.; Jungmann, R. Up to 100-fold speed-up and multiplexing in optimized DNA-PAINT. Nat. Methods 2020, 17, 789–791. [Google Scholar] [CrossRef]
- Li, W.; Li, C.; Zhou, T.; Liu, X.; Liu, X.; Li, X.; Chen, D. Role of exosomal proteins in cancer diagnosis. Mol. Cancer 2017, 16, 145. [Google Scholar] [CrossRef] [PubMed]
- Bai, S.; Hou, W.; Yao, Y.; Meng, J.; Wei, Y.; Hu, F.; Hu, X.; Wu, J.; Zhang, N.; Xu, R.; et al. Exocyst controls exosome biogenesis via Rab11a. Mol. Ther. Nucleic Acids 2022, 27, 535–546. [Google Scholar] [CrossRef]
- Hell, S.W.; Wichmann, J. Breaking the diffraction resolution limit by stimulated emission: Stimulated-emission-depletion fluorescence microscopy. Opt. Lett. 1994, 19, 780–782. [Google Scholar] [CrossRef] [PubMed]
- Butkevich, A.N.; Mitronova, G.Y.; Sidenstein, S.C.; Klocke, J.L.; Kamin, D.; Meineke, D.N.; D'Este, E.; Kraemer, P.T.; Danzl, J.G.; Belov, V.N.; et al. Fluorescent Rhodamines and Fluorogenic Carbopyronines for Super-Resolution STED Microscopy in Living Cells. Angew. Chem. Int. Ed. 2016, 55, 3290–3294. [Google Scholar] [CrossRef]
- Pajk, S.; Majaron, H.; Novak, M.; Kokot, B.; Štrancar, J. New coumarin- and phenoxazine-based fluorescent probes for live-cell STED nanoscopy. Eur. Biophys. J. 2019, 48, 485–490. [Google Scholar] [CrossRef]
- Valcz, G.; Buzás, E.I.; Kittel, Á.; Krenács, T.; Visnovitz, T.; Spisák, S.; Török, G.; Homolya, L.; Zsigrai, S.; Kiszler, G.; et al. En bloc release of MVB-like small extracellular vesicle clusters by colorectal carcinoma cells. J. Extracell. Vesicles 2019, 8, 1596668. [Google Scholar] [CrossRef]
- Yang, X.; Yang, Z.; Wu, Z.; He, Y.; Shan, C.; Chai, P.; Ma, C.; Tian, M.; Teng, J.; Jin, D.; et al. Mitochondrial dynamics quantitatively revealed by STED nanoscopy with an enhanced squaraine variant probe. Nat. Commun. 2020, 11, 3699. [Google Scholar] [CrossRef]
- Alvelid, J.; Damenti, M.; Sgattoni, C.; Testa, I. Event-triggered STED imaging. Nat. Methods 2022, 19, 1268–1275. [Google Scholar] [CrossRef]
- Liu, Y.; Zhou, J.; Wen, S.; Wang, F.; Wu, H.; Chen, Q.; Zuo, C.; Jin, D. On-Chip Mirror Enhanced Multiphoton Upconversion Super-Resolution Microscopy. Nano Lett. 2023, 23, 5514–5519. [Google Scholar] [CrossRef]
- Liu, Y.; Wang, F.; Lu, H.; Fang, G.; Wen, S.; Chen, C.; Shan, X.; Xu, X.; Zhang, L.; Stenzel, M.; et al. Super-Resolution Mapping of Single Nanoparticles inside Tumor Spheroids. Small 2020, 16, e1905572. [Google Scholar] [CrossRef]
- Huang, G.; Liu, Y.; Wang, D.; Zhu, Y.; Wen, S.; Ruan, J.; Jin, D. Upconversion nanoparticles for super-resolution quantification of single small extracellular vesicles. eLight 2022, 2, 20. [Google Scholar] [CrossRef]
- Liu, Y.; Wen, S.; Wang, F.; Zuo, C.; Chen, C.; Zhou, J.; Jin, D. Population Control of Upconversion Energy Transfer for Stimulation Emission Depletion Nanoscopy. Adv. Sci. 2023, 10, e2205990. [Google Scholar] [CrossRef] [PubMed]
- Sezgin, E. Super-resolution optical microscopy for studying membrane structure and dynamics. J. Phys. Condens. Matter 2017, 29, 273001. [Google Scholar] [CrossRef]
- Choi, D.; Montermini, L.; Jeong, H.; Sharma, S.; Meehan, B.; Rak, J. Mapping Subpopulations of Cancer Cell-Derived Extracellular Vesicles and Particles by Nano-Flow Cytometry. ACS Nano 2019, 13, 10499–10511. [Google Scholar] [CrossRef] [PubMed]
- Gustafsson, M.G. Surpassing the lateral resolution limit by a factor of two using structured illumination microscopy. J. Microsc. 2000, 198, 82–87. [Google Scholar] [CrossRef] [PubMed]
- Gustafsson, M.G. Nonlinear structured-illumination microscopy: Wide-field fluorescence imaging with theoretically unlimited resolution. Proc. Natl. Acad. Sci. USA 2005, 102, 13081–13086. [Google Scholar] [CrossRef]
- Li, D.; Shao, L.; Chen, B.C.; Zhang, X.; Zhang, M.; Moses, B.; Milkie, D.E.; Beach, J.R.; Hammer, J.A., 3rd; Pasham, M.; et al. ADVANCED IMAGING. Extended-resolution structured illumination imaging of endocytic and cytoskeletal dynamics. Science 2015, 349, aab3500. [Google Scholar] [CrossRef] [PubMed]
- Boland, M.A.; Cohen, E.A.K.; Flaxman, S.R.; Neil, M.A.A. Improving axial resolution in Structured Illumination Microscopy using deep learning. Philos. Trans. Ser. A Math. Phys. Eng. Sci. 2021, 379, 20200298. [Google Scholar] [CrossRef]
- He, Y.; Yao, Y.; He, Y.; Huang, Z.; Luo, F.; Zhang, C.; Qi, D.; Jia, T.; Wang, Z.; Sun, Z.; et al. Surpassing the resolution limitation of structured illumination microscopy by an untrained neural network. Biomed. Opt. Express 2023, 14, 106–117. [Google Scholar] [CrossRef]
- Butola, A.; Acuna, S.; Hansen, D.H.; Agarwal, K. Scalable-resolution structured illumination microscopy. Opt. Express 2022, 30, 43752–43767. [Google Scholar] [CrossRef]
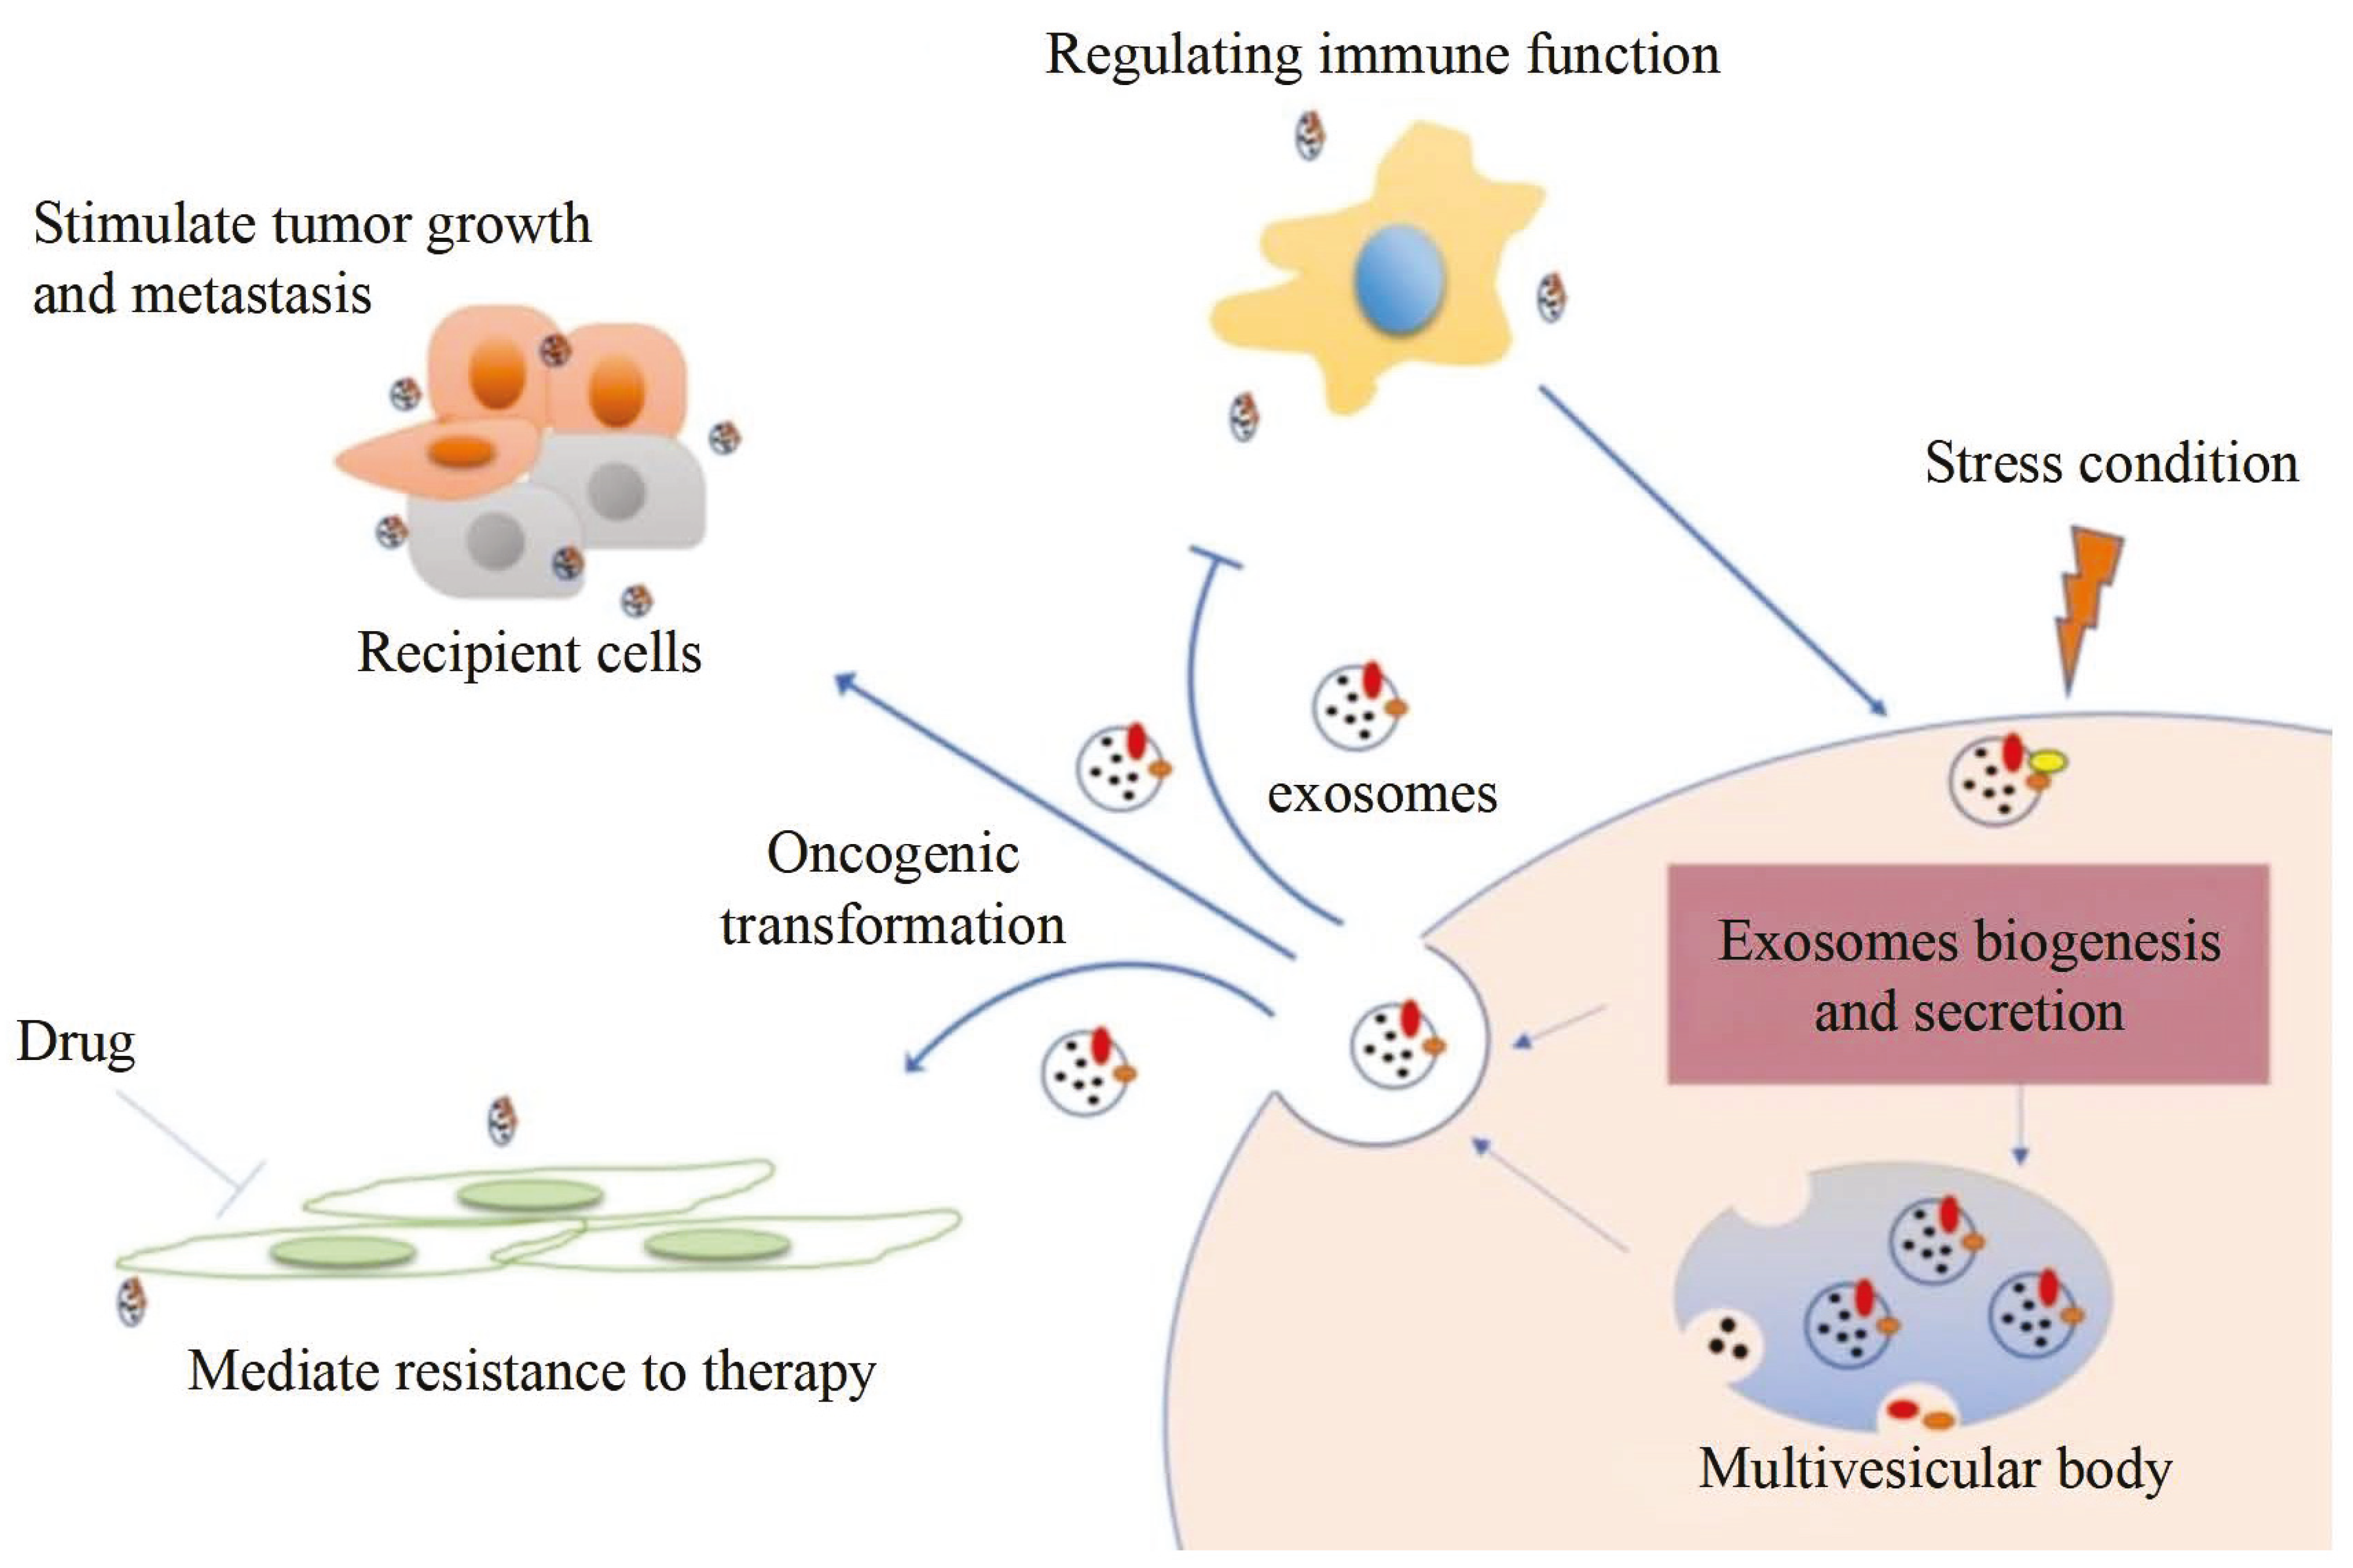
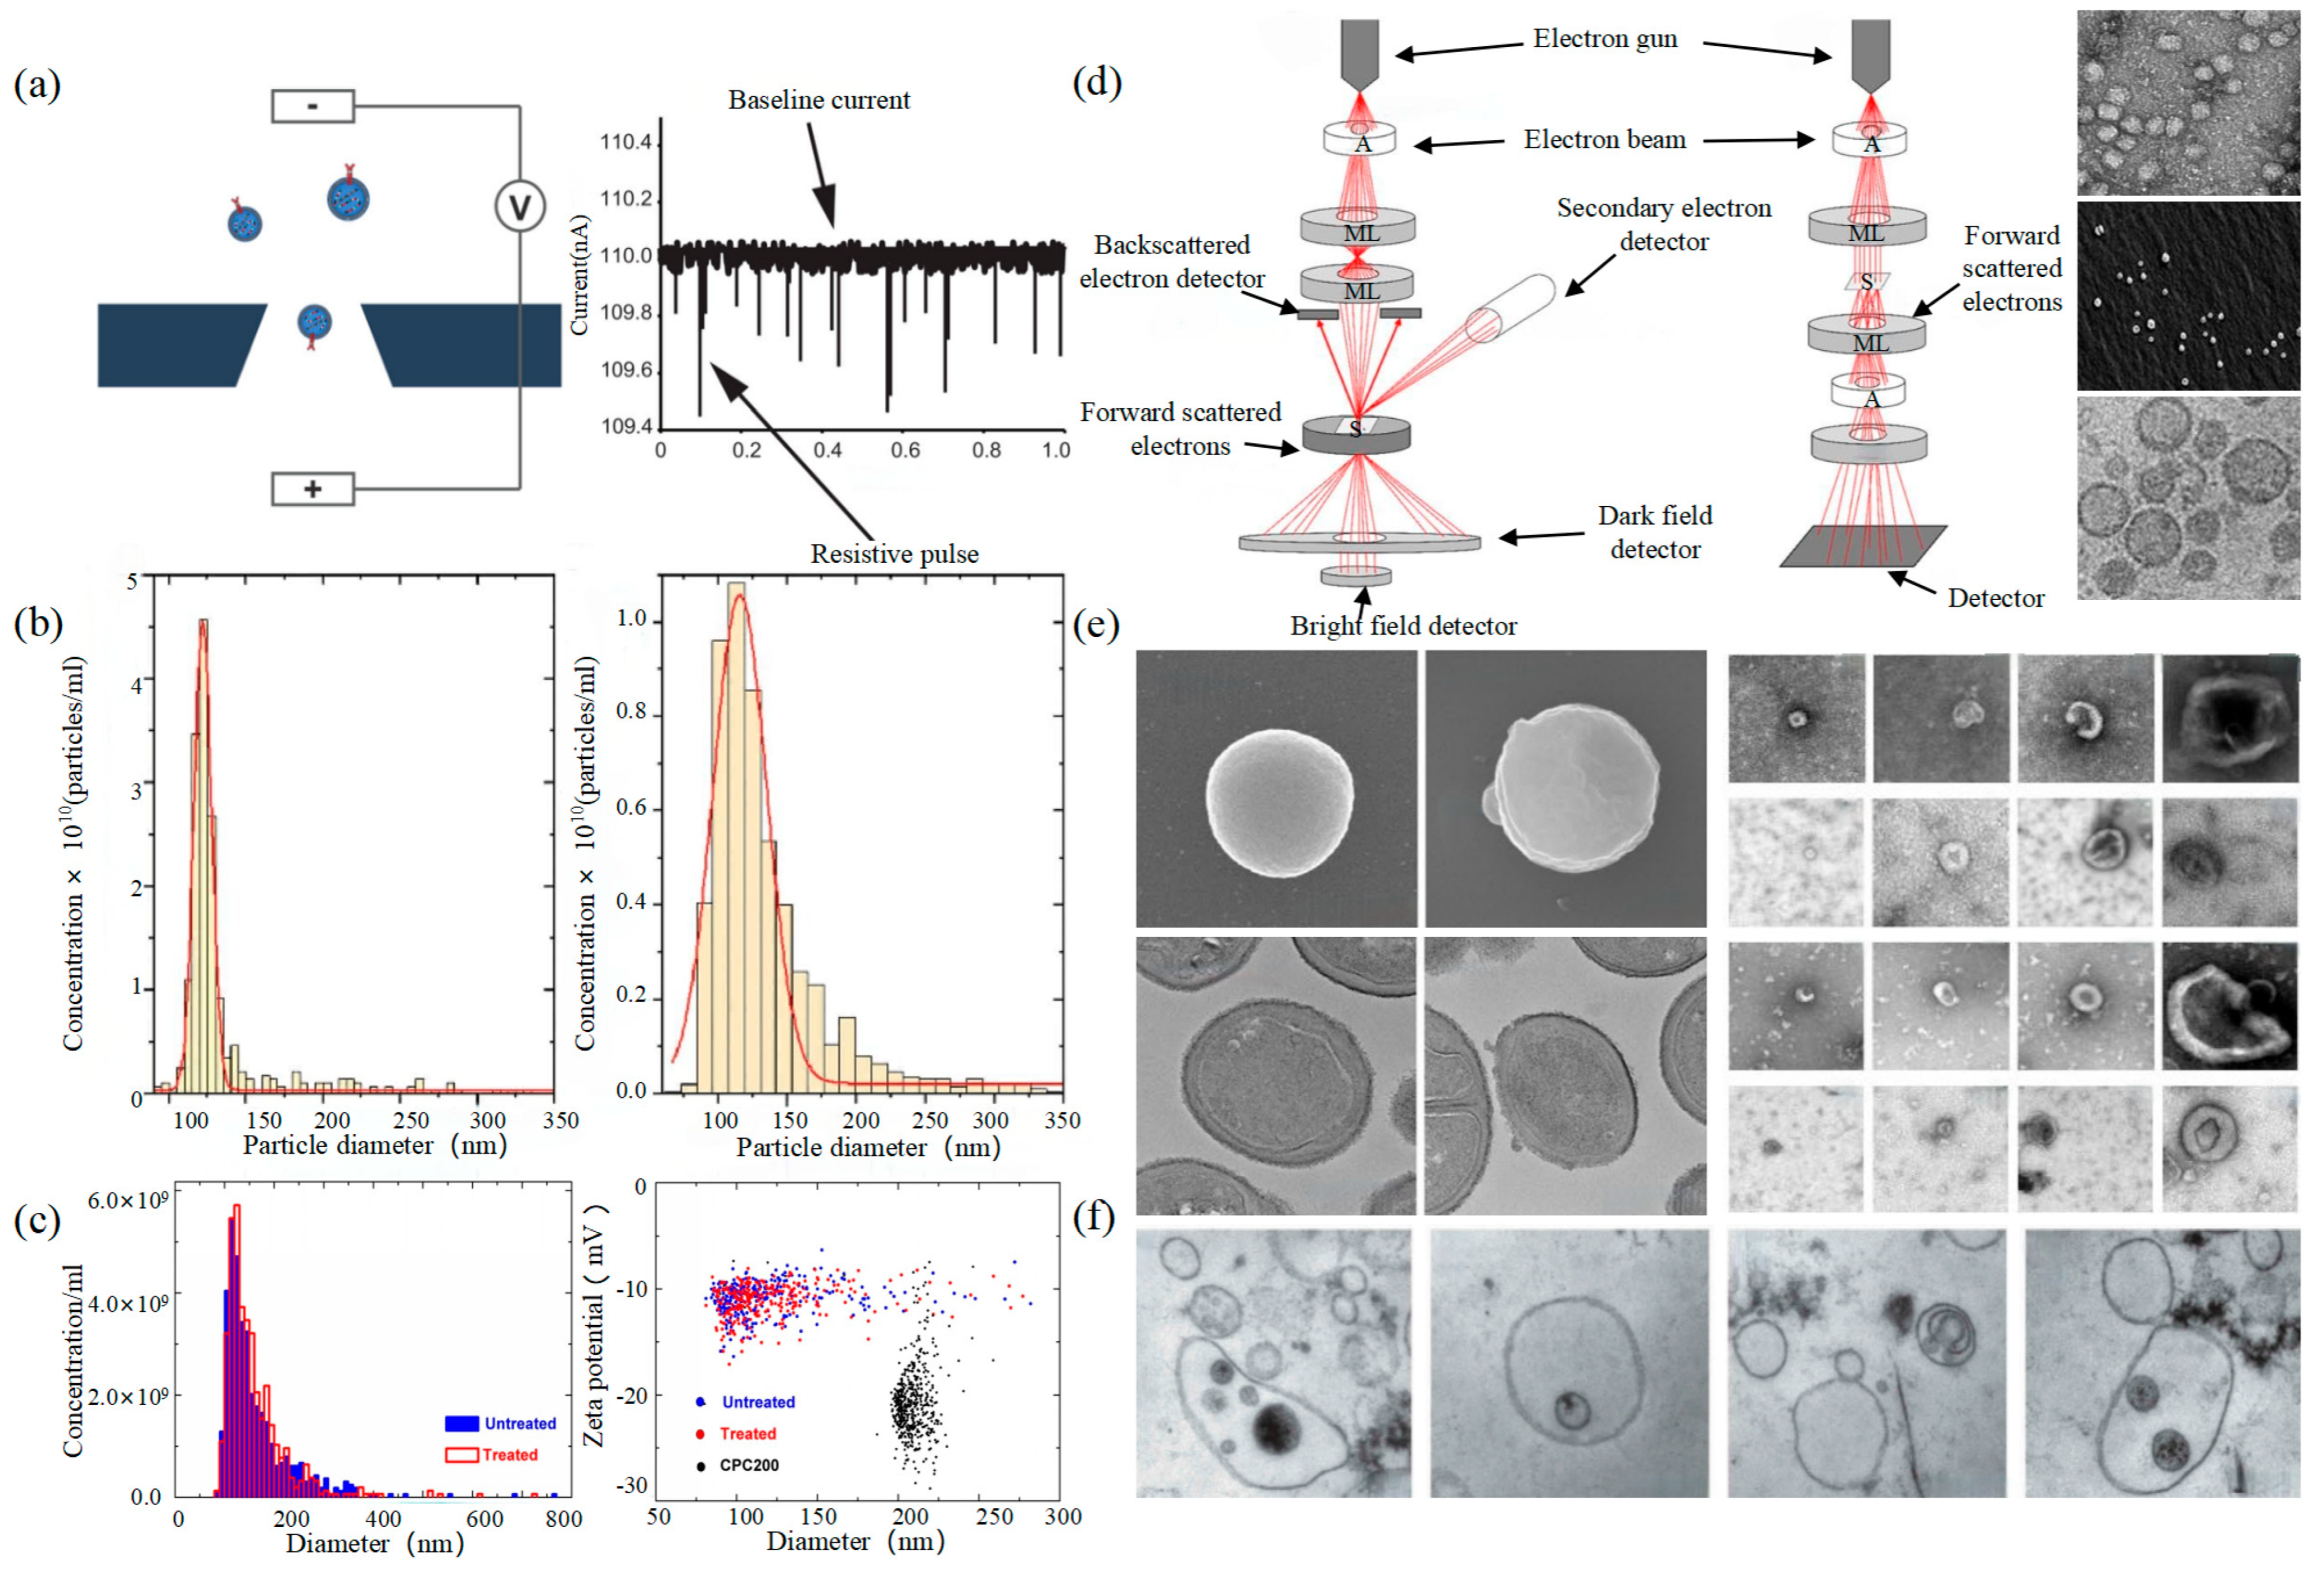

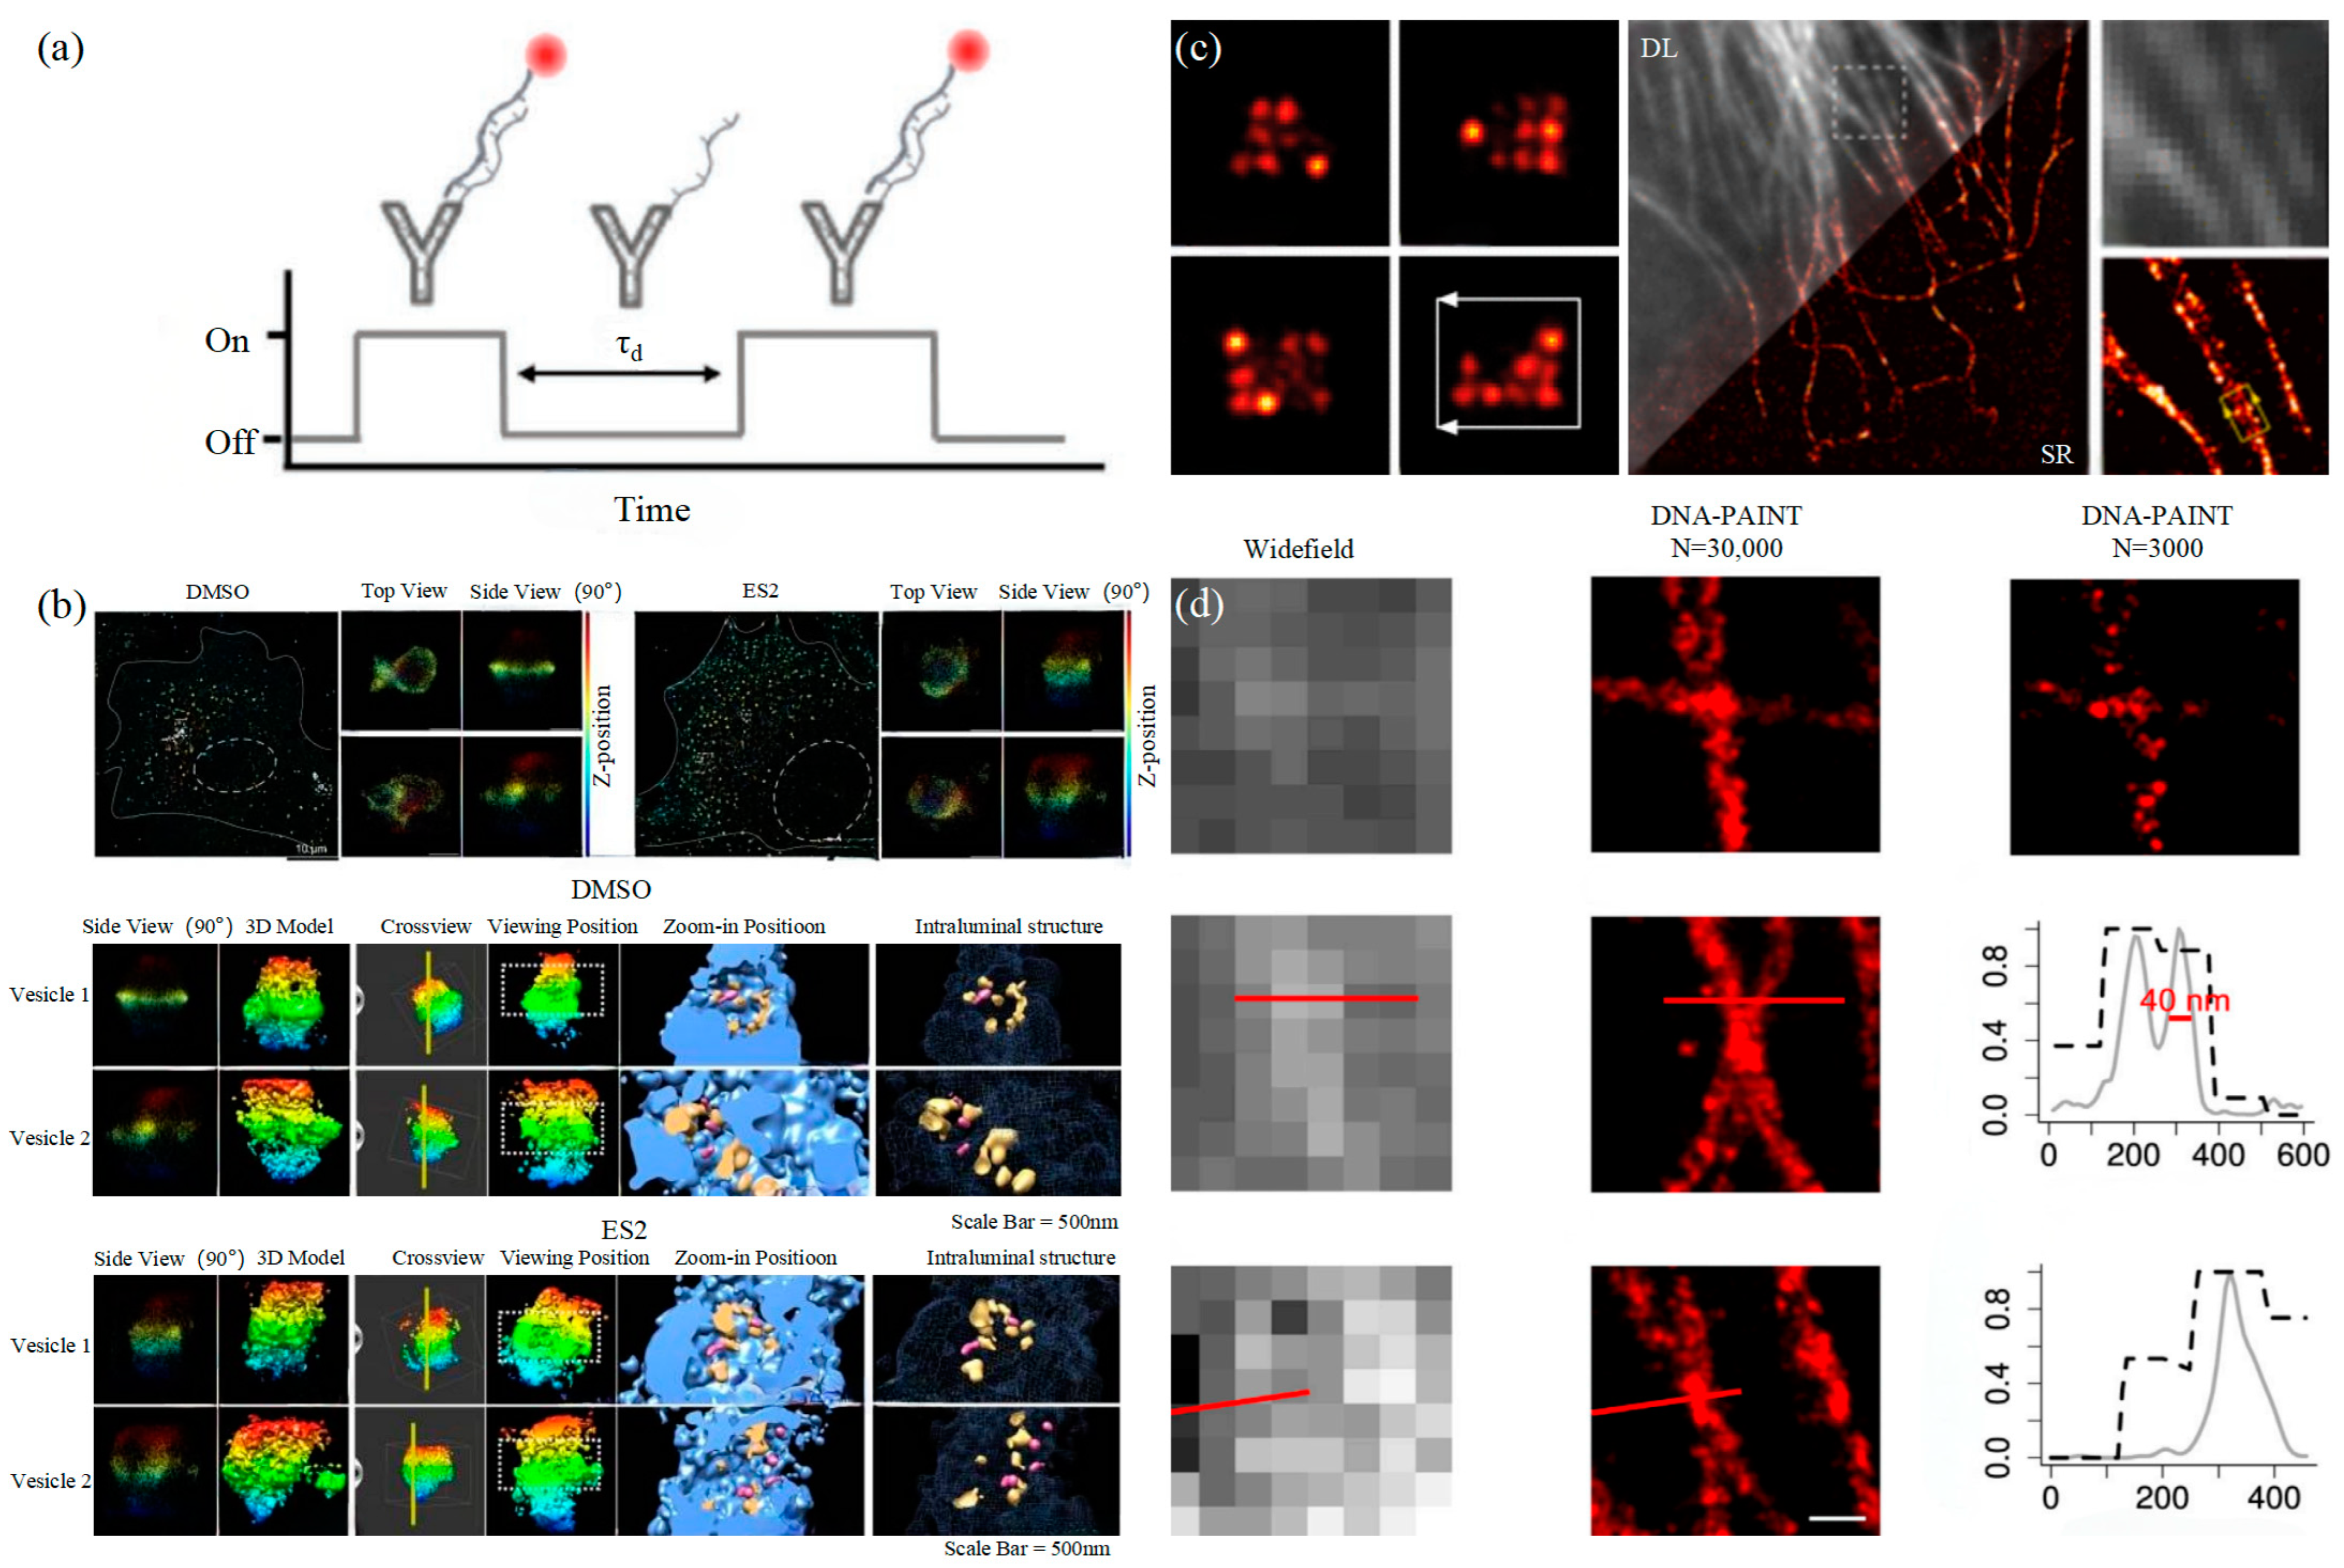
Disclaimer/Publisher’s Note: The statements, opinions and data contained in all publications are solely those of the individual author(s) and contributor(s) and not of MDPI and/or the editor(s). MDPI and/or the editor(s) disclaim responsibility for any injury to people or property resulting from any ideas, methods, instructions or products referred to in the content. |
© 2024 by the authors. Licensee MDPI, Basel, Switzerland. This article is an open access article distributed under the terms and conditions of the Creative Commons Attribution (CC BY) license (https://creativecommons.org/licenses/by/4.0/).