Improving the Resolution of Correlation Imaging via the Fluctuation Characteristics
Abstract
1. Introduction
2. The Resolution of a Correlation Imaging System
3. Enhance the Resolution via the Fluctuation Information
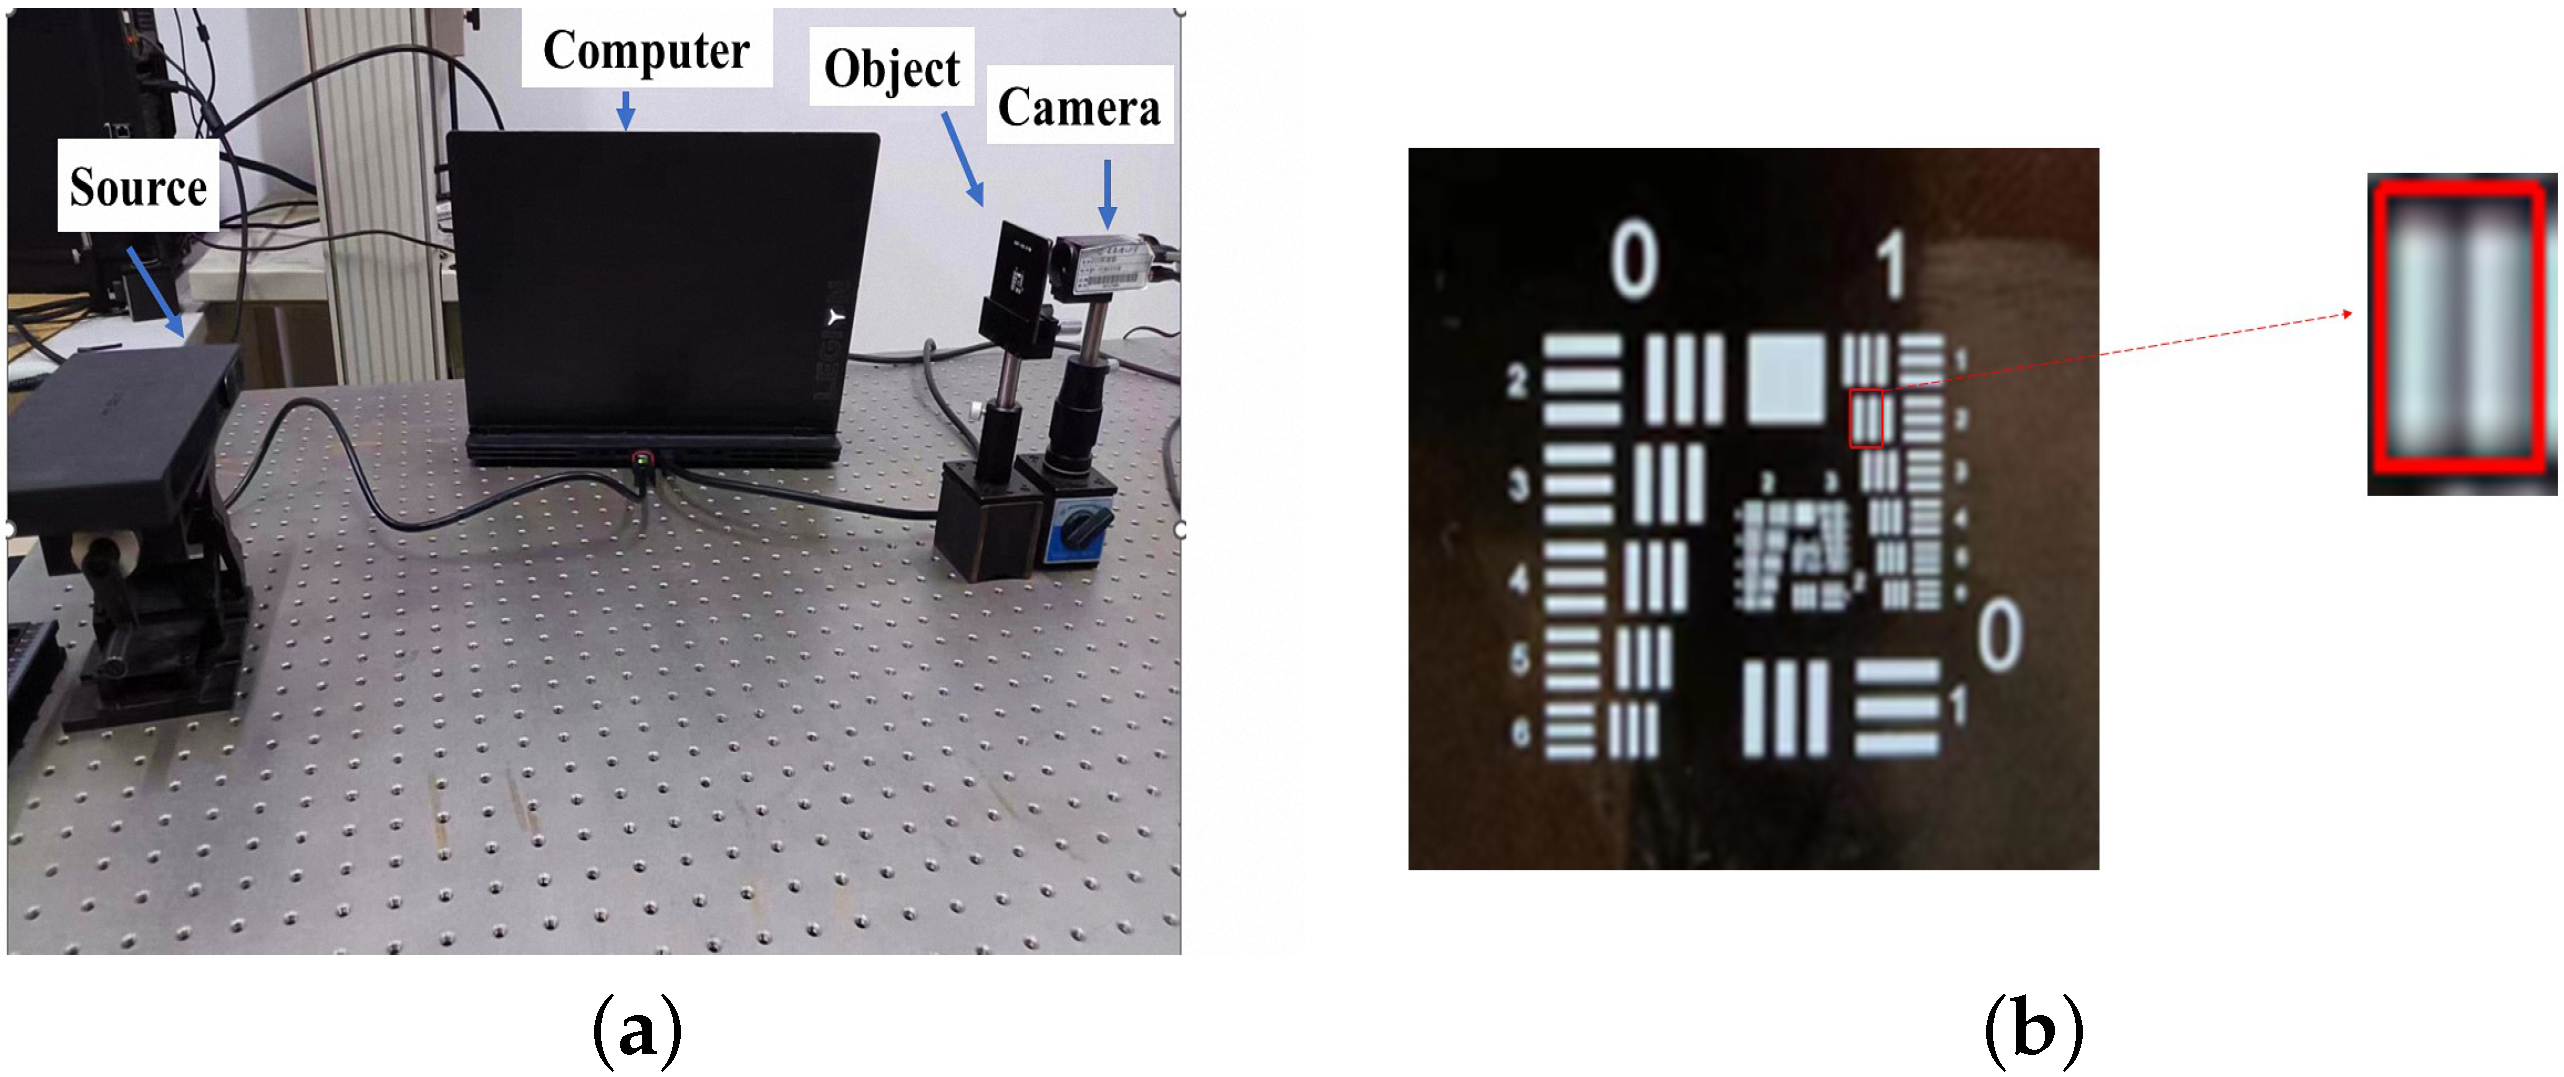
4. Experimental Results and Discussion
5. Conclusions
Author Contributions
Funding
Institutional Review Board Statement
Informed Consent Statement
Data Availability Statement
Conflicts of Interest
References
- Pittman, T.B.; Shih, Y.; Strekalov, D.; Sergienko, A.V. Optical imaging by means of two-photon quantum entanglement. Phys. Rev. A 1995, 52, R3429. [Google Scholar] [CrossRef] [PubMed]
- Bennink, R.S.; Bentley, S.J.; Boyd, R.W. “Two-photon” coincidence imaging with a classical source. Phys. Rev. Lett. 2002, 89, 113601. [Google Scholar] [CrossRef] [PubMed]
- Cheng, J.; Han, S. Incoherent coincidence imaging and its applicability in X-ray diffraction. Phys. Rev. Lett. 2004, 92, 093903. [Google Scholar] [CrossRef] [PubMed]
- Gatti, A.; Brambilla, E.; Bache, M.; Lugiato, L.A. Ghost imaging with thermal light: Comparing entanglement and classicalcorrelation. Phys. Rev. Lett. 2004, 93, 093602. [Google Scholar] [CrossRef] [PubMed]
- Ferri, F.; Magatti, D.; Gatti, A.; Bache, M.; Brambilla, E.; Lugiato, L.A. High-resolution ghost image and ghost diffraction experiments with thermal light. Phys. Rev. Lett. 2005, 94, 183602. [Google Scholar] [CrossRef] [PubMed]
- Cai, Y.; Zhu, S.Y. Ghost imaging with incoherent and partially coherent light radiation. Phys. Rev. E 2005, 71, 056607. [Google Scholar] [CrossRef] [PubMed]
- Gao, C.; Wang, X.; Gou, L.; Feng, Y.; Cai, H.; Wang, Z.; Yao, Z. Ghost imaging for an occluded object. Laser Phys. Lett. 2019, 16, 065202. [Google Scholar] [CrossRef]
- Gao, C.; Wang, X.; Wang, Z.; Li, Z.; Du, G.; Chang, F.; Yao, Z. Optimization of computational ghost imaging. Phys. Rev. A 2017, 96, 023838. [Google Scholar] [CrossRef]
- Cao, D.Z.; Xiong, J.; Wang, K. Geometrical optics in correlated imaging systems. Phys. Rev. A 2005, 71, 013801. [Google Scholar] [CrossRef]
- Valencia, A.; Scarcelli, G.; D’Angelo, M.; Shih, Y. Two-photon imaging with thermal light. Phys. Rev. Lett. 2005, 94, 063601. [Google Scholar] [CrossRef]
- Zhang, D.; Zhai, Y.H.; Wu, L.A.; Chen, X.H. Correlated two-photon imaging with true thermal light. Opt. Lett. 2005, 30, 2354–2356. [Google Scholar] [CrossRef] [PubMed]
- Li, L.Z.; Yao, X.R.; Liu, X.F.; Yu, W.K.; Zhai, G.J. Super-resolution ghost imaging via compressed sensing. Acta Phys. Sin. 2014, 62, 224201. [Google Scholar]
- Shapiro, J.H. Computational ghost imaging. Phys. Rev. A 2008, 78, 061802. [Google Scholar] [CrossRef]
- Sun, B.; Edgar, M.P.; Bowman, R.; Vittert, L.E.; Welsh, S.; Bowman, A.; Padgett, M.J. 3D computational imaging with single-pixel detectors. Science 2013, 340, 844–847. [Google Scholar] [CrossRef] [PubMed]
- Welsh, S.S.; Edgar, M.P.; Jonathan, P.; Sun, B.; Padgett, M.J. Multi-wavelength compressive computational ghost imaging. In Proceedings of the Emerging Digital Micromirror Device Based Systems and Applications V; SPIE: Bellingham, WA, USA, 2013; Volume 8618, pp. 158–163. [Google Scholar]
- Wang, Y.; Liu, Y.; Suo, J.; Situ, G.; Qiao, C.; Dai, Q. High speed computational ghost imaging via spatial sweeping. Sci. Rep. 2017, 7, 45325. [Google Scholar] [CrossRef]
- Bentley, S.J.; Boyd, R.W. Nonlinear optical lithography with ultra-high sub-Rayleigh resolution. Opt. Express 2004, 12, 5735–5740. [Google Scholar] [CrossRef]
- Meyers, R.; Deacon, K.S.; Shih, Y. Ghost-imaging experiment by measuring reflected photons. Phys. Rev. A 2008, 77, 041801. [Google Scholar] [CrossRef]
- Radwell, N.; Mitchell, K.J.; Gibson, G.M.; Edgar, M.P.; Bowman, R.; Padgett, M.J. Single-pixel infrared and visible microscope. Optica 2014, 1, 285–289. [Google Scholar] [CrossRef]
- Pelliccia, D.; Rack, A.; Scheel, M.; Cantelli, V.; Paganin, D.M. Experimental x-ray ghost imaging. Phys. Rev. Lett. 2016, 117, 113902. [Google Scholar] [CrossRef]
- Chen, X.H.; Kong, F.H.; Fu, Q.; Meng, S.Y.; Wu, L.A. Sub-Rayleigh resolution ghost imaging by spatial low-pass filtering. Opt. Lett. 2017, 42, 5290–5293. [Google Scholar] [CrossRef]
- Moreau, P.A.; Toninelli, E.; Morris, P.A.; Aspden, R.S.; Gregory, T.; Spalding, G.; Boyd, R.W.; Padgett, M.J. Resolution limits of quantum ghost imaging. Opt. Express 2018, 26, 7528–7536. [Google Scholar] [CrossRef] [PubMed]
- Meng, S.Y.; Sha, Y.H.; Fu, Q.; Bao, Q.Q.; Shi, W.W.; Li, G.D.; Chen, X.H.; Wu, L.A. Super-resolution imaging by anticorrelation of optical intensities. Opt. Lett. 2018, 43, 4759–4762. [Google Scholar] [CrossRef] [PubMed]
- Gong, W.; Han, S. Experimental investigation of the quality of lensless super-resolution ghost imaging via sparsity constraints. Phys. Lett. A 2012, 376, 1519–1522. [Google Scholar] [CrossRef][Green Version]
- Zhao, H.; Wang, X.Q.; Gao, C.; Yu, Z.; Yao, Z. Enhancement of spatial resolution of second-order cumulants ghost imaging via low-pass spatial filter method. In Proceedings of the 2023 8th International Conference on Intelligent Information Technology, Da Nang, Vietnam, 24–26 February 2023. [Google Scholar]
- Hell, S.W.; Wichmann, J. Breaking the diffraction resolution limit by stimulated emission: Stimulated-emission-depletion fluorescence microscopy. Opt. Lett. 1994, 19, 780–782. [Google Scholar] [CrossRef] [PubMed]
- Tsang, M.; Nair, R. Resurgence of Rayleigh’s curse in the presence of partial coherence: Comment. Optica 2019, 6, 400–401. [Google Scholar] [CrossRef]
- Ferri, F.; Magatti, D.; Sala, V.; Gatti, A. Longitudinal coherence in thermal ghost imaging. Appl. Phys. Lett. 2008, 92, 261109. [Google Scholar] [CrossRef]
- Zhang, P.; Gong, W.; Shen, X.; Huang, D.; Han, S. Improving resolution by the second-order correlation of light fields. Opt. Lett. 2009, 34, 1222–1224. [Google Scholar] [CrossRef] [PubMed]
- Sprigg, J.; Peng, T.; Shih, Y. Super-resolution imaging using the spatial-frequency filtered intensity fluctuation correlation. Sci. Rep. 2016, 6, 38077. [Google Scholar] [CrossRef]
- Kuplicki, K.; Chan, K.W.C. High-order ghost imaging using non-Rayleigh speckle sources. Opt. Express 2016, 24, 26766–26776. [Google Scholar] [CrossRef] [PubMed]
- Wang, Y.; Zhou, Y.; Wang, S.; Wang, F.; Liu, R.; Gao, H.; Zhang, P.; Li, F. Enhancement of spatial resolution of ghost imaging via localizing and thresholding. Chin. Phys. B 2019, 28, 044202. [Google Scholar] [CrossRef]
- Tong, Z.; Liu, Z.; Hu, C.; Wang, J.; Han, S. Preconditioned deconvolution method for high-resolution ghost imaging. Photonics Res. 2021, 9, 1069–1077. [Google Scholar] [CrossRef]
- Zhao, H.; Wang, X.; Gao, C.; Yu, Z.; Wang, H.; Wang, Y.; Gou, L.; Yao, Z. Improving the Resolution of Ghost Imaging via the Coefficient of Skewness. IEEE Photonics J. 2023, 15, 6500807. [Google Scholar] [CrossRef]
- Du, J.; Gong, W.; Han, S. The influence of sparsity property of images on ghost imaging with thermal light. Opt. Lett. 2012, 37, 1067–1069. [Google Scholar] [CrossRef] [PubMed]
- Shechtman, Y.; Gazit, S.; Szameit, A.; Eldar, Y.C.; Segev, M. Super-resolution and reconstruction of sparse images carried by incoherent light. Opt. Lett. 2010, 35, 1148–1150. [Google Scholar] [CrossRef] [PubMed]
- Chen, J.; Gong, W.; Han, S. Sub-Rayleigh ghost imaging via sparsity constraints based on a digital micro-mirror device. Phys. Lett. A 2013, 377, 1844–1847. [Google Scholar] [CrossRef]
- Wang, F.; Wang, C.; Chen, M.; Gong, W.; Zhang, Y.; Han, S.; Situ, G. Far-field super-resolution ghost imaging with a deep neural network constraint. Light Sci. Appl. 2022, 11, 1. [Google Scholar] [CrossRef]
- Ye, H.; Kang, Y.; Wang, J.; Zhang, L.; Sun, H.; Zhang, D. High resolution reconstruction method of ghost imaging via SURF-NSML. J. Korean Phys. Soc. 2022, 80, 964–971. [Google Scholar] [CrossRef]
- Xiao, Y.; Zhou, L.; Chen, W. High-resolution ghost imaging through complex scattering media via a temporal correction. Opt. Lett. 2022, 47, 3692–3695. [Google Scholar] [CrossRef]
- Zhao, H.; Wang, X.; Gao, C.; Yu, Z.; Wang, S.; Gou, L.; Yao, Z. Second-order cumulants ghost imaging. Chin. Opt. Lett. 2022, 20, 112602. [Google Scholar] [CrossRef]
- Han, L.S. Spatial longitudinal coherence length of a thermal source and its influence on lensless ghost imaging. Opt. Lett. 2008, 33, 824–826. [Google Scholar]
- Wang, H.; Wang, X.Q.; Gao, C.; Liu, X.; Wang, Y.; Zhao, H.; Yao, Z.H. High-quality computational ghost imaging with multi-scale light fields optimization. Opt. Laser Technol. 2024, 170, 110196. [Google Scholar] [CrossRef]
- Betzig, E.; Patterson, G.; Sougrat, R.; Lindwasser, O.; Olenych, S.; Bonifacino, J.; Davidson, M.; Lippincott-Schwartz, J.; Hess, H. Imaging intracellular fluorescent proteins at nanometer resolution. Science 2006, 313, 1642–1645. [Google Scholar] [CrossRef] [PubMed]
- Mouradian, S.; Wong, F.; Shapiro, J.H. Achieving sub-Rayleigh resolution via thresholding. Opt. Express 2011, 19, 5480–5488. [Google Scholar] [CrossRef] [PubMed]
- Babcock, H.; Sigal, Y.M.; Zhuang, X. A high-density 3D localization algorithm for stochastic optical reconstruction microscopy. Opt. Nanoscopy 2012, 1, 6. [Google Scholar] [CrossRef] [PubMed]
- Paúr, M.; Stoklasa, B.; Hradil, Z.; Sánchez-Soto, L.L.; Rehacek, J. Achieving the ultimate optical resolution. Optica 2016, 3, 1144–1147. [Google Scholar] [CrossRef]


| Method | |||||
|---|---|---|---|---|---|
| PSNR | 15.86 | 17.19 | 20.65 | 23.41 | 24.17 |
| Method | with the Thresholding Method | ||
|---|---|---|---|
| PSNR | 16.43 | 22.52 | 25.18 |
| Method | |||
|---|---|---|---|
| The FWHM of the PSF | 69 (pixels) | 49 (pixels) | 35 (pixels) |
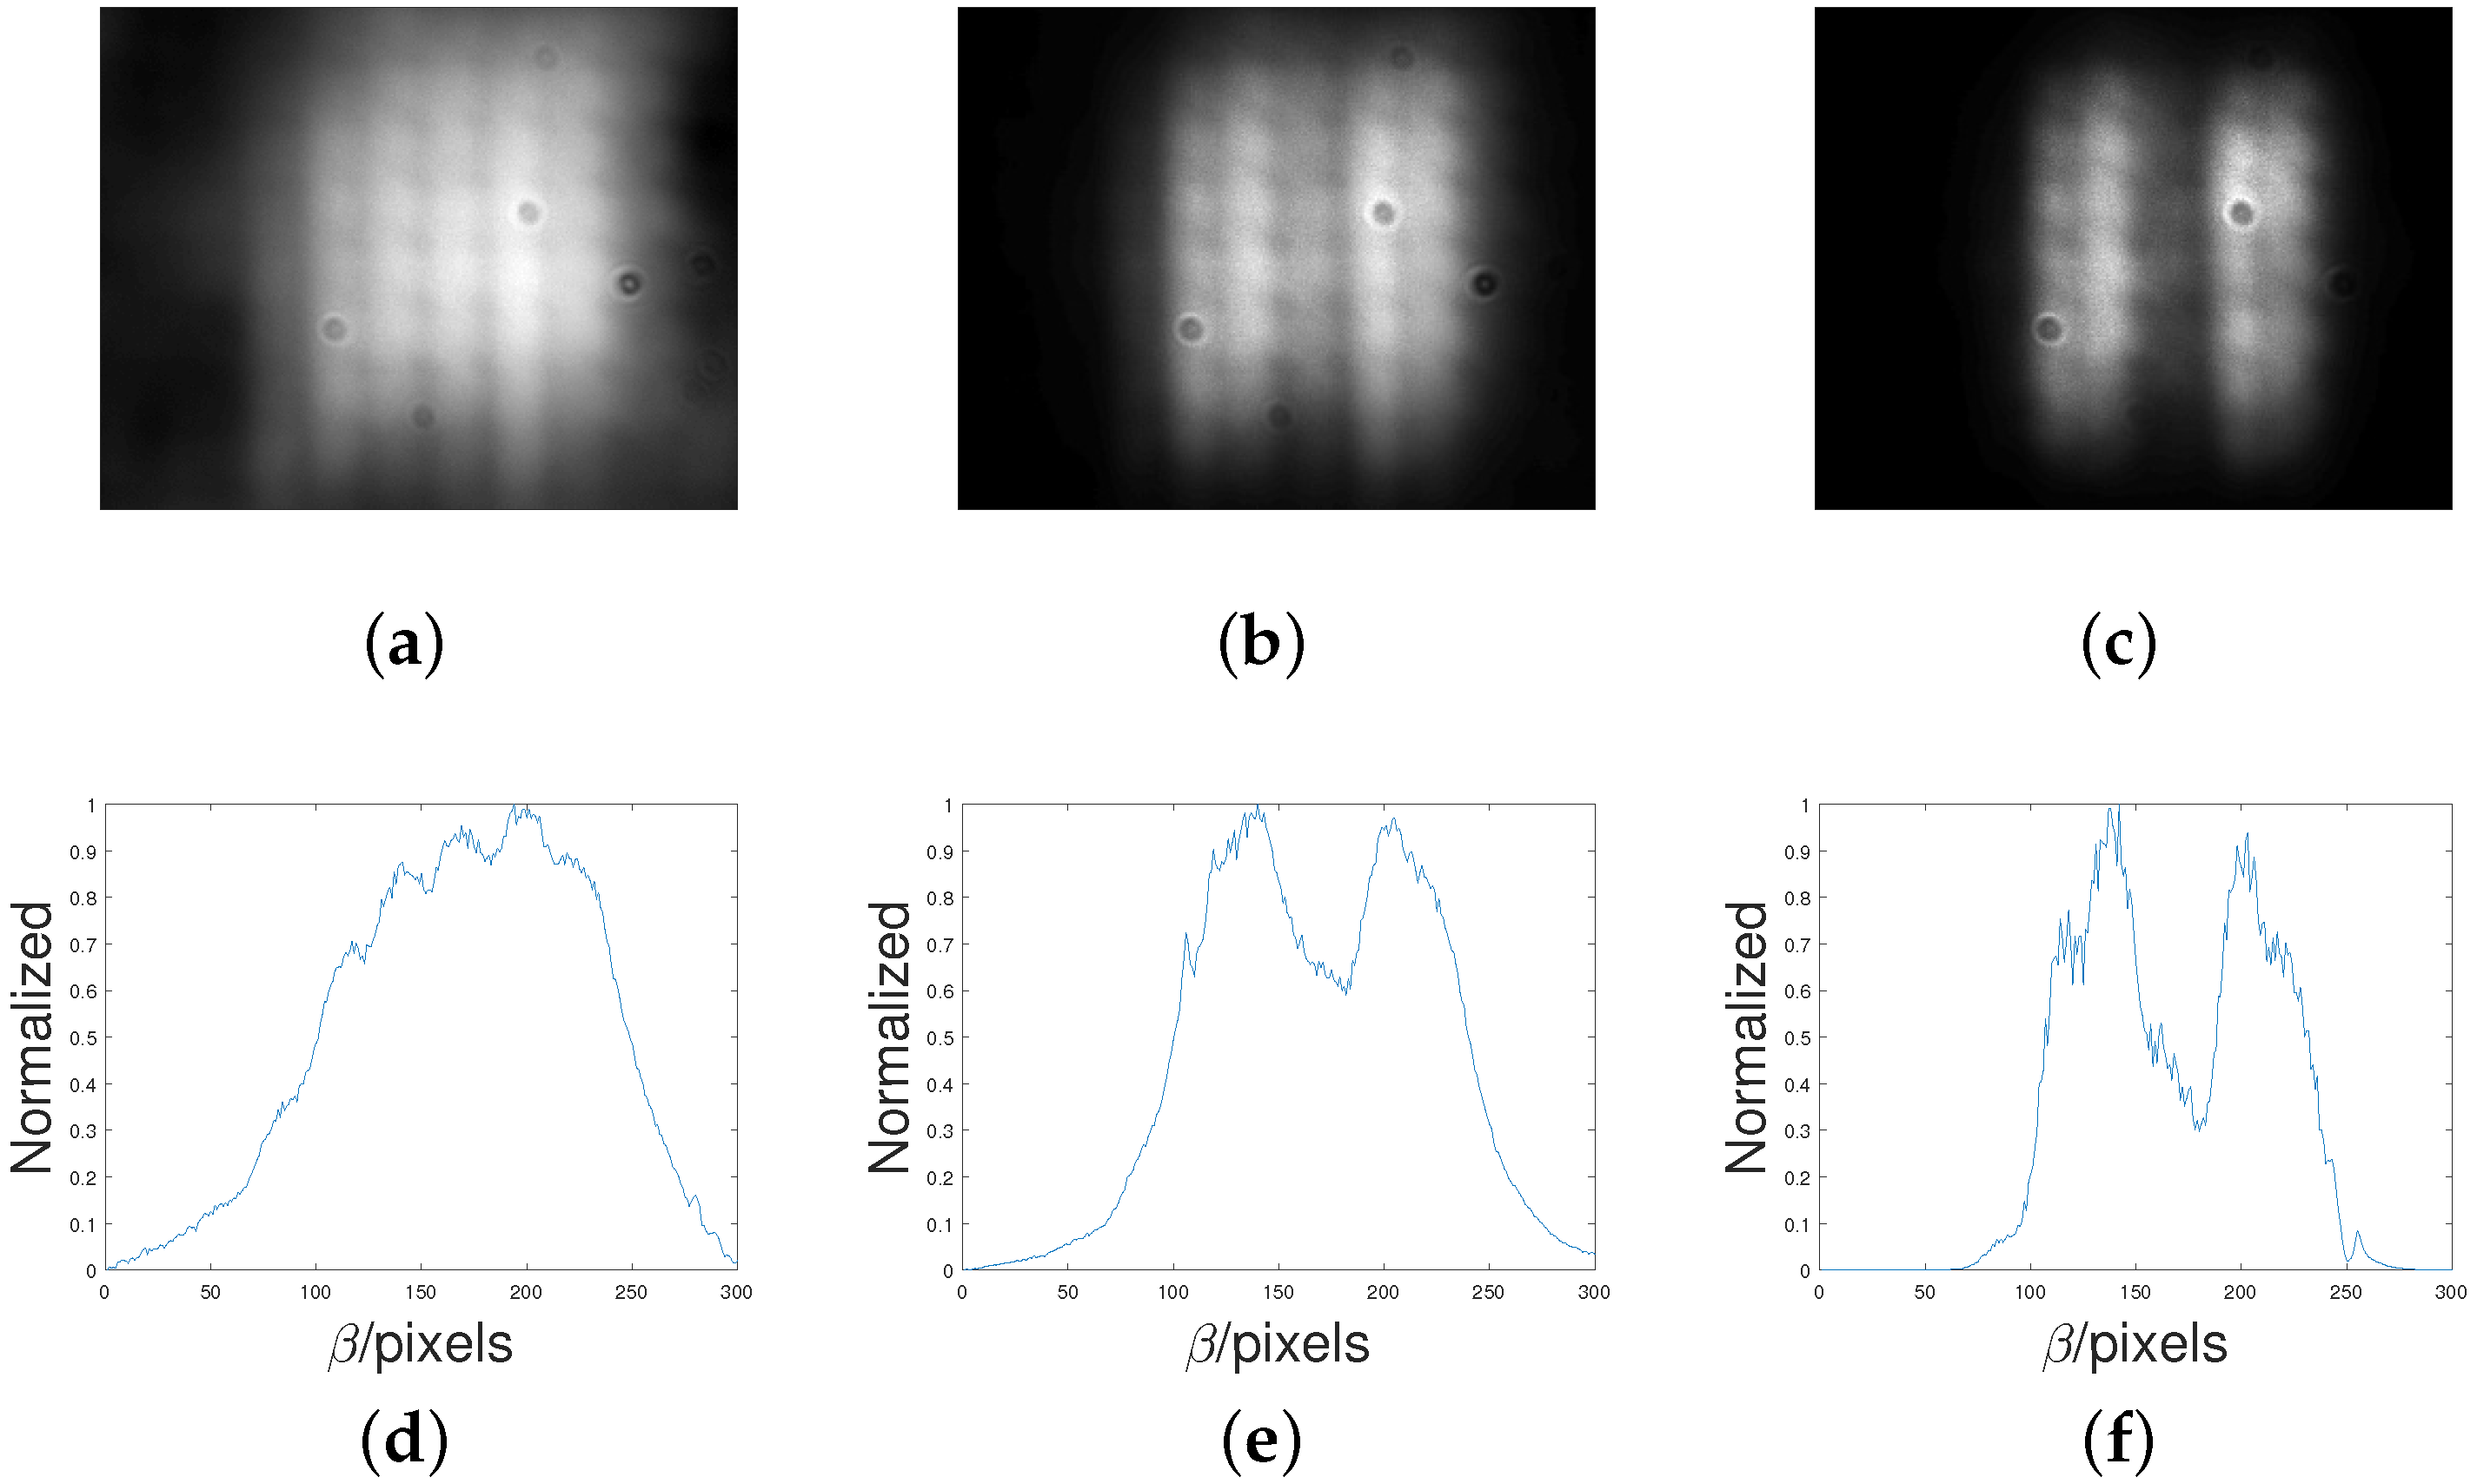
| The normalized horizontal sections of the image | Figure 5d | Figure 5e | Figure 5f |
| The normalized intensity at | 0.95 (>0.81) | 0.62 (<0.81) | 0.32 (<0.81) |
| Method | with Thresholding Method | ||
|---|---|---|---|
| The FWHM of the PSF | 69 (pixels) | 49 (pixels) | 35 (pixels) |
| The normalized horizontal sections of the image | Figure 6d | Figure 6e | Figure 6f |
| The radio between the intensity at and | 1.21 (>0.81) | 0.713 (<0.81) | 0.25 (<0.81) |
Disclaimer/Publisher’s Note: The statements, opinions and data contained in all publications are solely those of the individual author(s) and contributor(s) and not of MDPI and/or the editor(s). MDPI and/or the editor(s) disclaim responsibility for any injury to people or property resulting from any ideas, methods, instructions or products referred to in the content. |
© 2024 by the authors. Licensee MDPI, Basel, Switzerland. This article is an open access article distributed under the terms and conditions of the Creative Commons Attribution (CC BY) license (https://creativecommons.org/licenses/by/4.0/).
Share and Cite
Zhao, H.; Wang, X.; Gao, C.; Yu, Z.; Wang, H.; Wang, Y.; Gou, L.; Yao, Z. Improving the Resolution of Correlation Imaging via the Fluctuation Characteristics. Photonics 2024, 11, 100. https://doi.org/10.3390/photonics11020100
Zhao H, Wang X, Gao C, Yu Z, Wang H, Wang Y, Gou L, Yao Z. Improving the Resolution of Correlation Imaging via the Fluctuation Characteristics. Photonics. 2024; 11(2):100. https://doi.org/10.3390/photonics11020100
Chicago/Turabian StyleZhao, Huan, Xiaoqian Wang, Chao Gao, Zhuo Yu, Hong Wang, Yu Wang, Lidan Gou, and Zhihai Yao. 2024. "Improving the Resolution of Correlation Imaging via the Fluctuation Characteristics" Photonics 11, no. 2: 100. https://doi.org/10.3390/photonics11020100
APA StyleZhao, H., Wang, X., Gao, C., Yu, Z., Wang, H., Wang, Y., Gou, L., & Yao, Z. (2024). Improving the Resolution of Correlation Imaging via the Fluctuation Characteristics. Photonics, 11(2), 100. https://doi.org/10.3390/photonics11020100


