Article

Characterization of Holmium-Doped Fiber Using AOM and Considering Pair-Induced Quenching and Fiber Length

by
Yuri Barmenkov
1,*,
Pablo Muniz-Cánovas
1,
José-Luis Cruz
2 and
Miguel V. Andrés
2
1
Centro de Investigaciones en Optica A.C., Loma del Bosque 115, Leon 37150, Guanajuato, Mexico
2
Departamento de Física Aplicada, Instituto de Ciencia de Materiales, Universidad de Valencia, 46100 Valencia, Spain
*
Author to whom correspondence should be addressed.
Photonics 2024, 11(11), 1043; https://doi.org/10.3390/photonics11111043
Submission received: 7 October 2024 / Revised: 24 October 2024 / Accepted: 30 October 2024 / Published: 7 November 2024
(This article belongs to the Special Issue Fiber Lasers: Recent Advances and Applications)

Abstract

:
In this paper, we present the results of an experimental study on the characterization of holmium-doped silica fiber. A standard acousto-optic modulator controls the output power of the ytterbium-doped fiber laser operating at 1134.5 nm and serving as a pump source of the holmium-doped fiber under test. This technique allows us to measure the lifetimes of 5I7 and 5I8 energy levels of Ho3+ ions. The effects of the fiber length and the concentration-dependent pair-induced quenching on the accuracy of the fluorescence lifetime measurement are considered. The results of this study are compared with those obtained using the exponential and Förster decay functions used for such types of measurements. It is demonstrated that the knowledge of two fiber parameters, the pump saturation power and the fluorescence saturation power, together with the fiber absorption spectrum, permits one to obtain the absorption cross-sections at the pump and other key wavelengths, the effective concentration of the active ions, and the quantum efficiency of the fluorescence from the laser level. The results of this study are applicable to the reliable characterization of any type of heavily doped gain fibers and to the further numerical modeling and optimization of fiber lasers.

1. Introduction

Holmium-doped silica fiber lasers (HDFLs) operate in the optical range beyond two microns, usually in the spectral range of 2.05–2.20 µm. This range is inaccessible to lasers based on silica fibers doped with other rare earth materials, except thulium-doped fiber lasers (TDFLs), whose efficiency decreases significantly in this wavelength range [1]. The reported maximum of the operation wavelength range of HDFLs is 2200 nm, with about 9 W of output power [2] and 2210 nm with 140 mW of output power [3], both in a continuous-wave (CW) regime. Note that above this wavelength, the infrared absorption tail originated from the multi-phonon absorption in silica fiber [4,5], making it impossible to develop silica-based active fibers for laser/amplifier applications.
HDFLs can operate in CW [2,3], including a single-frequency mode [6] and Q-switch [7,8,9], gain-switch [10,11], and mode-lock [12,13,14,15] regimes. Due to their versatility and operation spectral range, HDFLs are of growing interest for applications in free-space communication in the 2 µm atmospheric transmission window [16,17], biology [18], medicine due to the 2 µm water absorption peak [19], remote sensing and lidars [20,21], laser welding of the polymers translucent in visible [22], and other fields.
Usually, HDFLs and amplifiers are pumped (i) with thulium-doped fiber lasers (TDFLs) operating slightly below 2000 nm [23,24] at the holmium 5I7 (laser) level or by (ii) long-wavelength ytterbium-doped fiber lasers (YDFLs) operating in the 1120–1150 nm range [18,25,26,27] at the holmium 5I6 level. The maximum reported powers of HDFLs in-line pumped with a TDFL is 407 W [28] and pumped with YDFL is 22.3 W [26]. The highest optical-to-optical slope efficiency of an HDFL obtained using the first pumping scheme is 87% [29]; using the second scheme, it is about 40% [25]. (Note that, usually, the electrical-to-optical conversion efficiency is not discussed.) This difference in laser output power can be explained by the fact that in the first case, the quantum defect (and hence the thermal load of an active fiber) is much less than in the second. On the other hand, for a fiber laser with moderate output power, the YDFL-based pump scheme can be more straightforward and cost-effective.
Apart from the excessive thermal load, the pair-induced quenching (PIQ) of excited ions [24,30,31] and the small quantum efficiency of the fluorescence from the laser level [30] decrease the laser’s efficiency when the fiber is heavily doped with the active ions, the technique used for a double-clad pumping scheme to achieve sufficient pump absorption and also when the fiber lasers operate in the optical range beyond 2 µm. The latter permits using a shorter laser cavity to reduce the effect of the excessive passive loss of a silica glass fiber and also nonlinear effects arising in high-power fiber lasers.
For each specific application, one needs to optimize the fiber laser to improve its efficiency, which can be carried out, as the first step, by numerical simulation based on the known parameters of the active fiber, such as the excited levels’ lifetimes, the active ions’ concentration, absorption and emission cross-sections, the quantum efficiency of spontaneous emission from the laser level, and so on. Unfortunately, the reported critical parameters of Ho3+ ions in silica fibers vary over wide ranges. For instance, the shortest measured fluorescence lifetime is 0.32 ms [32], whereas the longest is 1.35 ms [33]. A clear tendency for the lifetime to decrease with increasing Ho3+ concentration is reported in refs. [30,33]. The values of the absorption cross-sections measured at the Ho3+ peak wavelength (1950 nm) also vary significantly in the interval from 2.9 × 10⁻²¹ cm2 [33] to 8.5 × 10⁻²¹ cm2 [34].
In reference [30], the authors introduced the quantum efficiency (QE) of the 5I7 (the laser) level of holmium ions, found as a ratio of the measured fluorescence lifetime of the 5I7 level to the calculated one using the well-known Judd–Ofelt theory describing the electronic transitions in the 4f electron shell of rare-earth ions in solids [35], which does not consider the phonon relaxations. Thus, this parameter shows what part of the total number of transitions (photon plus phonon ones) from the laser level down to the fundamental level is due to photon transitions only. It was shown that QE varies from 6.5% to 9.4% with decreasing holmium concentration. The minimum value of QE, about 4%, is reported in ref. [32].
This paper discusses the experimental technique to characterize a holmium-doped silica fiber (HDF). To measure the lifetimes of the laser (5I7) and the pump (5I8) energy levels of Ho3+ ions, we use a signal from a YDFL operated at 1134.5 nm modulated by a standard acousto-optic modulator (AOM). The fluorescence lifetime of the laser level was measured when AOM was modulated by a rectangular signal, permitting the fast on/off switching of the laser signal. In contrast, the lifetime of the 5I8 level was measured using sinusoidal AOM modulation in the broad RF interval from tens of Hertz to hundreds of kHz. The effects of the fiber length and the concentration-dependent pair-induced quenching (PIQ) of holmium ions on the accuracy of measuring the fluorescence lifetime are analyzed. The results of our study are compared with those obtained using the exponential and the Förster decay functions.
It is shown that the pump saturation power of HDF can be successfully used for obtaining the absorption cross-sections of the holmium ions at the pump and other key wavelengths and that the fluorescence saturation power can be used for an estimation of the quantum efficiency of fluorescence (photon) transitions from the laser level.
The experimental technique proposed in this work can be applied to characterizing the fibers doped with holmium and other active ions for the further use of the obtained fiber parameters in fiber laser modeling.

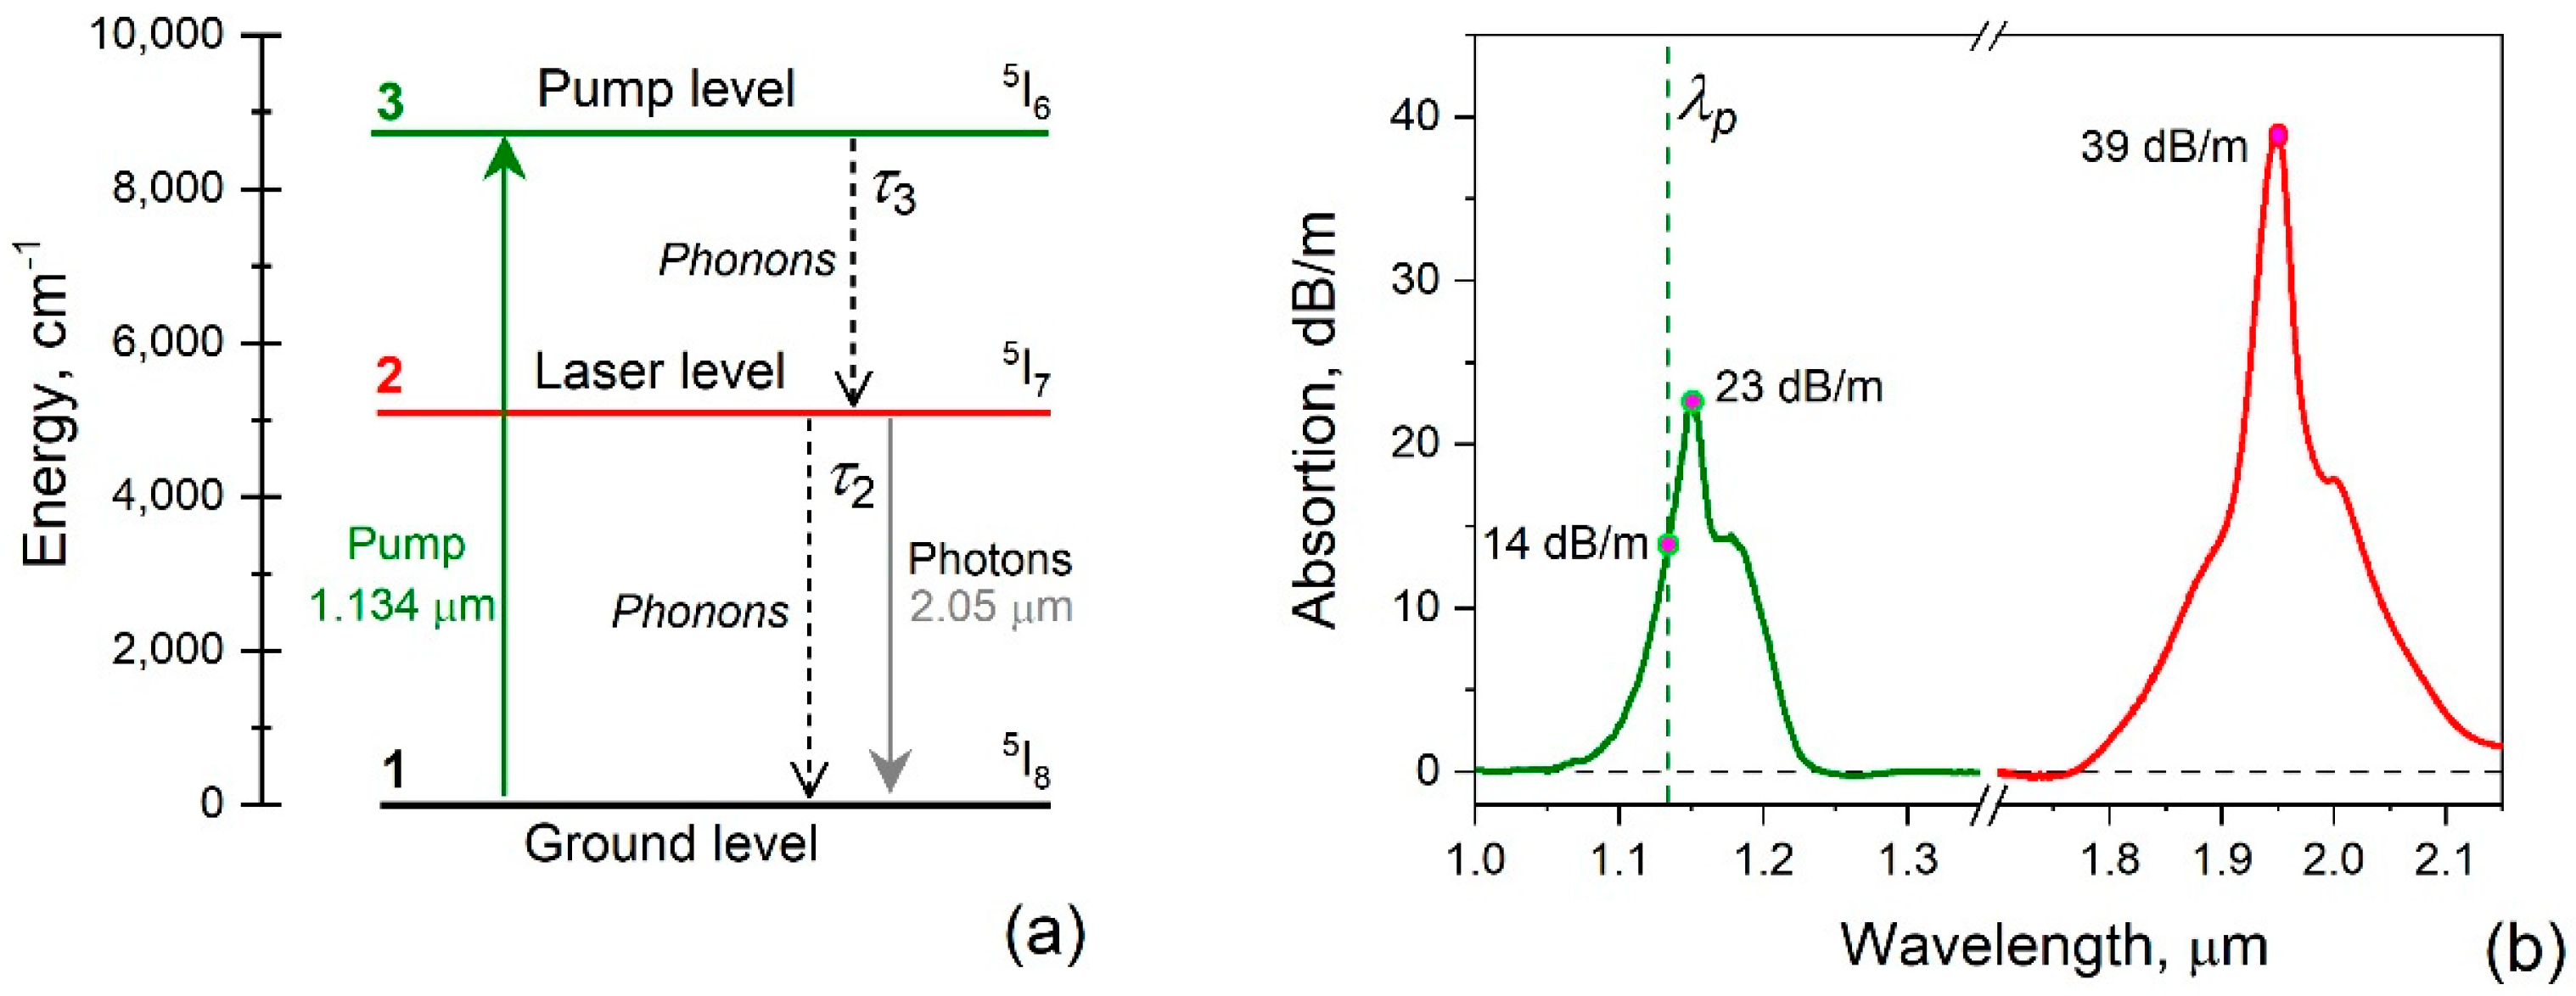
2. HDF Absorption Spectrum

The absorption spectrum of HDF is essential for further calculating the absorption cross-section of holmium ions and their concentration. It was measured using the traditional cut-back technique [36] that permits one to obtain the relative (normalized) spectrum convenient for accounting for the spectral imperfection of the used white light source and also for compensating the difference between the actual resolution of the optical spectrum analyzer (OSA) from the chosen one. In this experiment, OSAs were used, both from Yokogawa: AQ6370B, with an operating range of 600 nm to 1700 nm, and AQ6375, with an operating range from 1200 nm to 2400 nm. In the first case, the broad-band halogen lamp-based AQ4305 device from Yokogawa with an operation range from 400 nm to 2000 nm was used as a white-light source with a very low output power (−40 dBm in the 50/125 µm multimode fiber or about −56 dBm in SMF-28 fiber), while in the second case, the 2 µm spontaneous-emission-based (SE) source with output power of 10 mW (AdValue Photonics, Tucson, USA) was applied. The SE source is chosen for 2 µm measurements because, in the same conditions, the 2 µm OSA (AQ6375) background noise is approximately 17 dB higher than that of the 1 µm OSA (AQ6370B), which dramatically affects the quality of the measured signals. The resolution of 2 nm was selected for both OSAs, which corresponded to the actual resolution of 2.02 nm at 1950 nm for the former and 2.72 nm at 1150 nm for the latter.
An energy diagram of holmium ions’ levels involved in the laser action is shown in Figure 1a. From the ground state 5I8, the ions are excited to the pump level 5I6 through the interaction with the pump photons at 1134.5 nm (in our case), from which they rapidly decay to the laser long-living state 5I7 without photon emission (phonon transitions). Then, the ions fall to the ground state through phonon- and photon-assisted transitions (the dash and the solid lines, respectively). τ2 and τ3 are the lifetimes of the laser level (2) and of the pump level (3).
The absorption spectra of HDF under study (IXF-HDF-8-125, iXblue, Paris, France) are demonstrated in Figure 1b. The spectrum was measured for the fiber length L = 22 cm. This figure shows that the absorption peaks are 23 dB/m (5.3 m−1) and 39 dB/m (9.0 m−1) at 1150 nm and 1950 nm, respectively. The absorption peak at 1950 nm, at which α0 = 9 m−1, are used below as a reference to characterize the absorption of the HDF pieces under study, using a coefficient of α0L. The absorption coefficient at the pump wavelength (λp = 1134.5 nm) used in our research is 14 dB/m (3.2 m−1). If the pump wavelength is 1150 nm, the active fiber length used for an HDFL should be shorter since the pump power is completely absorbed in the shorter fiber piece, which is important for the laser operation (see the discussion below).

3. Measurement of the Laser Level Lifetime

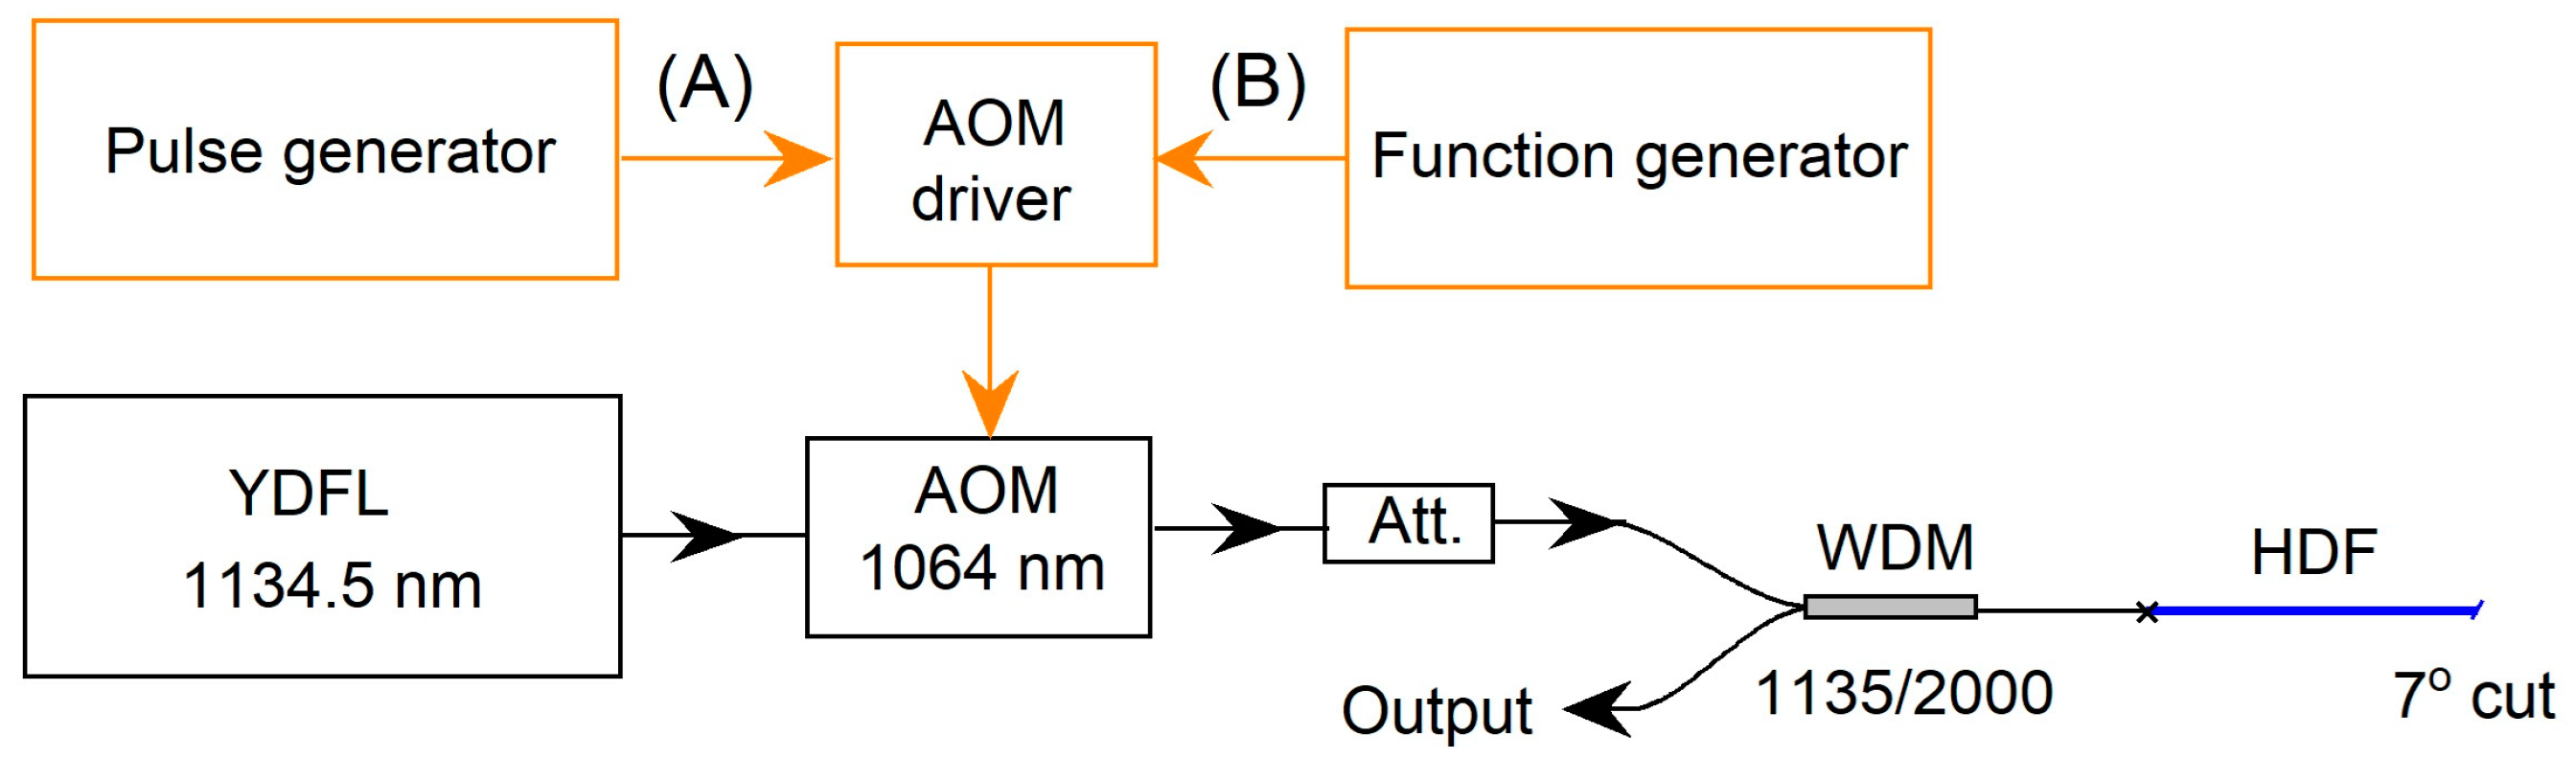
3.1. Experimental Setup

The setup for measuring the laser level lifetime is shown in Figure 2. It includes the CW YDFL operating in a long-wavelength range (1134.5 nm) as a pump source of HDF. The laser power is switched on/off by a standard fibered acousto-optical modulator (AOM) (A-A Opto-Electronic, Orsay, France, model MT110-IR20-Fio-SM5-J1-A) with a nominal operation wavelength of 1064 nm and diffraction to the +1 order and a rise time of about 20 ns. The AOM was driven at the acoustic frequency of 110 MHz using a standard AOM driver (Model MODA110-D4-34, A-A Opto-Electronics) controlled by a Digital Delay Generator (Stanford Research Systems, model DG645) (setup A) or by a function generator (Hewlett Packard, Palo Alto, USA, model 33120A) with the biased sine wave output (setup B). Despite the YDFL wavelength being out of the AOM operation range, the latter introduces only 1 dB of additional loss at the YDFL operation wavelength.
From the AOM output, the laser signal passes through the fiber attenuator, which decreases the laser power to the value suitable for the experiments (1 W as a maximum) and then to the input port of the fused 1135 nm/2000 nm wavelength division multiplexer (WDM), supporting up to 30 W of laser power. A short piece of HDF is spliced to the common WDM output. The InGaAs photodetector (Thorlabs, Newton, USA, model DET05D2, 900–2600 nm, 17 μs rise time) connected to a 200 MHz digital oscilloscope measures the back-passed spontaneous emission generated in HDF under pumping at 1134.5 nm.
The HDF piece under study was pumped through a WDM by the YDFL signal to the pump level 5I6 of holmium ions, from which the exited ions decayed rapidly to the laser level 5I7 via phonons with a relaxation time of the order of 1 µs (see the discussion below). Since the lifetime of the Ho3+ laser level is of the order of 1 ms, which is three orders longer than that of the pump level, the excitation of the holmium ions to the pump level does not affect the measurement of the laser level lifetime.

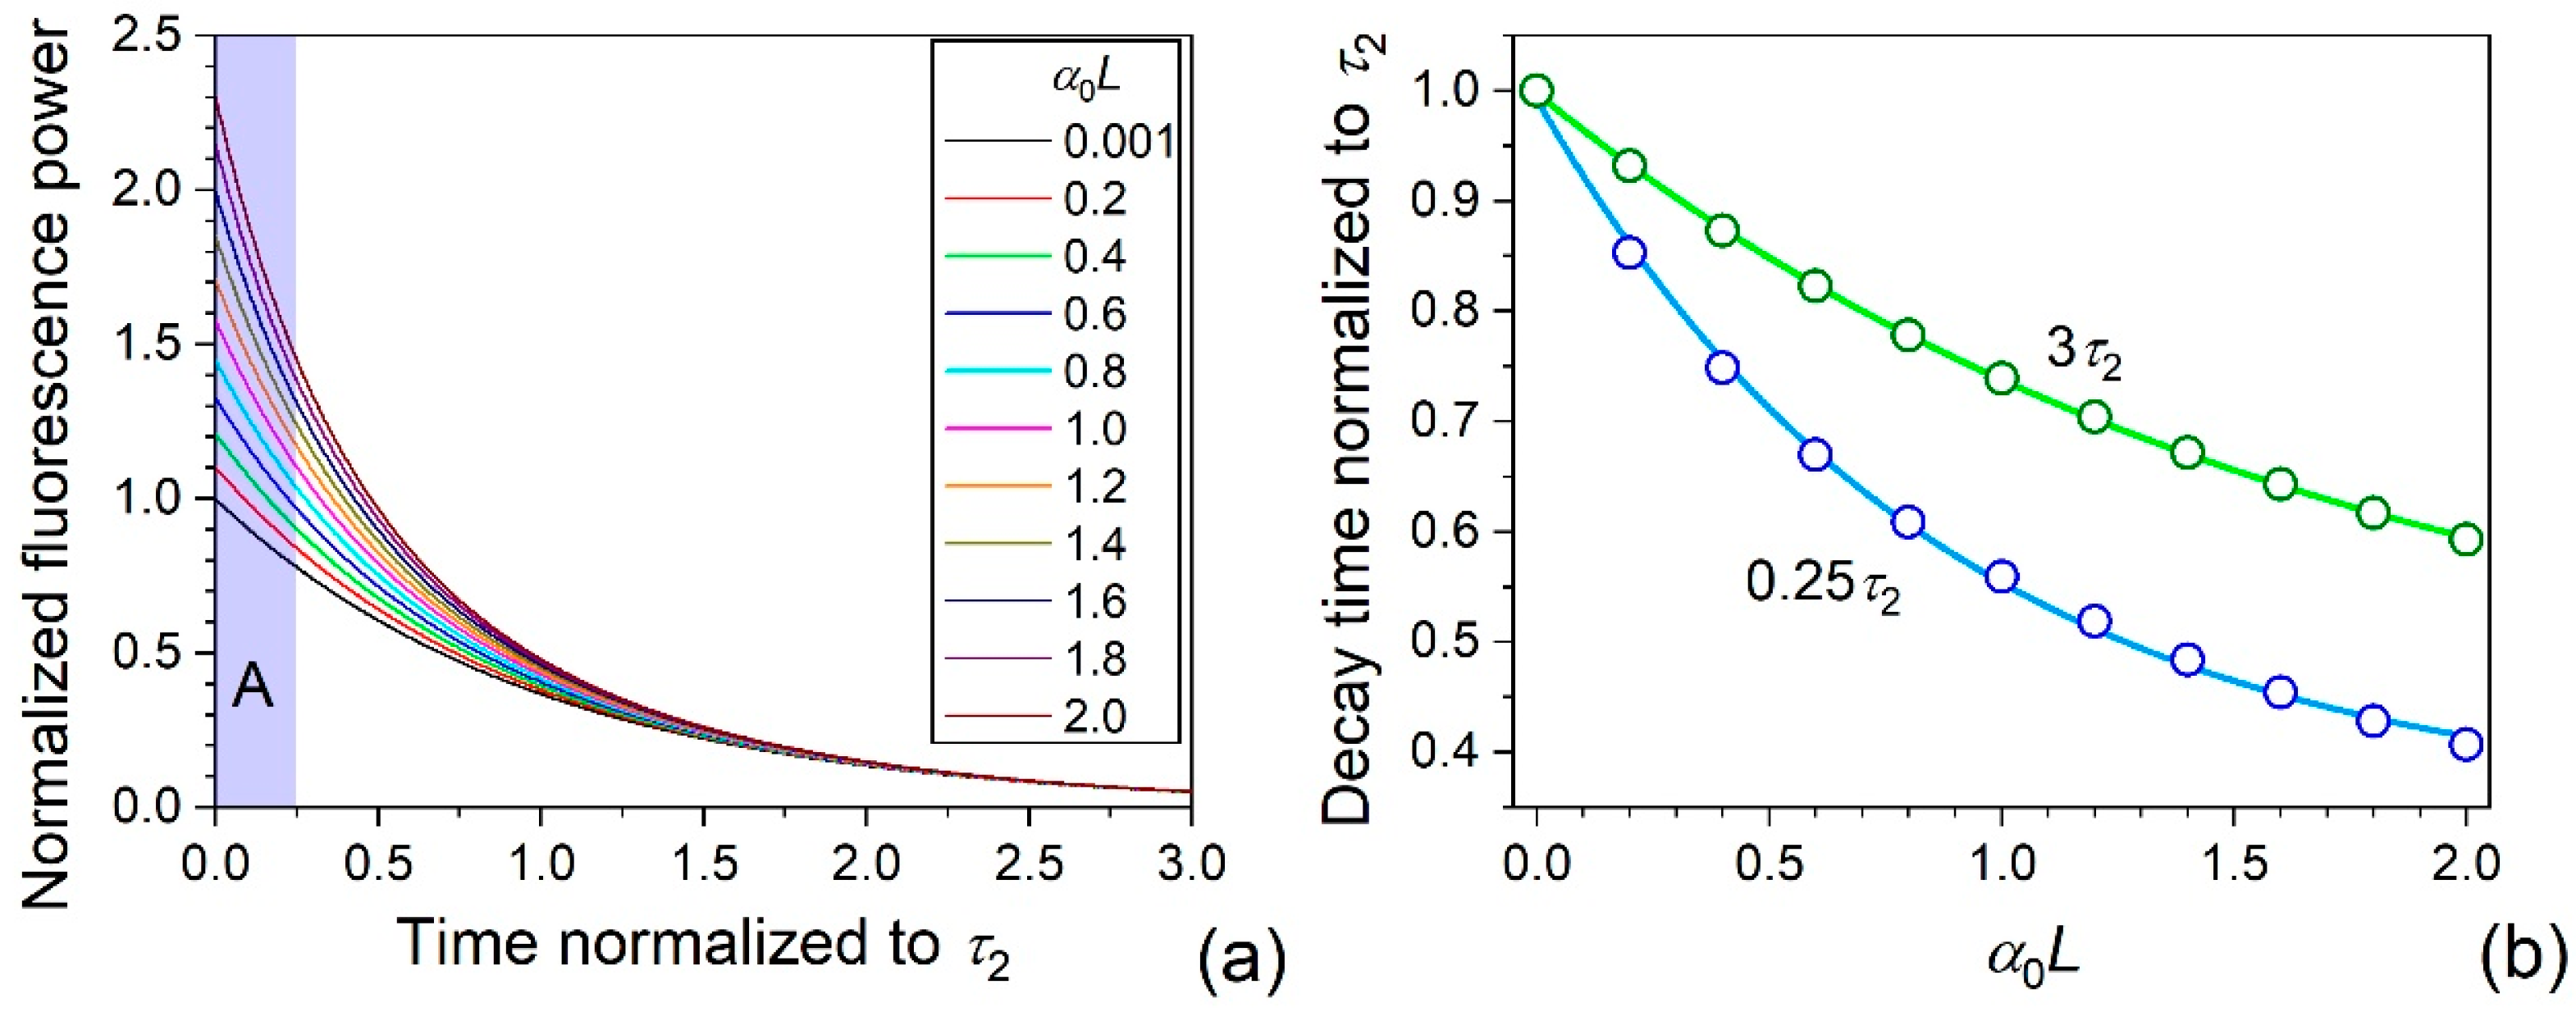
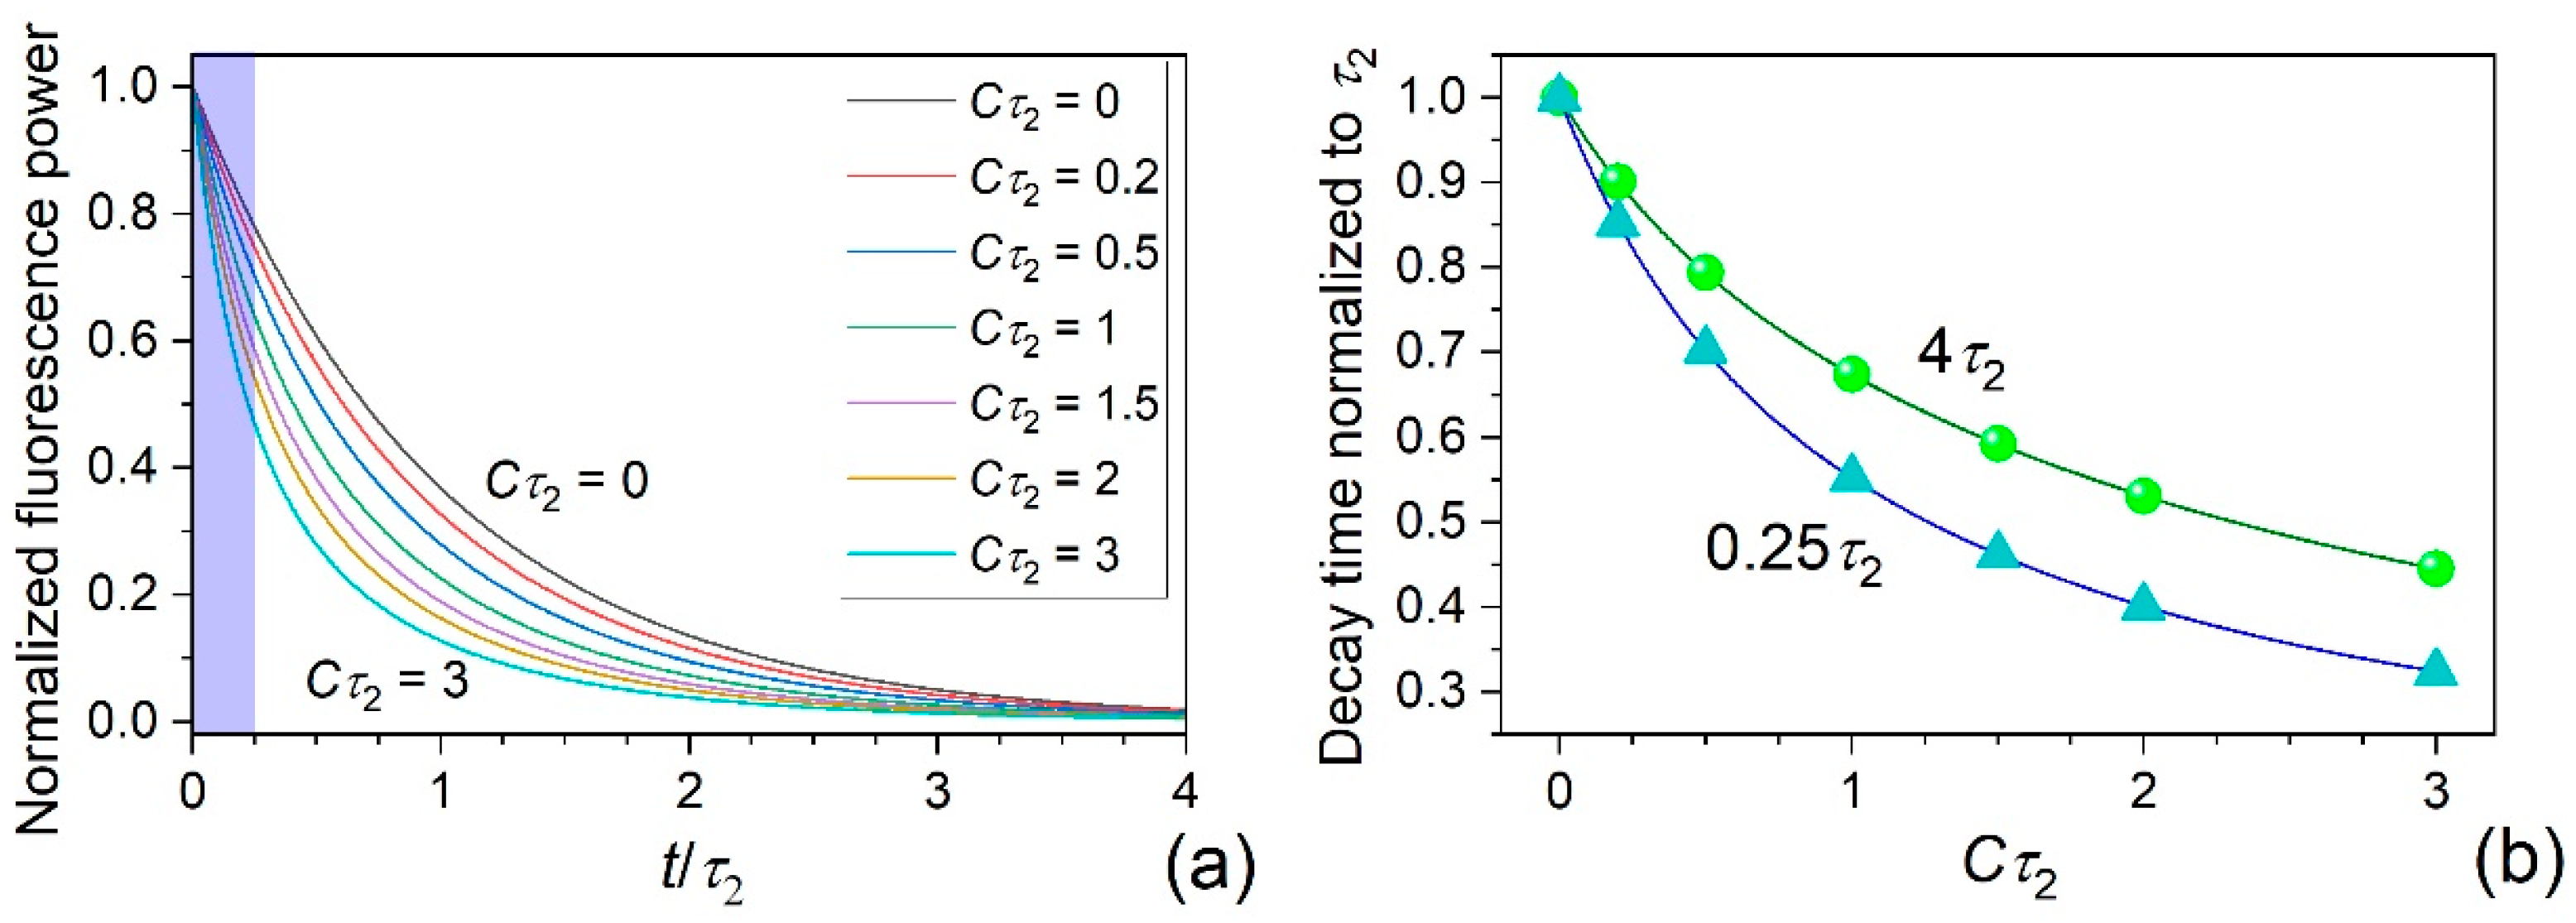
3.2. Theoretical Background

The balance equations describing the steady-state populations of the energy levels of the holmium ions under pumping at λp = 1134.5 nm, which do not consider the concentration effects (the case of a long low-doped fiber), are the following:
σ 13 I p n 1 h ν p n 3 τ 3 = 0
n 3 τ 3 n 2 τ 2 = 0
n 1 + n 2 + n 3 = 1
where n1, n2, and n3 are the levels’ populations normalized to the holmium concentration N0, σ13 is the absorption cross-section at the pump wavelength, Ip = Pp/Ap is the pump intensity (Pp is the pump power, and Ap is the pump beam area), h is the Plank constant, and λp is the pump light optical frequency. From these equations, the levels’ populations are found easily as
n 1 = 1 1 + 1 + ξ s
n 2 = ξ s 1 + 1 + ξ s
n 3 = s 1 + 1 + ξ s
where ξ = τ2/τ3 >> 1 and s = Ip/Ips = Pp/Pps is the saturation parameter (Ips = p/(σ13τ3) is the saturation intensity, and Pps = IpsAp is the pump saturation power). These equations will be used in our discussion below. After fast switching the pump laser off, the holmium ions decay to the ground state with the lifetime of the laser level.
Experimentally, holmium spontaneous emission (SE) decreases with some function that depends on HDF length and the holmium concentration. The function describing the SE decay power (Pse) of a low-doped fiber can be derived starting with a conventional equation of a fiber amplifier, in which SE is considered:
d P s e ( t ) d z = g 0 n 2 t α 0 n 1 t P s e ( t ) + η Ω 4 π   h ν s e N 0 π a 2 τ 2   n 2 ( t )
where α0 = 9 m−1, found from Figure 1b, is the HDF absorption at 1.95 µm, and g0 is the HDF saturated gain for a small signal. The last term of Equation (3), η, is the quantum efficiency of the photon relaxation of the Ho3+ laser level, Ω = πNA2/n2 = 0.038 is the solid angle of acceptance of SE by the fiber core (NA = 0.16 is the fiber numerical aperture and n = 1.46 is the fiber refractive index), and the term  h ν s e N 0 π a 2  is the initial fiber charge of a saturated fiber in Joules per meter. In this term, πa2 = 50 µm2 is the fiber core area (a = 4 µm is the core radius), se is the SE photon energy, νse is the SE optical frequency, and ηN0n2/τ2 is the number of SE photons irradiated to all directions per second per meter. It is also considered that n1 + n2 ≈ 1.
After simple mathematical transformations and assuming, for simplicity, that g0 = α0, n2(t) = n20exp(t/τ2), and that n20 = 1 (strongly saturated fiber), the formula for the SE decay is obtained in the following form (see also ref. [37]):
P s e ( t ) = η W e x p t / τ 2 e x p α 0 L 2 e x p t / τ 2 1 1 α 0 L 2 e x p t / τ 2 1
where W is the SE power generated in the fiber section with length L when all active ions are excited to the laser level (n2 = 1) and all transitions are photon-assisted:
W = Ω 4 π h ν N 0 τ 2 π a 2 L
The exponential decay of n2 is considered since (i) the number of SE photons captured by the fiber core is low (a few percent) and (ii) the quantum efficiency of the photon decay from the Ho3+ laser level is small [30], so the SE reabsorption along HDF does not noticeably affect the SE decay in each short-fiber section. Note that when the fiber under study is short (α0L << 1) and also at the decay tail (t >> τ2) for any fiber lengths, Formula (4a) is simplified to the single exponential decay.
Figure 3 shows the results of the simulation of the SE decay after the pump signal is switched off using Equation (2), in which, for simplicity, n20 = 1 (saturated fiber). From Figure 3a, one can see that at the beginning (t/τ2 << 1), SE’s power decays faster when α0L is greater (see area A in the plot), whereas at the tail, all curves fall with the same decay constant equal to the active ion lifetime τ2. In our discussion, the dimensionless parameter α0L is used instead of the classical optical density measured in bel (1 bel = 10 dB).
Figure 3b demonstrates the decay constants obtained from the exponential fitting of the curves shown in plot (a) for the beginning of the decays, 0 to 0.25τ2 (the blue line and symbols) and in the interval 0 to 3τ2 (the green line and symbols). Note that in the first case, the adjusted R2 of the fittings is better than 0.9999, whereas in the second case, it is better than 0.9985, which demonstrates a rather good fitting quality despite the obtained values of the decay constant differing from the real values by tens of percent, depending on the fiber length chosen for the measurements. Thus, one can conclude that the fiber length should be selected to be very short for the correct measurement of the laser level lifetime so that α0L is close to zero. However, in this case, the SE signal is too low to be detectable, at least in the 2 µm range in which the photodetectors’ sensibility is very low compared with those operating in the communication band. In the reported study, we chose HDF length so that α0L = 0.12 << 1 (L = 1.3 cm). Note that an alternative method based on the SE side detection was proposed in ref. [38] to diminish the effect of long fiber.
Optical fibers heavily doped with holmium enable the development of short-length lasers and amplifiers, which is crucial for 2-micron applications because the fundamental infrared (phonon) loss increases dramatically in this optical band. When an optical fiber is highly doped with active ions homogeneously distributed in a fiber core, they interact with neighboring ions via energy transfer through an homogeneous up-conversion (HUC) [39] and concentration-dependent pair-induced quenching (PIQ). According to the model, when a pair of interacting ions are excited to the laser level, one of them immediately decays non-radiatively to the ground state, transferring the energy to the other one so that it moves to the upper excited level, from which it rapidly decays to the metastable laser level. Thus, the energy of the first ion is spent on phonon relaxation. This effect results in a gain degradation at high population inversion.
In the experiment relating to measuring the lifetime of the laser Ho3+ level, after switching the pump off, the normalized population n2 of the excited Ho3+ ions decays from the laser level to the background level in accordance with the rate equation written as follows [39,40]:
d n 2 d t = n 2 τ 2 C n 2 2
where C is the constant known as the HUC coefficient. Note that C = 0 means the concentration effects are negligible. From this equation, assuming that α0L is small, so the effects relating to SE reabsorption can be ignored, one can obtain the final formula for Pse decay as the following [40,41]:
P s e ( t ) = W n 2 ( 0 ) e x p t τ 2 1 + C τ 2 n 2 ( 0 ) 1 e x p t τ 2
where n2(0) ≈ 1 at high pump power. This function is simplified to the exponential decay at small values of 2 and also at the decay tail (t >> τ2). When deriving Equation (6), we suppose the fiber piece under study is short enough to ignore the effect of non-exponential decay due to long active fiber.
Figure 4a shows some dependences of the simulated SE decay versus the normalized lifetime t/τ2, using Equation (6). It is seen that the PIQ dramatically influences the SE decay: the stronger HUC, the faster SE decays. The result of measuring the laser level lifetime when the standard exponential fitting is applied is presented in Figure 5b, from which it is seen that the lifetime value can be underestimated by tens of percent, depending on the HUC constant and the fitting time interval.

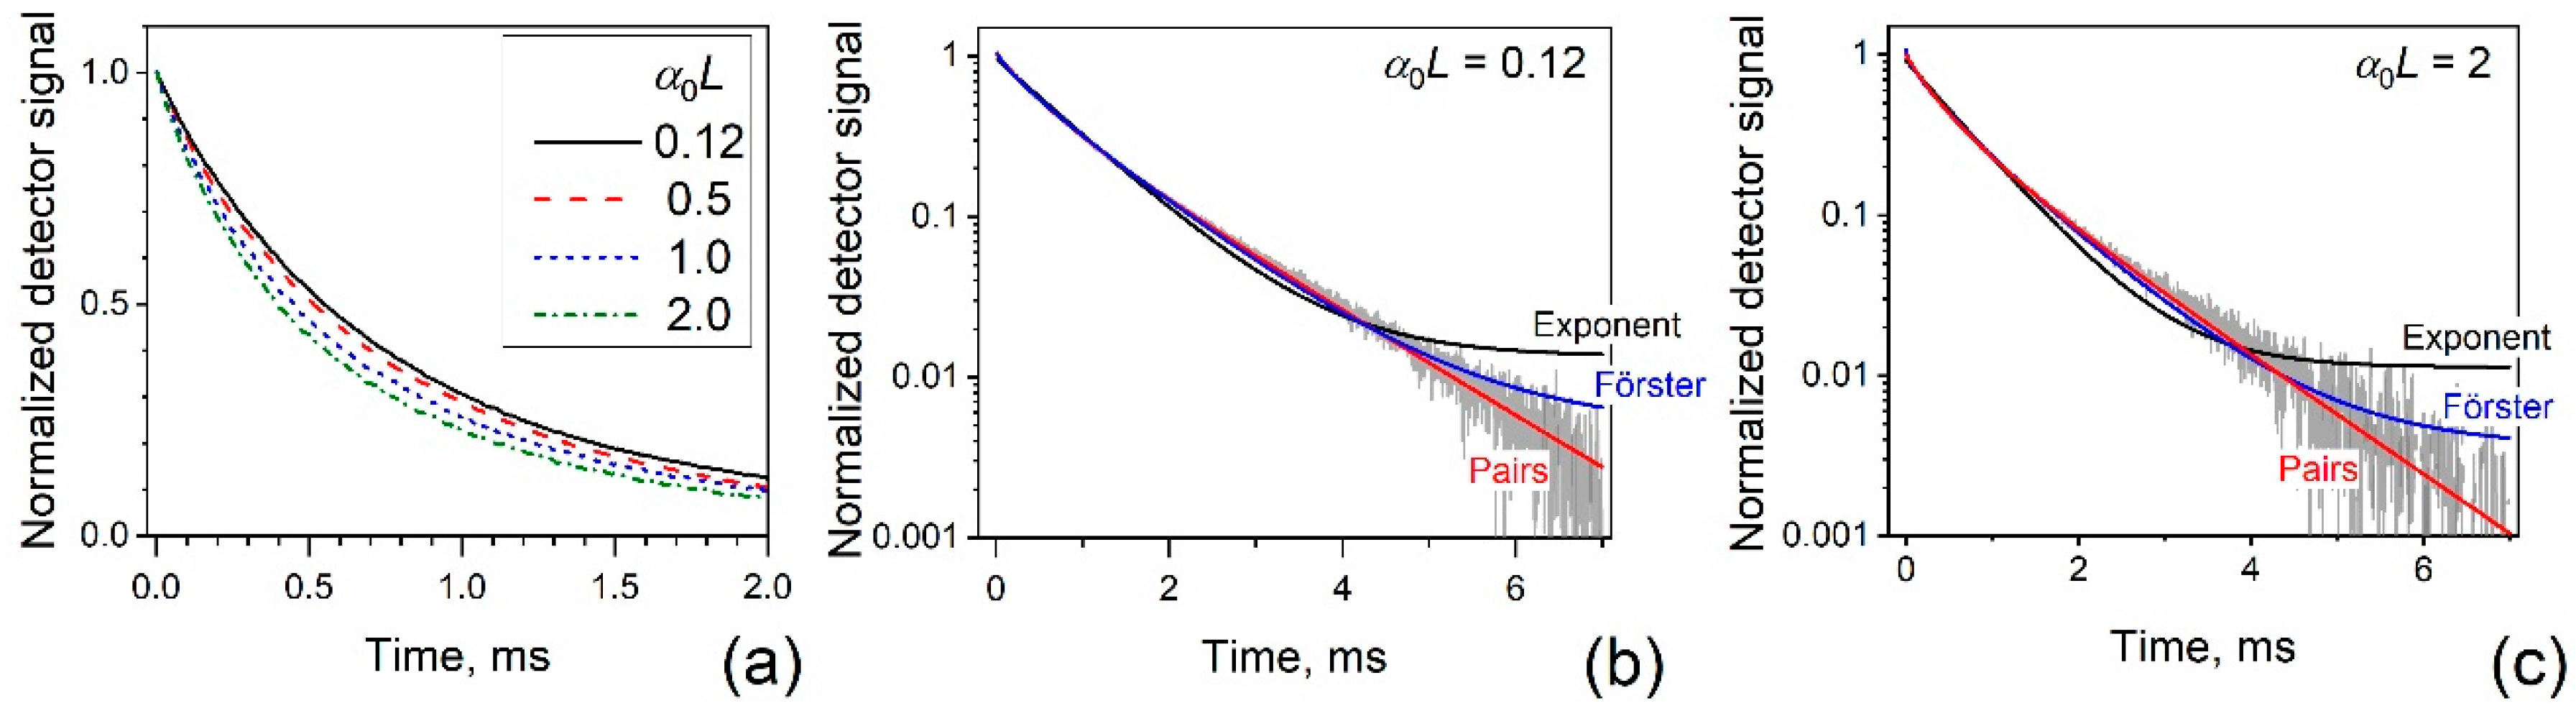
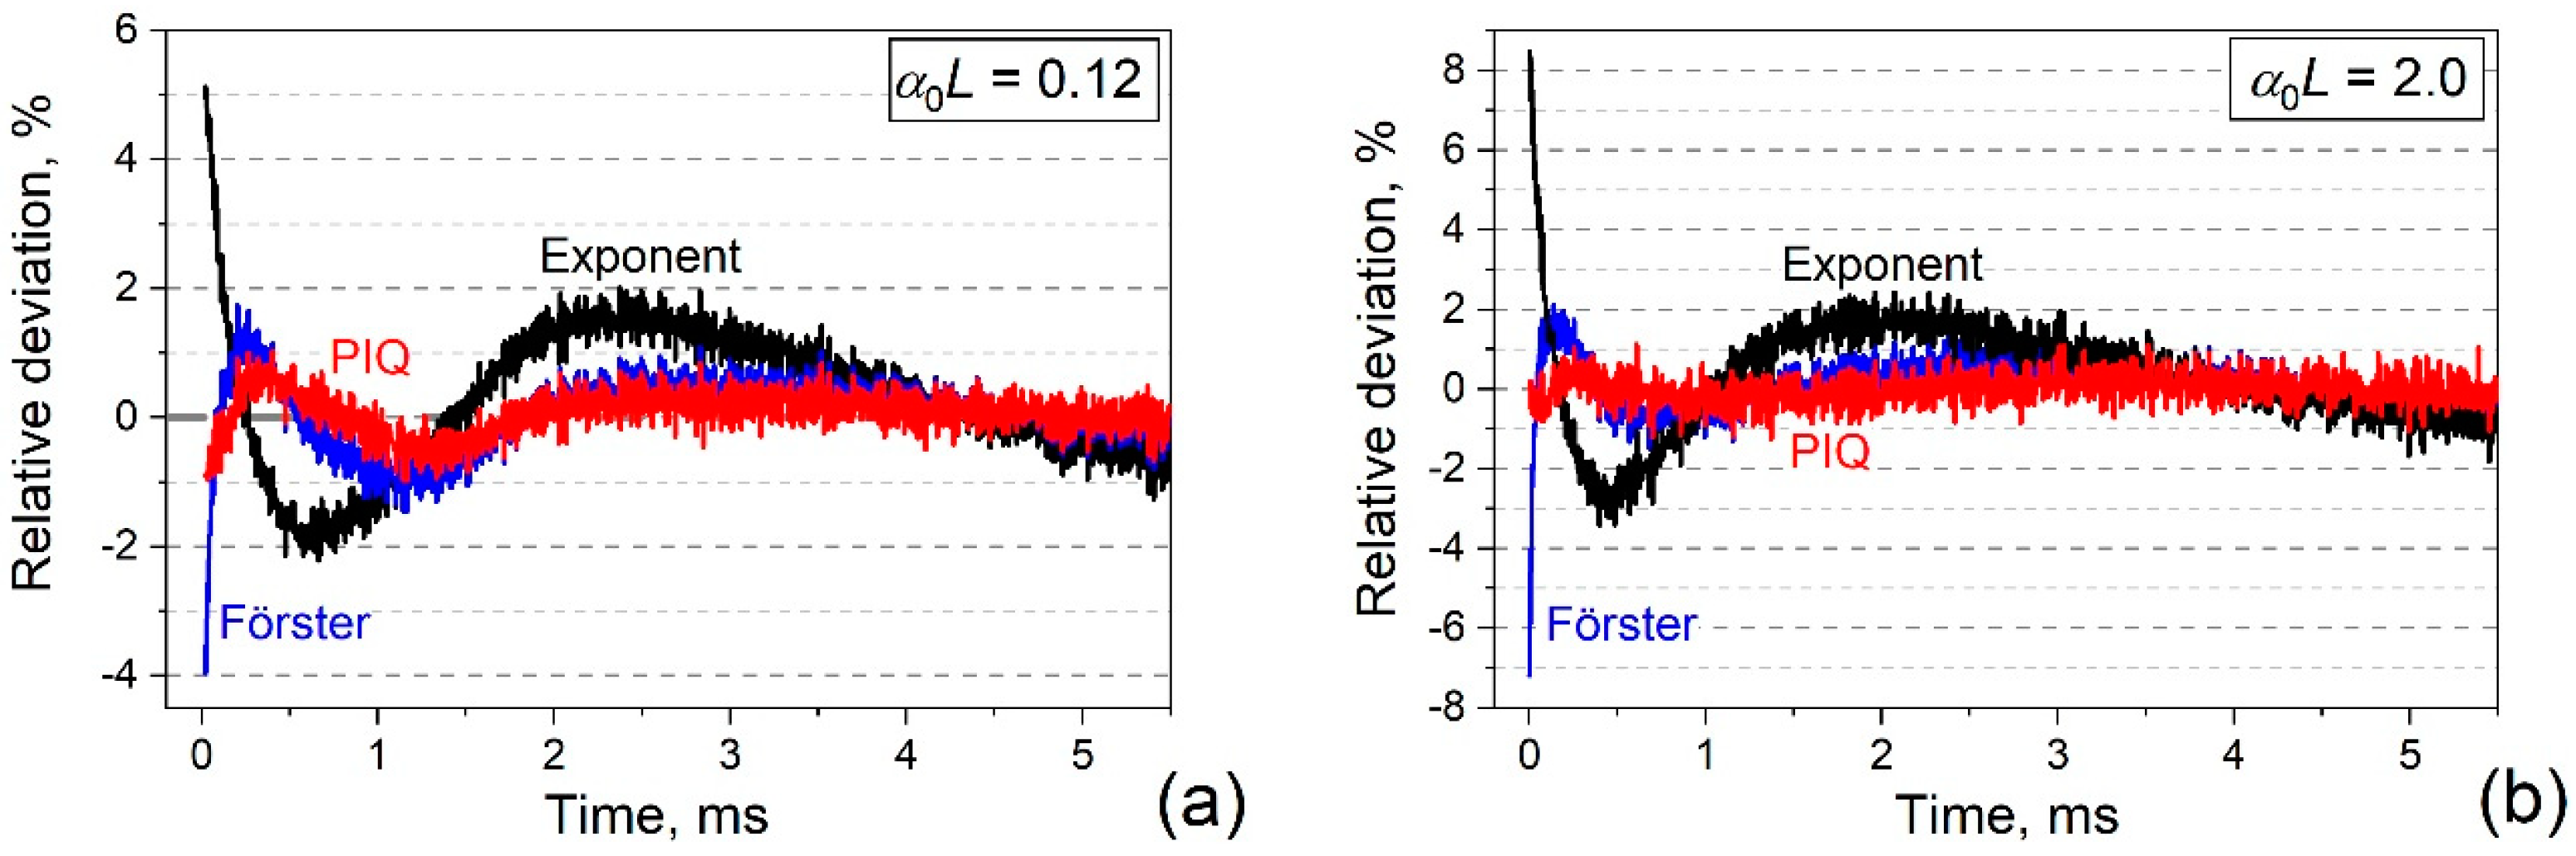
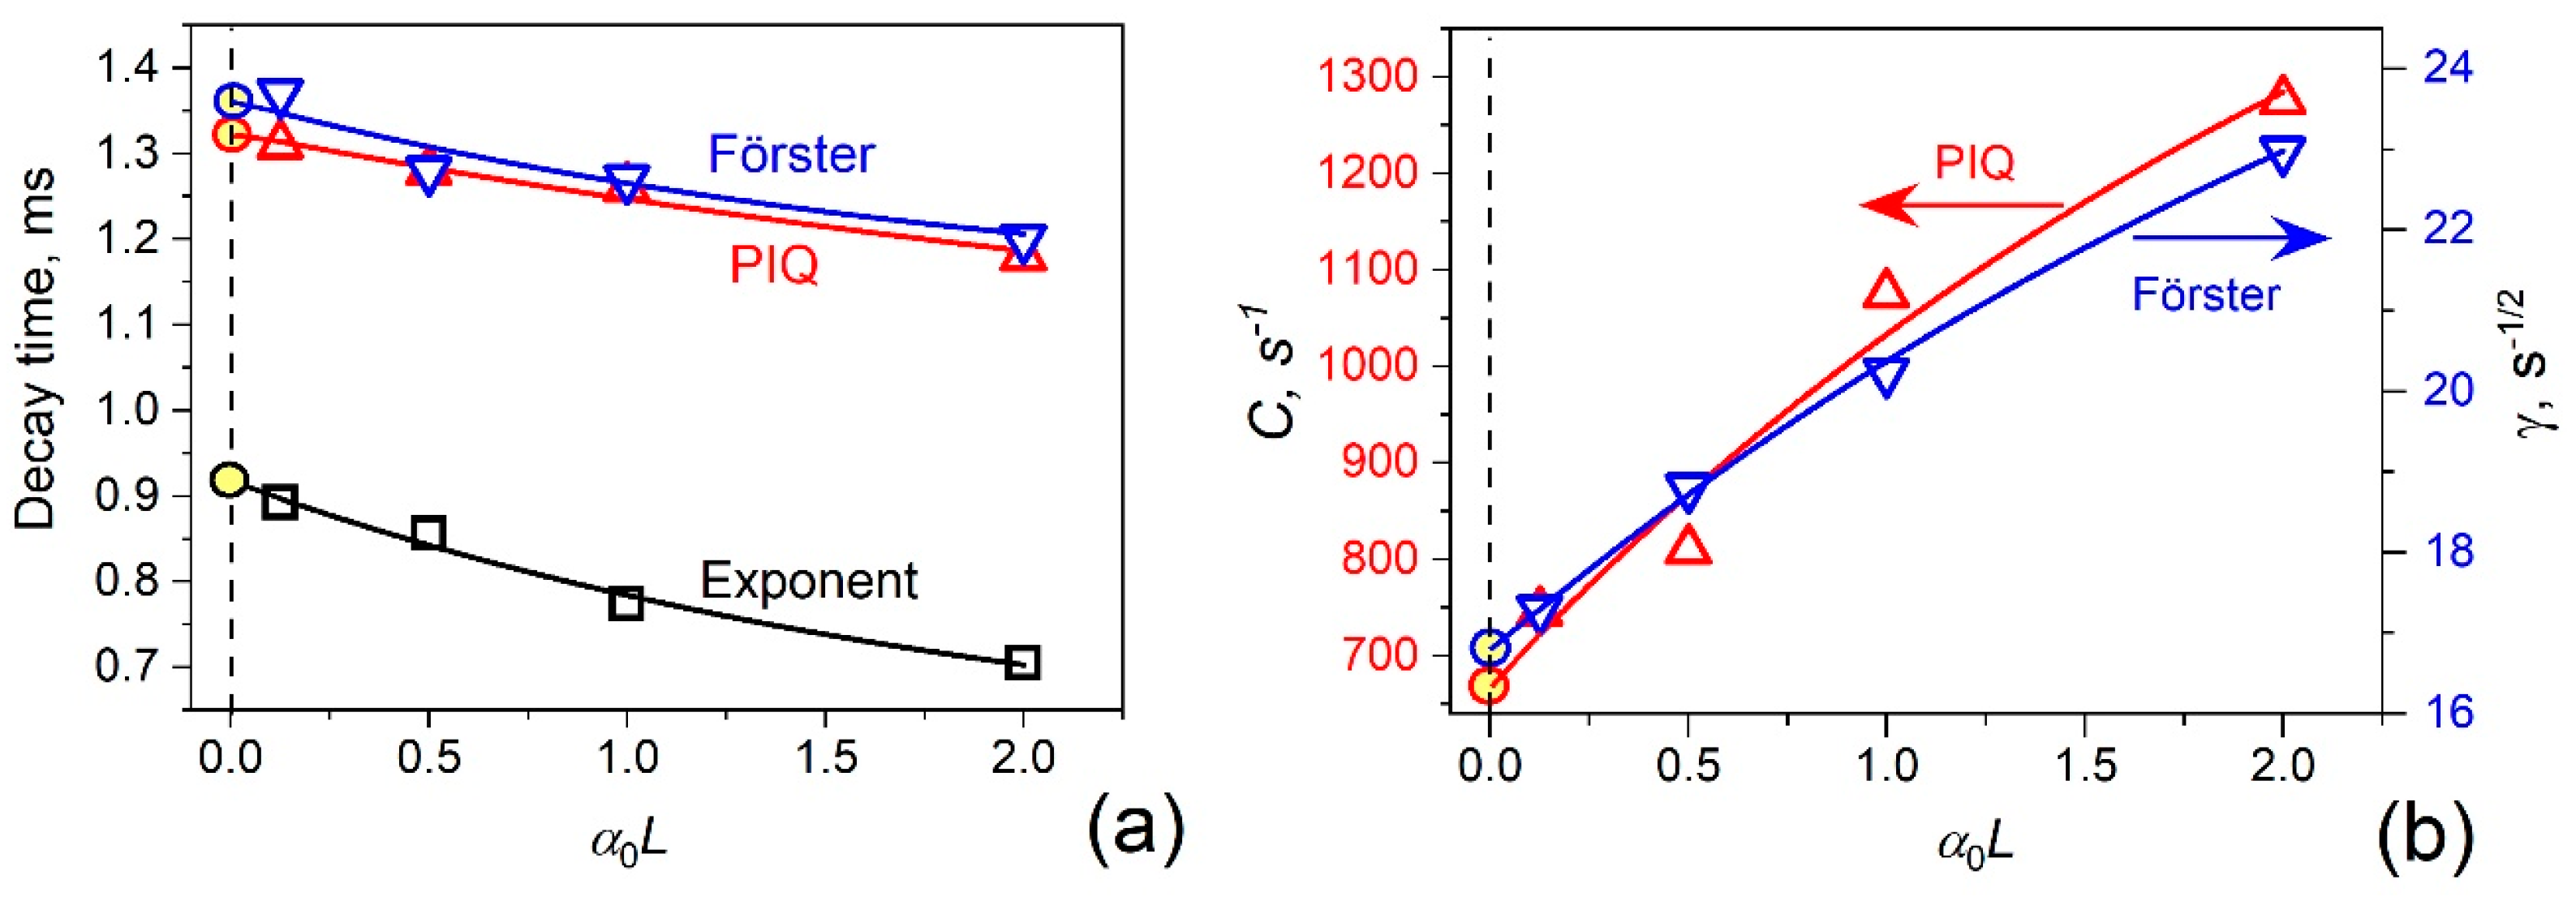
3.3. Experimental Results

Several approximations of fluorescence decay are used to measure fluorescence lifetime when the PIQ effect appears. The simplest one is using the exponent decay function, the result of which is demonstrated in Figure 3b and Figure 4b for the long and the high-doped fibers, respectively. It is seen that, depending on the experimental conditions (the fiber length and concentration of active ions), the measured lifetime can differ up to two times or more.
The second approximation is based on the Förster decay function. This approximation type was proposed when the distance between the interacted active ions varies, so the decay rate differs for each pair of ions. Thus, the fluorescence decay is not so exponential and is determined by the following formula [24]:
d n 2 ( t ) d t = n 2 ( 0 ) e x p t τ 2 + γ t
where γ is a constant (let us call it the Förster constant) that depends on the active ions’ concentration. If γ is small, the fluorescence decay is exponential. In contrast, the second term in the brackets dominates when t >> τ2, so the decay tail of this function is described by the centered super-Gaussian function different from the exponent.
The third approximation, based on PIQ, has already been discussed above.
The setup shown in Figure 2 (version (A)) measures the fluorescence relaxation from the HDF under study. The AOM connected to the pulse generator is applied to rapidly switch off the pump signal. Figure 5a shows the normalized fluorescence relaxation measured by the 2 µm photodetector for four HDF lengths: 1.3 cm, 5.5 cm, 11 cm, and 22 cm, which corresponds to α0L = 0.12, 0.5, 1.0, and 2.0, respectively (see the inset to this figure). From this figure, it is seen that the fluorescence decays faster when HDF is longer. Figure 5b,c demonstrate the fluorescence decay for two extreme cases: α0L = 0.12 (Figure 5b) and 2.0 (Figure 5c) (gray lines). The solid red and blue lines are the best fits by the exponent (black) and the Förster (blue) decay functions, respectively, whereas the red curve is the fit by the function shown in Equation (6), which considers the pair-induced quenching.
It is essential to compare the fitting result with deviations from the experimental decay; see Figure 6, which shows the deviations for the same values of α0L as Figure 5a,b demonstrate. The minimum deviation (less than 1%) is observed from the PIQ fitting function. In contrast, the maximum one corresponds to the single exponential function (about 5% and 8% for α0L equal 0.12 and 2.0, respectively). The maximum deviation by fitting using the Förster decay varies from about 4% at α0L = 0.12 to 7% at α0L = 0.2. The deviations at other values of α0L are within the ranges discussed here. The best fits are obtained using the PIQ fitting function.
Figure 7a shows the results of measuring the lifetime of the Ho3+ laser level for four fiber lengths. It is seen that the decay time drops with increasing fiber length for all types of decay functions. This effect results from the fact that in each short fiber segment through which photons generated in previous sections propagate, the absorption decreases exponentially, resulting in an apparent increase in the luminescence relaxation rate. The results obtained using the Förster and PIQ decay functions (1.33 ms and 1.36 ms, respectively) differ slightly by only 2 percent, whereas that obtained by the exponent fitting differs from them from 35% to up to two times (compare the point obtained with exponent fitting at α0L = 2.0 with the Förster or PIQ fits at α0L = 0). With further increasing the tested fiber length, this error dramatically grows. Note that here, as well as in the discussion below, the results obtained for different fiber lengths serve to extrapolate the fiber parameter under study to the value corresponding to α0L = 0.
Figure 7b demonstrates the results of measuring the HUC and the Förster constants. It is seen that these constants depend on the fiber length: they rapidly increase with α0L growth. This effect is explained by the fact that the fluorescence decays faster in more concentrated or longer fibers, creating the illusion of an increase in these constants relating to concentration issues. As is seen from Figure 7b, the HUC coefficient found for the HDF under study is about 700 s−1 and γ is 16.5 s−1/2 (the extrapolated values at α0L = 0).

4. The Pump Level Lifetime

This section will discuss the method used to estimate the lifetime of the Ho3+ pump level (see Figure 1a). Since the energy gap between the pump and laser holmium levels is relatively small, about 3500 cm−1, the transition between these two levels is purely photon-assisted, with a decay time of the order of microseconds [5]. In ref. [32], this time was considered to be 1.4 μs.
To measure τ3, the arrangement shown in Figure 2 (version (B)) is used, in which the function generator switches to the sine regime with biased output to modulate the AOM transmission. Thus, pump power Pp at the HDF input was sinusoidally modulated with frequency f and amplitude a, controlled by the function generator:
P p ( t ) = P p 0 1 + a c o s ω t
where ω = 2πf is the circular frequency. Mean pump power Pp0 determines the mean value of pump level population n30, whereas the alternative pump component defines the amplitude and the phase of the pump level modulation. By analogy with the integrating RC circuit, the amplitude of the modulated component of n3n3) can be written as follows:
Δ n 3 f = Δ n 3 ( 0 ) 1 + j ω τ 3
where Δn3(0) is the modulation amplitude of pump level n3 at a low frequency, and j is the imaginary unit. Thus, the holmium ions’ phonon transition from the pump to the laser level is modulated with the amplitude and phase described by Equation (7). The same reasoning is used for the calculation of the laser level population, which is populated by the phonon transition from the laser level:
Δ n 2 f = Δ n 2 ( 0 ) 1 + j ω τ 2 1 + j ω τ 3
Since SE measured from the HDF output is proportional to the pump level population, we can write the amplitude component of the SE modulation, which depends on the modulation frequency, as follows:
S E f = S E 0 1 + ω τ 2 2 1 + ω τ 3 2
where ΔSE(0) is the SE modulation amplitude at a low frequency (f << 1/τ2), and the phase delay is found as
Φ ω = Φ 2 ω + Φ 3 ω = atan ω τ 2 + a t a n ω τ 3
where Φ2 and Φ3 are the phase delays determined by the lifetimes of the laser and the pump levels.
Equations (9) and (10) permit one to estimate lifetime τ3 of the pump level using the frequency response of the SE modulation amplitude or the frequency-dependent phase delay between the pump and SE modulation signals. The second method is selected since modern digital oscilloscopes permit measuring the phase delay between two sinusoidally modulated electrical signals using the internal software. The length of the fiber piece was 22 cm (α0L = 2), at which the SE signal power was sufficient for detection, and the pump power at the HDF input was 300 mW.
Figure 8a demonstrates two sine signals measured at the input (curve 1) and from the output (curve 2) of the HDF piece under study; the signals were averaged by 1000 samples. In this example, the AOM modulation frequency f is 40 kHz. The phase delay was measured automatically by the oscilloscope. Figure 8b shows the phase delay in the broad range of frequencies, from 20 Hz to 160 kHz; the upper-frequency limit is chosen because, above this value, the modulation signal is too low for reliable measurements. It is seen that the phase delay evolution demonstrates two steps with increasing f: the first step (the yellow area marked as 1) corresponds to the phase delay arising due to the transition of the holmium ions from the laser level down to the ground level (5I75I8) and the second step (the green area marked as 2) to the transition from the pump level down to the laser level (5I65I7). Figure 8c shows the second step of the phase delay evolution. In this graph, the experimental values of the phase shift are fitted by the arctangent function, from which the lifetime of the pump level is obtained as 1.7 µs, which is by three orders less than τ2 found by SE decay analysis that takes into account fiber length and the PIQ process.

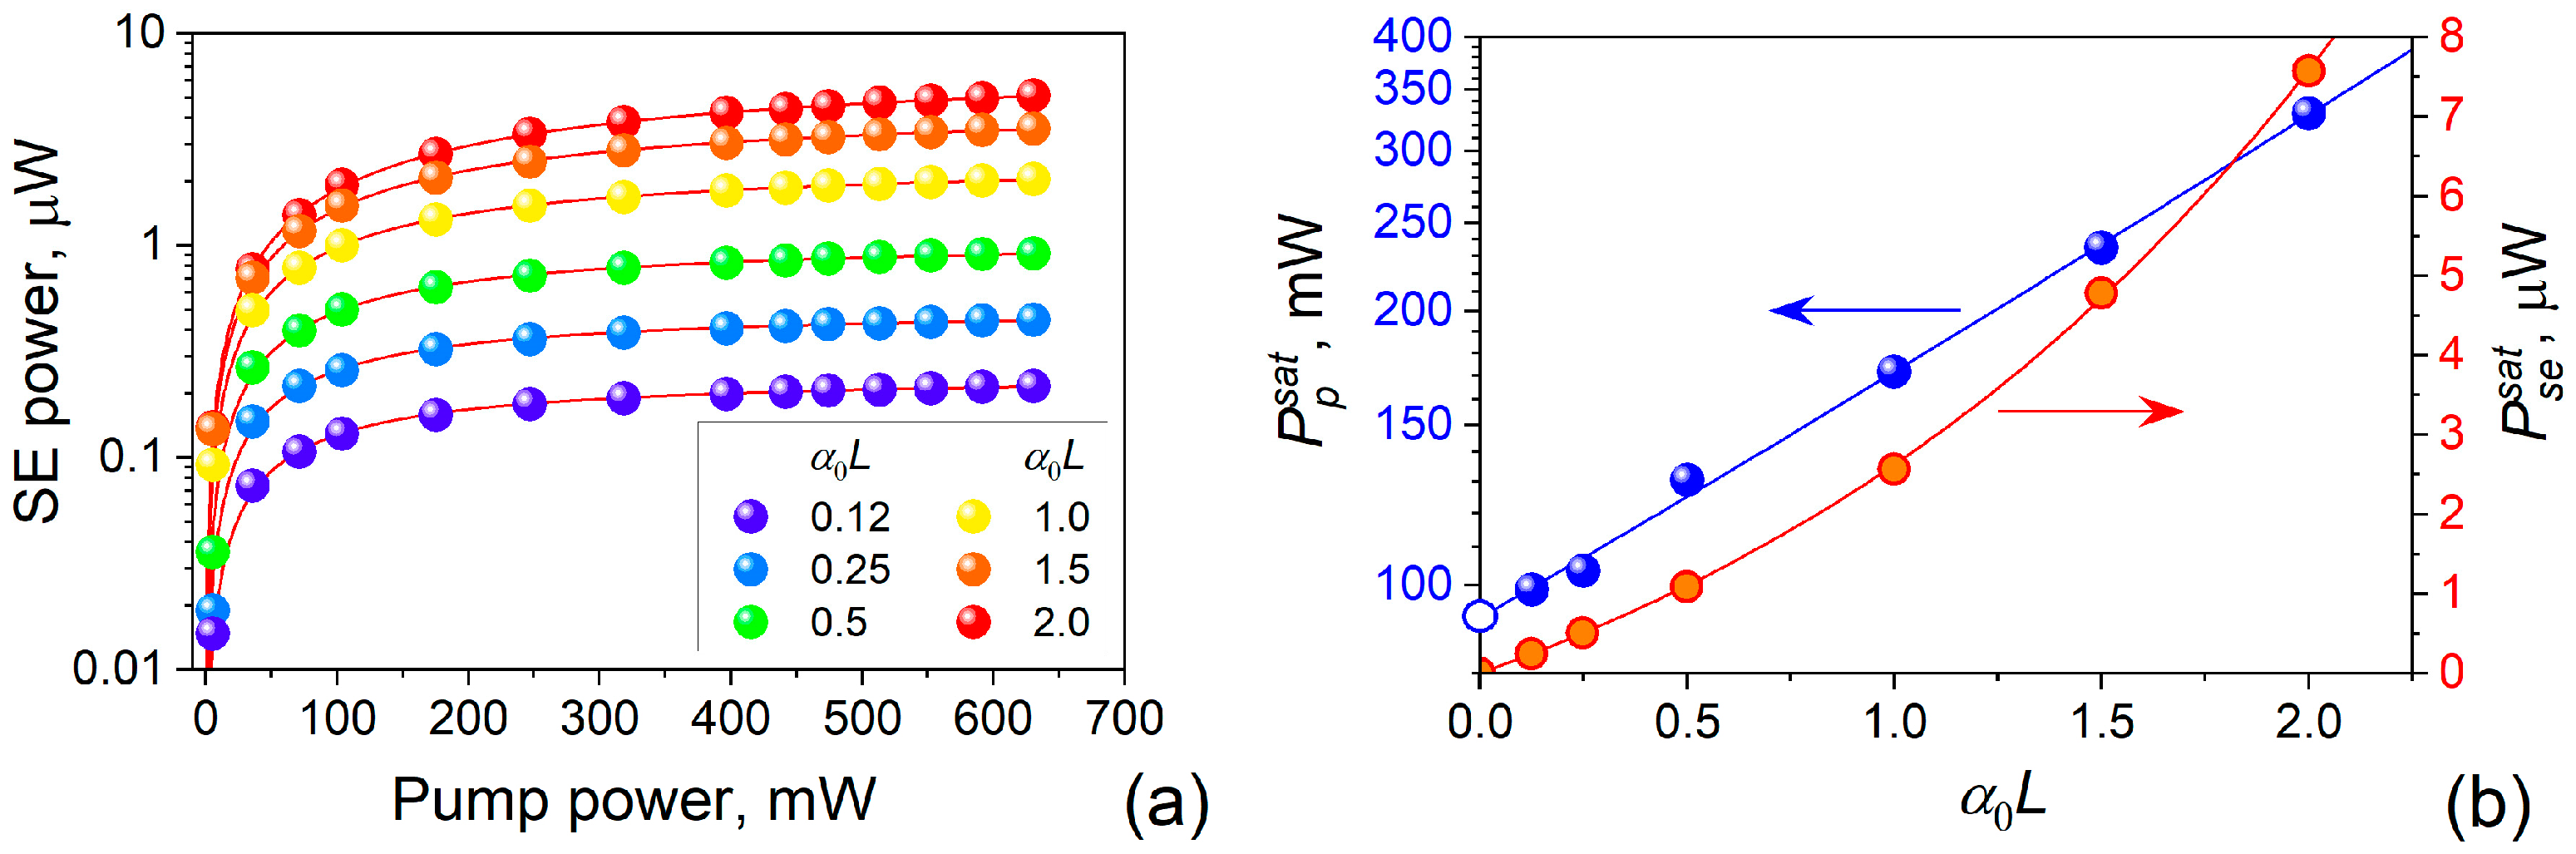
5. Saturation Powers

The pump saturation power and the SE saturated power of an amplifying fiber are important parameters that permit one to estimate the absorption cross-section and the concentration of the active ions. Experimentally, these parameters can be obtained by measuring the SE power (Pse) upon increasing the pump power (see Equation (2b)):
P s e = W n 2 W P p P p + P p s a t
where
P p s a t = ξ P p s = h ν p σ 13 τ 2 A p
This parameter corresponds to the pump power at which SE power is saturated, which permits one to obtain the absorption cross-sections at the pump and other essential wavelengths. In contrast, the saturated SE power allows for the estimation of the active ions’ concentration.
To measure the experimental dependence of SE power with growing pump power, we used the setup (B) shown in Figure 2, in which the bias voltage was applied to the AOM instead of the sinusoidal or rectangular signals. The results of the measurements are shown in Figure 9. The SE power was measured in the broad range of pump power, from 0 to 1W (see plot (a)). In this experiment, we used the 2 µm OSA (AQ6375) for measuring SE power from the HDF piece under study. The experimental data on SE power obtained at different fiber lengths were fitted by Equation (13a); the result of this procedure, shown by symbols in Figure 9b, was fitted by the exponent function, from which the saturation power at α0L = 0 (the yellow circle) was obtained: Ppsat(L = 0) = 0.95 mW. Another important parameter, the value of the SE power at the high pump, Psesat = 250 nW, was taken from the data obtained for the shortest HDF piece, for which α0L = 0.12. For even shorter HDF pieces, measuring SE power is not reliable.

6. Absorption Cross-Sections, Holmium Concentration, and Fluorescence Quantum Efficiency

HDF waveguide parameters from the manufacturer’s test report are the numerical aperture NA = 0.16 and the core radius a = 4 µm. From these data, one can obtain the overlap factor of the SE Gaussian field with the fiber core: Γse = 0.8. Since HDF is a multimode for the pump wavelength, we consider that Γp = 1. Using Equation (13b), one can easily calculate the absorption cross-section at the pump wavelength as σ13(λp) = pAp/(τ2Ppsat) = 0.8 × 10⁻²¹ cm2. Accounting for the values of the absorption peaks at 1150 nm and 1950 nm (see Figure 1b) and the corresponding overlap between factors and beams’ areas, the absorption cross-sections were obtained as follows: σ13 = 1.4 × 10⁻²¹ cm2 and σ12 = 2.8 × 10⁻²¹ cm2, correspondingly.
The absorption coefficient depends on the absorption cross-section, overlap factor, and concentration of the active ions: α0 = ΓSEσ12N0. From this relation, one can obtain the holmium concentration as N0 = 4.05 × 1019 cm−3.
An essential parameter for laser optimization is the quantum efficiency of the laser level η (see Equation (4b)), defined as the ratio of the number of photon-assisted transitions from the laser level to the ground state to the total number of transitions. This parameter is found when η = Pse/W, where Pse = 250 nW is the SE power measured at the output of the short fiber piece (L = 1.3 cm), and W is the calculated value of the SE power when the phonon transitions are not considered (Equation (4b)). For the HDF under study, the fluorescence quantum efficiency from the laser level is 4.5%. Such a low QE is explained by the long radiative lifetime of the holmium laser level, of about 16 ms, see ref. [32], which results in a relatively high threshold pump of lasing and reduced laser efficiency.
Note that the discussed parameters of holmium ions in silica fiber are obtained assuming that the core diameter and NA of the HDF under study correspond to the mean values specified by the manufacturer, which can vary from fiber to fiber in the interval of ±12.5%.

7. Conclusions

In this paper, the technique for characterizing holmium-doped silica fiber (HDF) is discussed. An acousto-optical modulator (AOM) was applied to control the output power of the ytterbium-doped fiber laser (YDFL) operating at 1134.5 nm, which was used for the in-core pumping of a piece of a commercial HDF under test. The effects of the fiber length and the concentration-dependent pair-induced quenching (PIQ) of holmium ions were considered. It was demonstrated that using the proposed technique, the HDF absorption spectrum, and the pump and spontaneous emission saturation powers, one can obtain the essential characteristics of the active fiber, such as the lifetimes of the laser and pump energy levels, the absorption cross-sections for transitions to the laser and pump levels, the effective active ions’ concentration, the homogeneous up-conversion coefficient, and the fluorescence quantum efficiency.
It is shown that the length of the HDF piece under test is a crucial parameter affecting dramatically the results of the lifetime measuring: the longer the fiber under test, the smaller the fluorescence lifetime value. The error in the measured lifetime obtained after exponential fitting of the fluorescence decay can reach the values from ten percent to two times or even more, depending on how long the fiber under test is. This problem originates from HDF’s small fluorescence quantum efficiency and the low sensitivity of two-micron photodetectors, which results in using long fibers for reliable SE signal detection. To overcome this problem, measuring the lifetime for different fiber lengths with the subsequent extrapolation of the obtained data to zero length was proposed. Since the effect of ion pairs strongly influences the results of measuring the fluorescence lifetime, the fitting function that considers pair-induced quenching (PIQ) was applied for this study. Apart from the lifetime, this method permits one to derive the homogeneous up-conversion coefficient significant for modeling heavily doped fiber lasers.
Based on the experimental absorption spectrum, the fluorescence lifetime, and the saturation powers, one can obtain such important HDF parameters as the absorption cross-sections for transitions to the laser and pump levels, the effective active ions’ concentration, and the fluorescence quantum efficiency.
The technique proposed for HDF characterization can be used for any moderately and heavily doped active fibers, in which the PIQ effect is significant and/or when the fiber length is long. For example, in double-clad (DC) active fibers, the concentration of the active ions is high to increase the fiber-clad absorption for multimode pumping. Moreover, in the case of two-micron fiber lasers, the high-concentrated active fibers (both DC and single-clad) are used to shorten the laser cavity, which reduces the influence of the infrared absorption inherent in silica glass fibers at two microns and beyond. It is also demonstrated that the HDFL performance depends dramatically on the concentration issue: both the pump threshold and the laser efficiency are influenced by the active fiber length and the active ions’ concentration [24,33,42]. Thus, one can conclude that an optimum between the active ion concentration and the active fiber length exists, at which the additional loss introduced by the active ions’ pairs and clusters are in balance with the passive fiber loss originating from the fundamental infrared absorption in silicate fiber.
The active fiber parameters obtained using the proposed technique permit one to correctly simulate fiber lasers for further optimization, after which the laser efficiency and output power reach a maximum.

Author Contributions

Conceptualization, supervision, and writing—original draft preparation and editing, Y.B.; investigation, methodology, and data analysis, P.M.-C. and J.-L.C.; writing—review and editing, funding acquisition, M.V.A. All authors have read and agreed to the published version of the manuscript.

Funding

This work was partly supported by the CONAHCyT, Mexico (Project No. CF-2023-I-2431), and the Generalitat Valenciana, Spain (CIPROM/2022/30). P.M.C. acknowledges financial support from CONAHCyT, Mexico, as part of the “Postdoctoral Fellowships for Mexico” (CVU 700792).

Institutional Review Board Statement

Not applicable.

Informed Consent Statement

Informed consent was obtained from all subjects involved in the study.

Data Availability Statement

The data supporting the findings of this study are available within the article.

Conflicts of Interest

The authors declare no conflicts of interest.

References

  1. Louot, C.; Sanson, F.; Motard, A.; Ibach, T.; Manek-Hönninger, I.; Berrou, A.; Dalloz, N.; Robin, T.; Cadier, B.; Hildenbrand-Dhollande, A. Emission Wavelength Limits of a Continuous-Wave Thulium-Doped Fiber Laser Source Operating at 1.94 µm, 2.09 µm or 2.12 µm. Photonics 2024, 11, 246. [Google Scholar] [CrossRef]
  2. Holmen, L.G.; Shardlow, P.C.; Barua, P.; Sahu, J.K.; Simakov, N.; Hemming, A.; Clarkson, W.A. Tunable holmium-doped fiber laser with multiwatt operation from 2025 nm to 2200 nm. Opt. Lett. 2019, 44, 4131–4134. [Google Scholar] [CrossRef] [PubMed]
  3. Antipov, S.O.; Kamynin, V.A.; Medvedkov, O.I.; Marakulin, A.V.; Minashina, L.A.; Kurkov, A.S.; Baranikov, A.V. Holmium fibre laser emitting at 2.21 µm. Quant. Electron. 2013, 43, 603–604. [Google Scholar] [CrossRef]
  4. Layne, C.B.; Lowdermilk, W.H.; Weber, M.J. Multiphonon relaxation of rare-earth ions in oxide glasses. Phys. Rev. B 1977, 16, 10–20. [Google Scholar] [CrossRef]
  5. Digonnet, M.J.F. Rare-Earth-Doped Fiber Lasers and Amplifiers, 2nd ed.; Marcel Dekker, Inc.: New York, NY, USA, 2001; Chapter 2. [Google Scholar] [CrossRef]
  6. Vladimirskaya, A.D.; Kamynin, V.A.; Lobach, I.A. Single-Frequency Holmium-Doped Fiber Laser with Saturable Absorber. In Proceedings of the IEEE of 23rd International Conference of Young Professionals in Electron Devices and Materials (EDM), Altai, Russia, 30 June–4 July 2022; IEEE: New York, NY, USA, 2022; pp. 360–363. [Google Scholar] [CrossRef]
  7. Chamorovskiy, A.Y.; Marakulin, A.V.; Kurkov, A.S.; Leinonen, T.; Okhotnikov, O.G. High-Repetition-Rate Q-Switched Holmium Fiber Laser. IEEE Photonics J. 2012, 4, 679–683. [Google Scholar] [CrossRef]
  8. Lee, J.; Lee, J.H. A Passively Q-Switched Holmium-Doped Fiber Laser with Graphene Oxide at 2058 nm. Appl. Sci. 2021, 11, 407. [Google Scholar] [CrossRef]
  9. Ahmad, H.; Ismail, N.N.; Aidit, S.N.; Reduan, S.A.; Samion, M.Z.; Yusoff, N. 2.08 µm Q-switched holmium fiber laser using niobium carbide-polyvinyl alcohol (Nb2C-PVA) as a saturable absorber. Opt. Commun. 2021, 490, 126888. [Google Scholar] [CrossRef]
  10. Wu, K.S.; Ottaway, D.; Munch, J.; Lancaster, D.G.; Bennetts, S.; Jackson, S.D. Gain-switched holmium-doped fibre laser. Opt. Express 2009, 17, 20872–20877. [Google Scholar] [CrossRef]
  11. Pal, D.; Sen, R.; Pal, A. Gain Switched All-Fiber Holmium Laser at 2.1 micron. In Proceedings of the IEEE Workshop on Recent Advances in Photonics (WRAP), Hyderabad, India, 18–19 December 2017; IEEE: New York, NY, USA, 2017; pp. 1–2. [Google Scholar] [CrossRef]
  12. Wang, J.; Han, J.; He, J.; Liao, C.; Wang, Y. High-energy mode-locked holmium-doped fiber laser operating in noise-like pulse regime. Opt. Lett. 2019, 44, 4491–4494. [Google Scholar] [CrossRef]
  13. Hu, P.; Mao, J.; Zhou, X.; Feng, T.; Nie, H.; Wang, R.; Zhang, B.; Li, T.; He, J.; Yang, K. Multiple soliton mode-locking operations of a Holmium-doped fiber laser based on nonlinear polarization rotation. Opt. Laser Technol. 2023, 161, 109218. [Google Scholar] [CrossRef]
  14. Tu, L.; Tang, Z.; Li, K.; Wang, J.; Lin, H.; Zhang, W.; Lue, Q.; Guo, C.; Ruan, S. All-polarization-maintaining mode-locked Holmium-doped fiber laser based upon nonlinear polarization evolution. Infrared Phys. Technol. 2024, 136, 105054. [Google Scholar] [CrossRef]
  15. Ahmad, H.; Kamaruzzaman, K.; Samion, M.Z.; Ithnahaini, M.U.M.; Zulkifli, M.Z. Mode-locking in holmium doped fiber laser operating at 2.06 µm using manganese violet. Opt. Quant. Electron. 2024, 56, 1091. [Google Scholar] [CrossRef]
  16. Taylor, J.H.; Yates, H.W. Atmospheric Transmission in the Infrared. J. Opt. Soc. Am. 1957, 47, 223–226. [Google Scholar] [CrossRef]
  17. Lin, P.; Wang, T.; Ma, W.; Chen, J.; Jiang, Z.; Yu, C. 2-μm Free-Space Data Transmission Based on an Actively Mode-Locked Holmium-Doped Fiber Laser. IEEE Photonics Technol. Lett. 2020, 32, 223–226. [Google Scholar] [CrossRef]
  18. Kopyeva, M.S.; Filatova, S.A.; Kamynin, V.A.; Trikshev, A.I.; Kozlikina, E.I.; Astashov, V.V.; Loschenov, V.B.; Tsvetkov, V.B. Ex-Vivo Exposure on Biological Tissues in the 2-μm Spectral Range with an All-Fiber Continuous-Wave Holmium Laser. Photonics 2022, 9, 20. [Google Scholar] [CrossRef]
  19. Shi, W.; Fang, Q.; Zhu, X.; Norwood, R.A.; Peyghambarian, N. Fiber lasers and their applications [Invited]. Appl. Opt. 2014, 53, 6554–6568. [Google Scholar] [CrossRef] [PubMed]
  20. Refaat, T.F.; Singh, U.N.; Yu, J.; Petros, M.; Ismail, S.; Kavaya, M.J.; Davis, K.J. Evaluation of an airborne triple-pulsed 2  μm IPDA lidar for simultaneous and independent atmospheric water vapor and carbon dioxide measurements. Appl. Opt. 2015, 54, 1387–1398. [Google Scholar] [CrossRef]
  21. Caron, J.; Durand, Y. Operating wavelengths optimization for a spaceborne lidar measuring atmospheric CO2. Appl. Opt. 2009, 48, 5413–5422. [Google Scholar] [CrossRef]
  22. Olowinsky, A.; Rösner, A. Laser Welding of Polymers: Established process but still not at its best. Laser Tech. J. 2012, 9, 52–56. [Google Scholar] [CrossRef]
  23. Beaumont, B.; Bourdon, P.; Barnini, A.; Kervella, L.; Robin, T.; Le Gouët, L. High Efficiency Holmium-Doped Triple-Clad Fiber Laser at 2120 nm. J. Lightw. Technol. 2022, 40, 6480–6485. [Google Scholar] [CrossRef]
  24. Le Gouët, J.; Gustave, F.; Bourdon, P.; Robin, T.; Laurent, A.; Cadier, B. Realization and simulation of high-power holmium doped fiber lasers for long-range transmission. Opt. Express 2020, 28, 22307–22320. [Google Scholar] [CrossRef] [PubMed]
  25. Kir’yanov, A.V.; Barmenkov, Y.O.; Villegas-Garcia, I.L.; Cruz, J.L.; Andres, M.V. Highly Efficient Holmium-Doped All-Fiber ∼2.07-μm Laser Pumped by Ytterbium-Doped Fiber Laser at ~1.13 μm. IEEE J. Select. Top. Quant. Electron. 2018, 24, 0903108. [Google Scholar] [CrossRef]
  26. Jin, X.; Lou, Z.; Chen, Y.; Zhou, P.; Zhang, H.; Xiao, H.; Liu, Z. High-power dual-wavelength Ho-doped fiber laser at >2 μm tandem pumped by a 1.15 μm fiber laser. Sci. Rep. 2017, 7, 42402. [Google Scholar] [CrossRef]
  27. Alharbi, A.G.; Kanwal, F.; Ghafoor, S.; Habib, N.; Kanwal, B.; Atieh, A.; Kousar, T.; Mirza, J. Performance Optimization of Holmium Doped Fiber Amplifiers for Optical Communication Applications in 2–2.15 μm Wavelength Range. Photonics 2022, 9, 245. [Google Scholar] [CrossRef]
  28. Hemming, A.; Simakov, N.; Davidson, A.; Bennetts, S.; Hughes, M.; Carmody, N.; Davies, P.; Corena, L.; Stepanov, D.; Haub, J.; et al. A monolithic cladding pumped holmium-doped fibre laser. In Proceedings of the 2013 Conference on Lasers and Electro-Opics, San Jose, CA, USA, 9–14 June 2013. [Google Scholar] [CrossRef]
  29. Hemming, A.; Simakov, N.; Oermann, M.; Carter, A.; Haub, J. Record efficiency of a holmium-doped silica fibre laser. In Proceedings of the Conference on Lasers and Electro-Optics (CLEO), San Jose, CA, USA, 5–10 June 2016; pp. 1–2. Available online: https://ieeexplore.ieee.org/document/7788732 (accessed on 19 December 2016).
  30. Wang, X.; Hu, L.; Xu, W.; Wang, S.; Zhang, L.; Yu, C.; Chen, D. Spectroscopic properties of Ho3+ and Al3+ co-doped silica glass for 2-μm laser materials. J. Lumin. 2015, 166, 276–281. [Google Scholar] [CrossRef]
  31. Edvardsen, A.W.; Holmen, L.G. Kinetics of pair-induced quenching in holmium-doped optical fibers. Opt. Express 2024, 32, 13166–13180. [Google Scholar] [CrossRef]
  32. Jackson, S.D. The spectroscopic and energy transfer characteristics of the rare earth ions used for silicate glass fibre lasers operating in the shortwave infrared. Laser Photonics Rev. 2009, 3, 466–482. [Google Scholar] [CrossRef]
  33. Kamrádek, M.; Kašík, I.; Aubrecht, J.; Mrázek, J.; Podrazký, O.; Cajzl, J.; Vařák, P.; Kubeček, V.; Peterka, P.; Honzátko, P. Nanoparticle and Solution Doping for Efficient Holmium Fiber Lasers. IEEE Photonics J. 2019, 11, 7103610. [Google Scholar] [CrossRef]
  34. Ryabochkina, P.A.; Chabushkin, A.N.; Kosolapov, A.F.; Kurkov, A.S. Absorption and luminescence characteristics of 5I75I8 transitions of the holmium ion in Ho3+-doped aluminosilicate preforms and fibres. Quant. Electron. 2015, 45, 102–104. [Google Scholar] [CrossRef]
  35. Walsh, B.M. Judd-Ofelt theory: Principles and practices. In Advances in Spectroscopy for Lasers and Sensing; Di Bartolo, B., Forte, O., Eds.; Springer: Dordrecht, The Netherlands, 2006. [Google Scholar] [CrossRef]
  36. Jarabo, S.; Álvarez, J.M. Experimental cross sections of erbium-doped silica fibers pumped at 1480 nm. Appl. Opt. 1998, 37, 2288–2295. [Google Scholar] [CrossRef]
  37. Barmenkov, Y.O.; Kir’yanov, A.V.; Miguel, V.; Andrés, M.V. Spectroscopic properties of holmium-aluminum-germanium co-doped silica fiber. Fiber Integr. Opt. 2020, 39, 185–202. [Google Scholar] [CrossRef]
  38. Kamrádek, M.; Kašík, I.; Aubrecht, J.; Mrázek, J.; Podrazký, O.; Cajzla, J.; Vařák, P.; Kubeček, V.; Peterka, P.; Honzátko, P. Holmium-doped optical fibers for efficient fiber lasers. In Proceedings of the SPIE of Photonics Europe, Strasbourg, France, 6–10 April 2020; Volume 11355, p. 113550. [Google Scholar] [CrossRef]
  39. Berkdemir, C.; Özsoy, S. The Effects of Complex Energy Transfer Dynamics and Gaussian Profiles on the Performance of High-Concentration EDFAs. J. Lightw. Technol. 2009, 27, 4642–4649. [Google Scholar] [CrossRef]
  40. Kir’yanov, A.V.; Barmenkov, Y.O.; Sandoval-Romero, G.E.; Escalante-Zarate, L. Er3+ Concentration Effects in Commercial Erbium-Doped Silica Fibers Fabricated Through the MCVD and DND Technologies. IEEE J. Quant. Electron. 2013, 49, 511–521. [Google Scholar] [CrossRef]
  41. Kir’yanov, A.V.; Dvoyrin, V.V.; Mashinsky, V.M.; Barmenkov, Y.O.; Dianov, E.M. Nonsaturable absorption in alumino-silicate bismuth-doped fibers. J. Appl. Phys. 2011, 109, 023113. [Google Scholar] [CrossRef]
  42. Huang, C.; Tang, Y.; Wang, S.; Zhang, R.; Zheng, J.; Xu, J. Theoretical Modeling of Ho-Doped Fiber Lasers Pumped by Laser-Diodes Around 1.125 µm. J. Lightw. Technol. 2012, 30, 3235–3240. [Google Scholar] [CrossRef]
Figure 1. (a) Energy levels’ diagram of Ho3+ ion. Each level is marked by a number starting from the ground level and a designation relating to the ion–electron configuration. The solid and dash lines show the photon and phonon transitions, respectively. (b) HDF absorption spectrum measured by the 1 µm OSA (AQ6370B, the left curve) and by the 2 µm OSA (AQ6375, the right curve).
Photonics 11 01043 g001
Figure 2. An experimental setup used to measure the decay times from the pump and laser levels of holmium ions. The cross is a fiber splice. A 7°-fiber cut placed in the immersion liquid reduces the possible reflections. AOM driver is controlled by the pulse generator (A) or by the Function generator (B).
Photonics 11 01043 g002
Figure 3. Normalized fluorescent power vs. normalized time. The inset shows values of α0L at which the curves were simulated. (b) The decay constants normalized to the lifetime τ2 found from the curves shown in (a) for the decay beginning (0 to 0.25τ2) and in the large time interval (0 to 3τ2). Symbols are simulated values, and curves are the exponential fits.
Photonics 11 01043 g003
Figure 4. (a) Examples of the SE decay simulated for different values of 2 (see inset) using Equation (6). (b) Lifetime values obtained from the SE decay curves shown in plot (a) using the exponential fitting. Symbols are the simulated values, and the curves are fits. Spheres and triangles correspond to the fits for the large (0 to 4τ2) and the short (0 to 0.25τ2) time intervals, respectively.
Photonics 11 01043 g004
Figure 5. (a) Normalized fluorescence decay signal measured from HDF with four different values of α0L (see inset). (b,c) Normalized fluorescence decay signals measured when (b) α0L = 0.12 and (c) α0L = 2. The solid lines are the best fits by the exponent (black), the Förster approximation (blue), and the function that considers PIQ (Equation (4)).
Photonics 11 01043 g005
Figure 6. The relative deviation of the fitting functions from the experimental decay. (a) α0L = 0.12, (b) α0L = 2.0. The type of fitting function is marked near each fitting curve.
Photonics 11 01043 g006
Figure 7. (a) Lifetime obtained using three decay functions (exponent, Förster, and PIQ) vs. α0L; triangles and squares are the experimental points. (b) The HUC coefficient and the Förster constant vs. α0L. Triangles are the experimental points. In both graphs, the lines are exponential fits, and the circles show the values at α0L = 0, obtained by interpolating the fitting curves.
Photonics 11 01043 g007
Figure 8. (a) The photodetector electrical signals measured at the HDF input (red curve 1, the left scale) and output (blue curve 2, the right scale). The red and blue curves are the sine fittings, and the gray curves correspond to experimental data. (b) The phase delay measured in the frequency range from 20 Hz to 160 kHz. Areas 1 and 2 correspond to the first and the second steps of the phase delay evolution. (c) The phase delay evolution that corresponds to the holmium transition from the pump level down to the laser level. The circles are experimental data, whereas the solid line is the fit. The dashed line represents the same approximation at frequencies where the phase delay was not measured. The vertical axis was shifted down by the value to which the first stage of the phase shift evolution tended towards (horizontal dashed line in plot (b)).
Photonics 11 01043 g008
Figure 9. (a) SE/ASE powers measured from HDF pieces with different α0L (see inset) vs. pump power at 1134.5 nm. The symbols are experimental points, and the solid lines are fittings by the saturation function shown by Equation (13a). (b) Ppsat (left scale) and Ppsat (right scale) obtained as a result of fitting the experimental data from the plot (a). In the first case, the exponent function fits the data (linear for the semi-log plot shown). The point at α0L = 0 is obtained by extrapolating the fitting line. In the second case, the data are fit by the shifted exponent function so that it is equal to zero at α0L = 0.
Photonics 11 01043 g009
Disclaimer/Publisher’s Note: The statements, opinions and data contained in all publications are solely those of the individual author(s) and contributor(s) and not of MDPI and/or the editor(s). MDPI and/or the editor(s) disclaim responsibility for any injury to people or property resulting from any ideas, methods, instructions or products referred to in the content.

