Article

Far-Detuning Laser Frequency Disturbance Suppression for Atomic Sensor Based on Intrinsic Fiber Fabry–Pérot Cavity

1
School of Instrumentation and Optoelectronic Engineering, Beihang University, Beijing 100191, China
2
Institute of Large-scale Scientific Facility and Centre for Zero Magnetic Field Science, Beihang University, Beijing 100191, China
3
National Institute of Extremely-Weak Magnetic Field Infrastructure, Hangzhou 310028, China
4
College of Metrology Measurement and Instrument, China Jiliang University, Hangzhou 314423, China
*
Authors to whom correspondence should be addressed.
Photonics 2024, 11(11), 1027; https://doi.org/10.3390/photonics11111027
Submission received: 7 October 2024 / Revised: 28 October 2024 / Accepted: 28 October 2024 / Published: 30 October 2024
(This article belongs to the Special Issue Optically Pumped Magnetometer and Its Application)

Abstract

:
The method of laser far-detuned frequency locking is proposed based on a fiber Fabry–Perot cavity which transfers the ultra-stable atomic reference frequency stability to the target laser utilized for atomic sensors. The control transfer function of the closed-loop system is established to elucidate the process of perturbation suppression. It is illustrated that this method is robust against the disturbance to the laser and cavity by controlling the cavity with different parameters. After the long-term experimental test, the stability of the laser frequency locked on the fiber cavity achieves an Allan deviation of 9.9 × 10 11 and the detuning of the nearest atomic frequency resonance point is more than 200 GHz. Its stability and detuning value exceed previous reports.

Graphical Abstract

1. Introduction

The latest generation of ultra-high-sensitivity quantum sensors, exemplified by atomic magnetometers and gyroscopes, are pivotal for measuring biological and Earth magnetic fields, as well as inertial information [1,2,3]. These devices typically necessitate a pump laser to polarize the atoms and a probe laser to detect the signal [4]. The pump laser operates at the atomic hyperfine resonance frequency. Deviations from this resonance point can result in light shifts and magnetic noise [5,6]. Conversely, the probe laser operates at the far-detuned frequency relative to the resonance point, at a detuning range from 100 to 200 GHz, to confirm the optimal scale coefficient. Frequency fluctuations of the pump laser and probe laser decrease both the long-term stability and sensitivity [7].
In previous studies on spin-exchange relaxation-free (SERF) atomic sensors, the pump laser typically achieves long-term frequency locking through techniques such as saturated absorption frequency stabilization [8], circular dichroism frequency stabilization [9], and polarization spectrum frequency stabilization [10]. But the probe laser still lacks an effective detuning frequency stabilization method because it is challenging to simultaneously achieve large detuning, long-term stability, and prototyping with the exiting active frequency control techniques. Recently, WeiYao attempted an in situ frequency detuning stabilization method in a SERF co-magnetometer, while the frequency stability after locking was still poor, and the frequency drift reached more than 100 MHz/5 h [7]. Within the atomic clock domain, detuning the laser frequency to the magic wavelength often involves using an optical frequency comb [11]. Despite the comb’s ability to offer broad repetition frequencies for extensive detuning and locking, its long-term stability relies on the stability of a hydrogen maser clock [12]. Alternatively, an ultra-stable cavity constructed from materials with extremely low thermal expansion coefficients can also generate a comb-shaped resonant frequency for frequency detuning and locking, but it requires operation in a vacuum and temperature-controlled environment to mitigate frequency drift [13,14]. Consequently, a frequency detuning locking method for probe lasers that can ensure miniaturization and high stability at the same time is urgently needed.
By reusing the pump laser frequency of the atomic sensor as a reference and compensating the drift and jitter of the cavity, the frequency stability of the resonant reference is transferred to the far-detuned target laser. To analyze the intriguing phenomenon why the transferred frequency stability could exceed the reference frequency, we established the transfer function of the control system and studied the main factors affecting the transferred laser frequency stability, including discriminator noise, open-loop gain, and the discriminator coefficient determined by the cavity parameters. The frequency stability was evaluated using the noise power spectral density of the error signal and the Allan variance of the wavelength data after locking. This method facilitates miniaturization and sustains high-precision frequency control.

2. Theory

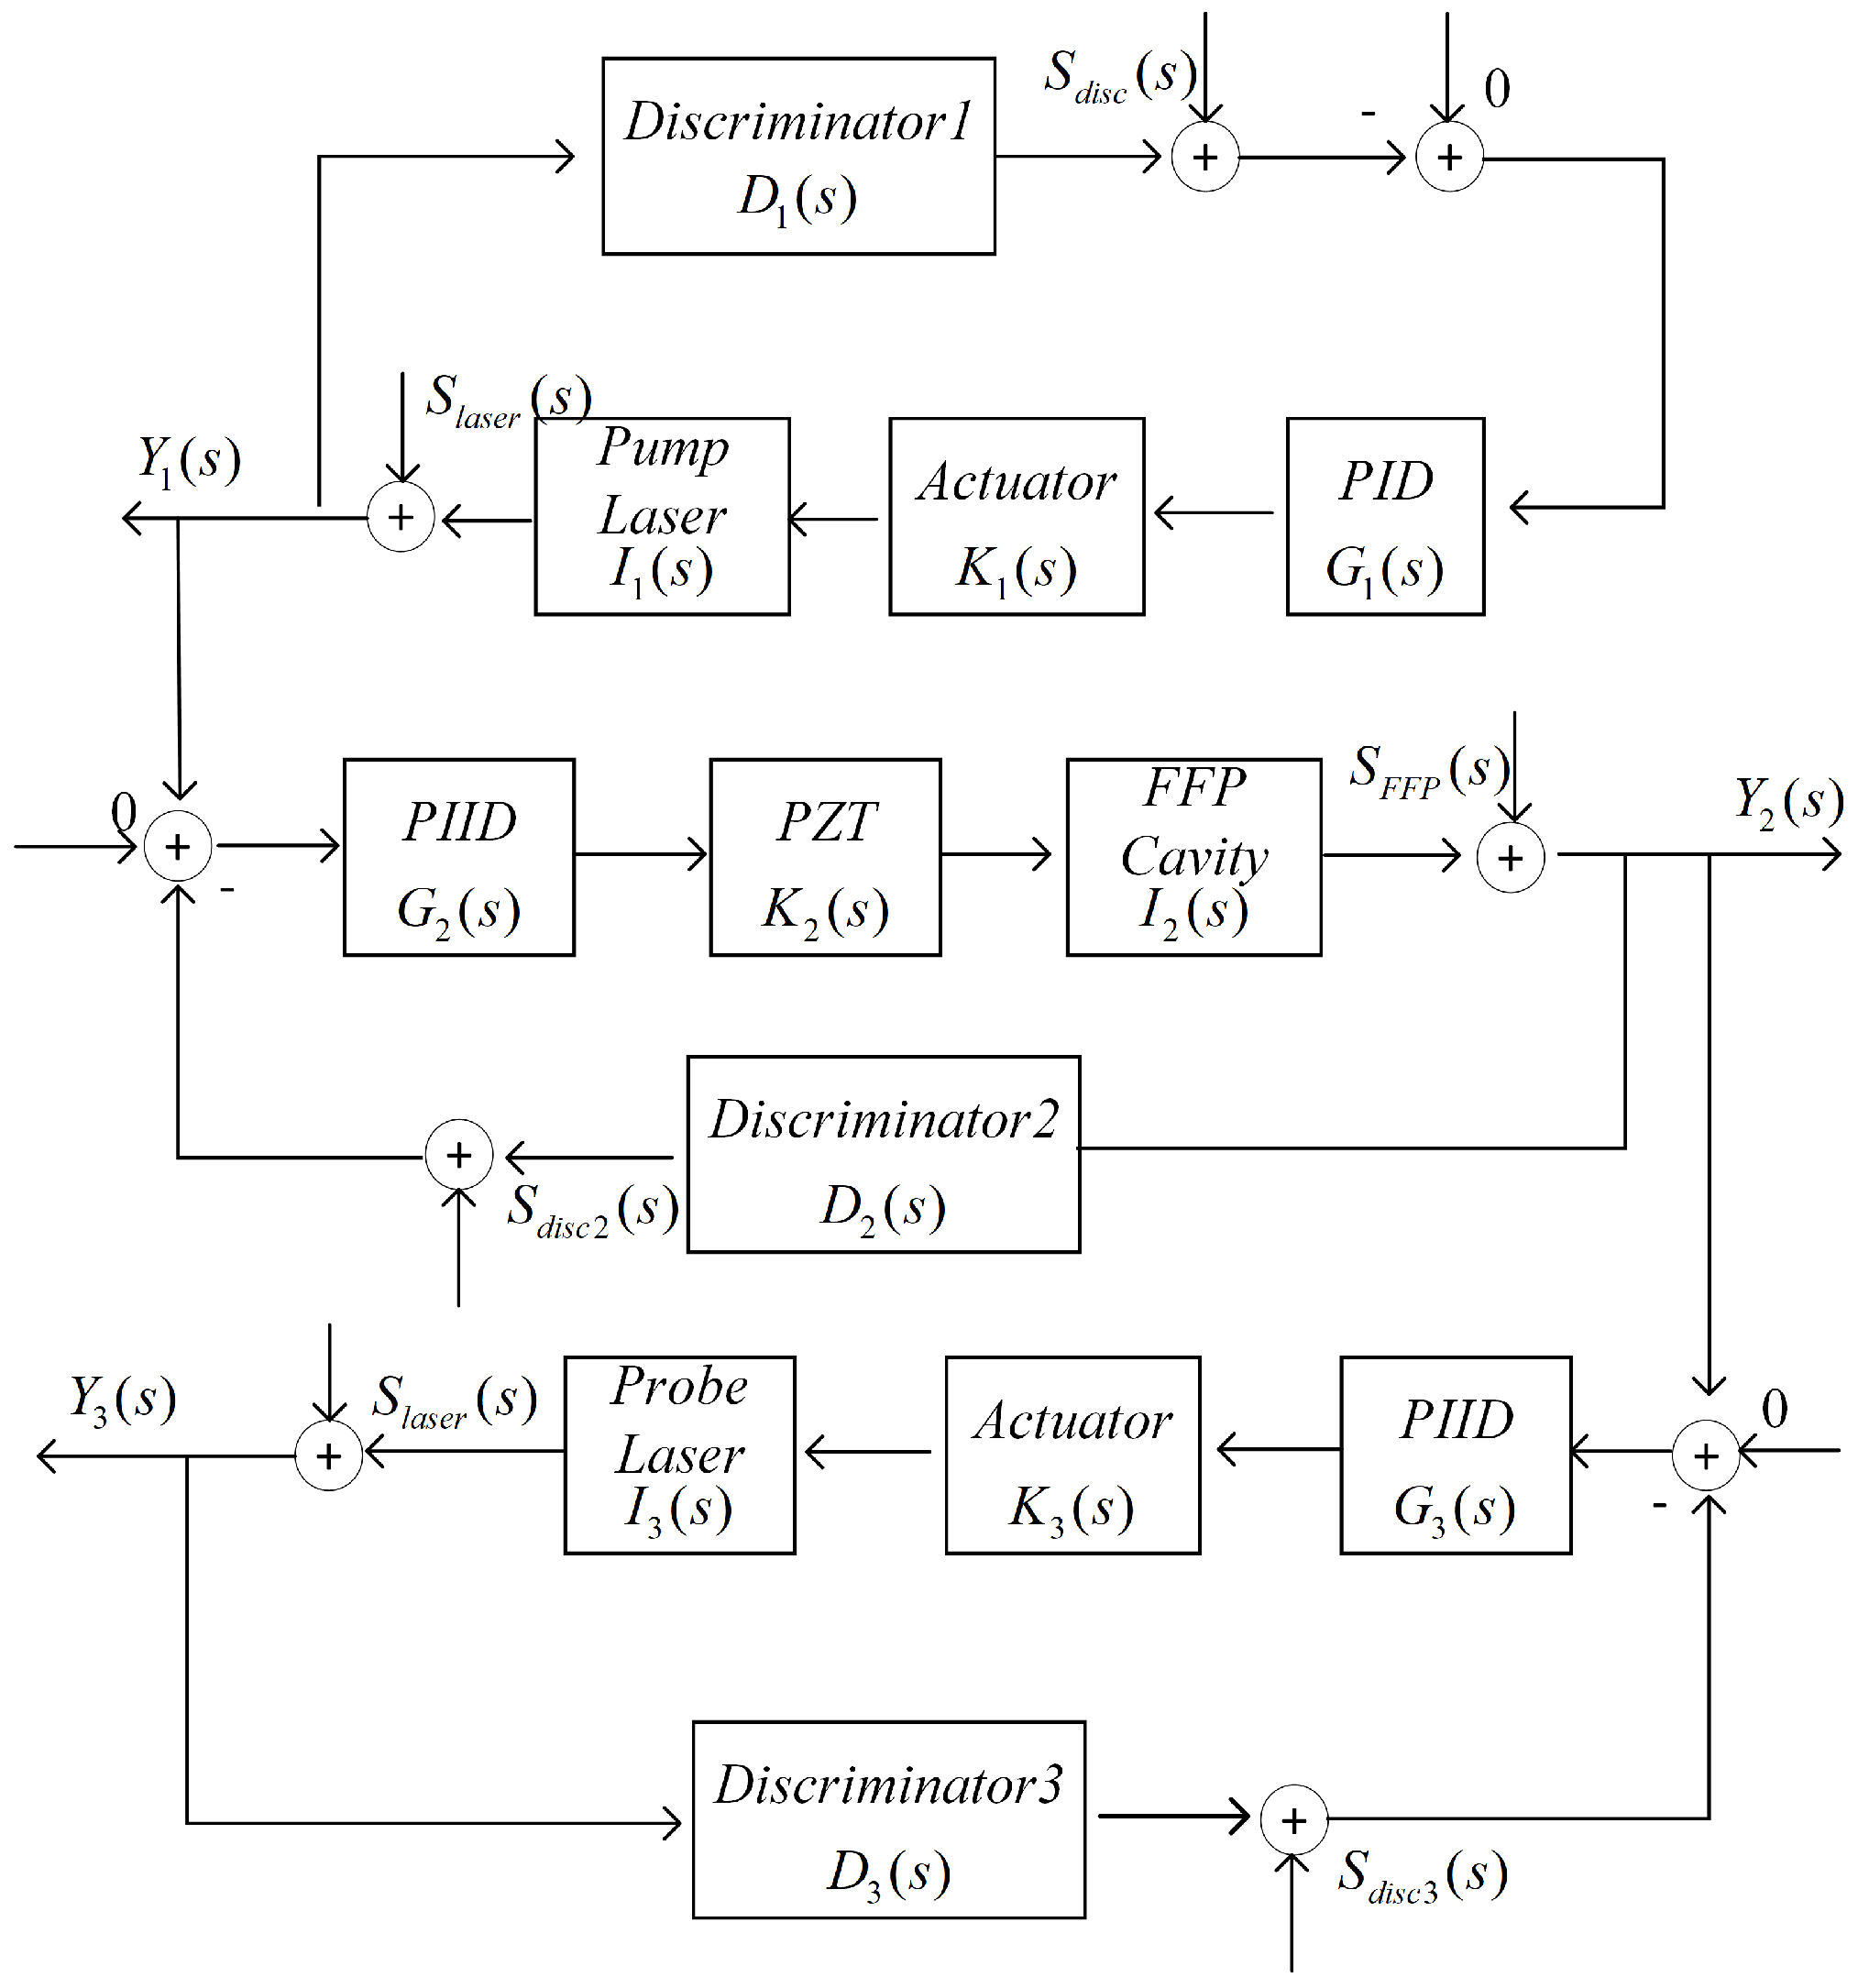
2.1. Principle of Transferred FFP Frequency Locking

The intrinsic optical fiber Fabry–Perot (FFP) cavity is made by coating parallel end faces on both ends of a single-mode optical fiber, allowing for cavity mode coupling without the need for complex mirror adjustments [15]. According to the Jones matrix of the cavity, the reflected light field after resonating in the optical FFP cavity is expressed as
E out x E out y = M x 0 0 M y · E inx E iny
where E outx E outy is the Jones vector of the reflected light field, E i n x E i n y is the Jones vector of the input light field. M x = R R 1 R 2 e j 2 δ x · n = 0 n = h R 2 e j 2 δ x n , and M y = R R 1 R 2 e j 2 δ y · n = 0 n = h R 2 e j 2 δ y n . R is the coating reflectivity ( 0 < R < 1 ). δ x and δ y are the phase produced by the reflection light along the x polarization axis and the y polarization axis of the fiber FP cavity, respectively. So when the input light is a beam of linearly polarized light, the azimuth angle of which is determined by the polarization axis of the polarization-maintaining fiber circulator (PM-OPC) ( E i n x E i n y = cos α sin α ) , the intensity of the output reflection spectrum is stable. Based on I R x , y = E out x , y , the intensity is calculated as
I R x = cos 2 α R 2 1 + ( R 1 ) 2 4 R sin δ x 2 ,   I R y = sin 2 α R 2 1 + ( R 1 ) 2 4 R sin δ x 2
From Equation (2), it can be seen that the reflection spectrum is Lorentz line-type, and when the phase satisfies δ x , y = k π , the spectral intensity reaches the maximum. According to the relationship between the phase and the laser frequency in the cavity, δ x , y = 2 π n x , y L v x , y c , where n x , y is the refractive index of light transmitted in the optical fiber. L is the fiber length and v x , y is the laser frequency.
The corresponding resonant frequencies of the two orthogonal polarization modes at the maximum intensity are calculated as
v q x , y = q c 2 n x , y L
where q is an integer that represents the q-th mode.
Due to the birefringence of the fiber FP cavity, the fiber FP cavity can simultaneously generate two sets of orthogonal resonance peaks. And its resonance frequency is not only related to the cavity length, but also related to the refractive index of the two polarization axes. So the single FFP used as the frequency reference is much more sensitive than the traditional quartz FP cavity. On the other hand, this also means that the FFP cavity is much easier to control. Let τ = n L c , so the resonance frequency is expressed as
v = q 2 τ
The delay τ of the cavity can always be adjusted to resonant with the frequency-stabilized laser by adjusting the cavity temperature or applying elastic stress to the cavity. Considering the thermal and elastic effects of the optical fiber, Δ τ K · Δ T + J · L · ε [16], where K is the thermal-optic coefficient, J is a constant related to the elastic-optic coefficient, Δ T is the temperature difference of the cavity, and ε represents the strain applied to the cavity. As the response bandwidth of PZT (dozens KHz) is much higher than that of TEC (several Hz), so the thermal drift of the cavity with the ambient temperature is compensated easily by elastic control.

2.2. Locked Frequency Stability Analysis

In this paper, the demodulated error signal of the cavity and lasers are all dispersive lines. The pump laser frequency is locked on the saturated absorbed peak of the Rb atomic D1 line. Then, the FFP cavity phase delay ( τ ) is locked on the reflected spectrum of the pump laser resonating within the cavity. Lastly, the probe laser frequency is locked on the resonant spectrum of the FFP cavity’s phase delay. The reference of the saturated absorption line and the phase delay of the FFP cavity are converted to error signal zeros by the discriminator. The entire control process is shown in Figure 1. The residual frequency noise of the pump laser (output from loop 1) is converted to the input noise of loop 2. Identically, the residual frequency noise of loop 2 is added to the input noise of loop 3.
In the block diagram, the main disturbance is introduced from the discriminator and the environment, and the control noise and actuator noise are disregarded. The discriminator noise [17] is expressed as
S disc ( f ) = k Q N E P 2 + 2 ħ v P det / η d
where k is the conversion loss of the frequency discriminator. Q is the responsivity constant determined by the photodetector and the pre-amplifier. η d is a constant representing the quantum efficiency of the PD. Therefore, the S disc ( f ) is mainly affected by the intensity noise in the frequency domain of the input spectrum, and there is no correlation between the frequency discrimination noise in the three loops. S disc ( s ) is the expression of the Laplace domain. The frequency noise of a free-running laser subject to environmental disturbances in the s-domain is expressed as S laser ( s ) . According to the Wiener–Khintchine theorem, the modulation noise broadens the line-width of the laser [18], but has little effect on long-term stability. Due to the bandwidth limitations of the PID closed-loop control system, the line-width noise caused by modulation is not considered here. Therefore, the primary term of laser frequency noise is the slow drift which limits the long-term stability. The SMF-FP noise in the s-plane is expressed as S F F P ( s ) , which is mainly composed of 1/f noise and random polarization fluctuation.
According to Figure 1, the output noise of the pump laser, the output noise of the FFP cavity, and the output noise of the probe laser are expressed as
Y 1 = A 1 1 + A 1 B 1 S disc 1 ( s ) + S laser ( s ) 1 + A 1 B 1
Y 2 = A 2 1 + A 2 B 2 S disc 2 ( s ) + Y 1 ( s ) + S F F P ( s ) 1 + A 2 B 2
Y 3 = A 3 1 + A 3 B 3 S disc 3 ( s ) + Y 2 ( s ) + S laser ( s ) 1 + A 3 B 3
where A 1 = I 1 K 1 G 1 , B 1 = D 1 ; A 2 = I 2 K 2 G 2 , B 2 = D 2 ; and A 3 = I 3 K 3 G 3 , B 3 = D 3 . Both I and K are constants determined by the device. When A 1 1 , Y loop 1 S disc 1 ( s ) B 1 . After the loop becomes a closed loop, the low-frequency slow drift of the laser frequency is greatly suppressed, and the remaining frequency noise is approximately high-frequency white noise.
As the FFP cavity locking loop adopts phase modulation with 100 MHz, the closed-loop control bandwidth of loop 2 reaches the MHz level.The PIID controller in loop 2 is employed to increase the open-loop gain. As indicated by Equation (7), when the open-loop gain is sufficiently high, the slow drift ( S F F P ( s ) ) of the cavity is significantly suppressed, leaving only the extremely weak frequency discrimination noise S disc 2 ( s ) . Then, by substituting the simplified Y 1 ( s ) into Equation (4), Y 2 ( s ) is simplified as
Y 2 ( s ) 1 B 2 S disc 2 ( s ) + 1 B 2 B 1 S disc 1 ( s )
The loop 3 bandwidth is also limited by the cut-off frequency of the discriminator, and the simplified Equation (8) is expressed as
Y 3 ( s ) S disc 3 ( s ) B 3 + S disc 2 ( s ) B 2 B 3 + S disc 1 ( s ) B 1 B 2 B 3
According to Equation (10), the transferred probe laser frequency noise is mainly composed of discrimination noise. The low drift of the probe laser frequency is significantly suppressed under the influence of three closed-loop loops. It is seen that the influence of the three kinds of frequency discrimination noise is S disc 3 ( s ) > S disc 2 ( s ) > S disc 1 ( s ) . And by optimizing the coefficients of the frequency discriminator of the three loops, the output noise of the probe laser can be further reduced. Notably, when large environmental disturbance ( S F F P ( s ) ) is introduced to the cavity in loop 2, it can easily cause the integral saturation of the cavity and the whole system is no longer locked. Therefore, it is still necessary to add passive temperature control to the cavity to reduce the noise transmitted to the cavity in loop 3, which ensures the long-term stability of the entire system.

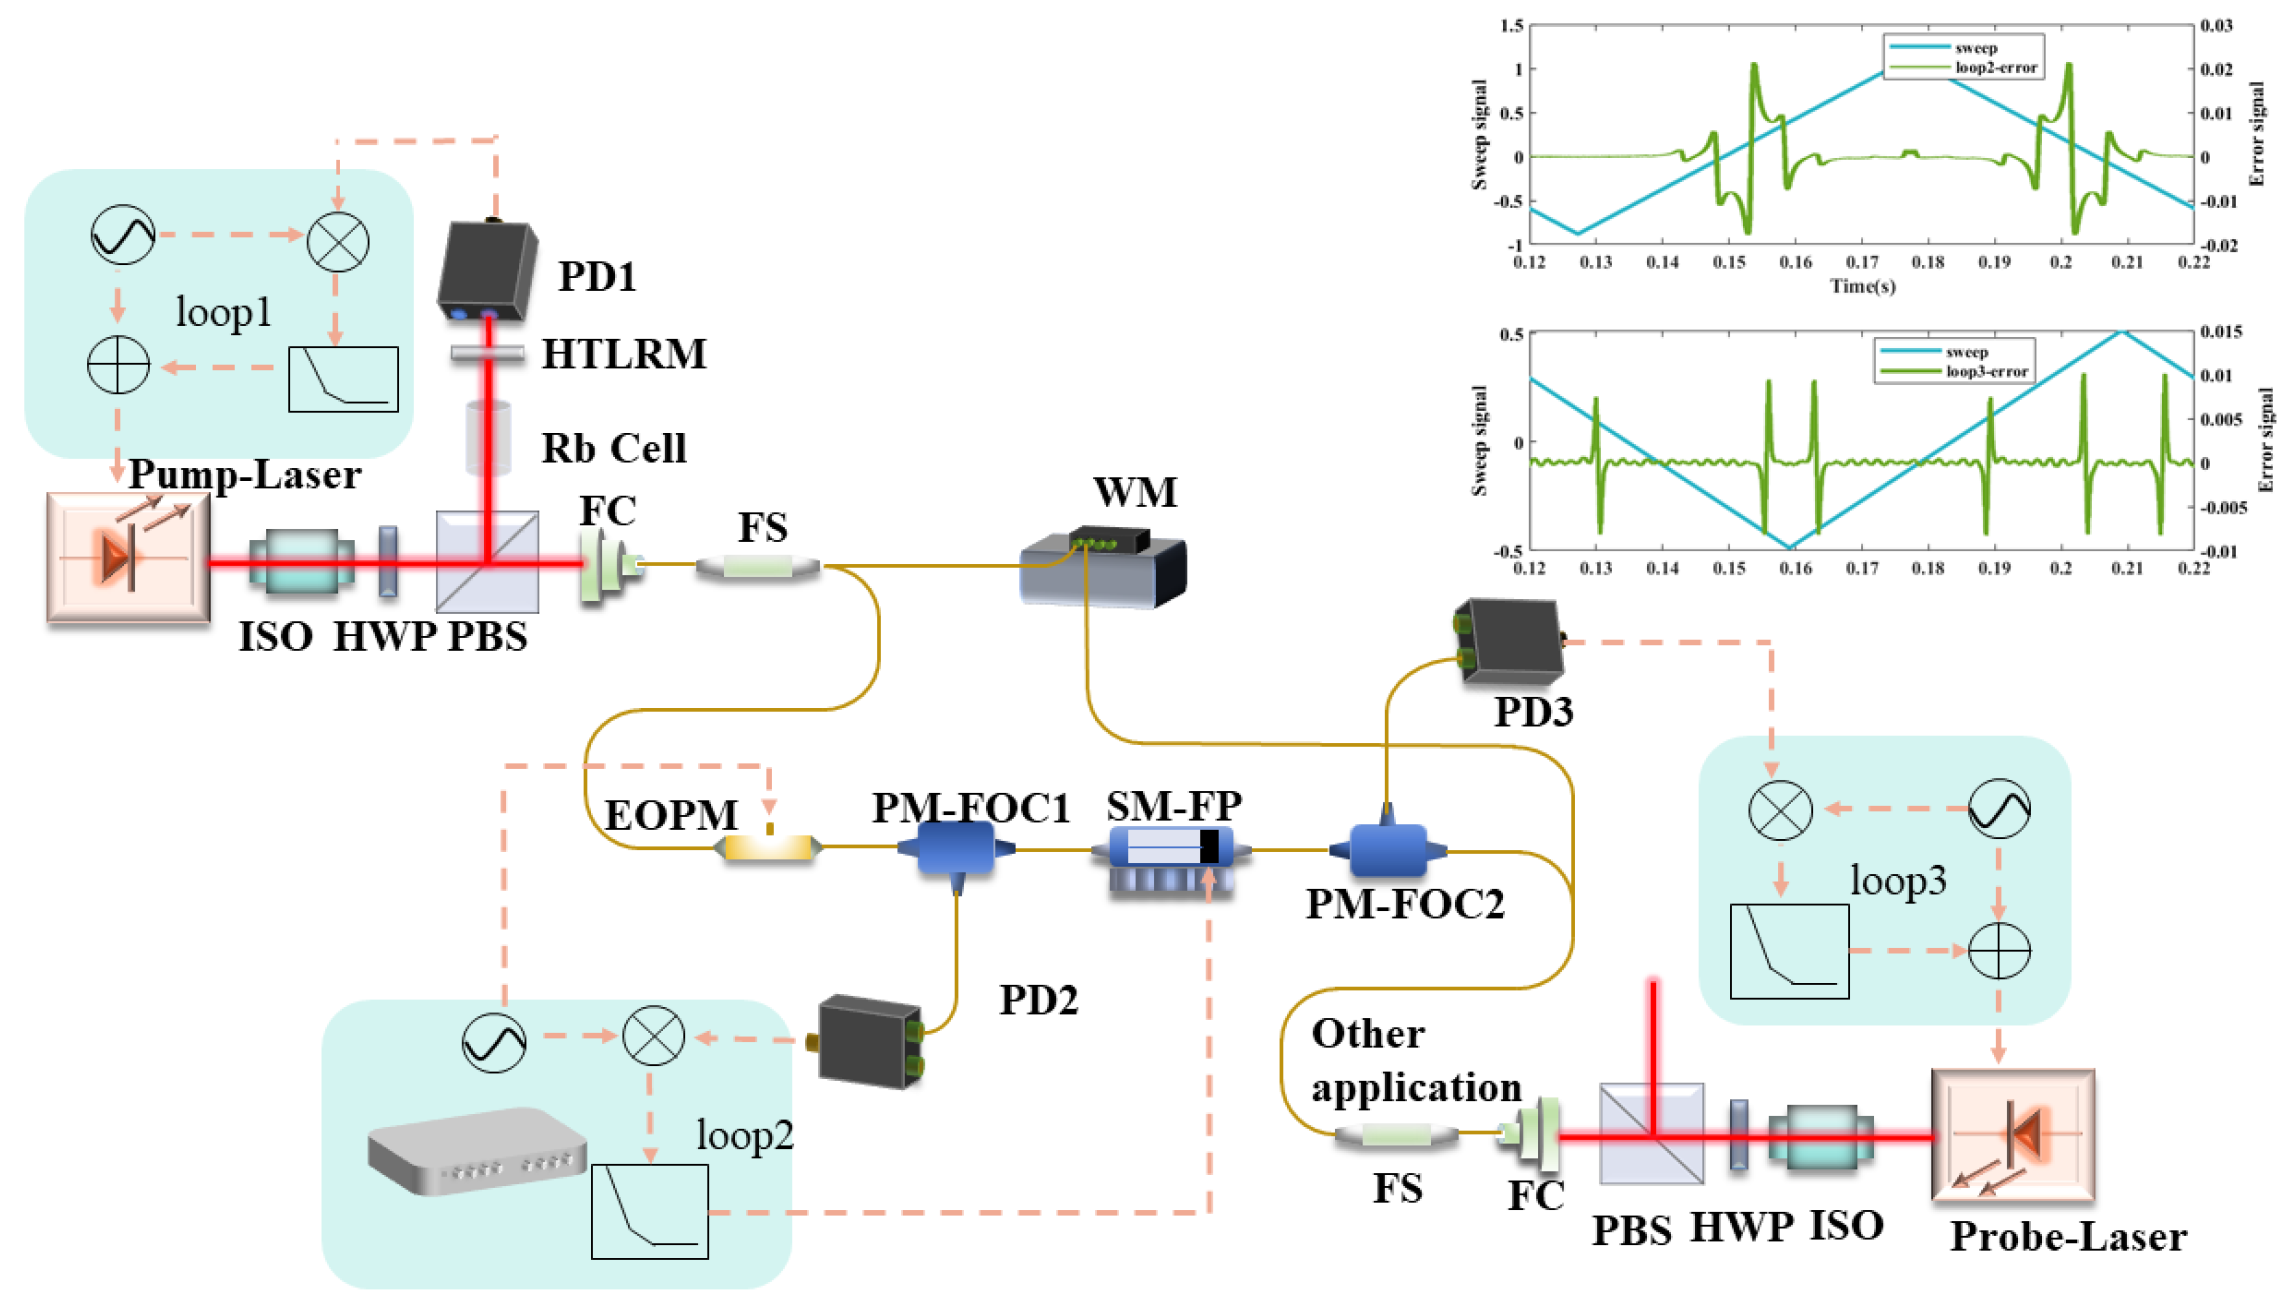
3. Experimental Setup

The experiment setup of the transferred frequency stabilization system is illustrated in Figure 2. The homemade 780 nm semiconductor laser (of which the diode style is EYP-DFB-0780-00080-150) is divided into two beams by the polarizing beam splitter (PBS), and one part of the light beam is transmitted in the Rubidium cell (Rb Cell) to lock the pump laser frequency on the saturated absorption peak. The error signal is obtained by the demodulation method and controlled with a Proportional-Integral-Dfferential (P-I-D) controller. The control loop is shown as Loop 1 in Figure 1. The other part of the beam light is coupled into the fiber splitter to pump the atoms (or monitor the stabilized frequency) and to stabilize the tunable FFP cavity.
The tunable transferred fiber cavity is composed of an FFP, two thermoelectric cooler (TEC) plates, two negative thermistors, and a piezoelectric transducer (PZT) actuator. The FFP cavity is made of a single-mode fiber plating high-reflection coating (>98%), the fineness of which is about 125 and the Full Width at Half Maximum (FWHM) is about 8.25 MHz [19]. Its resonance characteristics have been reported in another study.
As directly modulating the cavity’s PZT causes the vibration noise of the FFP, an electro-optic phase modulator (EOPM) is used for modulating the light phase to stabilize the FFP cavity. The PDH technique is used to obtain the error signal and the proportional-integral-integral-differential controller (P-I-I-D controller) at loop 2, seen in Figure 1. This is applied to control the cavity stability. The modulated light transmits the polarization-maintaining fiber optic circulator (PM-FOC) from port 1 to port 2, and then inputs it into the FFP cavity. The reflected spectrum is output from port 3 of PM-FOC-1. Benefiting from PM-FOC’s polarization-maintaining and the nonreciprocal properties, the input light remains linearly polarized and the reflected light does not interfere with the input light.
The 795 nm laser used in the experiment is a distributed grating feedback semiconductor laser (EYP-DFB-0795-00080), which has the advantage of a narrow line-width of single longitudinal mode. The light emitted by the laser is divided into two beams of light with different power. One is used as the probe light in the atomic sensors, and the other beam is coupled into the fiber splitter for the purpose of frequency detuned locking. Considering the simplification of the optical pathway, the frequency modulation of the 795 nm laser is achieved through current modulation, with a bandwidth capability of 4 MHz. The modulated light is transmitted to the fiber FP cavity through PM-FOC-2. Its reflected resonant spectrum is received by a photo detector. Similarly, demodulating the modulated spectrum achieves the error signal and controls the frequency in a closed loop denoted as loop 3 in Figure 1.
It is noteworthy that the photo-diode bandwidth within the three loops depicted in Figure 1 is contingent upon their respective modulation bandwidths. As the modulation frequency ranges in loop 1, loop 2, and loop 3 are 10 KHz to 50 KHz, 10 MHz to 100 MHz, and 200 KHz to 1.5 MHz, respectively, the PD bandwidths of loop 1, loop 2, and loop 3 are 100 KHz, 350 MHz, and 15 MHz, respectively.

4. Experimental Results

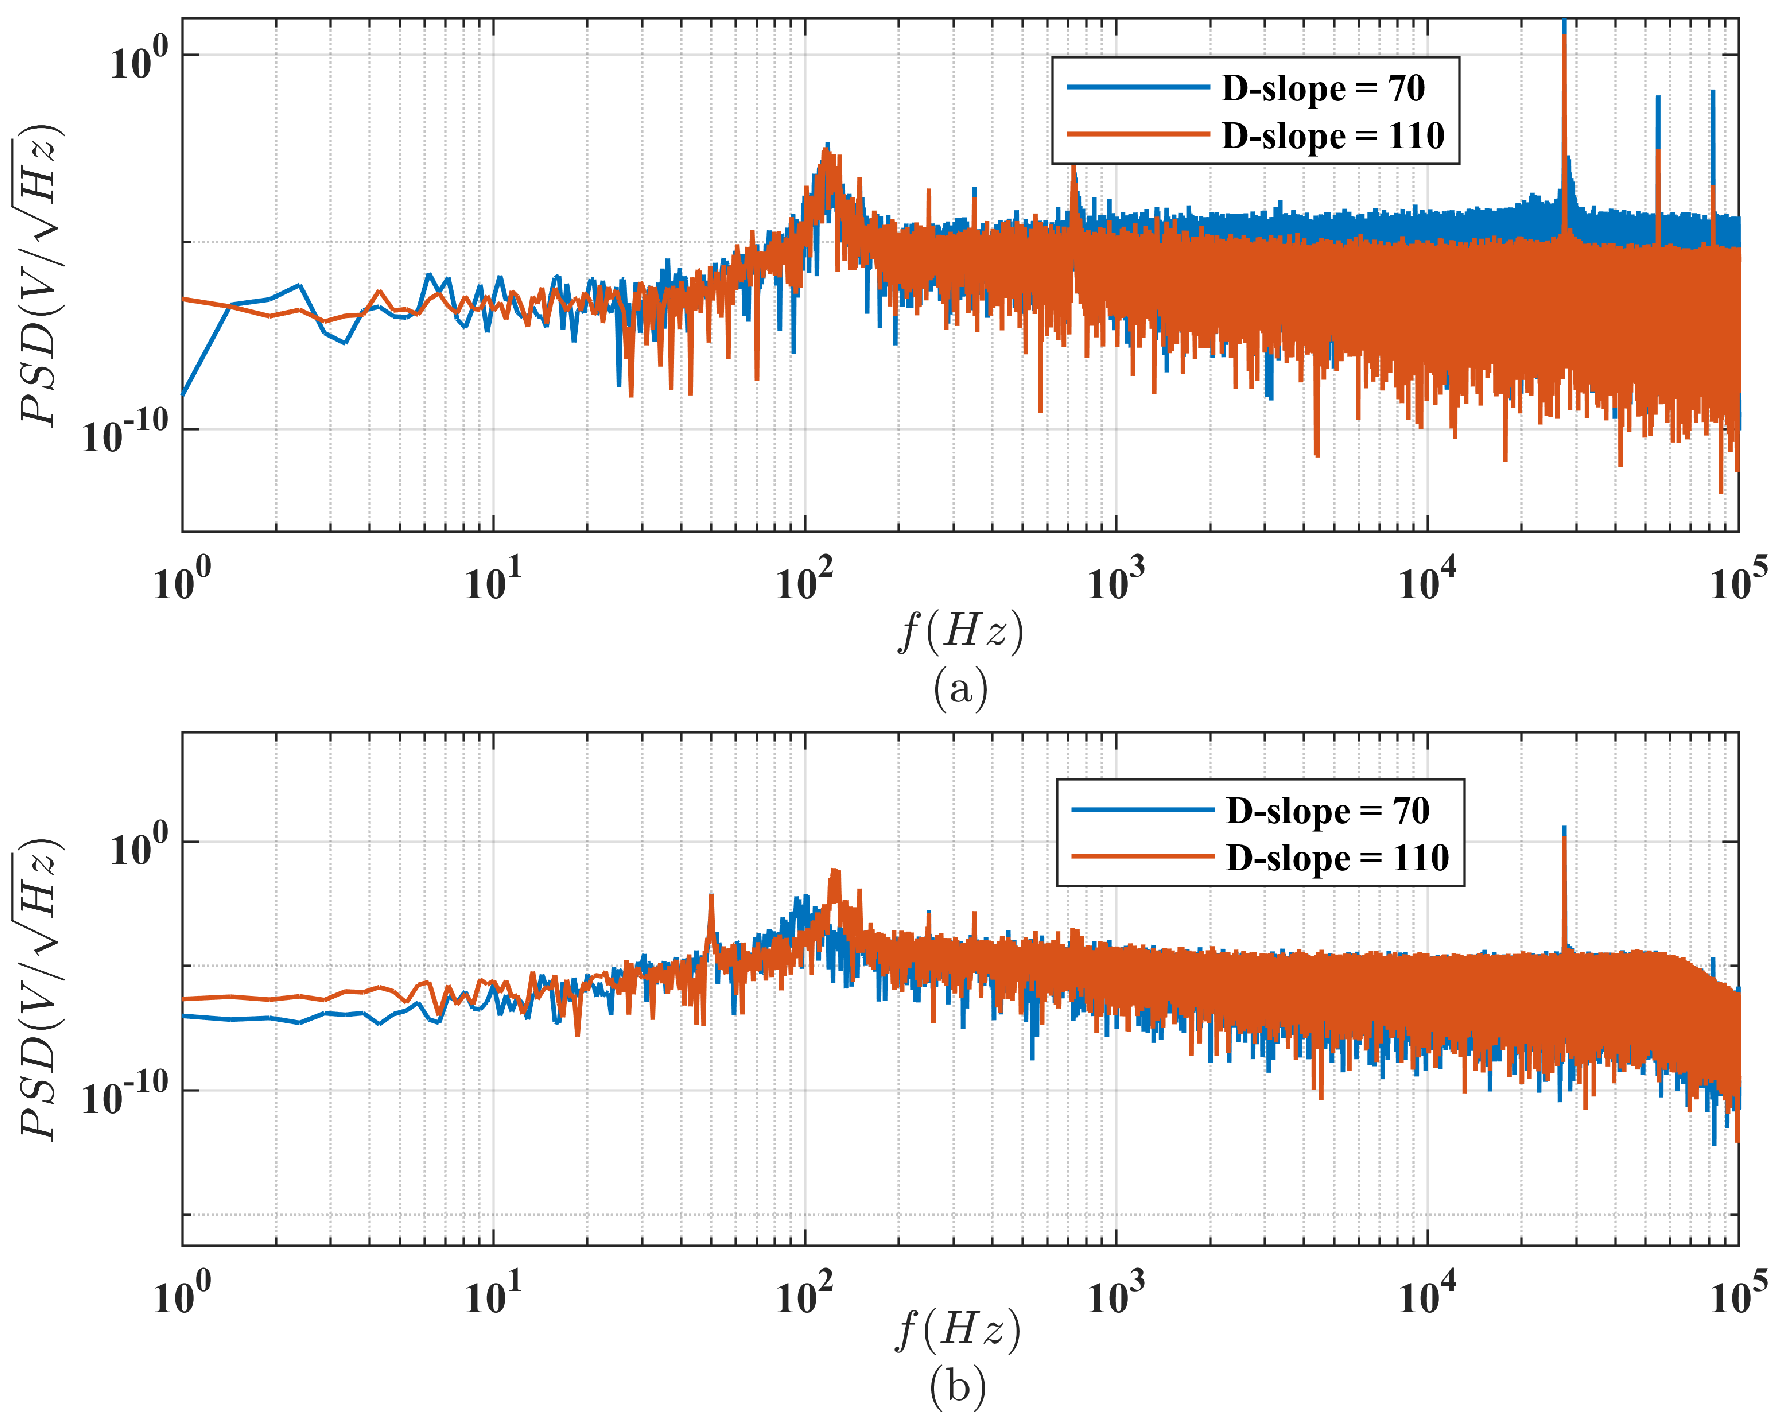
4.1. Parameter Optimization

The frequency discrimination slope (D-slope) of the three loops’ discriminator under various conditions is tested as seen in Figure 3. Limited by the line-width of the saturated absorption spectrum, B 1 is approximately a constant whose impact on the output is also minimal. B 2 and B 3 are affected by modulation depth, modulation frequency, and the line-width of fiber FP cavity. For phase modulation in loop 2, the D-slope increases with modulation depth and the fineness of the FFP cavity, independent of modulation frequency. However, for frequency modulation in loop 3, achieved through laser current modulation, the D-slope exhibits more complex variations. Experimental results indicate that beyond a certain modulation depth, the D-slope decreases, possibly due to the increased laser line-width from current modulation. The D-slopes corresponding to different parameters are experimentally selected to optimize the control performance. Due to the low sample rate of the wavelength meter, the frequency stability in the loop is evaluated by calculating the noise power spectral density (PSD) in the actual experiment.
The error signals of the probe laser in both open loop and closed loop states are collected to calculate the system PSD that are depicted in Figure 4. It is shown that the frequency noise in the three loop bandwidths is greatly suppressed compared to the open-loop state. And compared to the single integrator control method, the double-integral closed-loop controller has a better disturbance suppression effect.
According to Equations (9) and (10), when the D-slope value of loop 2 ( B 2 ) is increased, the PSD of loop 2 will decrease and the PSD of loop 3 will not change significantly as the frequency noise of loop 3 is mainly determined by S disc 3 . Figure 5 shows the tested PSD of loop 2 and loop 3 by varying the modulation amplitudes of loop 2. The results are consistent with the analysis (the signal sampling rate for calculating PSD is 500 KHz). Since the bandwidth of loop 2 can reach MHz, the PSD of loop 2 shown in Figure 5a has only one corner frequency, f 1 ( f 1 = 120 Hz), which is determined by the cut-off frequency of the integrator of loop 2.
Similarly, the D-slope of loop 3 is adjusted by varying the current modulation frequency. As shown in Figure 6a, the B3 at 1000 KHz of loop 3 is higher than it is at 500 KHz. And the closed-loop frequency noise corresponding to the modulation frequency of 1000 KHz is lower than it is in the condition of 500 KHz, which is all tested above the integral crossover frequency. It is shown in Figure 6b that the frequency noise declines when increasing the open-loop gain of the controller. By appropriately increasing the open-loop gain, a better noise suppression effect can be obtained. The results are consistent with the analysis.
This experiment also elucidates why the final frequency stability of loop 3 has the potential to surpass that of loop 1. Although the latter loop uses the previous loop as the locking reference, the control performance in each loop is mostly influenced by the D-slope and the control parameters of its own loop. The D-slope for saturated absorption frequency stabilization in loop 1 is much lower than that of the Pound-Drever-Hall (PDH) frequency stabilization system in loop 3, and thuse the transfer frequency stabilization method based on the FFP cavity achieves superior stability.

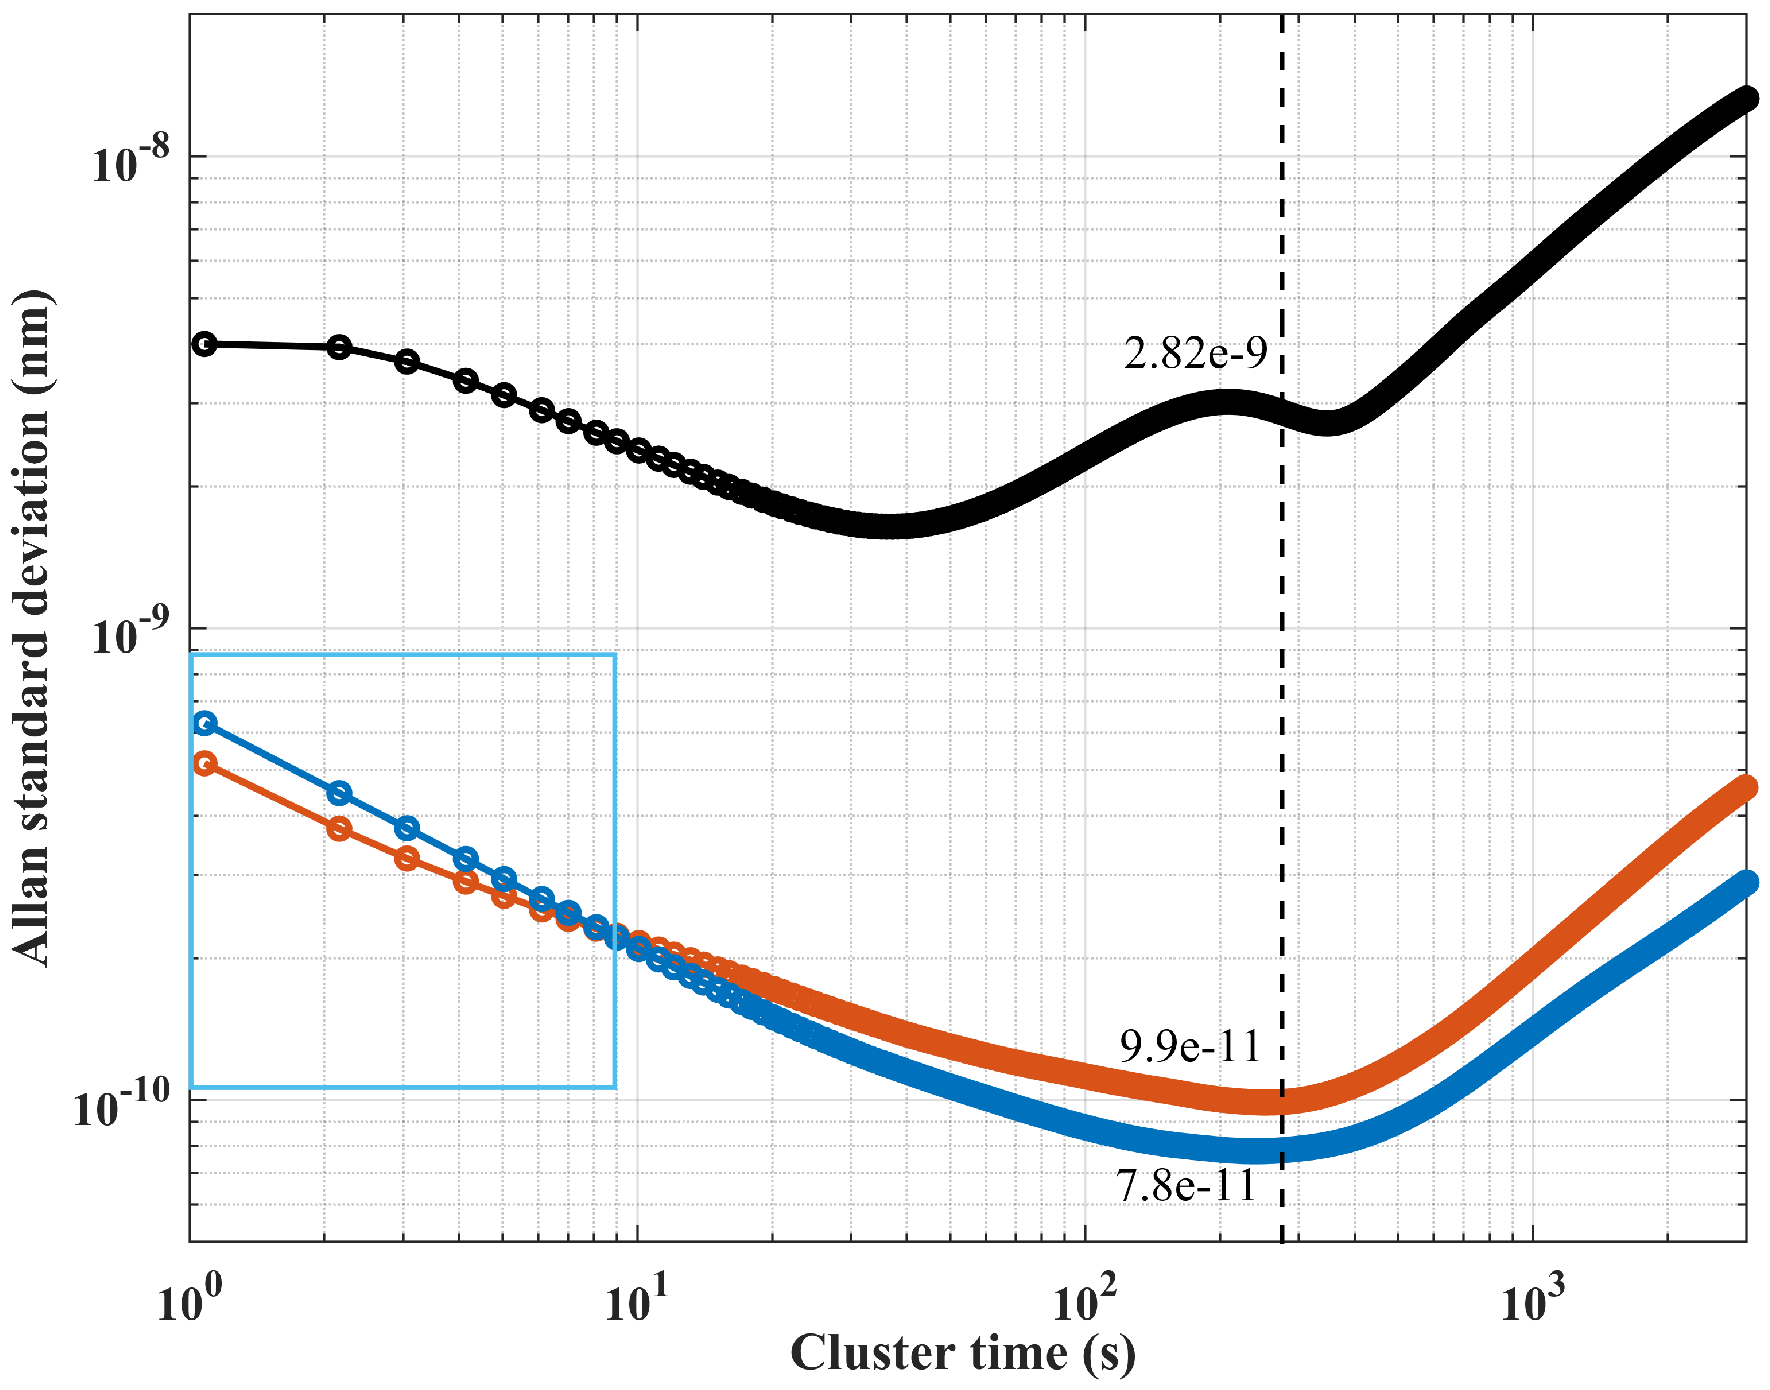
4.2. Pump and Probe Laser Locking Results

After optimization, the modulation parameters of loop 2 are set as f mod = 60 MHz and A mod = 2 V , and the modulation parameters of loop 3 are set as f mod = 1.1 MHz and A mod = 30 mV . The referenced laser (pump laser) and the transferred laser (probe laser) frequency are sampled by a wavelength meter (Highfiness, WS7-60) for 2 days to measure the long-term stability. Figure 7 shows the wavelength fluctuation and drift of the pump laser, probe laser, and free-running probe laser. The probe laser wavelength fluctuation after locking on the transferred FFP cavity is only 2.3 MHz within an hour, while it reaches 19.9 MHz in the free-running state. Moreover, as the measure time increases, the difference in wavelength drift is more significant in the free-running and locked states. The pump laser wavelength locked with the saturation absorb line, the probe laser wavelength locked with the transferred FFP cavity, and the free-running probe laser wavelength drift are 6.4 MHz, 5.2 MHz, and 66.7 MHz, respectively, in 48 h. For a more accurate analysis, Figure 8 illustrates the Allan deviation based on their wavelength data. The results indicate that the Allan deviation of the laser locked on the SAS line and that locked on the transferred FFP cavity is 7.8 11 and 9.9 11 , respectively, at the integration time of 100 s, which is two orders of magnitude better than that of the free-running laser. The locking results are compared with other methods shown in Table 1.

5. Discussion

As Figure 8 indicates, when the integration time is less than 1 s marked with the blue box, the Allan deviation of the 795 nm probe laser is lower than the 780 nm referenced pump laser in this method. Due to the influence of temperature fluctuation caused by air conditioning on the cavity, S F F P ( s ) in loop 2 is superimposed on loop 3, which reduces the long-term frequency stability of the 795 nm probe laser. Through the analysis of Equations (7) and (8), increasing the frequency discrimination slope of loop 2 and loop 3 can distinctly suppress this negative effect.
Consequently, the frequency stability of the laser controlled in this method can be further enhanced by increasing the D-slope, such as by improving the coating reflectivity of the fiber FP cavity or optimizing the cavity length. Otherwise, spectral broadening caused by internal current modulation makes the D-slope decrease. If the error signals of loop 1 and loop 3 are obtained by modulating the laser phase using an external phase modulator, the laser frequency noise will be further reduced.

6. Conclusions

In this study, the laser frequency transferred locking from 780.2 nm to 795.2 nm wasrealized by controlling a coated fiber FP cavity. By analyzing the transfer function of the control loop, the factors constraining the transferred laser frequency stability were investigated and the strategies enhancing its locking performance were explored. Although the laser has no stable natural frequency reference at the detuning frequency point, it has the potential to surpass the laser frequency stability locked on the atomic transition line by designing a high-fineness transferred FFP. The FFP cavity is employed as the detuned frequency reference and exhibits excellent long-term performance for the first time to our knowledge.

Author Contributions

Conceptualization, G.L. and L.D.; Data curation, G.L.; Formal analysis, G.L.; Funding acquisition, W.Q. and X.Z.; Investigation, G.L.; Methodology, G.L. and L.D.; Project administration, W.Q. and X.Z.; Supervision, X.Z.; Validation, X.Z.; Visualization, L.D.; Writing—original draft, G.L.; Writing—review and editing, G.L. and L.D. All authors have read and agreed to the published version of the manuscript.

Funding

This work was supported by the National Science Fund for Distinguished Young Scholars (61925301); the National Natural Science Foundation of China (62122009, 62003024); and the Innovation Program for Quantum Science and Technology (2021ZD0300501).

Institutional Review Board Statement

Not applicable.

Informed Consent Statement

Not applicable.

Data Availability Statement

The data presented in this study are available on reasonable request from the corresponding author.

Conflicts of Interest

The authors declare no conflicts of interest.

References

  1. Tian, M.; Quan, W.; Jiang, L.; Liu, J.; Lu, Z. Single-beam NMOR atomic magnetometer based on a fiberized EOM. Opt. Lett. 2023, 48, 3075–3078. [Google Scholar] [CrossRef] [PubMed]
  2. Yuan, Z.; Lin, S.; Liu, Y.; Tang, J.; Zhai, Y. Gradient phase and amplitude errors in atomic magnetic gradiometers for bio-magnetic imaging systems. iSicence 2024, 27, 109250. [Google Scholar] [CrossRef] [PubMed]
  3. Liu, X.; Bi, W.; Li, Y.; Hu, Y.; Chang, M.; Zhang, X. A review of fiber-coupled atomic magnetometer. Microw. Opt. Technol. Lett. Opt. Technol. 2023, 65, 1516–1524. [Google Scholar] [CrossRef]
  4. Liu, S.; Wang, R.; Yuan, L.; Wu, J.; Yuan, Q.; Zhu, J.; Fan, W.; Wang, Z.; Du, P. Transverse light-shift in a spin-exchange relaxation-free co-magnetometer: Measurement, decoupling, and suppression. Opt. Express 2022, 30, 15310–15326. [Google Scholar] [CrossRef]
  5. Wu, Z.; Pang, H.; Wang, Z.; Fan, W.; Liu, F.; Liu, Y.; Quan, W. A New Design Method for a Triaxial Magnetic Field Gradient Compensation System Based on Ferromagnetic Boundary. IEEE Trans. Ind. Electron. 2024, 71, 13361–13371. [Google Scholar] [CrossRef]
  6. Jia, Y.; Liu, Z.; Ding, M.; Chai, Z.; Liang, X.; Wu, W. The effect of tensor light shift on residual magnetic field compensation in a nuclear spin co-magnetometer. Appl. Phys. Lett. 2020, 116, 142405. [Google Scholar] [CrossRef]
  7. Wei, Y.; Liu, S.; Liu, F.; Fan, W.; Zhai, Y.; Quan, W. The optimization and stabilization of detuned probe light frequency to suppress electron spin polarization error in SERF co-magnetometer. Sens. Actuators A Phys. 2023, 359, 114467. [Google Scholar] [CrossRef]
  8. Seltzer, J.S. Developments in Alkali-Metal Atomic Magnetometry. Ph.D. Thesis, Princeton University, Princeton, NJ, USA, 2008. [Google Scholar]
  9. Talker, E.; Arora, P.; Zektzer, R.; Sebbag, Y.; Dikopltsev, M.; Levy, U. Light-Induced Atomic Desorption in Microfabricated Vapor Cells for Demonstrating Quantum Optical Applications. Phys. Rev. Appl. 2021, 15, L051001. [Google Scholar] [CrossRef]
  10. Qi, H.; Yang, B.; Zhao, H.; Ling, X.; Deng, J.; Cheng, H. Narrow Linewidth Laser Frequency Stabilization System for Integrating Sphere Cold Atom Clock. Laser Optoelectron. Prog. 2023, 60, 1514008. [Google Scholar] [CrossRef]
  11. Duan, Y.; Huang, Y.; Li, Y.; Wang, Y.; Ye, M.; Li, M.; Chen, Y.; Zhou, J.; Wang, L.; Liu, L. All-fiber-based photonic microwave generation with 10−15 frequency instability. Chin. Opt. Lett. 2022, 20, 021406. [Google Scholar] [CrossRef]
  12. Fang, P.; Sun, H.; Wang, Y.; Xu, Y.; Chen, Q. Transfer of laser frequency from 729 nm to 1.5 µm with precision at the level of 10−20. Chin. Opt. Lett. 2022, 20, 081403. [Google Scholar] [CrossRef]
  13. Li, X.; Xu, Z.; Zhai, Y.; Yin, Y.; Ning, X.; Quan, W. Impact analysis of cavity length on transfer cavity frequency locking system for atomic inertial measurement device. AIP Adv. 2020, 10, 015340. [Google Scholar] [CrossRef]
  14. Zhadnov, N.O.; Masalov, A.V. Temperature-compensated optical cavities for laser frequency stabilization. Laser Phys. Lett. 2023, 20, 030001. [Google Scholar] [CrossRef]
  15. Li, G.; Duan, L.; Zhou, X.; Quan, W. Transfer matrix analysis of the birefringent fiber Fabry–Perot cavity and laser frequency locking. Results Phys. 2024, 57, 107375. [Google Scholar] [CrossRef]
  16. Zhang, J.; Shi, X.H.; Zeng, X.Y.; Lu, X.L.; Deng, K.; Lu, Z.H. Characterization of electrical noise limits in ultra-stable laser systems. Rev. Sci. Instrum. 2016, 87, 123105. [Google Scholar] [CrossRef]
  17. Chamoun, J.; Digonnet, M.J. Aircraft-navigation-grade laser-driven FOG with Gaussian-noise phase modulation. Opt. Lett. 2017, 42, 1600–1603. [Google Scholar] [CrossRef]
  18. Ding, M.; Komanec, M.; Suslov, D.; Dousek, D.; Zvanovec, S.; Fokoua, E.R.N.; Bradley, T.D.; Poletti, F.; Richardson, D.J.; Slavik, R. Long-Length and Thermally Stable High-Finesse Fabry-Perot Interferometers Made of Hollow Core Optical Fiber. J. Light. Technol. 2020, 38, 2423–2427. [Google Scholar] [CrossRef]
  19. Yang, N.; Su, J.; Fan, Z.; Qiu, Q. High Precision Temperature Insensitive Strain Sensor Based on Fiber-Optic Delay. Sensors 2017, 17, 1005. [Google Scholar] [CrossRef]
  20. Hedger, J.P.; Elsmann, T.; Becker, M.; Tiess, T.; Luiten, A.N.; Sparkes, B.M. High performance fiber-Fabry-Perot resonator targeting quantum optics applications. IEEE Photonics Technol. Lett. 2020, 32, 879–882. [Google Scholar] [CrossRef]
  21. Zheng, Y.X.; Cui, J.M.; Ai, M.Z.; Qian, Z.H.; Cao, H.; Huang, Y.F.; Jia, X.J.; Li, C.F.; Guo, G.C. Large-tuning-range frequency stabilization of an ultraviolet laser by an open-loop piezoelectric ceramic controlled Fabry–Pérot cavity. Opt. Express 2021, 29, 24674. [Google Scholar] [CrossRef]
  22. Zou, M.; Shen, K.; Song, Q.; Dai, Y.; Xiao, X.; Sun, Q.; Yan, Z. Sub-kHz linewidth laser generation by self-injection locked distributed feedback fiber laser. Opt. Laser Technol. 2024, 169, 110022. [Google Scholar] [CrossRef]
Figure 1. The control block diagram of the transferring locking system.
Photonics 11 01027 g001
Figure 2. Experiment setupof the transferred frequency locking system. ISO: Isolator; HWP: Half-wave plane; PBS: Polarizing beam splitter; HTLRM: High-transmittance low reflective mirror; FC: Fiber coupler; FS: Fiber splitter; EOPM: Electro-optic phase modulator; PM-FOC: Polarization-maintaining fiber optic circulator; PD: Photo-detector; WM: Wavelength meter.
Photonics 11 01027 g002
Figure 3. The red lines show the relationship between the discrimination slope (D-slope) and the modulation parameters, measured by calculating the ratio of the difference between the voltage between the two extreme values of the error signal and the difference between the abscissa sweep times. The error bar is obtained by three repeated independent measurements. (a) The D-slope vs. the phase modulation amplitude of loop 2; (b) the D-slope vs. the phase modulation frequency of loop 2; (c) the D-slope vs. the frequency modulation amplitude of loop 3; (d) the D-slope vs. the frequency modulation frequency of loop 3.
Photonics 11 01027 g003
Figure 4. The blue, orangeand green lines are the power spectral densitie (PSD) lines of the probe laser’s error signals under the open loop, the closed loop using the P-I-D control method, and the closed loop using the P-I-I-D control method, respectively.
Photonics 11 01027 g004
Figure 5. The loop 2 PSD line of the cavity error signal and the loop 3 PSD line of the probe laser error signal measured by varying the modulation amplitude in loop 2. (a) The PSD of loop 2. The blue and orange lines are the PSD lines measured when the modulation amplitudes of loop 2 are equal to 1 V and 2 V, respectively, and D-slope = 70 V/s and D-slope = 110 V/s. (b) The PSD of loop 3. The blue and orange lines are the PSD when the modulation amplitudes of loop 2 are equal to 1 V and 2 V, respectively, and D-slope = 70 V/s and D-slope = 110 V/s.
Photonics 11 01027 g005
Figure 6. The loop 3 PSD lines of the probe laser error signal measured by varying the modulation frequency and the proportional gain in loop 3. (a) The blue and orange lines are the PSD lines when the modulation frequencies of loop 2 are equal to 500 KHz and 1000 KHz, respectively, and D-slope = 10 V/s and D-slope = 50 V/s. (b) The blue, orange, and green lines are the PSD lines when the proportional gains of the control loop equal −27.4 dB, −16.3 dB, and −9.3 dB, respectively.
Photonics 11 01027 g006
Figure 7. The pump laser and probe laser wavelength drift trend after 48 h measured with the wavelength meter (b) The laser frequency variation details during one hour, which are marked with the red box in (a).
Photonics 11 01027 g007
Figure 8. The black line is the Allan variance of the probe laser in the free-running state. The blue line is the Allan variance of the pump laser locking on the saturated absorption line. The orange line is the Allan variance of the probe laser locking on the transferred FFP cavity.
Photonics 11 01027 g008
Table 1. Comparison of laser long-term stabilization performance locking by different methods.
Locking MethodLocking DurationLocking Performance
Presented in this article48 hDrift 6.4 MHz
Locked on a fiber Fabry Perot cavity [20]35 hDrift 10 MHz
Locked on open-loop PZT—controlled Fabry Perot cavity [21]41 hDrift 11 MHz
Injection—locked to a fiber ring resonator [22]15 minDrift less than 15 MHz
Disclaimer/Publisher’s Note: The statements, opinions and data contained in all publications are solely those of the individual author(s) and contributor(s) and not of MDPI and/or the editor(s). MDPI and/or the editor(s) disclaim responsibility for any injury to people or property resulting from any ideas, methods, instructions or products referred to in the content.

