Article

Thomson Scattering and Radiation Reaction from a Laser-Driven Electron

by
Ignacio Pastor
1,*,
Luis Roso
2,
Ramón F. Álvarez-Estrada
3 and
Francisco Castejón
1
1
National Fusion Laboratory, CIEMAT, 28040 Madrid, Spain
2
Department of Applied Physics, University of Salamanca, 37008 Salamanca, Spain
3
Department of Theoretical Physics, Complutense University, 28040 Madrid, Spain
*
Author to whom correspondence should be addressed.
Photonics 2024, 11(10), 971; https://doi.org/10.3390/photonics11100971
Submission received: 9 August 2024 / Revised: 11 October 2024 / Accepted: 14 October 2024 / Published: 17 October 2024
(This article belongs to the Special Issue Photon-Photon Collision Using Extreme Lasers)

Abstract

:
We investigate the dynamics of electrons initially counter-propagating to an ultra-fast ultra-intense near-infrared laser pulse using a model for radiation reaction based on the classical Landau–Lifshitz–Hartemann equation. The electrons, with initial energies of 1 GeV, interact with laser fields of up to 10 23 W/ cm 2 . The radiation reaction effects slow down the electrons and significantly alter their trajectories, leading to distinctive Thomson scattering spectra and radiation patterns. It is proposed to use such spectra, which include contributions from harmonic and Doppler-shifted radiation, as a tool to measure laser intensity at focus. We discuss the feasibility of this approach for state-of-the-art and near-future laser technologies. We propose using Thomson scattering to measure the impact of radiation reaction on electron dynamics, thereby providing experimental scenarios for validating our model. This work aims to contribute to the understanding of electron behavior in ultra-intense laser fields and the role of radiation reaction in such extreme conditions. The specific properties of Thomson scattering associated with radiation reaction, shown to be dominant at the intensities of interest here, are highlighted and proposed as a diagnostic tool, both for this phenomenon itself and for laser characterization in a non-intrusive way.

1. Introduction

Due to the dramatic increase in laser peak intensities over recent decades [1,2], it is now possible to reach peak intensities as large as 10 23 W/ cm 2 [3]. Indeed, this frontier is advancing rapidly. At such extreme fields, atoms are highly ionized, including inner shell electrons [4]; thus, studies of strongly relativistic dynamics of these electrons are of paramount relevance. It is well known that a charged particle inside a linearly polarized laser field experiences an oscillatory motion in the direction of the laser electric field with a forward drift due to coupling with the magnetic field [5], as well as other side effects due to the longitudinal components of the laser at focus. The nonlinearities included in the relativistic motion give some peculiar properties to the trajectory. Moreover, since electrons are accelerated so violently, radiation reaction (RR) and other effects can play a dominant role [6,7,8,9].
Laser-driven electrons follow trajectories characterized by rapid accelerations and decelerations due to their coupling with the fields, causing them to radiate. This radiation is not limited to the frequency of the laser but also occurs at its harmonics—odd harmonics due to coupling with the electric field and even harmonics due to interactions with the magnetic field. Additionally, the emitted radiation is Doppler-shifted. These Thomson radiation spectra have been proposed as a tool to measure the laser intensity at the focus point because any atoms placed in the path of an ultra-intense laser will be ionized. At very low pressures (≤ 10 mb ), the residual gas is ionized at the focus, and the resulting electrons radiate in an intensity-dependent manner, allowing the peak intensity at the focal point to be gauged directly, thus avoiding indirect measurements. In these cases, the electrons ionized from the residual gas typically start their motion with an initial velocity close to zero.
An alternative way to observe electronic motion is to inject pre-accelerated electrons inside the beam. This is a technique, described extensively in the literature [10], that allows even more extreme dynamics, particularly in the counter-propagating case. In this paper, we consider a bunch of accelerated electrons (to energies in the 1 GeV range) that are moving head-on to an ultra-fast ultra-intense near-infrared laser pulse in such a way that they coincide near the focus of the laser. Close to the onset of relativistic intensities [11], the dynamics of the driven electrons is well described by the Lorentz force [5] provided that the fields are properly described and include the longitudinal components [12]. Their inclusion is fundamental for a correct description of the trajectories of the driven electrons.
In the present paper, we will study the counter-propagating case (electrons are moving initially counter-propagating to the laser). Obviously, electrons see the laser pulse with the corresponding Lorentz boost. Therefore, the relativistic dynamics is extremely violent, particularly at intensities close to the present record [3], and this constitutes the scenario for studying new effects that are characteristic of this extreme and still unexplored regime. Among the foreseen effects, RR can be the dominant one for this regime before the onset of pair cascading. This effect will probably be dominant at intensities higher than the one available today. It should be noted that, in any case, we are still well below the onset of electron–positron pair creation (the Breit–Wheeler limit [13,14]). Here, we wish to show that RR is a dominant process at such extreme energies and that electrons lose most of this initial energy. Moreover, the pattern of radiation will be analyzed. The effect of RR is therefore double; it causes a reduction in the kinetic energy and it generates specific radiation patterns. This radiation gives a lot of information about the driven electron dynamics and about the intensity of the extreme field.
Quantum effects, quantified by the parameter χ = 5.9 × 10 2 E [ GeV ] I 0 [ 10 20 W / cm 2 ] , are moderate at the lowest intensity considered in this study ( I 0 = 10 21 W / cm 2 and 1 GeV electrons, χ = 0.18 ) but become substantial at 10 23 W / cm 2 , where χ = 1.9 for 1 GeV electrons. However, a crucial finding of this work is that electrons with an initial energy of 1 GeV experience significant energy loss due to radiation reaction, up to 90% in some cases, before reaching the peak intensity region. Thus, calculating χ based on the initial electron energy and the maximum peak intensity can be misleading. By the time the electrons reach the vicinity of the laser’s peak intensity, their energy is substantially reduced, leading to an effective quantum parameter χ that remains below unity even at 10 23 W / cm 2 . While a comprehensive treatment of radiation reaction (which should include quantum effects) is beyond the scope of this study, our objective is to compute classically the expected radiation pattern from Thomson scattering using a solid and realistic model for the laser pulse, and to utilize these calculations as a guide for designing experiments capable of clearly identifying the radiation reaction effect. A classical Hamiltonian approach has been proposed recently that yields a new integral representation of the RR force [15]; however, no practical use of that representation will be made in this paper, and RR is computed here within the framework of the classical Landau–Lifshitz–Hartemann equation [16,17]. This equation has been widely used to model RR effects in both ultra strong static or dynamic (time-varying) electromagnetic fields. It seems interesting to study the classical scattering of high-energy electrons off extremely high-intensity laser pulses, in the range of 10 23 W/ cm 2 , including RR. Previous computations, summarized in a recent publication [16], correspond to the intensity range of 10 21 to 10 22 W/ cm 2 . Also, previous results in the literature suggest that, for state-of-the-art laser peak intensities and for electron energies in the range of hundreds of MeV to a few tens of GeV (electrons counter-propagating to the laser pulse), RR can be extraordinarily relevant. RR can substantially slow down the electrons, and moreover, the perturbation of their trajectory is so dramatic that for certain situations, they can end up moving co-propagating to the laser pulse. The highest intensities achieved to date are for tightly focused laser pulses in the near-infrared, with transverse spot sizes of ≤4 μ m. This, in turn, implies very large ponderomotive forces on the electrons that will tend to expel them from the laser high-intensity zone. Taking into account that one of the main goals of present-day extreme laser research is to study how the electrons behave at such record intensities, designing strategies to locate a free electron at the core of such laser pulses, or knowing the maximum electric field sensed by them, is of paramount interest.
It is well known that any realistic description of electron behavior at extreme intensities must account for the effect of RR. In our description, RR is computed from the classical Landau–Lifshitz–Hartemann equation. The energy loss of a strongly driven electric charge is a fundamental problem that has received a lot of interest for many decades (see [17,18,19,20,21,22,23,24,25,26,27,28]), with different descriptions of the dynamics and with some of them also including QED corrections. In this paper, we will use a model based on the classical Landau–Lifshitz–Hartemann equation that considers an RR term which is proportional to γ 2 , and quadratic in the laser field components, the latter one being very large in counter-propagating geometry; see the full details in Section 2.
It is worth considering the slowing down of an electron due to the loss of radiated energy and following its trajectory. However, it is even more interesting to analyze the scattered radiation spectrum. In this paper, we will study RR and calculate the radiated spectrum due to Thomson scattering (TS). Such radiation is calculated for a geometrical set-up that can be contrasted experimentally. Therefore, we propose here a new way to study RR under realistic conditions with challenging, but feasible, measurement techniques. This is the key point that is proposed in the present paper. RR is quite a controversial topic and there are different models to describe such radiation and the subsequent slowing down of the electron. We have developed a model that is well aligned with the core literature in this area. However, our main goal is not just to argue in favor of this particular RR model. Our aim, instead, is to use TS to measure, under the extreme conditions that make RR dominant, the impact of RR on the dynamics and subsequent radiation. Intensity is the key parameter to reach the extreme dynamics of the driven electrons. However, extreme intensities are associated with very tight focusing. For example, the present record intensity [3] has been achieved with a very short focal number, f/1.1. The problem is that a description of such tight focuses requires the use of vectorial fields [29], which complicates the dynamical processes involved. Our intention is to describe not only the TS radiation subsequent to RR of strongly driven electrons, but to propose a possible scenario where a clean measurement of the TS spectra can give direct information of the RR dynamics. For this purpose, it is much cleaner to consider longer focuses where a Gaussian description of the field, without forgetting the longitudinal components [12], can be justified.
At the extreme intensities available with current lasers, the TS patterns with and without RR are radically different. Thus, the correct description of RR is going to become a fundamental issue as peak intensities of lasers increase. TS spectra are currently a very fundamental tool for observing the dynamics of driven electrons and their relevance will increase with the evolution of laser peak power.
We chose an initial energy for the counter-propagating electron bunch of 1 GeV. This is the only initial energy to be considered in the present paper. We have selected this value because it is high enough and, at the same time, it is feasible in many accelerators with well-known technology and with a very high degree of bunch control. For example, the European XFEL at Hamburg [30] can produce electrons with energies up to 16 GeV. Moreover, at 1 GeV initial energy, the incoming electrons are strongly relativistic ( γ = 2000 ) and, as will be seen in simulations, RR effects dominate their dynamics at extreme laser intensities. Moreover, an overly high initial electron energy could open new QED channels [31], allowing pair creation, but this is not the purpose of this work.
The paper is organized as follows. Section 2 includes a general formulation of the model to describe RR and to obtain TS spectra. Section 3 presents the scenario we have modeled for a relatively modest intensity 10 21 W/ cm 2 and a large focal. These parameters can be seen as the entrance to the region where RR is becoming relevant. Section 4 presents the scenario for a short focal (short but not short enough to prohibit the use of a Gaussian paraxial description of the fields) and intensity 5 × 10 22 W/ cm 2 . Section 5 presents the case of a long focal for an extreme field, this probably being at the limit of today’s technology, 7.5 × 10 22 W/ cm 2 . We end the studied cases with Section 6, where we consider the current intensity record 10 23 W/ cm 2 [3], but for a waist slightly wider than that reported for the said record, making the generation of this laser pulse even more demanding. This latter result can be considered as being at the limit of today’s technology. In all cases, but particularly in the last ones, the effect of RR dominates the electron’s trajectory and slows down dramatically its initial energy (electrons move initially counter-propagating to the laser field). As a consequence of this acceleration, the electrons radiate. This Thomson radiation is going to be described throughout the different sections and we will propose that such radiation patterns can be used as a direct measurement of the RR dynamics. We hope that this may help to discriminate—based on experiments—which of the different RR models describes more accurately RR dynamics. A comparison of the dynamics with and without RR is presented in some cases to stress the importance of considering RR in the strongly relativistic regime.

2. Formulation of the Model

The laser field in this study is modeled using the paraxial approximation, as described by Erikson [12], through a vector potential with a single non-zero component, denoted as A x , e x . Consequently, A y , e x = A z , e x = 0 from the beginning, even before applying the paraxial approximation. Generally, the paraxial (denoted with the subscript p a r ) approximation for the exact potentials X e x = Φ e x , A ¯ e x is expressed as:
X e x X p a r
This approximation, which is well established, assumes that:
2 z 2 X e x 2 k 0 z X e x
where k 0 = ω 0 / c = 2 π / λ 0 is the laser’s wavevector.
Within the paraxial approximation, the governing equation becomes:
x ¯ 2 + 2 i k 0 z X p a r = 0
Under these conditions, the scalar potential is determined by enforcing the Lorentz gauge condition, leading to:
x A x , p a r = i ω 0 c 2 Φ p a r
From A x , p a r , the electromagnetic fields of the laser under the paraxial approximation are derived as follows:
E x , p a r = i ω 0 A x , p a r
E y , p a r = 0
E z , p a r = i k 0 Φ p a r
B x , p a r = 0
B y , p a r = i k 0 A x , p a r
B z , p a r = y A x , p a r
These equations provide solutions to the Maxwell equations in the leading paraxial approximation. It is important to note that E z and B z are generally non-zero and are included in all computations unless otherwise specified.
The fundamental TEM 00 Laguerre–Gauss mode is employed in this paper for A x , p a r . This mode, corresponding to ( l , p ) = ( 0 , 0 ) , is represented by the function g 0 , 0 as follows. With ρ = ( x 2 + y 2 ) 1 / 2 , we define:
g 0 , 0 = 2 π exp ρ 2 w ( z ) 2 exp i z z 0 ρ 2 w ( z ) 2 f z z 0
f z z 0 = w 0 w ( z ) exp i arctan z z 0
w ( z ) = w 0 1 + z z 0 2
z 0 = k 0 w 0 2 2
ϵ ˜ 0 = w 0 z 0 = 2 k 0 w 0
where w 0 is the beam waist size, z 0 is the Rayleigh range, and ϵ ˜ 0 is a dimensionless coefficient, distinct from the vacuum permittivity, which measures the relative importance of the longitudinal field components E z and B z compared to the transverse components.
To represent the pulsed nature of the electromagnetic fields, we set:
A x , p a r = A 0 × g 0 , 0 × exp i ( k 0 z ω 0 t + χ 0 ) × exp ( k 0 z ω 0 t k 0 z i n i t i a l ) 2 ( ω 0 τ ) 2
where A 0 is a constant that determines the laser intensity, z i n i t i a l is the position of the Gaussian envelope center at t = 0 , and τ is related to the pulse width.
The electric and magnetic fields of the laser pulse are then derived using the standard relations:
E = A t x Φ
B = x × A
with the real parts taken as necessary. The fields E x , p a r , E y , p a r , E z , p a r , B x , p a r , B y , p a r , and B z , p a r are directly obtained from these expressions.
It is worth noting that for large w 0 , the above vector potential simplifies to:
A ( η ) = A 0 cos ( η ) f ( η ) e x ,
where η ( t , z ) = k 0 z ω 0 t is the phase, A 0 is the amplitude, and e x is the unit vector along the X-axis, with f ( η ) describing the pulse shape, Gaussian in this case. Although this form is commonly used in theoretical studies, the more complex model proposed here provides a more realistic description of ultra-short and focused lasers.

2.1. Radiation Reaction for Relativistic Electrons: Landau–Lifshitz–Hartemann Approximation

The RR is modeled here using the classical Landau–Lifshitz equation, which includes, in addition to the Lorentz force, the following terms (in MKS units):
T 0 = e 4 6 π ϵ 0 m 2 c 4 c E × B + c B × ( B × v ) + 1 c E v · E
T 1 = e 3 6 π ϵ 0 m c 3 t + v ( t ) · E + v ( t ) × t + v ( t ) · B γ ( t )
T 2 = e 4 6 π ϵ 0 m 2 c 5 E + v ( t ) × B 2 1 c 2 E · v ( t ) 2 γ 2 ( t ) v ( t )
γ ( t ) = 1 1 v ( t ) 2 / c 2
The terms T 0 , T 1 , and T 2 exhibit different dependencies on the relativistic γ factor. Specifically, T 0 is independent of γ , T 1 is linear in γ , and T 2 scales with γ 2 , making it the most significant in counter-propagating geometries. Therefore, using the notation:
F R R , L L H ( E , B ) = T 2
The equation that models RR can be expressed as (Landau–Lifshitz–Hartemann approximation):
d [ m γ ( t ) v ( t ) ] d t = e E + v ( t ) × B + F R R , L L H ( E , B )
where E and B are the electromagnetic fields of the laser. This model, as discussed in the literature (see [16,32] and references therein), offers a significant computational speed-up compared to more complex models, while retaining essential physical details. However, it is important to note that this approach is not universally applicable. If a different interaction geometry is considered, the relative significance of the various terms in the Landau–Lifshitz equation must be re-evaluated, and the model should be adjusted accordingly.

2.2. Thomson Scattering Computational Details

After computing an electron’s trajectory using the Landau–Lifshitz–Hartemann equation, the scattered fields in the time domain are calculated from the radiation part of the Liénard–Wiechert fields. This calculation takes into account the relevant time scales of the electron dynamics and the detection time and is performed for each trajectory in the sample under consideration.
The radiation components of the electric field E rad and the magnetic field B rad from a moving charge q in MKS units are given by:
E rad = q 4 π ϵ 0 n ^ × n ^ v c × v ˙ ( 1 n ^ · v c ) 3 R
B rad = 1 c n ^ × E rad
where:
  • q is the charge of the particle.
  • ϵ 0 is the permittivity of free space.
  • v is the velocity of the charge at the retarded time.
  • v ˙ is the acceleration of the charge at the retarded time.
  • c is the speed of light in a vacuum.
  • R   =   | x d x q ( t ret ) | is the distance between the charge and the observer or detector at the retarded time t ret .
  • n ^ = x d x q ( t ret ) R is a unit vector pointing from the charge to the observer or detector (retarded position).
  • t ret is the retarded time, defined by the equation t ret = t R c = t | x d x q ( t ret ) | c .
Subsequent Fourier Transform (FFT) of the fields allows the computation of the power spectrum for each electron. After resampling over a fixed frequency range, the results are averaged to produce the final Thomson spectrum for the electron trajectories under study. The scattering geometry and the details regarding the scattering angles for the different case studies reported are described in Section 3, Section 4, Section 5, Section 6 and Section 7.

3. Studied Scenario

We aim to remain relatively close to the state of the art and therefore consider the case of a Ti:Sapphire laser with a central wavelength of 800 nm. This choice of 800 nm is not arbitrary. The dramatic development of the Chirped Pulse Amplification technology allows us to now reach record high fields with those lasers [3]. The 800 nm laser uses Ti:Sapphire laser amplifiers. Other active materials are possible, emitting pulses with central frequencies in the visible or in the near-infrared; however, Ti:Sapphire amplifiers emitting pulses centered at 800 nm with a very broad laser bandwidth represent today’s leading technology. We selected this central wavelength in order to propose experiments than can be feasible with the foreseen developments. Although such large lasers typically have a flat-top profile at the exit of the pulse compressor, we consider a Gaussian pulse for simplicity. We assume a waist w 0 large enough to allow the paraxial approximation and a pulse length of eight laser cycles (or periods) with a Gaussian envelope for the electric field, f G ( t ) = f ( η ( t , 0 ) ) = exp ( t 2 / τ 2 ) . Such ultra-short pulses necessarily have a broad bandwidth, and we refer to the central wavelength as λ 0 = 800 nm .
For this central wavelength, the period is 2.6 fs. For τ = 8 cycles, this corresponds to a full width at half maximum (FWHM) in intensity of 24.5 fs, which is quite realistic with today’s existing multi-PW lasers at focus. This pulse duration is used for all simulations in this paper. Current technology with optical parametric chirped pulse amplification (OPCPA) lasers allows pulse durations of 15 fs or less at the exit of the pulse compressor. However, maintaining such short durations at the focal spot is extraordinarily difficult. Therefore, we consider eight cycles at focus as a very realistic pulse length and do not explore shorter durations. A future few-femtoseconds carrier–envelope phase (CEP) stabilized laser would be an excellent tool to explore RR dynamics.
Regarding the laser pulse waist, we consider two values: w 0 = 8   μ m , corresponding to an f-number of f/11.5, and w 0 = 4   μ m , corresponding to an f-number of f/5.7. Much shorter f-numbers are possible, with the world record being f/1.1. However, for such short focal numbers, the Gaussian paraxial description is likely invalid, and the dynamics can be too complex to extract information from the TS patterns.
Recall that the f-number (N) is proportional to the waist by the relation N = 1.15 × w 0 . The waist (focus) is at z = 0 . Throughout this paper, the laser is linearly polarized along the X-axis, and we consider propagation along the Z-axis. Since the pulse is tightly focused, longitudinal fields E z and B z are included [12]. The accelerated electron is counter-propagating relative to the laser. We start computations when the center of the pulse is at z = 24 × λ 0 (i.e., 19.2 μ m before the waist).
We use standard notation: X (polarization of the laser electric field E), Y (polarization of the magnetic field B), and Z (propagation direction). We refer to the XY plane or the EB plane. For labeling purposes, we consider the main components of E and B. For realistic calculations, longitudinal components E z and B z must be accounted for.
In summary, the laser conditions regarding wavelength, mode, polarization, and pulse width are λ 0 = 800 nm , TEM 00 mode with full paraxial fields ( E z and B z included), X-polarization, pulse width = 8 × λ 0 / c , Gaussian pulse envelope initially centered at 24 × λ 0 . The electron sample is initially in an exact counter-propagating configuration, with all electrons starting at z 00 = 0 and transverse positions uniformly and randomly distributed up to ρ 0 = 0.25 w 0 .
We consider an electron bunch with all electrons moving at the same speed (neglecting energy spread), initially at z 00 = 0 . In the transverse direction, electrons spread uniformly along a disk of radius ρ 0 = 0.25 w 0 with negligible thickness. All electrons move at the same speed (1 GeV initial energy). The laser moves towards the positive Z-axis, while the electron bunch moves initially in the opposite direction. We do not consider the spreading in initial intensity as it is not relevant for this case.
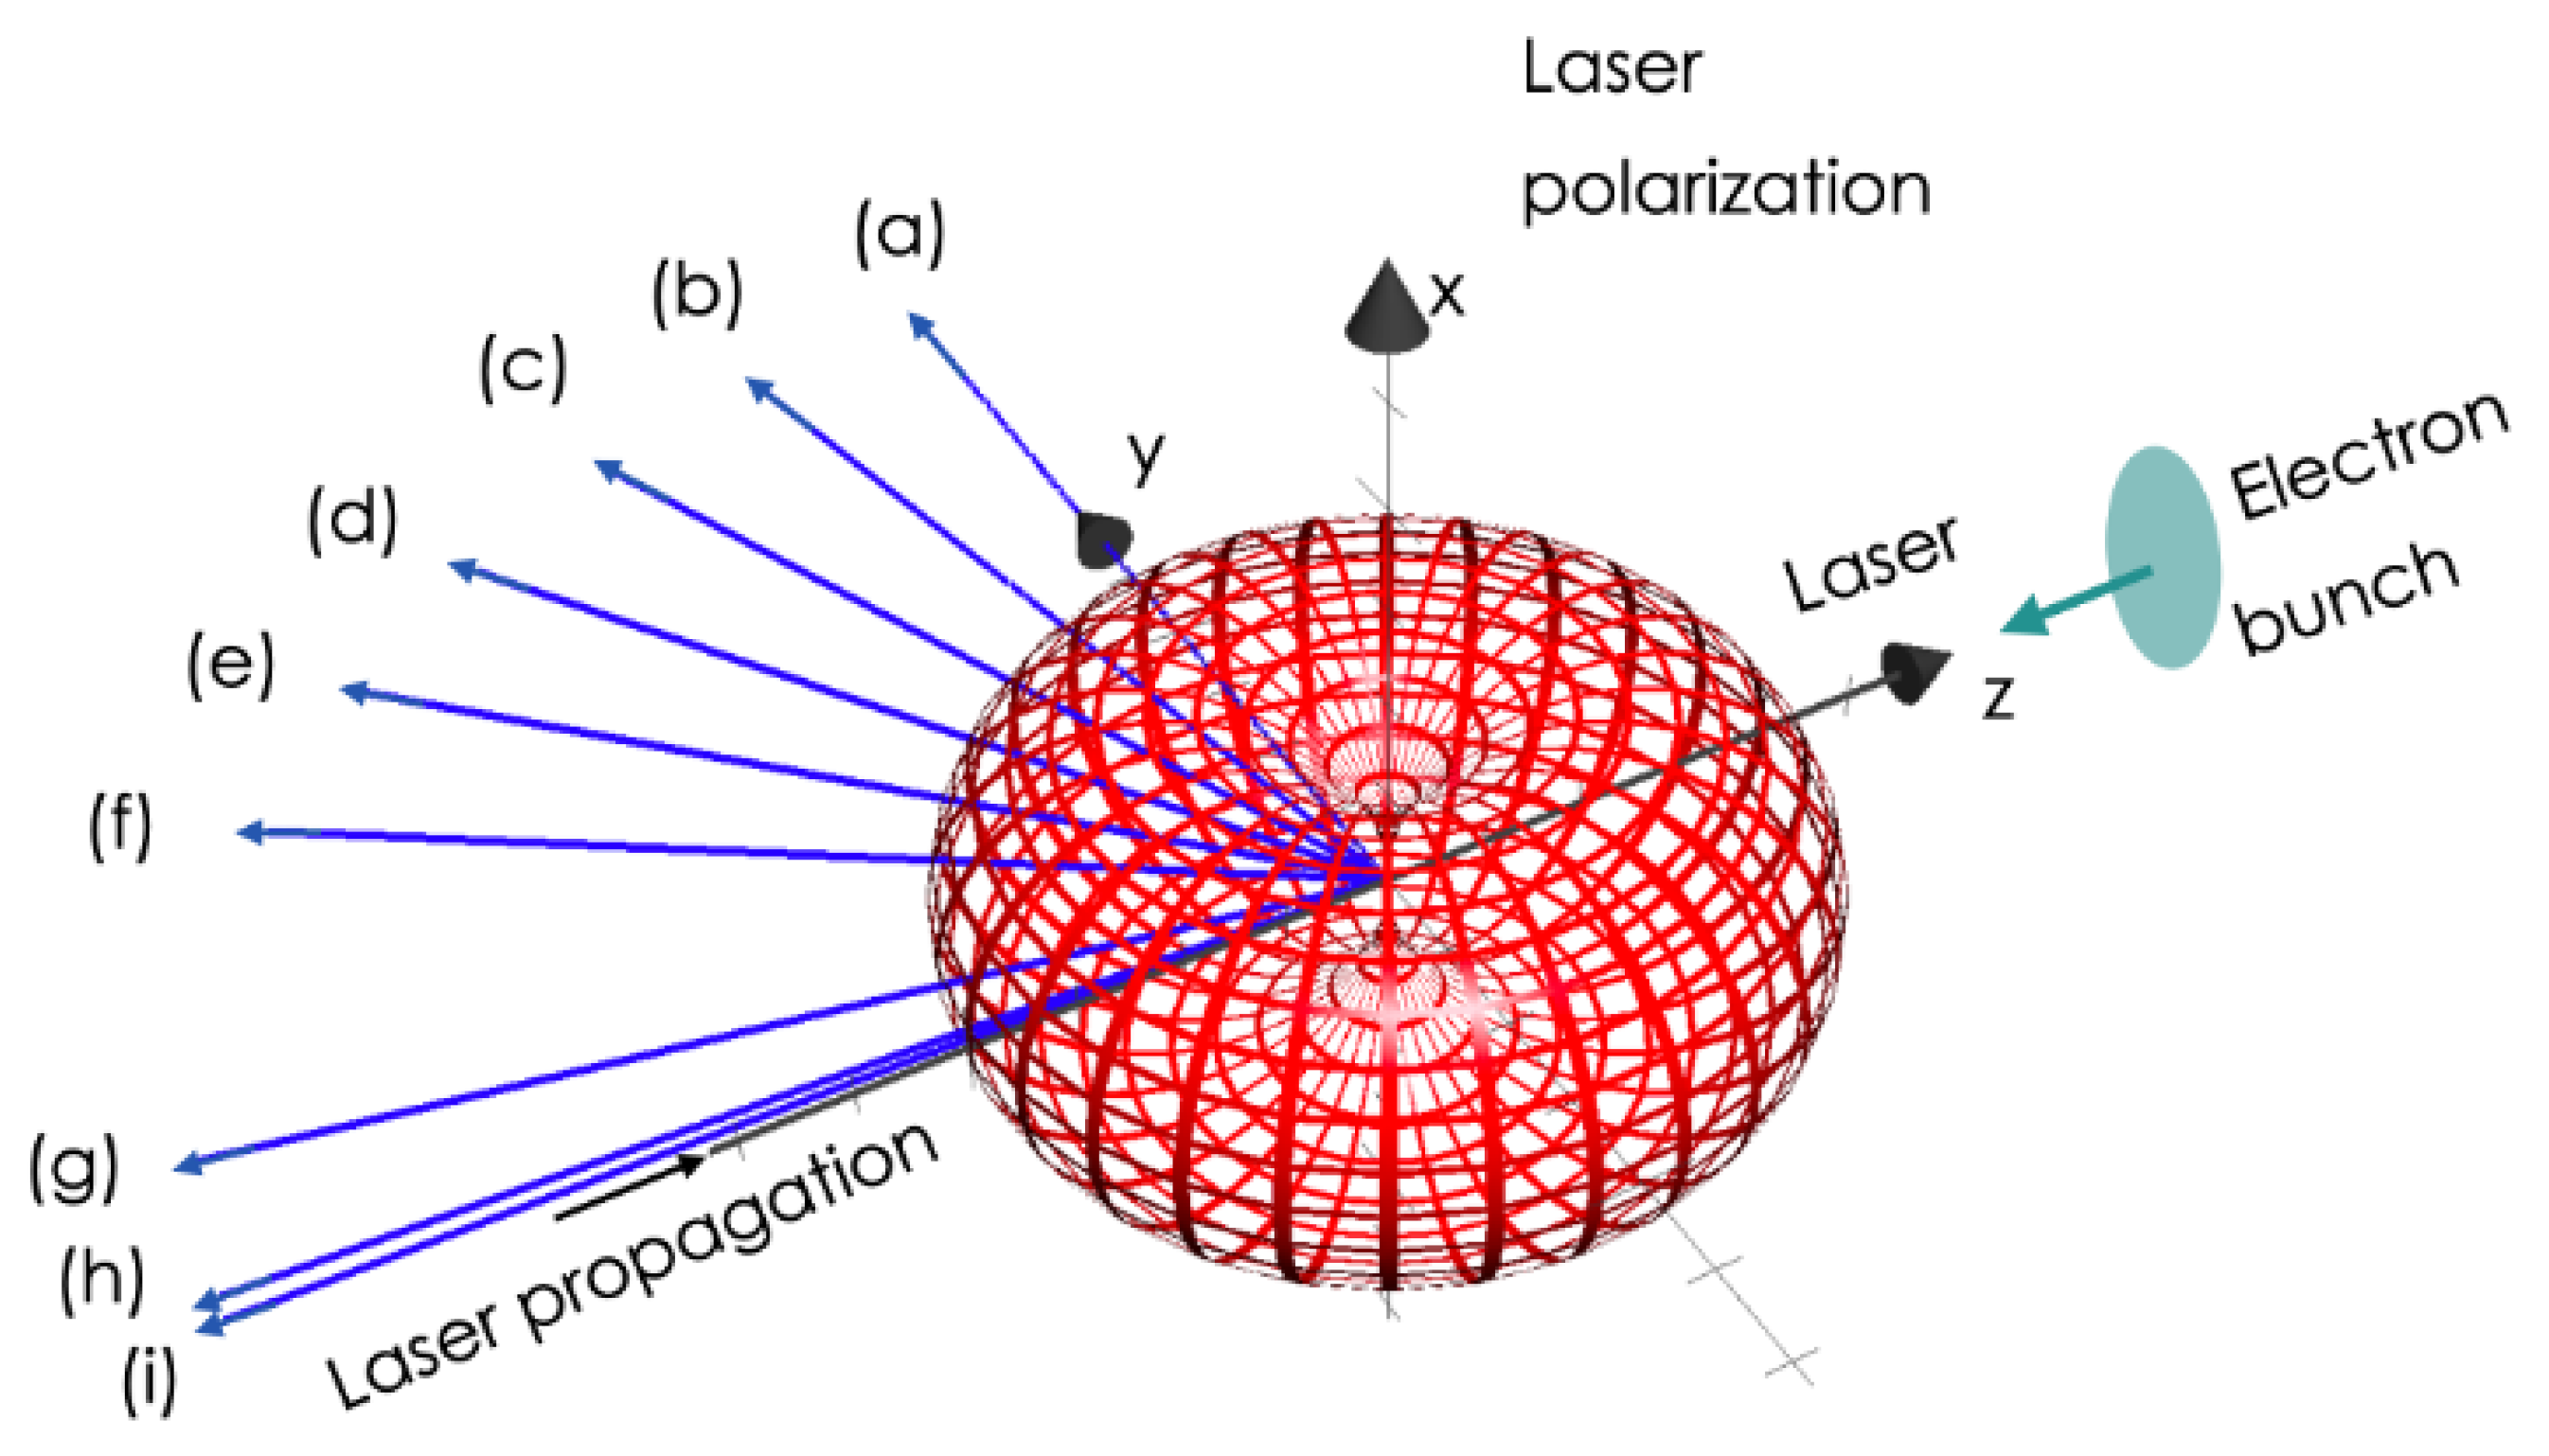
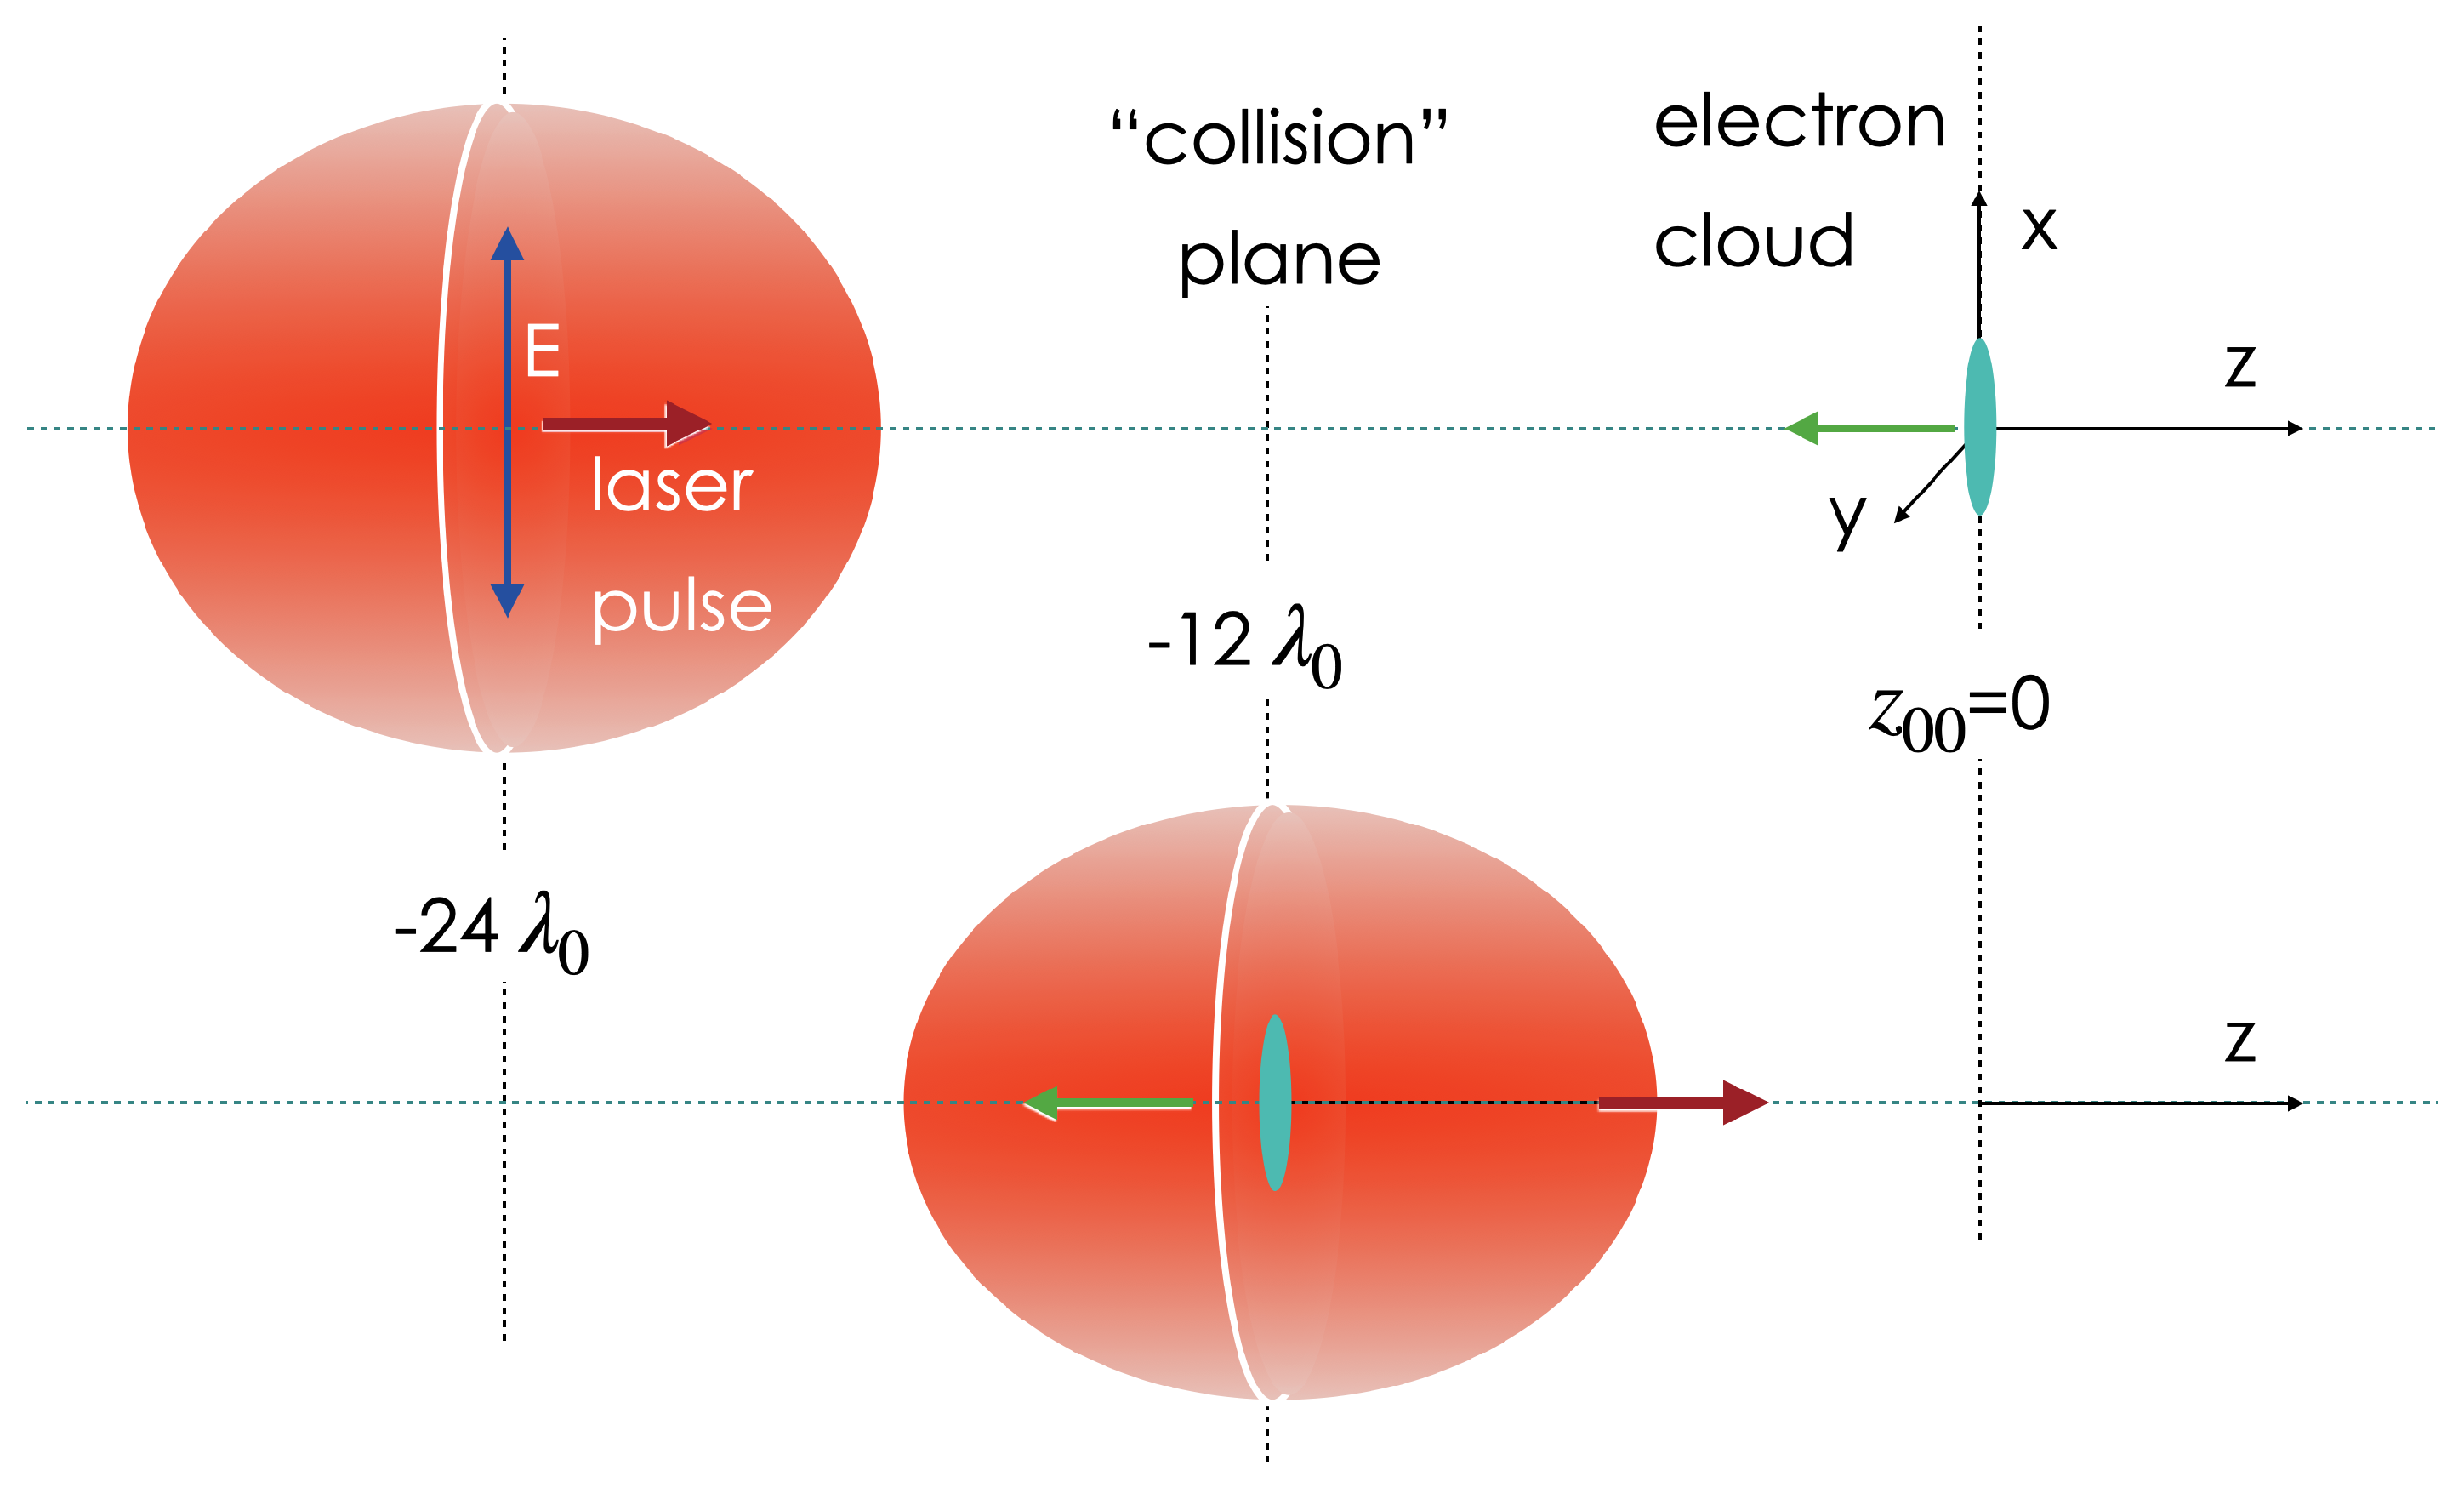
Figure 1 shows schematically the initial position with the electron bunch centered at z 00 = 0 and the laser pulse peak at z = 24 λ 0 (19.2 μ m ). Neglecting the interaction before that is a reasonable assumption. Since the electron’s initial speed is very close to the speed of light, c, the electron would cross the laser pulse close to z = 12 λ 0 . However, for extreme intensities, as we will describe, the trajectory of the electrons is going to be significantly modified. The ‘collision” between the electrons and the laser occurs in the situations we have studied a bit before the laser focus (at z = 0 ). We avoid considering this collision precisely at the geometrical focus because achieving perfect synchronization between the electron bunch and the laser pulse at the femtosecond level can be very challenging. Introducing a small offset shows that having the interaction exactly at focus is not a critical issue. This value lies well within the Rayleigh length, z R . For w 0 = 8   μ m , the Rayleigh length is z R = 252   μ m , and for w 0 = 4   μ m , it is z R = 63   μ m .
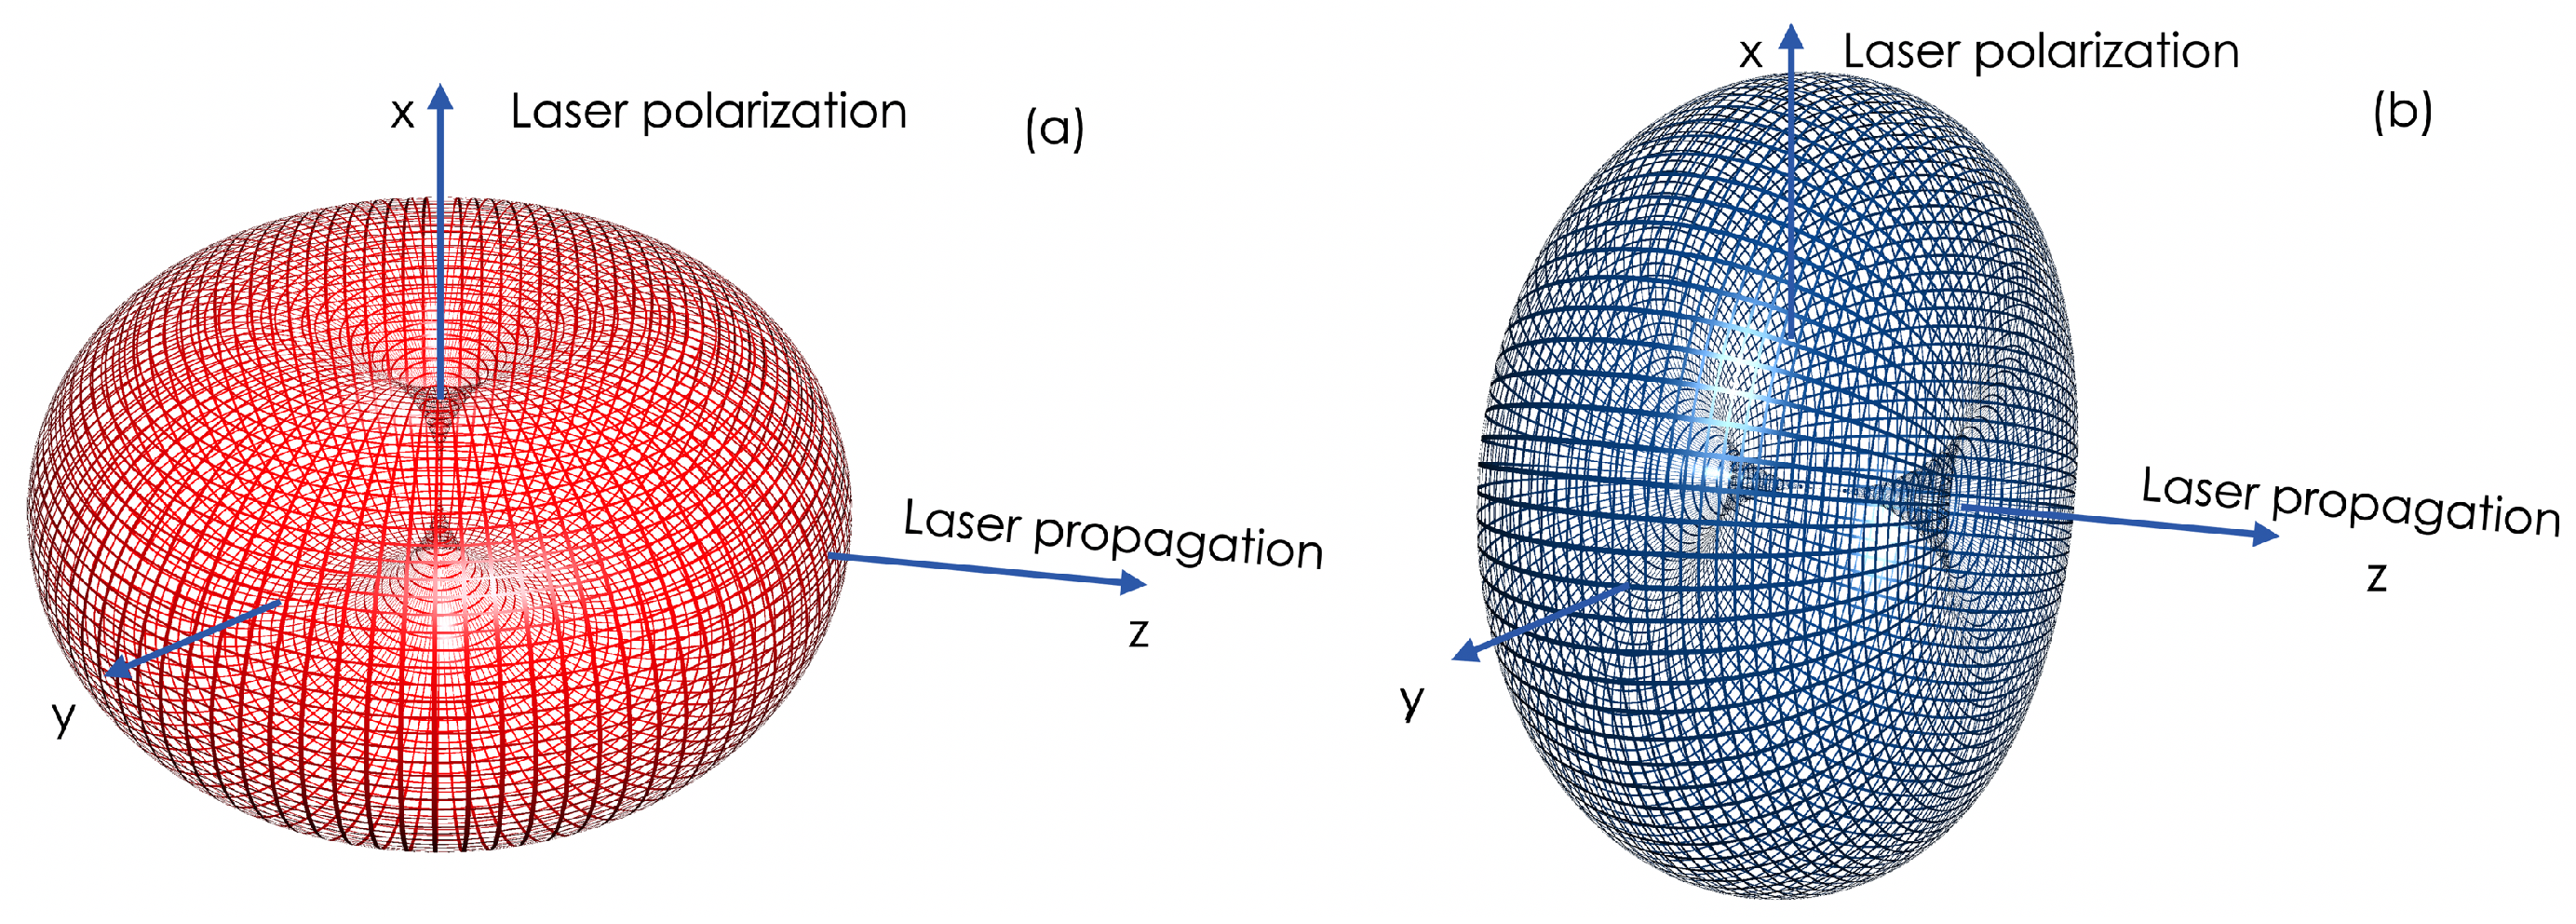
We study TS due to the laser’s linear polarization (X-axis); the emission of the fundamental peak is at its maximum along the perpendicular plane (YZ plane), as shown on the left side of Figure 2. The laser’s magnetic field induces radiation orthogonal to that, along the XY plane, as indicated on the right side of Figure 2. Relativistic effects from the fast-moving electrons distort these donut-shaped radiation spectra, as is well known in synchrotron radiation.
The interaction geometry is crucial for the detection and analysis of scattered photons. The laser pulse is focused to a spot size of either 4   μ m or 8   μ m , depending on the case study, creating a region of high intensity where the interaction between the laser and the electron primarily takes place.

4. Case of a Relatively Large Laser Pulse Waist and a Not-So-Extreme Laser Intensity

We start by describing the case of an electron driven by a laser with a peak intensity of 10 21 W / cm 2 , and a relatively large waist, w 0 = 8   μ m . This is a relatively long focal length, so the laser wavefront is nearly a plane wave, and the energy per shot will be quite demanding. However, for this intensity, this setup is feasible in many laser facilities. In a later section, we will present results for a much more demanding intensity.
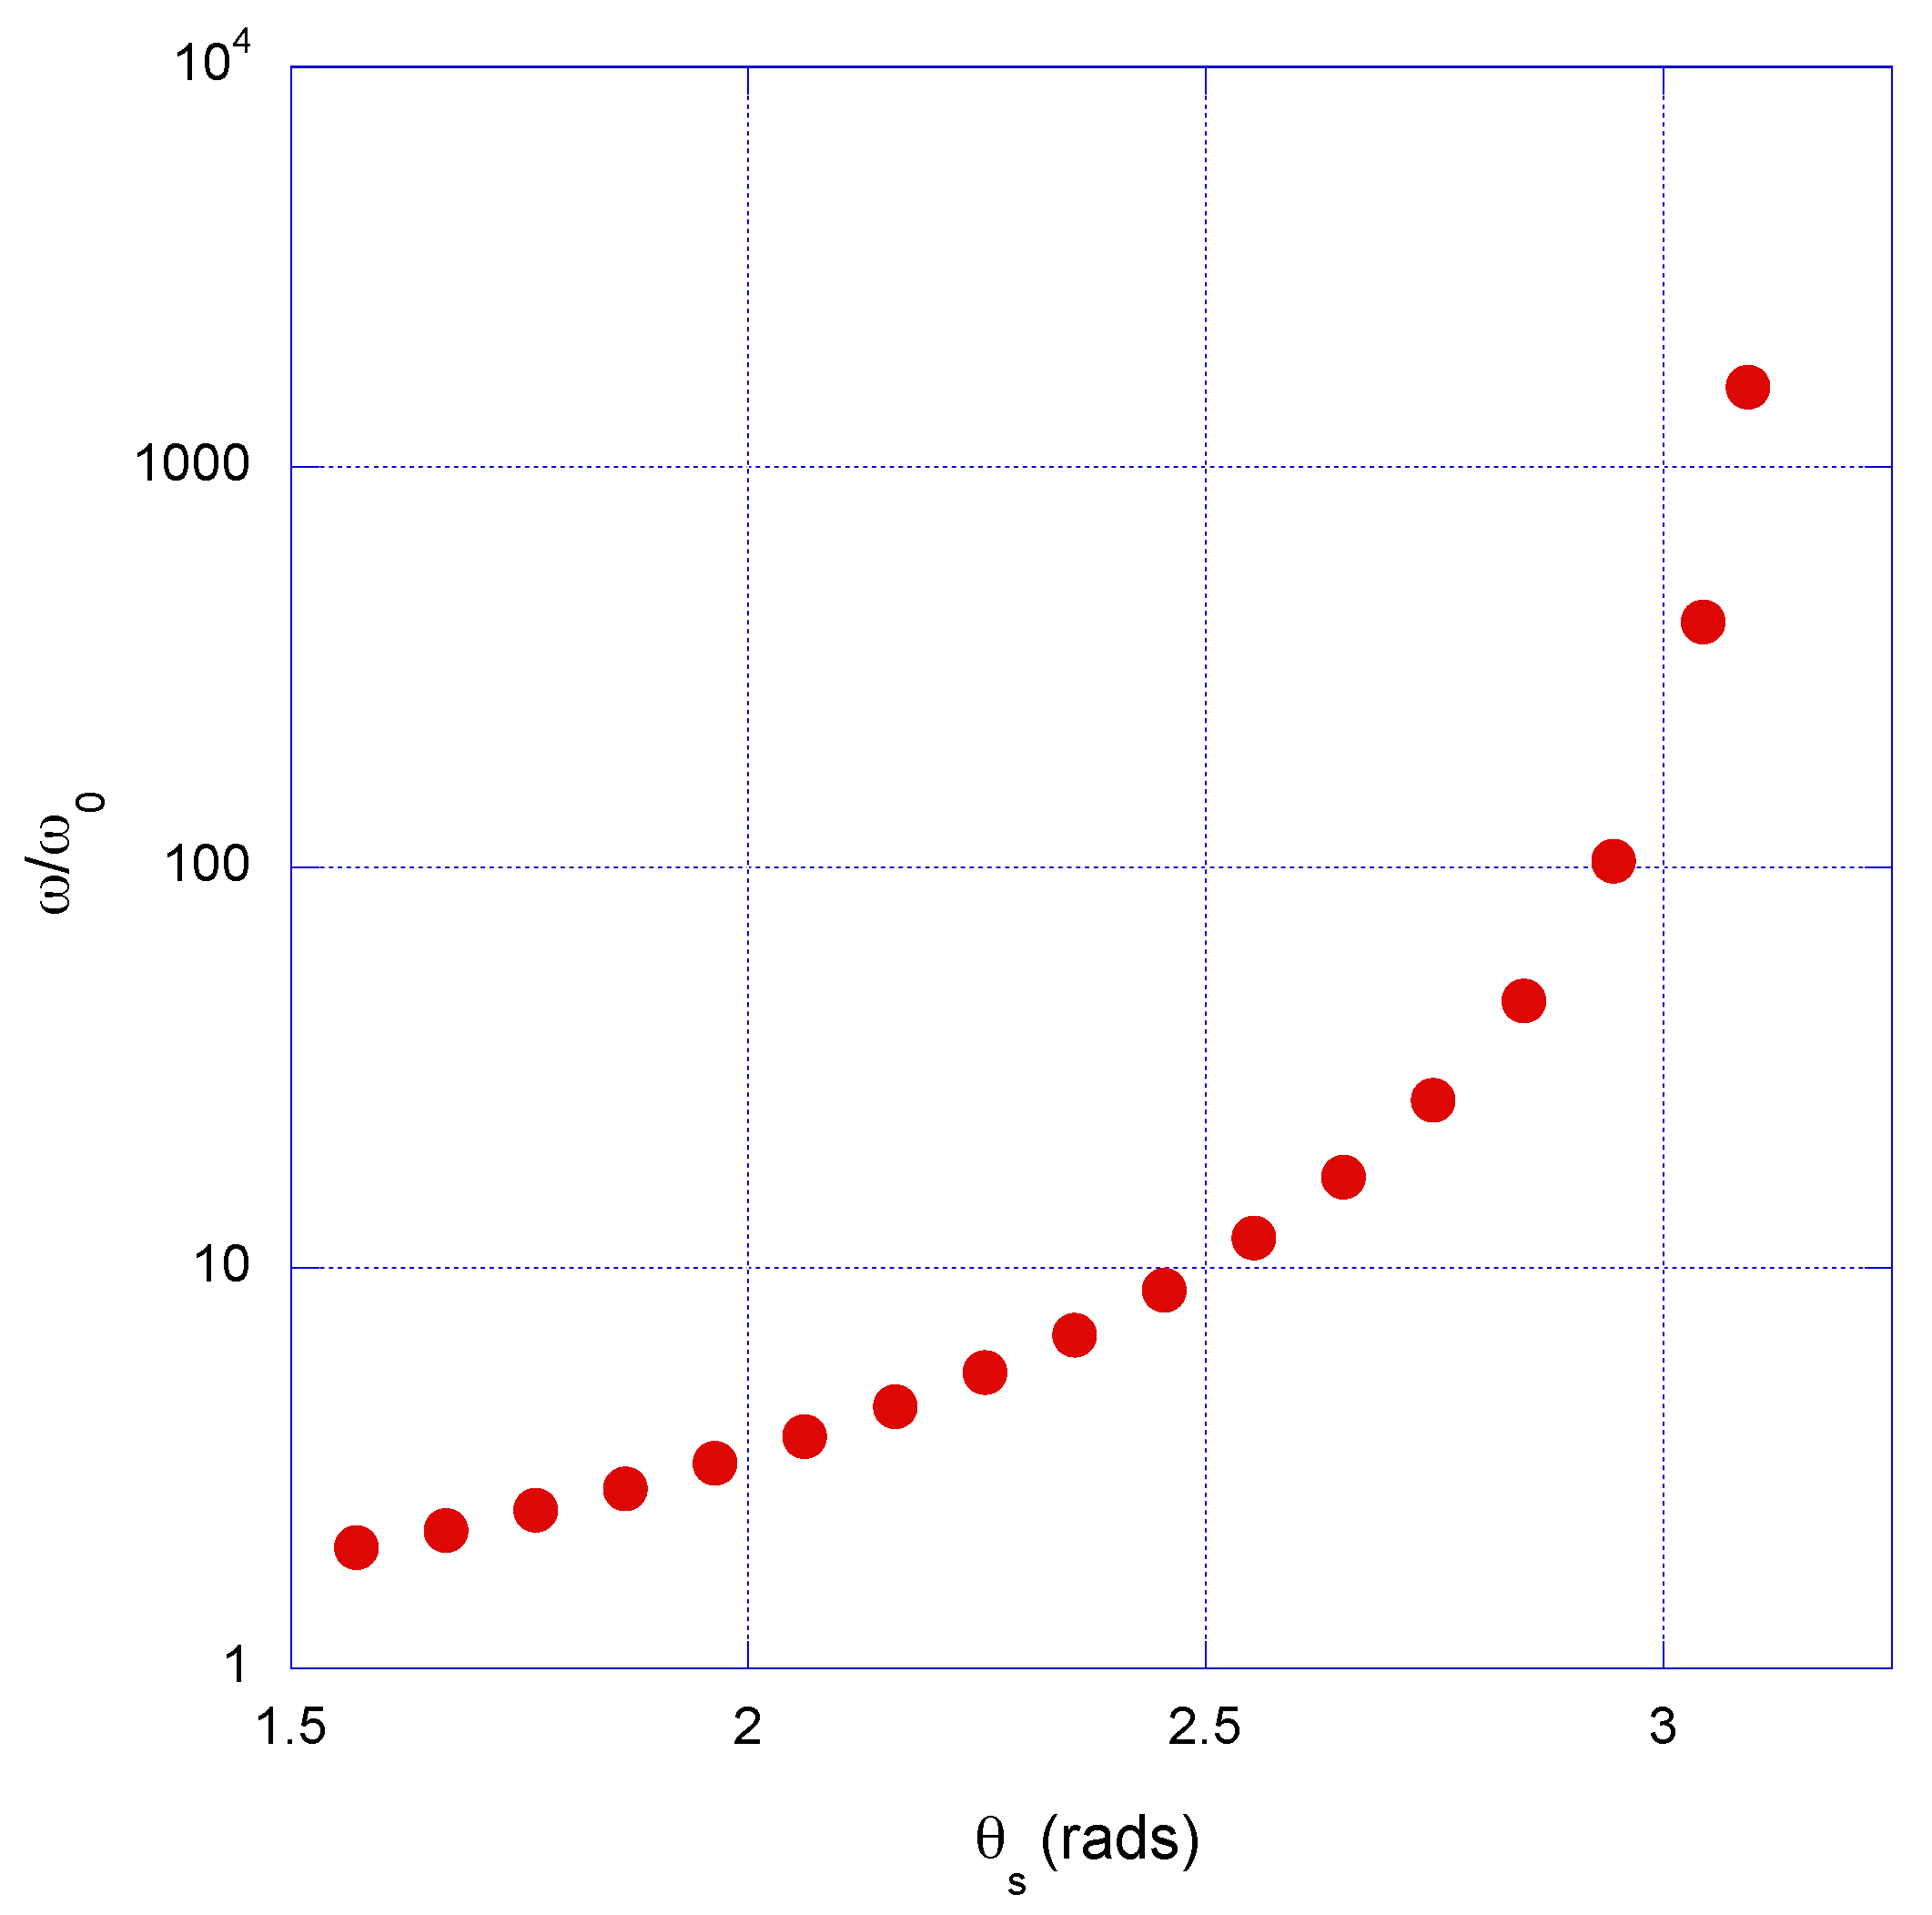
The TS frequency ω for the X-quadrature (i.e., along the laser polarization), normalized to the Ti:Sapphire central wavelength ω 0 = 2 π c λ 0 , is shown in Figure 3 as a function of the scattering angle θ s , which is the angle relative to the laser propagation direction. Thus, θ s = π / 2 indicates emission in the XY plane, and θ s = π indicates emission counter-propagating to the laser. Spectra are averaged for an electron sample aimed at the central part of the TEM 00 laser pulse, including RR, as a function of θ s . Scattering is computed in the YZ plane. Notice the extremely fast increase in the Thomson scattered radiation frequency with the scattering angle θ s , which is the blue shift due to the electron motion and which increases as θ s approaches π .
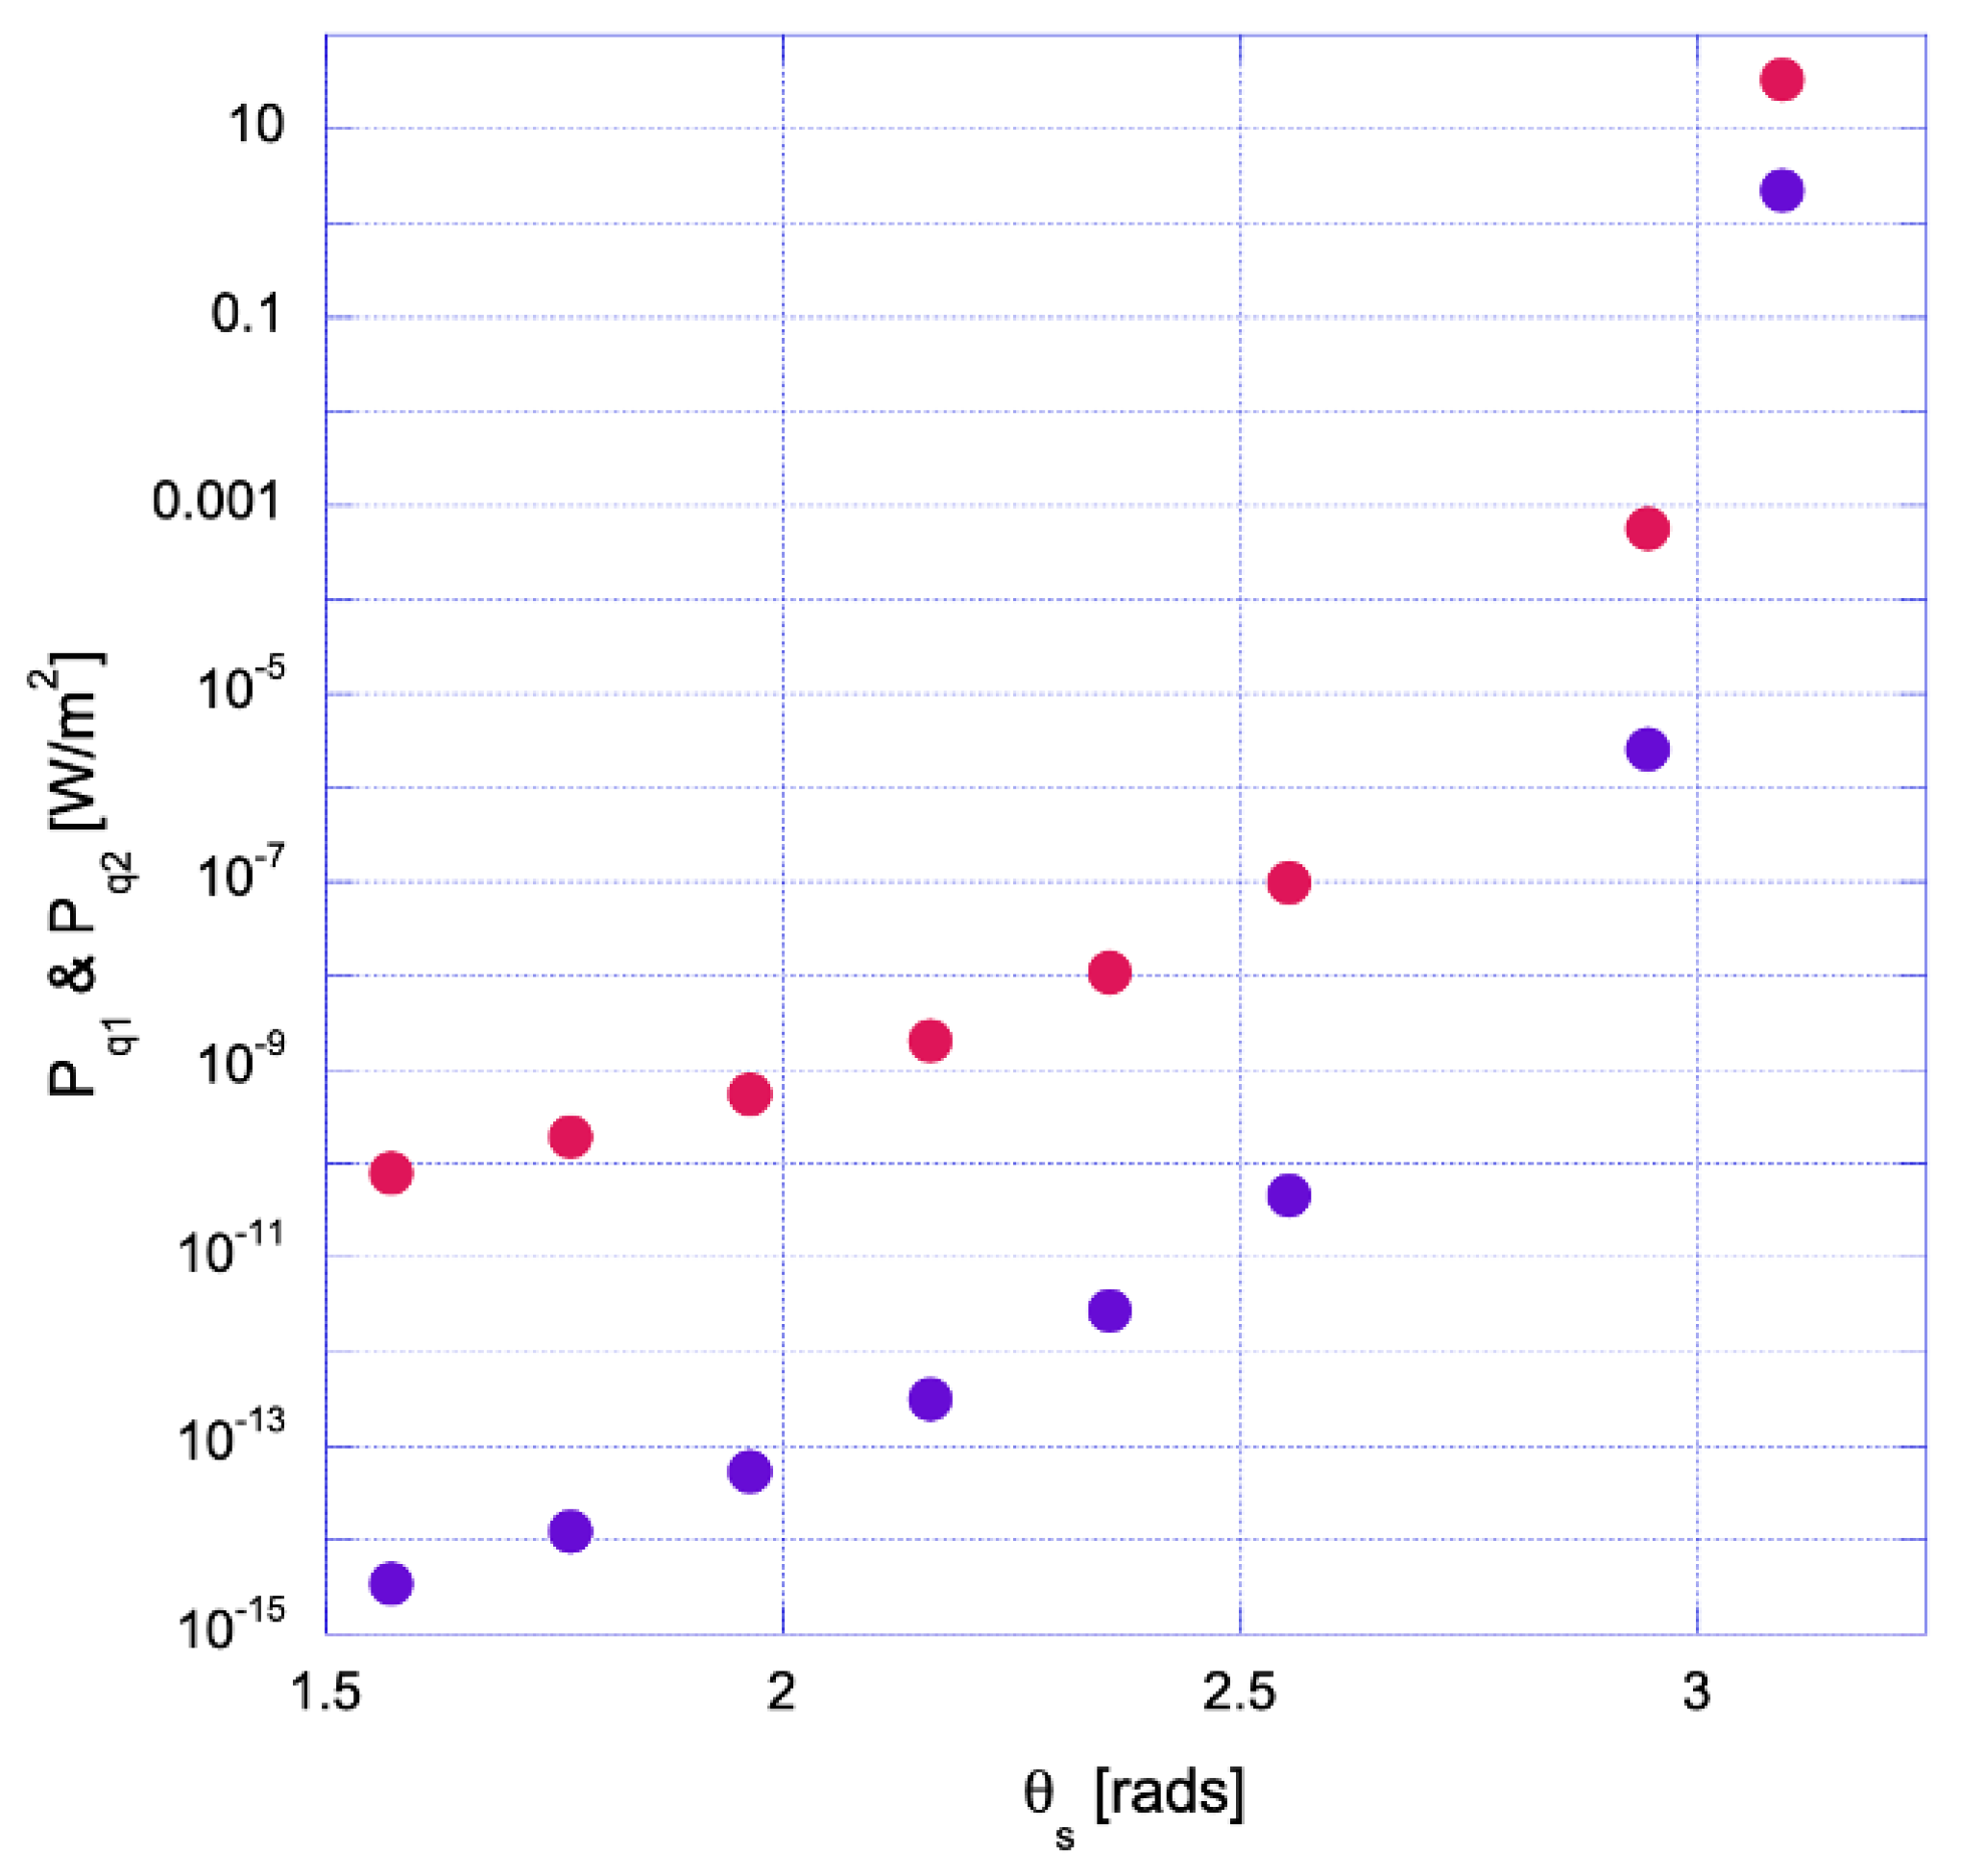
The power flux integrated in frequency is also strongly dependent on the direction of radiation, as shown in Figure 4. The X-polarization integrated spectral power is shown in red (quadrature q 1 ) and its orthogonal quadrature ( q 2 ) in blue, averaged for an electron disk incoming at the central part of the TEM 00 laser pulse. The radiated power includes RR and the corresponding TS as a function of the scattering angle. Scattering is computed in the YZ plane. Notice that for a scattering angle of π / 2 , the light is nearly completely polarized along the X-axis (extremely small blue dot at the bottom left of Figure 4). Notice also that the two orthogonal contributions (the two quadratures) become more balanced as the scattering angle approaches π . At the same time, most of the power is emitted in the region close to θ s = π .
A schematic representation of the scattering geometry is shown in Figure 5 and detailed TS spectra are depicted in Figure 6. Red spectra correspond to the q 1 quadrature, i.e., to the polarization parallel to the pulse transverse electric field. It is Doppler-shifted and also shows a bit of the third harmonic (Doppler-shifted too). The blue spectra correspond to the polarization in the YZ plane (the q 2 quadrature). Because they are generated by the motion due to the laser pulse magnetic field contribution, they correspond to even harmonics (even Doppler-shifted harmonics). In this case, which we refer to as not so extreme, RR Thomson spectra still show a peaked structure. The broadening of the peaks in (i) is a Fourier effect, and the structure in each peak does not correspond to any resonances. These plots correspond to the far field. In our calculations, we have considered the radiation in the YZ plane at a distance R = 0.5 m from the beam waist. This distance is sufficient to be considered the far field. In the rest of the cases considered, the far field is calculated in the same way.

5. Case of an Intense and Focused Laser Pulse

In this section, we analyze the scenario where the laser beam waist w 0 is 4   μ m . This configuration, while not extremely tight, is more focused compared to the previous section. The laser peak intensity is increased to 5.0 × 10 22 W / cm 2 , but all other parameters remain the same.
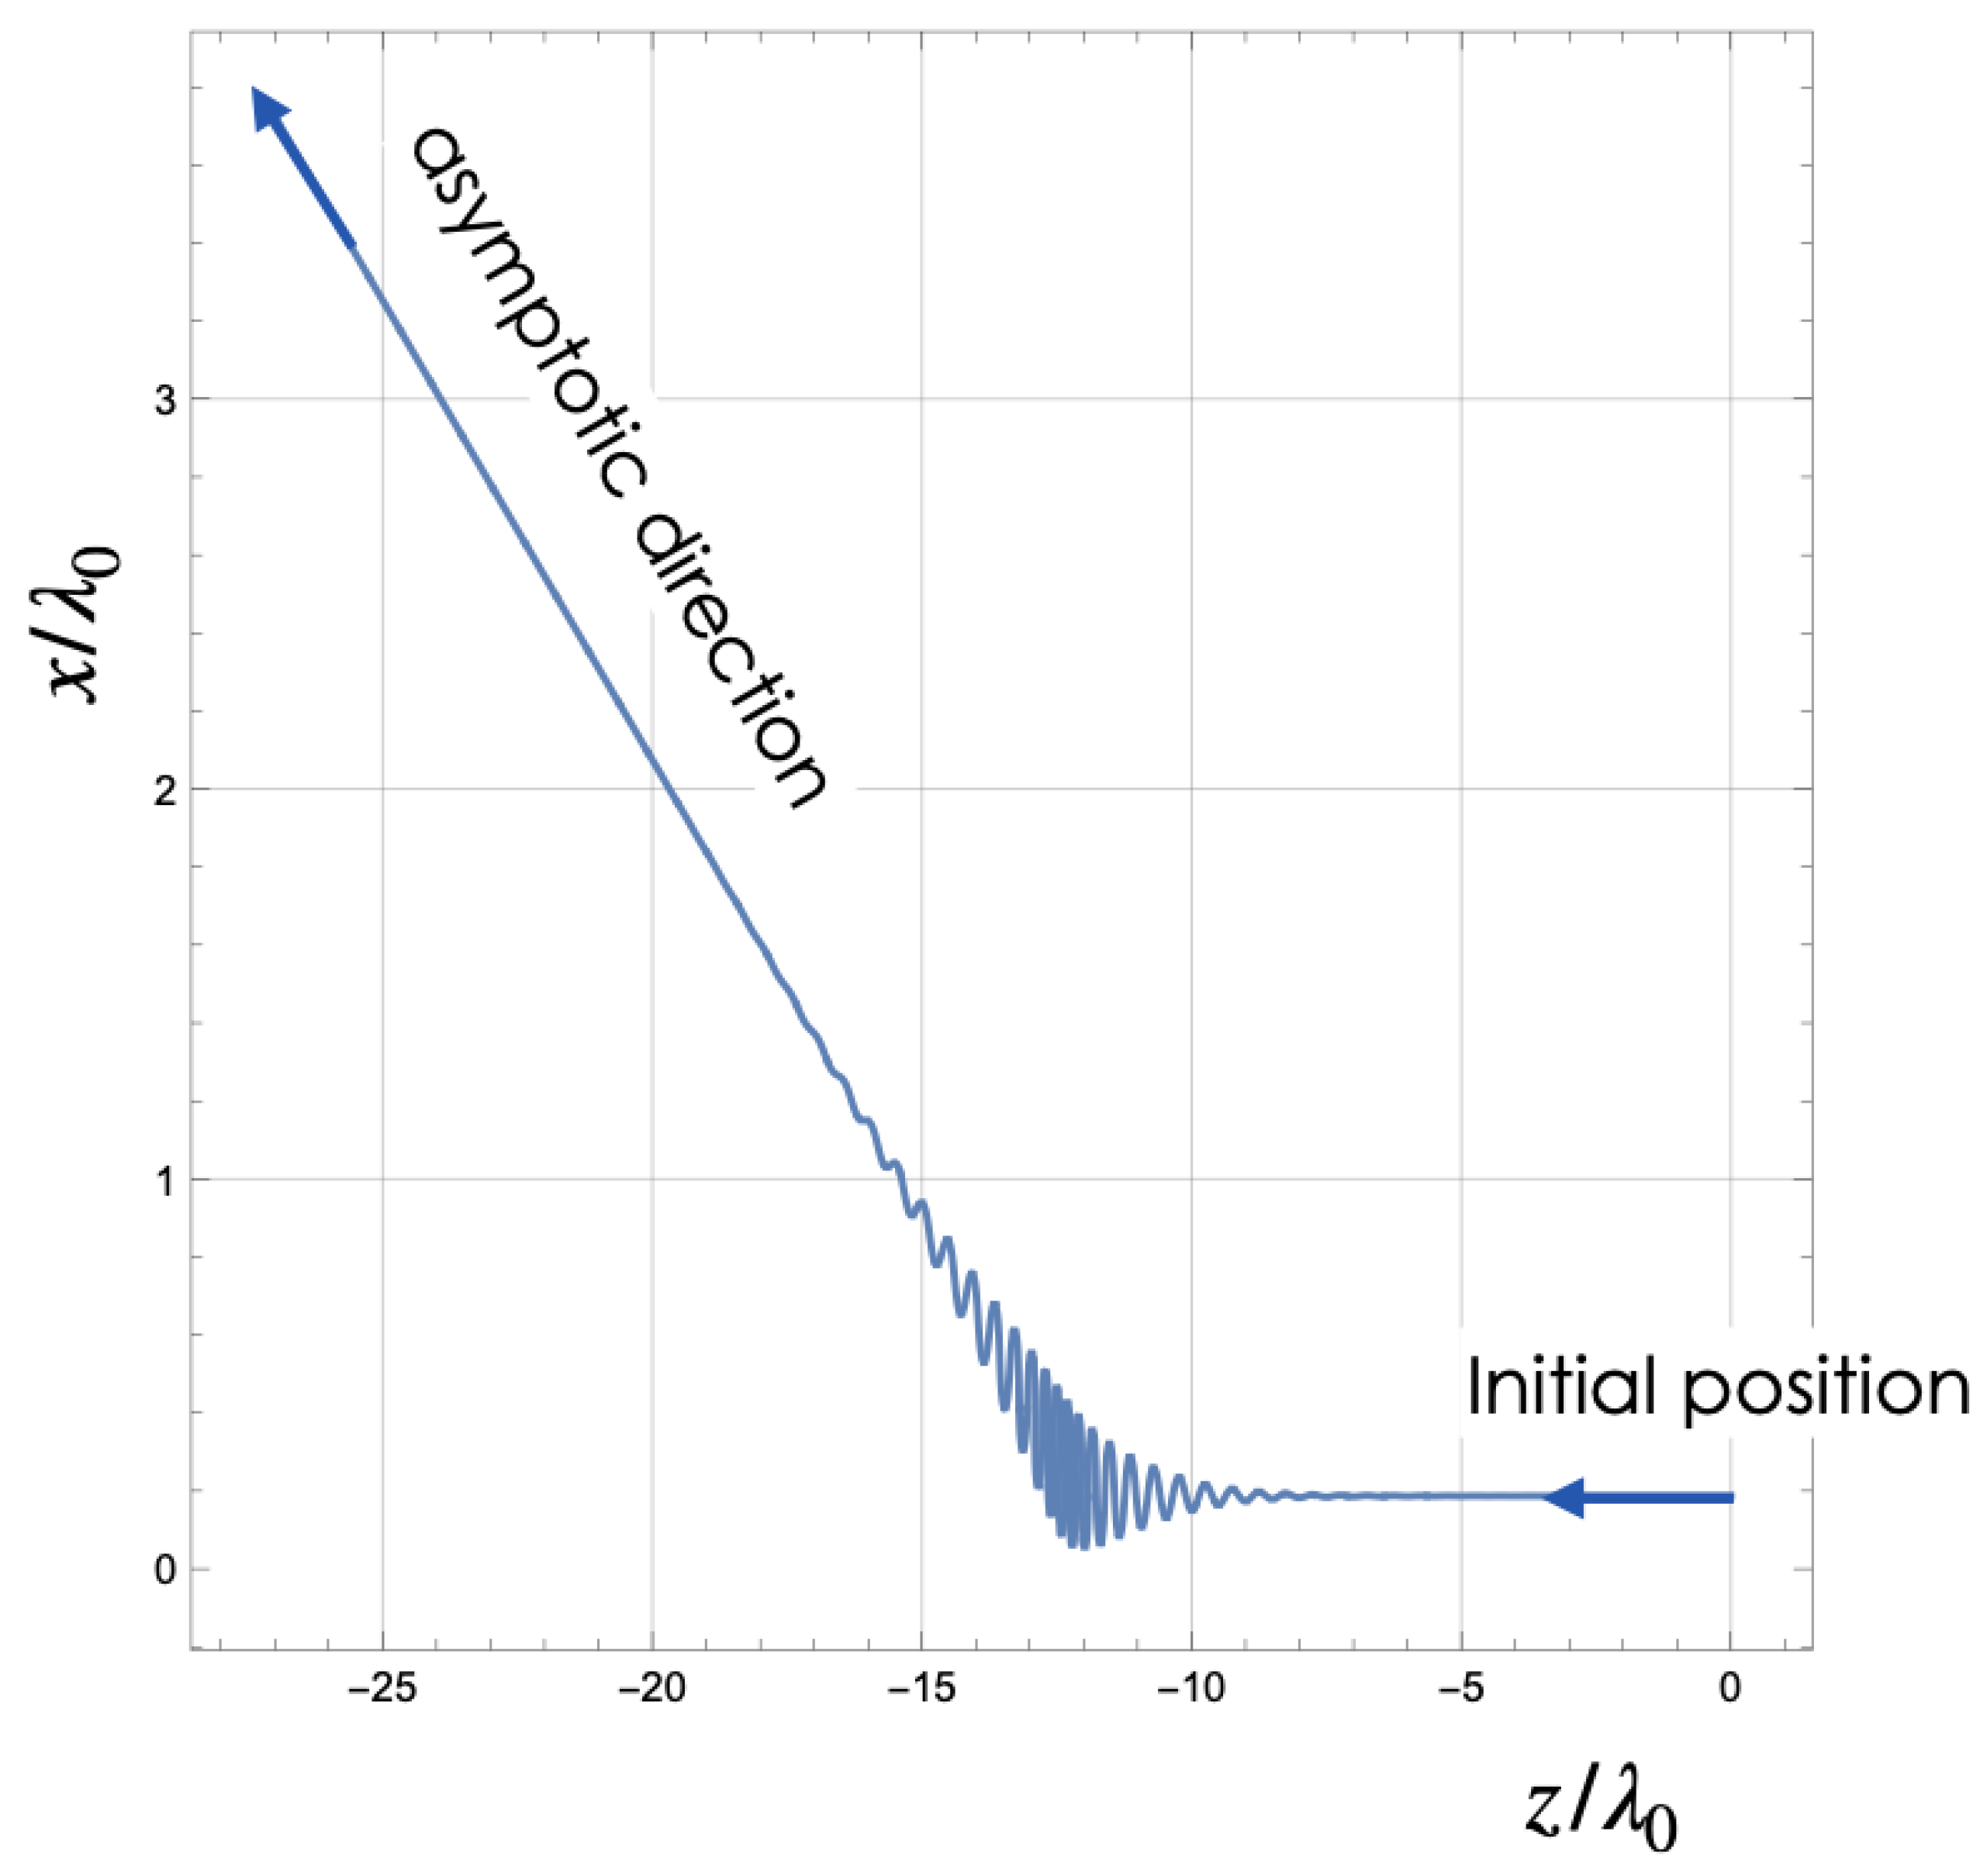
To illustrate the significant aspects of the electron trajectory evolution over time, we begin with a sample case. Figure 7 shows the trajectory of an electron initially positioned nearly at the center of the electron bunch ( x 00 y 00 0 , z 00 = 0 ) projected onto the XZ plane. The plot highlights the scattering effect when the electron interacts with the laser around z = 12 λ 0 . Further, Figure 8 and Figure 9 display the time evolution of the relativistic γ factor, the normalized velocity v / c , and the radiated electric field at the detector in the time domain. This provides a comprehensive picture of the dynamics, including RR effects.
The interaction shown in Figure 7 indicates that the electron is deflected at an angle from its initial direction due to the ponderomotive force. This initial symmetry is disrupted by the laser pulse’s phase, and different carrier–envelope phases (CEPs) of the pulse will result in varying deflection directions. This figure validates that the interaction between the laser pulse and electrons is weak at the initial distance; thus, there is no need to consider initial positions further away.
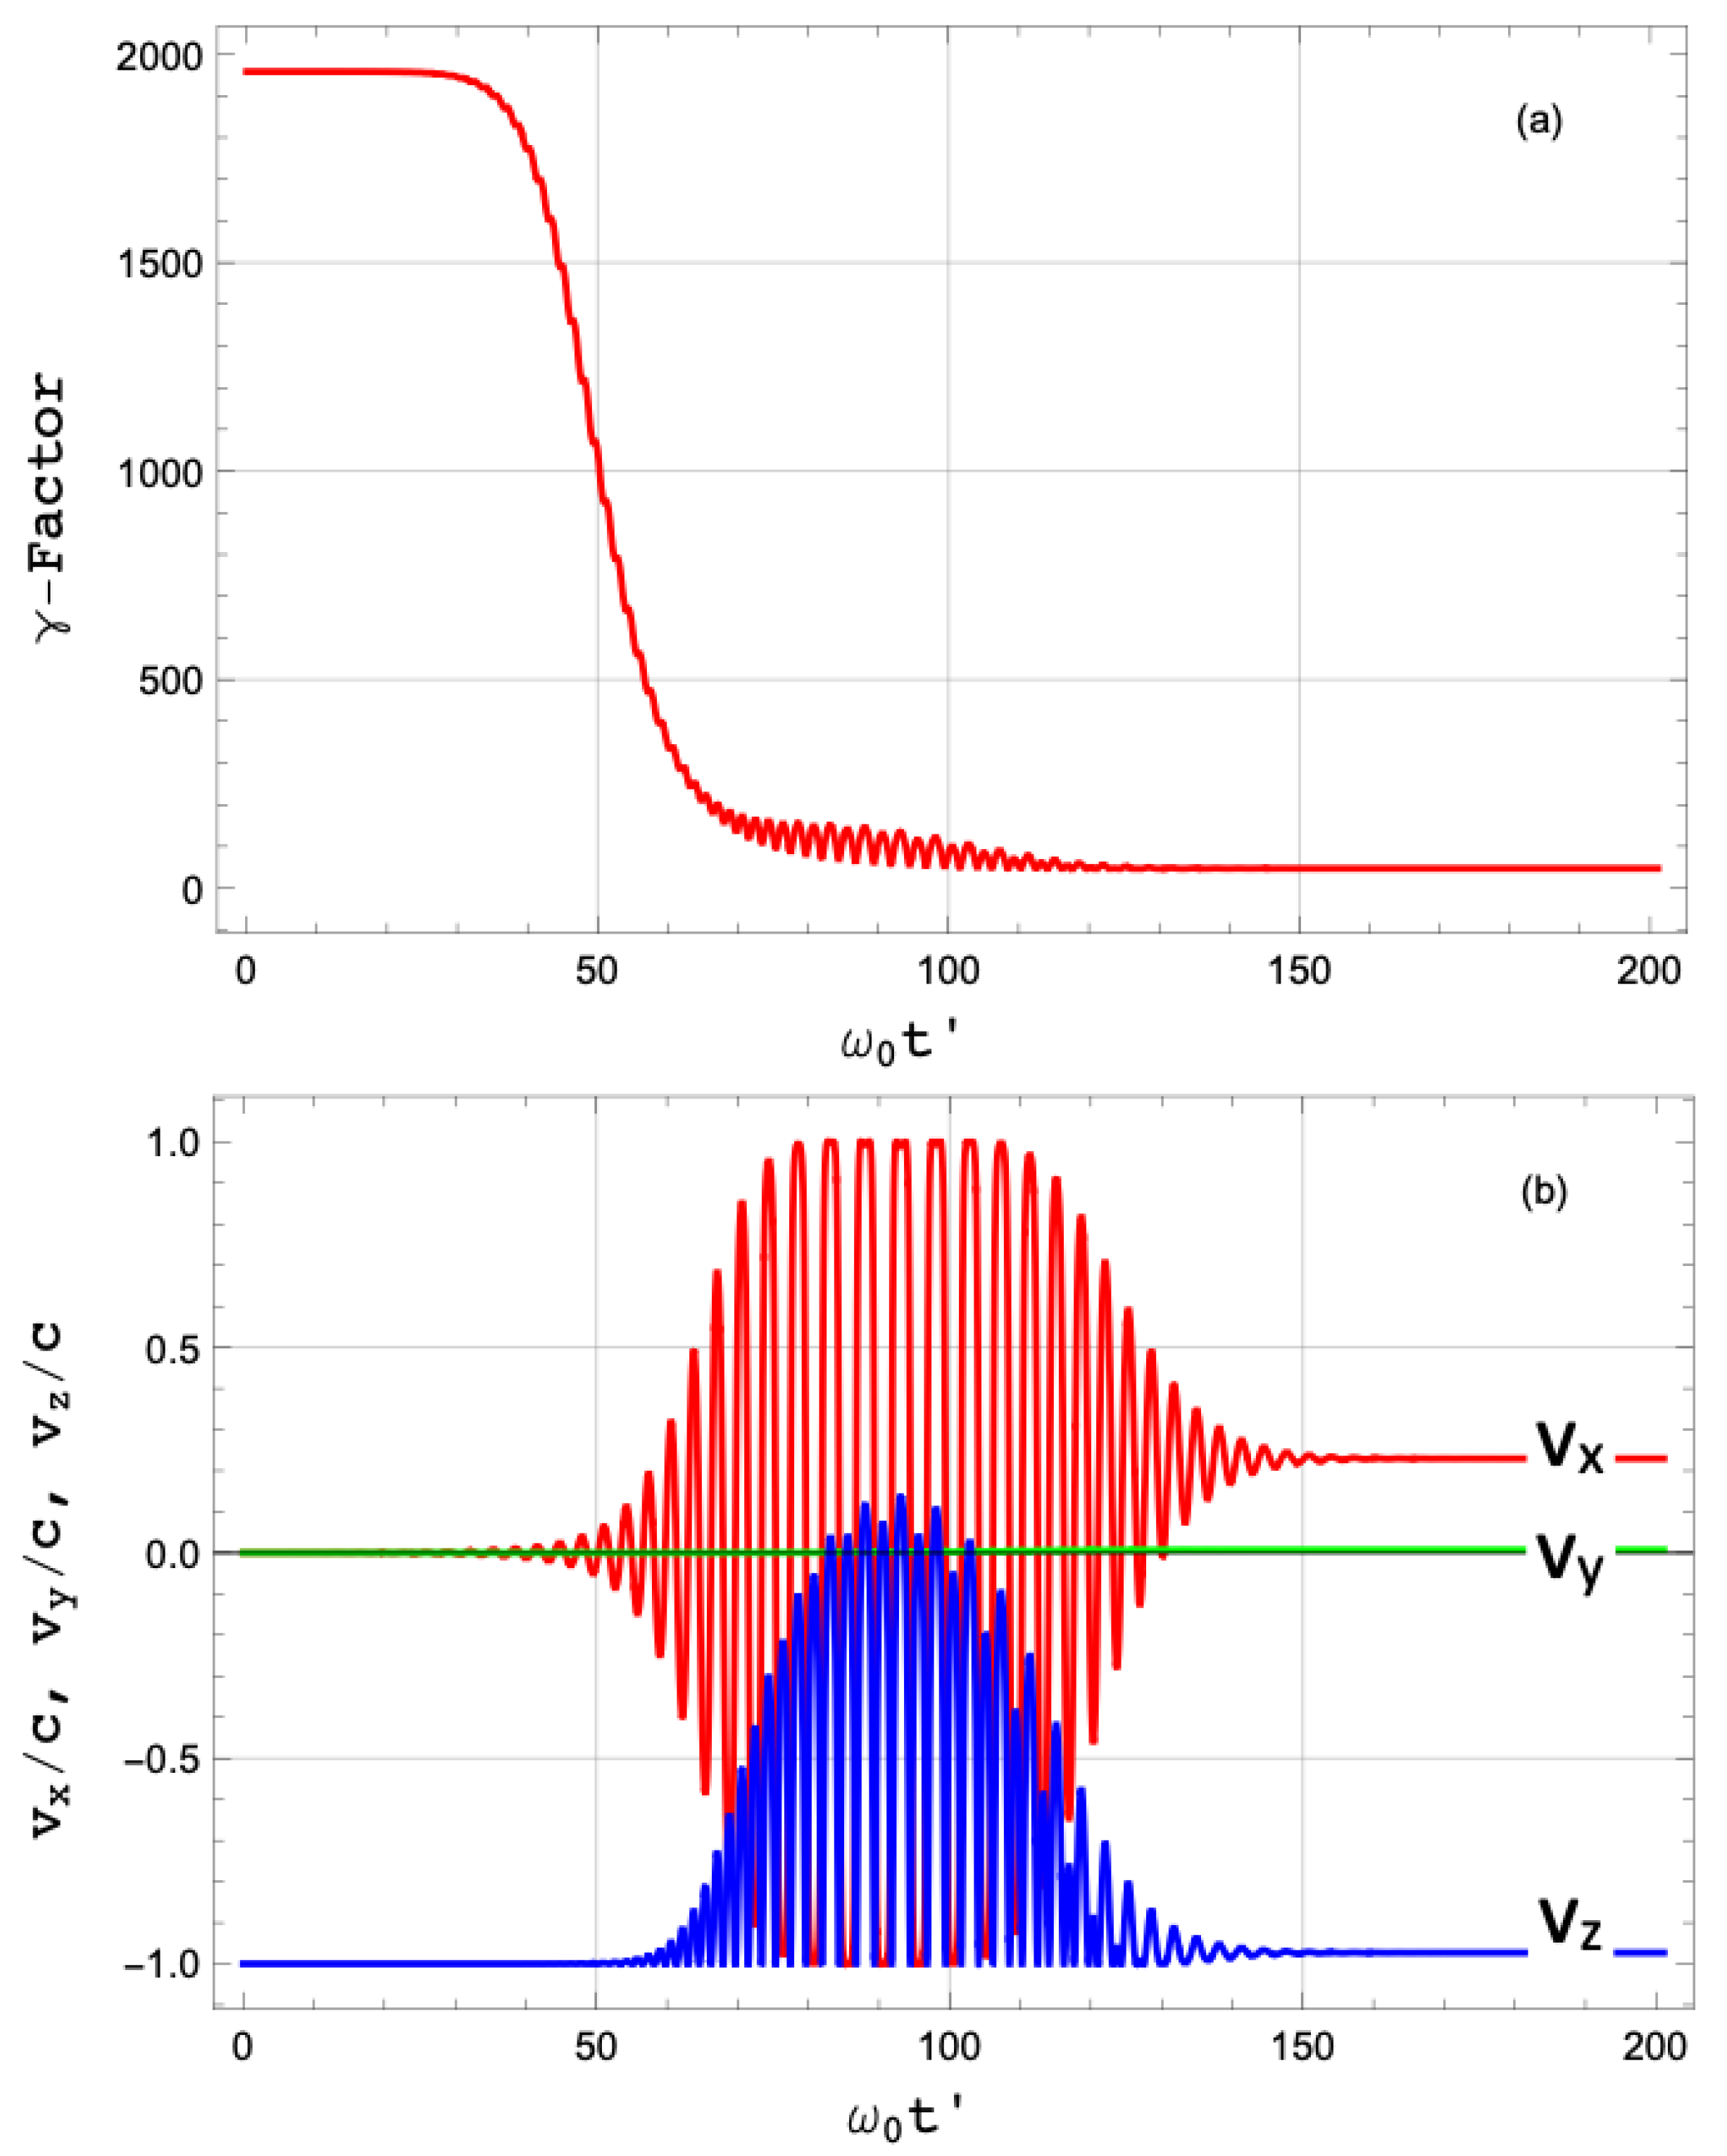
Figure 8 shows the time evolution of the γ factor and different velocity components for the parameters in this section. The plot reveals the asymptotic value of the velocity once the interaction with the laser pulse ends and a sudden reduction in kinetic energy due to RR.
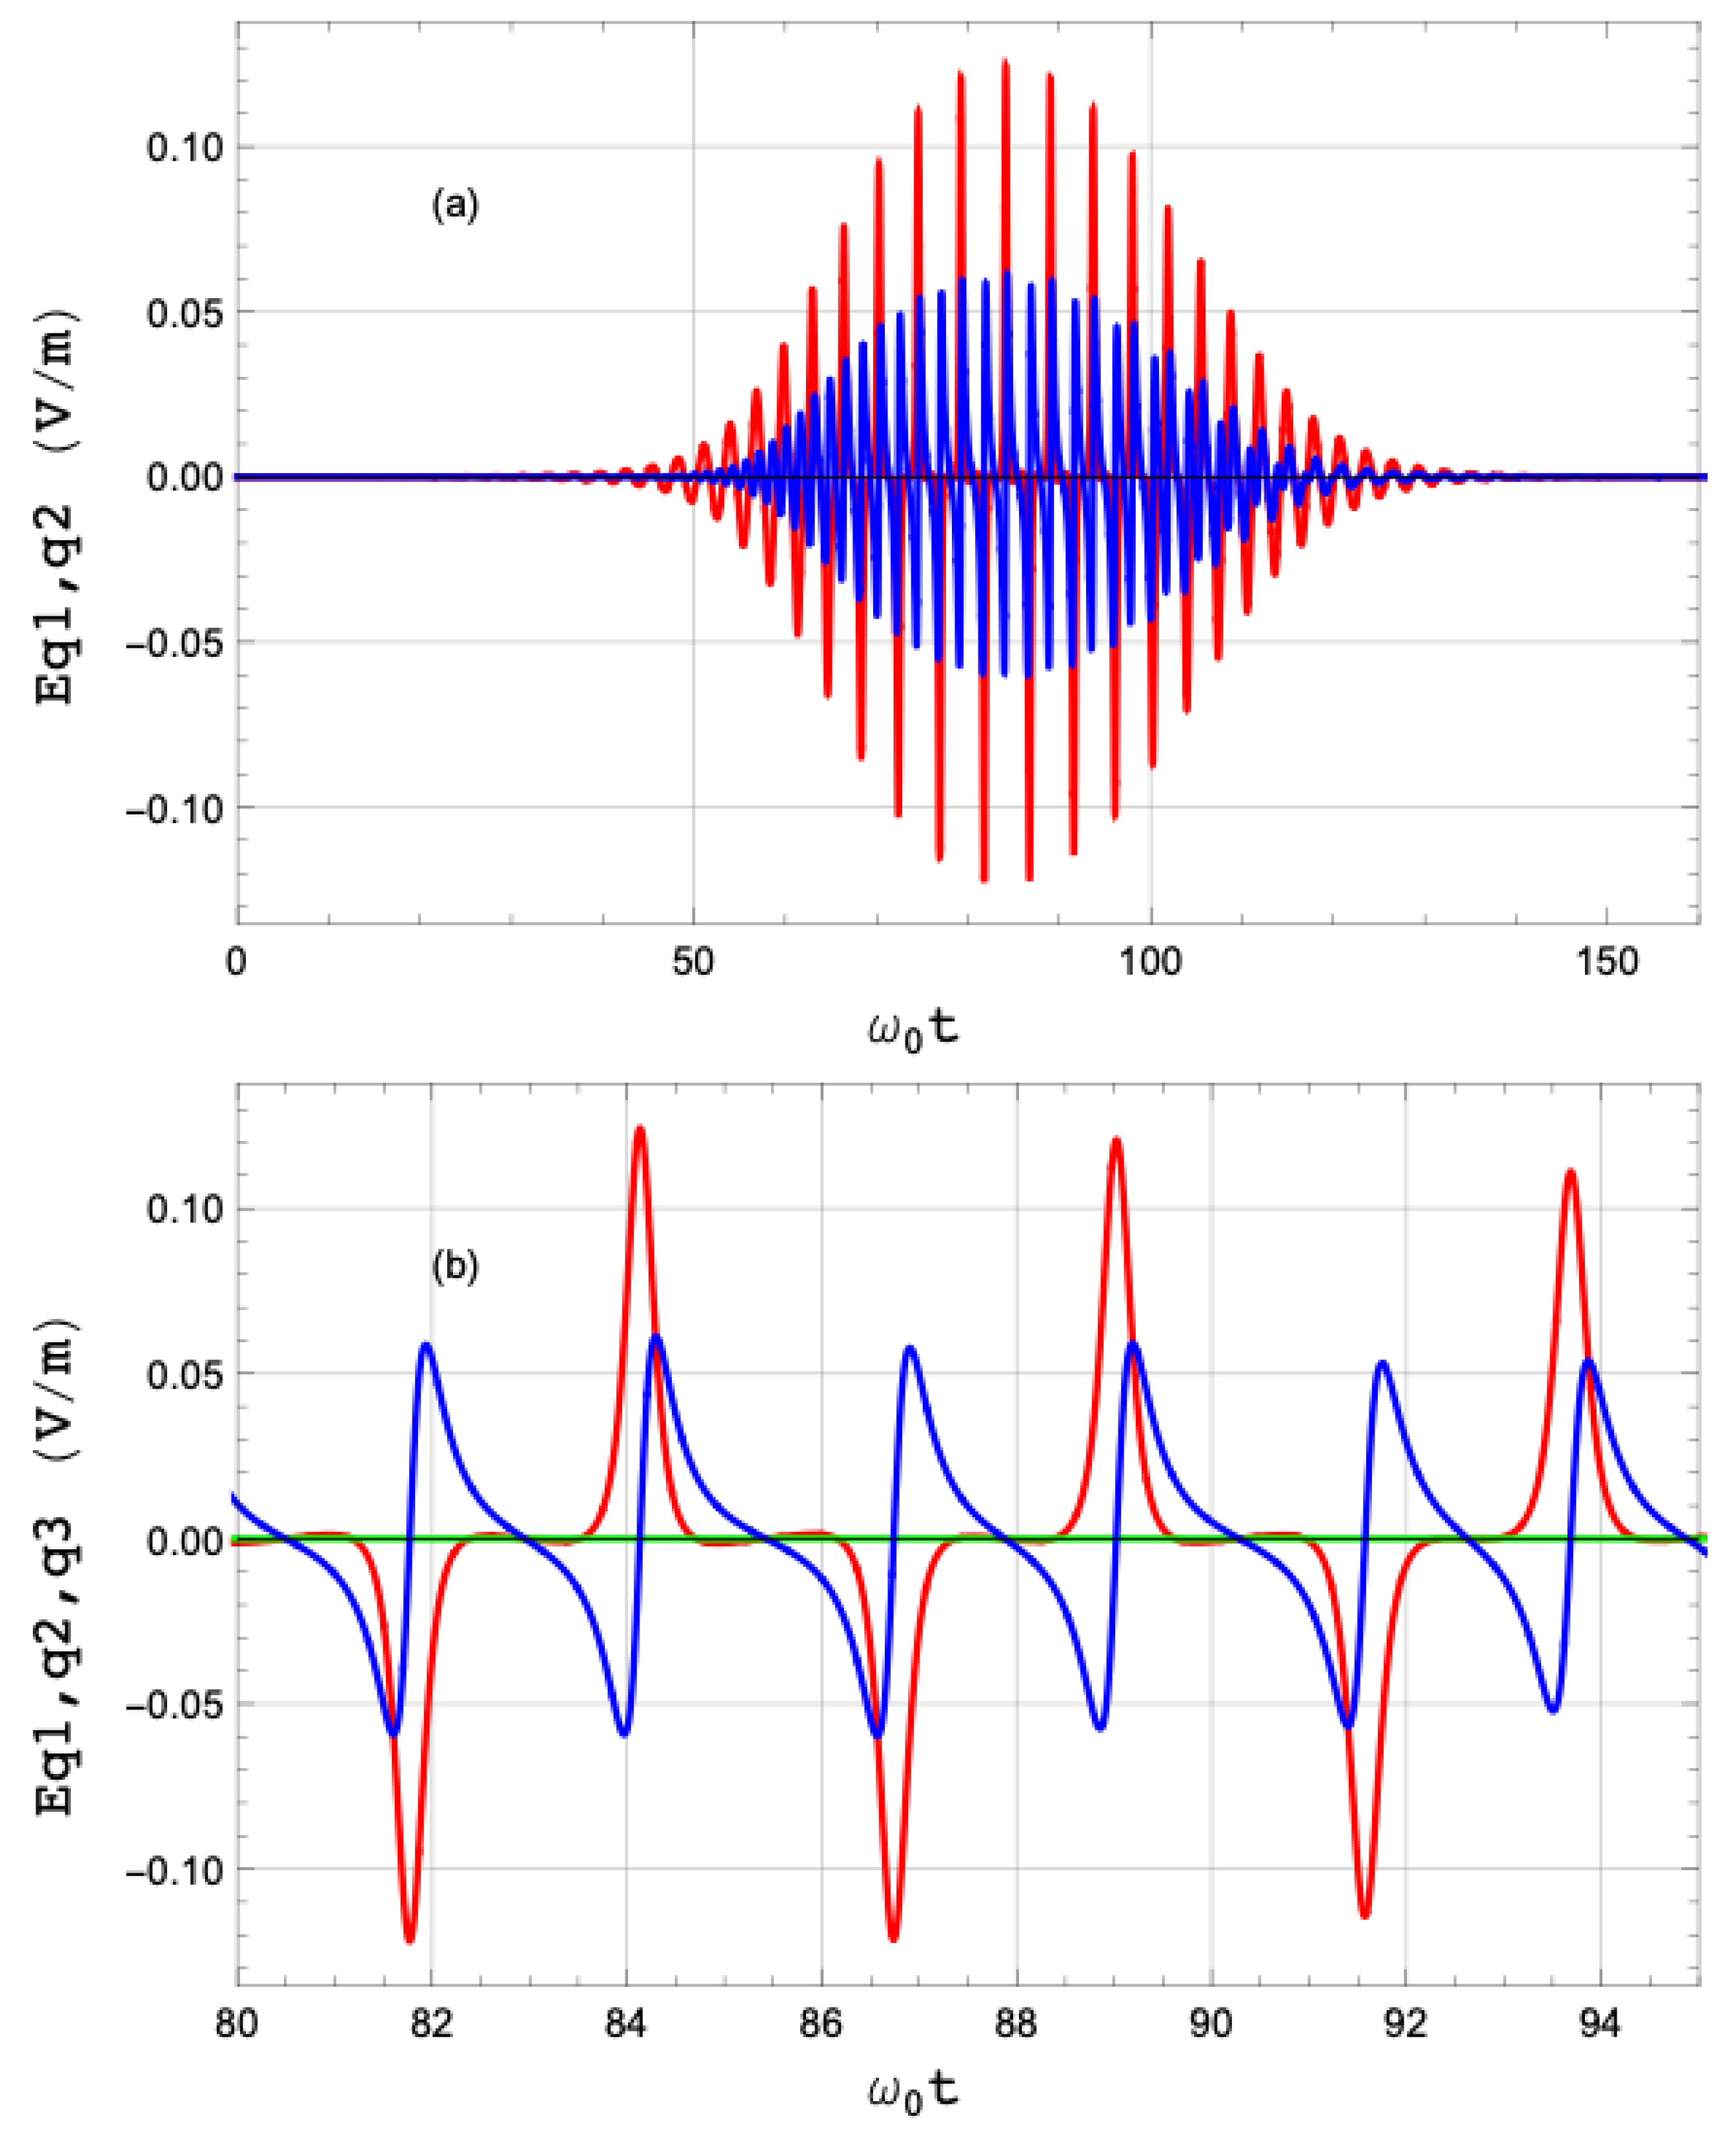
It has been demonstrated that under various circumstances, driven electron dynamics can generate trains of attosecond pulses [33,34,35]. Figure 9 shows the radiated electric field; (a) provides an overview of the driving period, and (b) zooms into the region with the most intense driving. The radiated electric field components along the X-axis (red) and the YZ plane (blue) are displayed. The component along the scattering vector (green) is negligible.
The component parallel to the laser pulse polarization exhibits a peaked structure (red lines in Figure 9), a direct result of the driven electron dynamics. In cases where a bunch of electrons is considered, they act as a moving mirror, generating attosecond or sub-femtosecond pulses due to nonlinear dynamics.
To fully describe the TS radiation, Figure 9b and similar figures in the subsequent sections evaluate the three components of the emitted electric field: the component along the electric field (blue curve), its quadrature (red curve), and the component along the scattering direction (green curve).
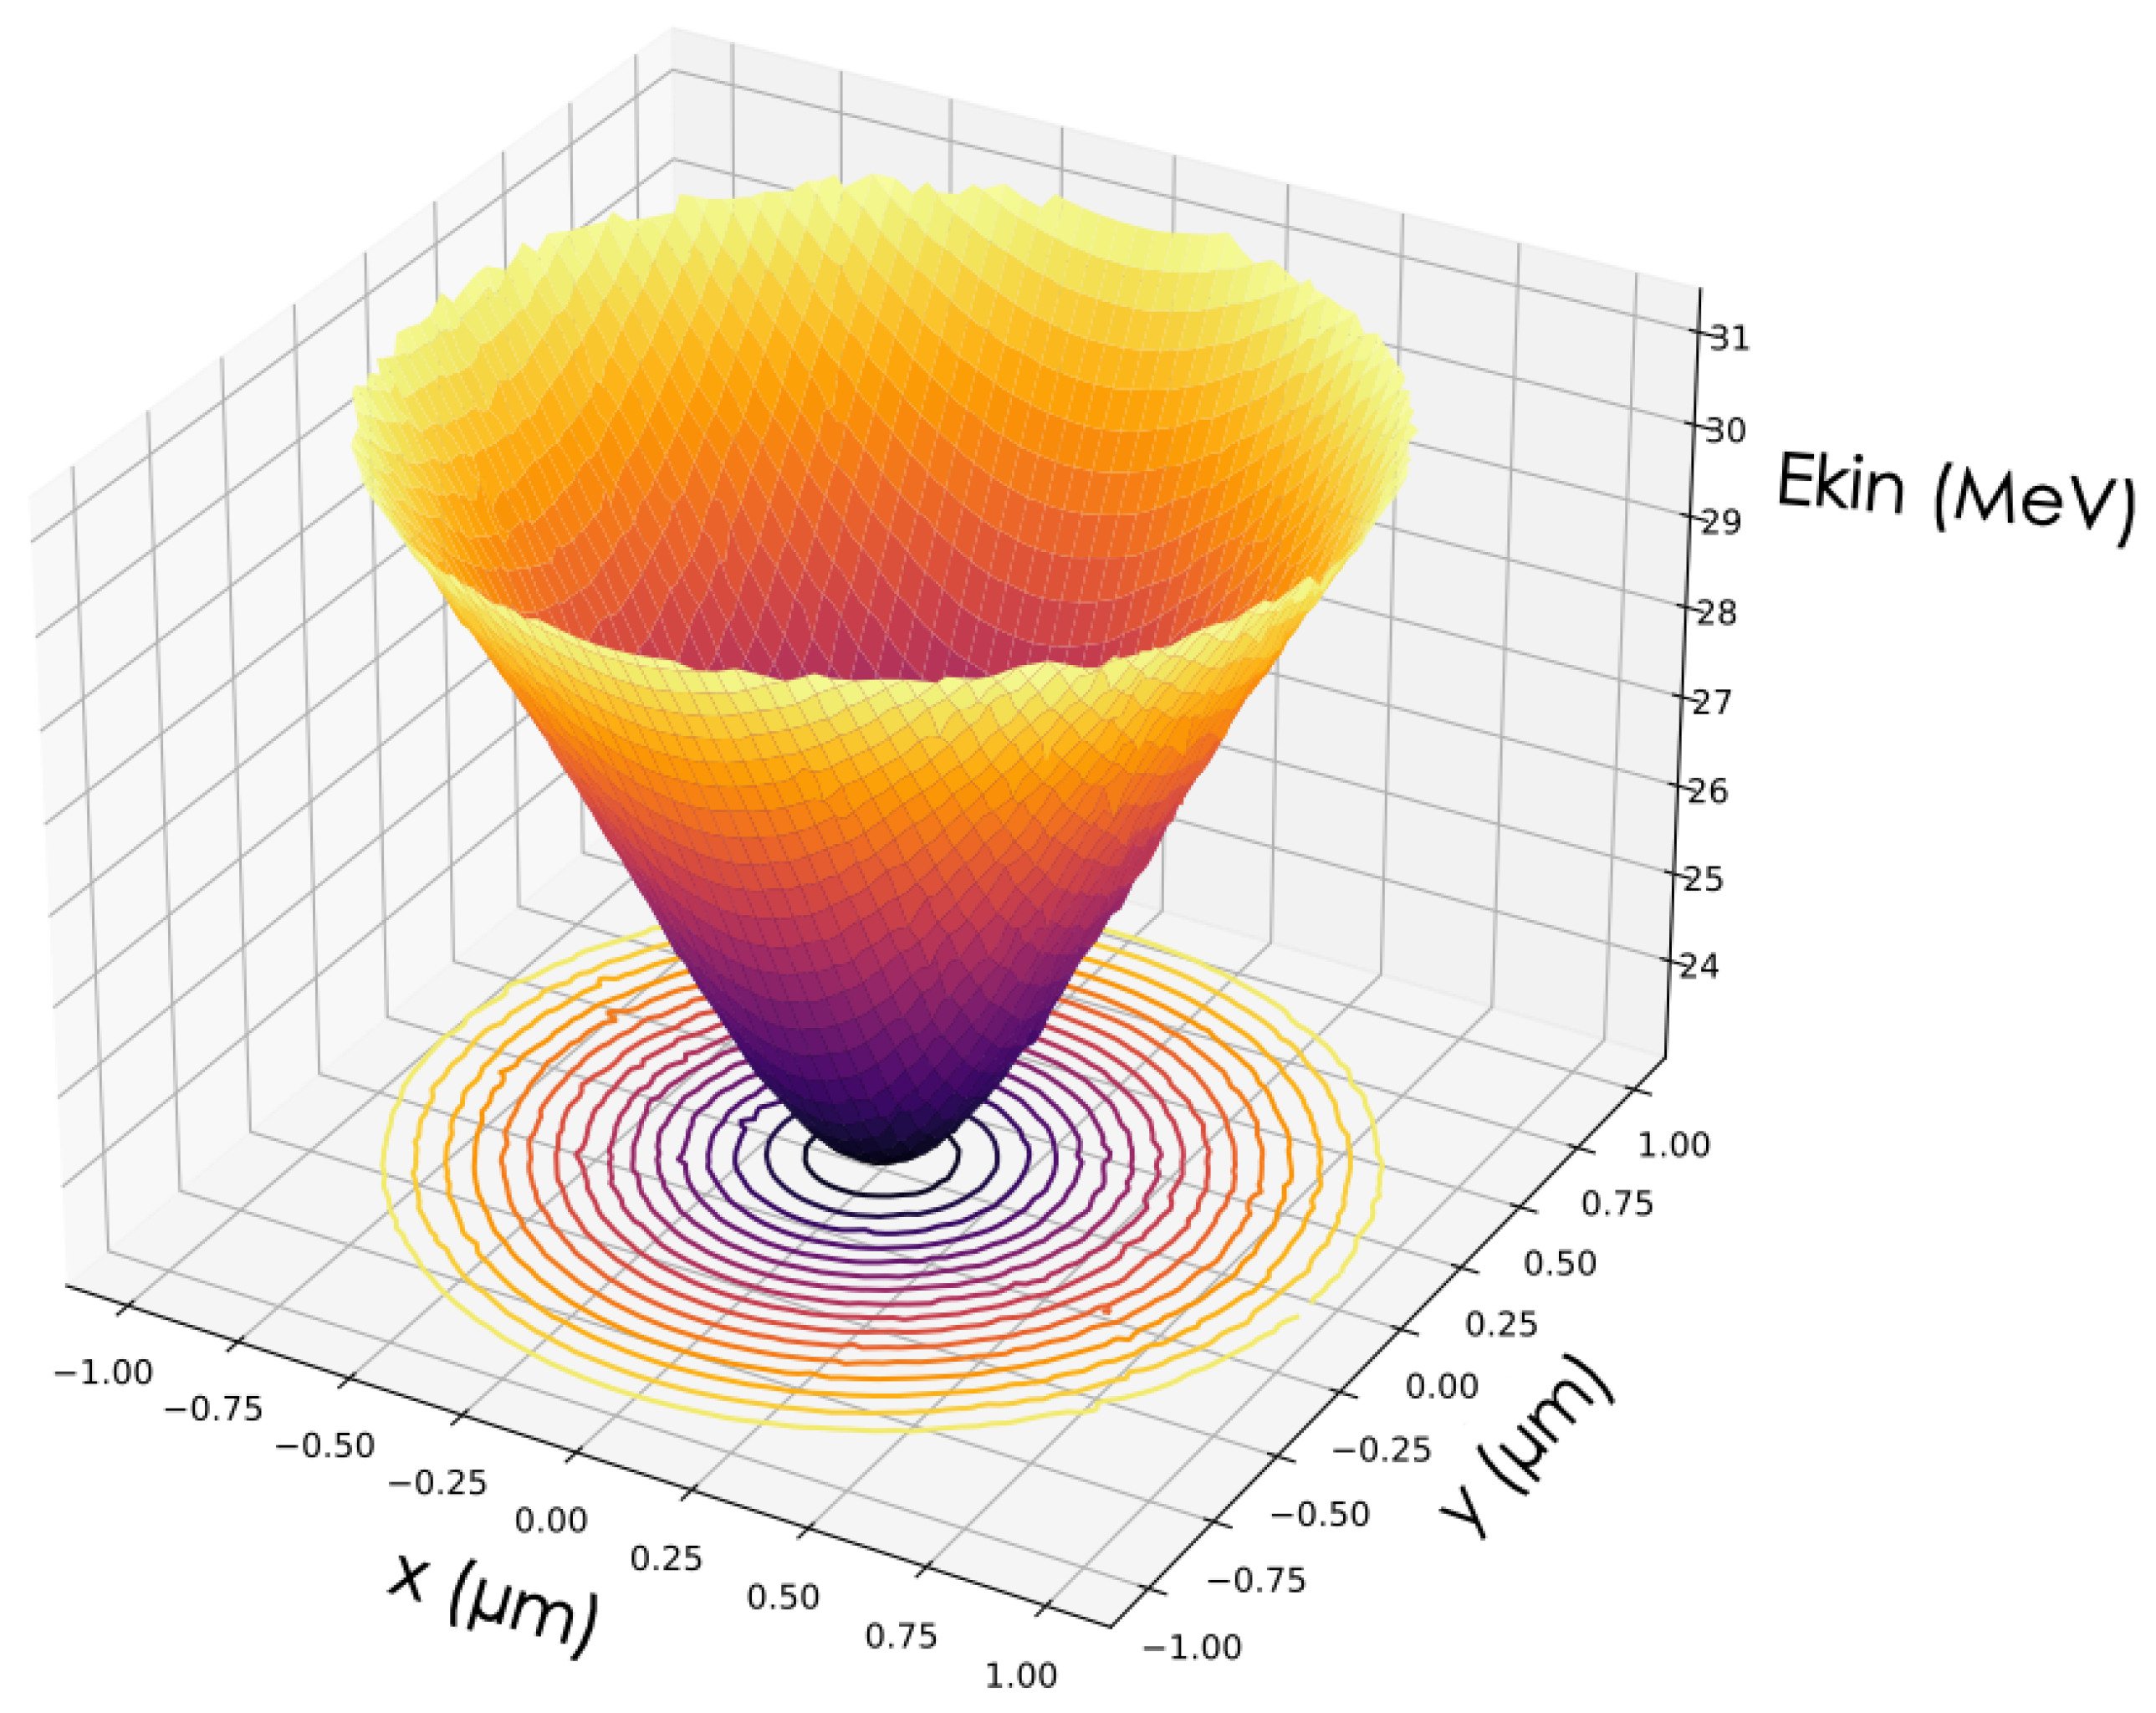
Given that RR causes a violent deceleration of the electron, it is crucial to analyze the electron’s final velocity (or momentum). The asymptotic velocity is reached shortly after the pulse interaction ends, as inferred from Figure 7. Figure 10 and Figure 11 summarize the asymptotic distributions of momentum components and kinetic energy. They show the final momentum/energy of the electrons. Figure 10c is particularly relevant because it shows the distribution of momentum in the propagation direction and evidences a circular symmetry despite the laser being linearly polarized along X. This underscores the fundamental role of longitudinal fields and the ponderomotive force. A similar conclusion can be drawn from Figure 11, which shows a clear cylindrical symmetry in the final kinetic energy, without revealing the laser polarization. Note from the vertical scale of Figure 11 that the asymptotic energy is much less than the initial energy of the electrons.
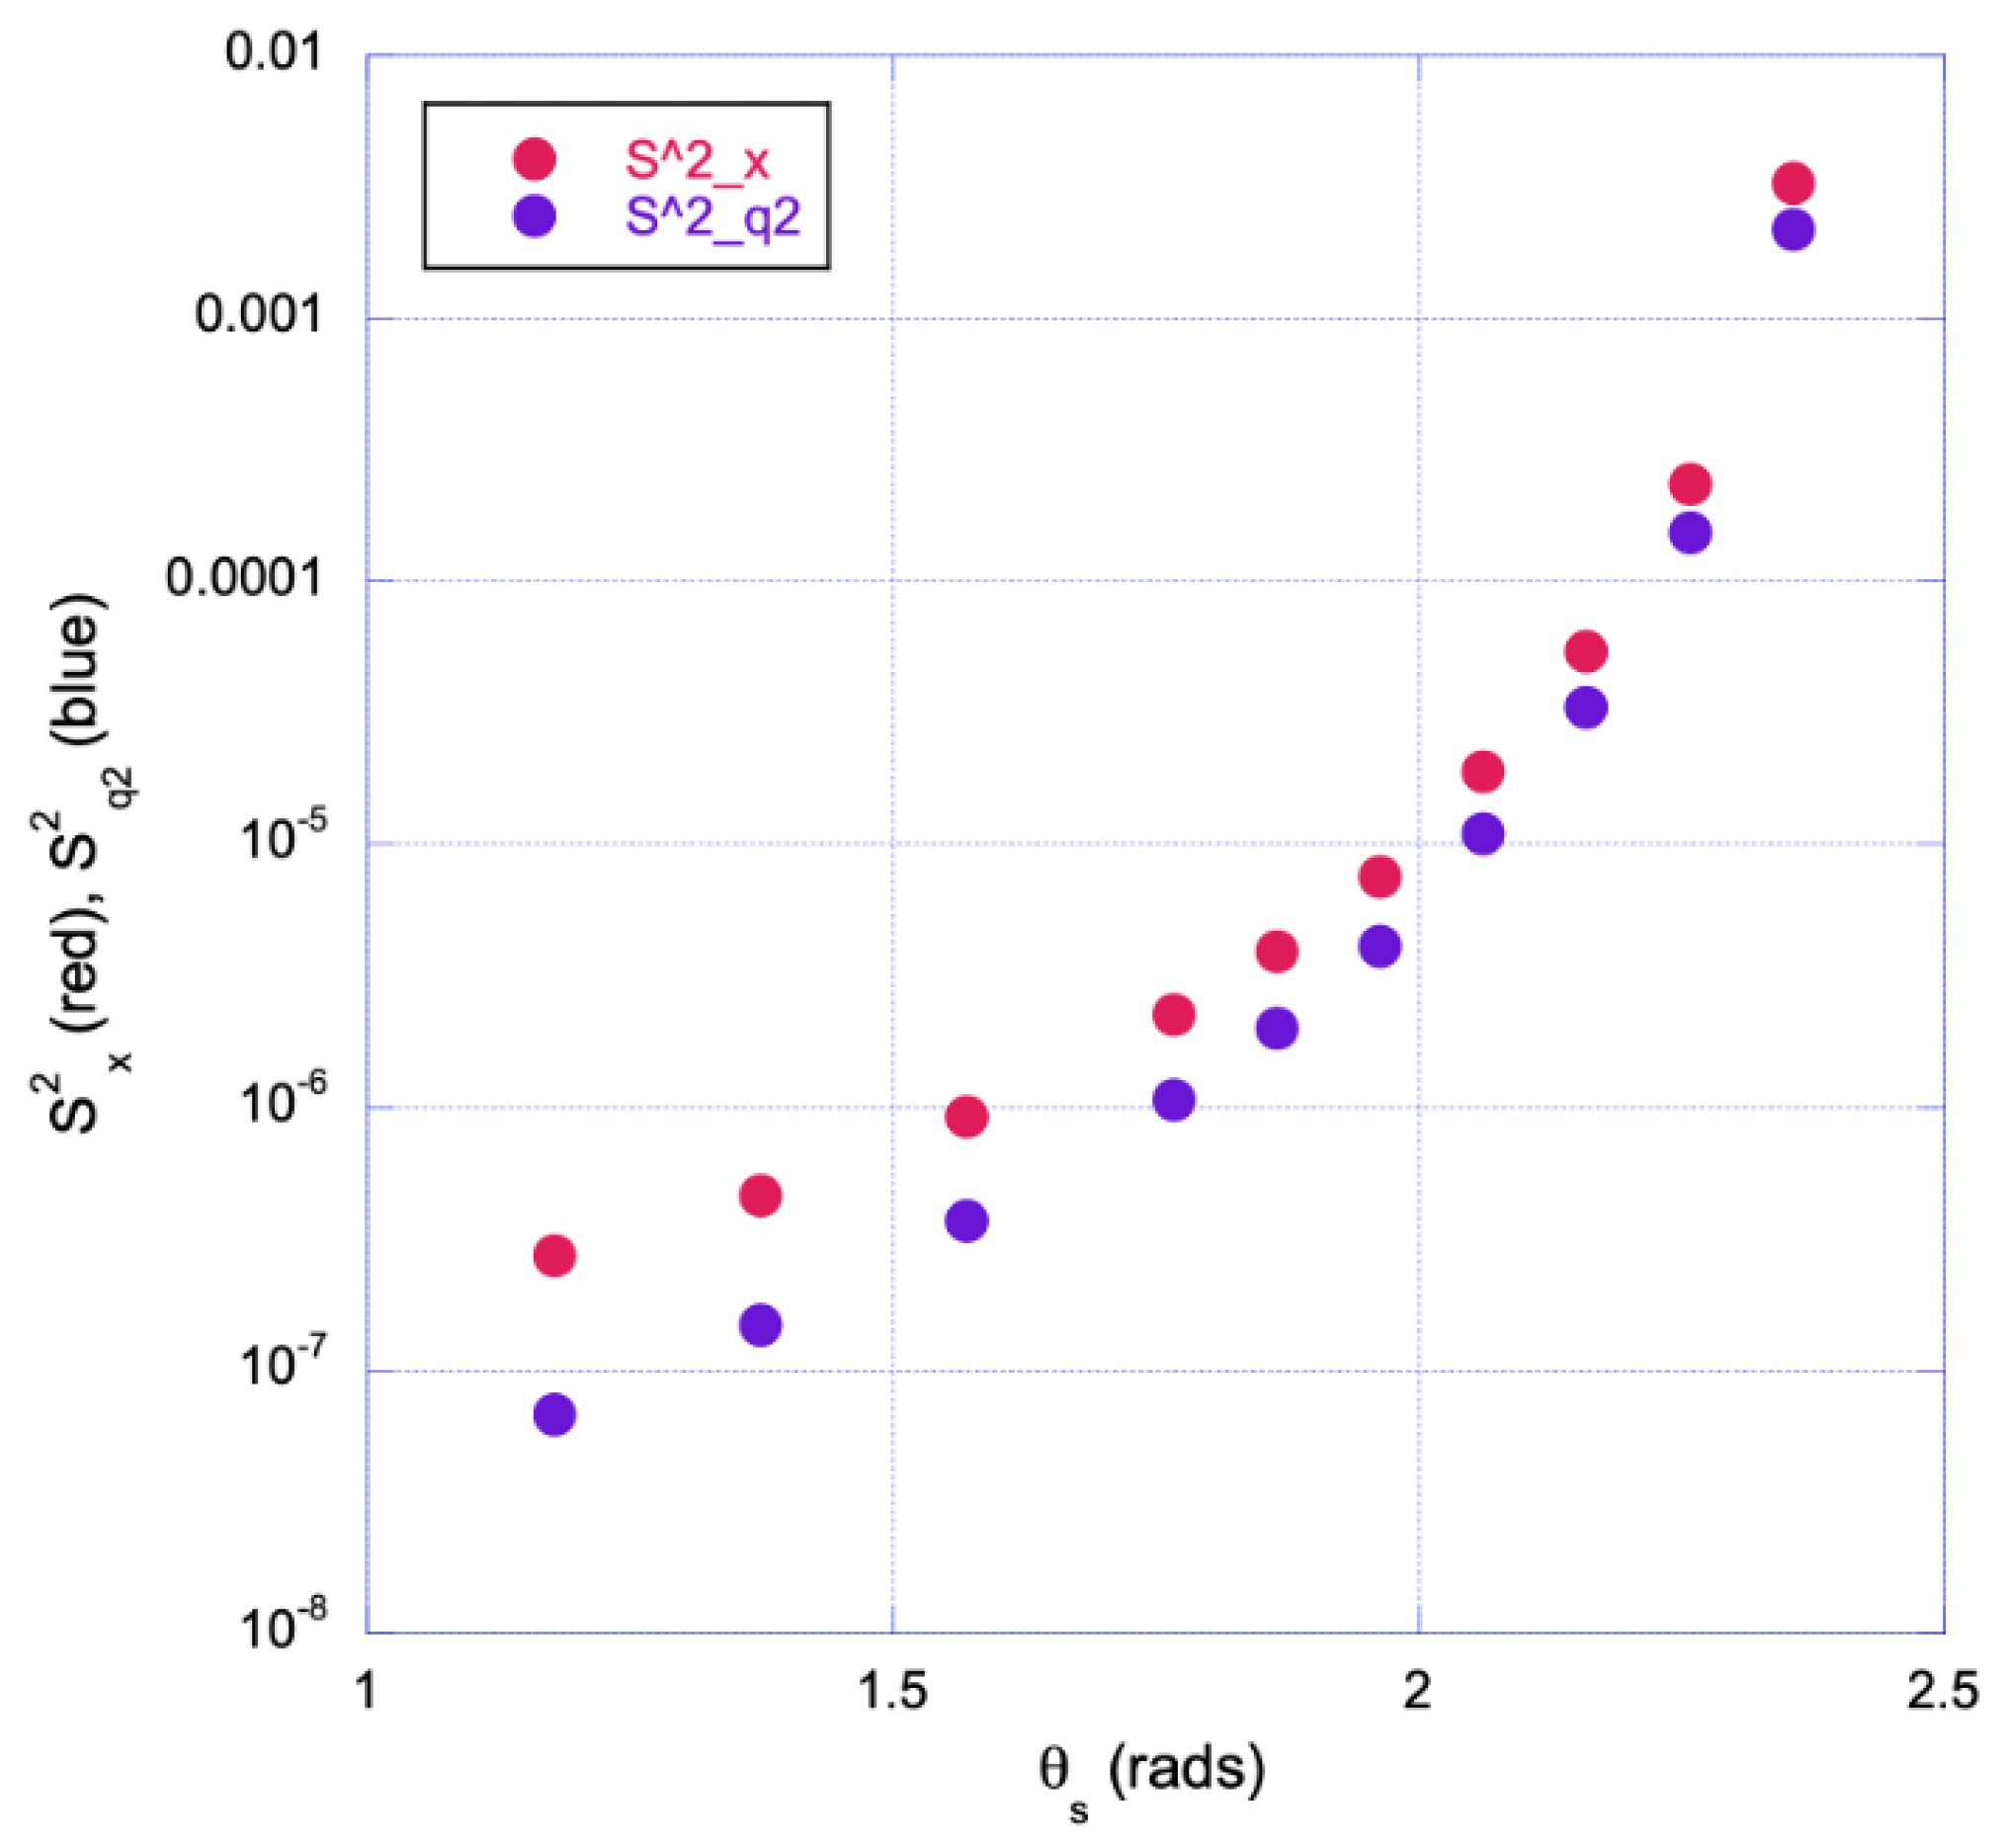
Figure 12 and Figure 13 present the integrated power and averaged spectra for this section’s case. The scattered power increases as the initial electron direction is approached. Notably, at scattering angles between 2 and 2.5 radians, the radiated power is significant, offering a more accessible angle for placing spectrometry instrumentation compared to the electron and laser propagation directions.
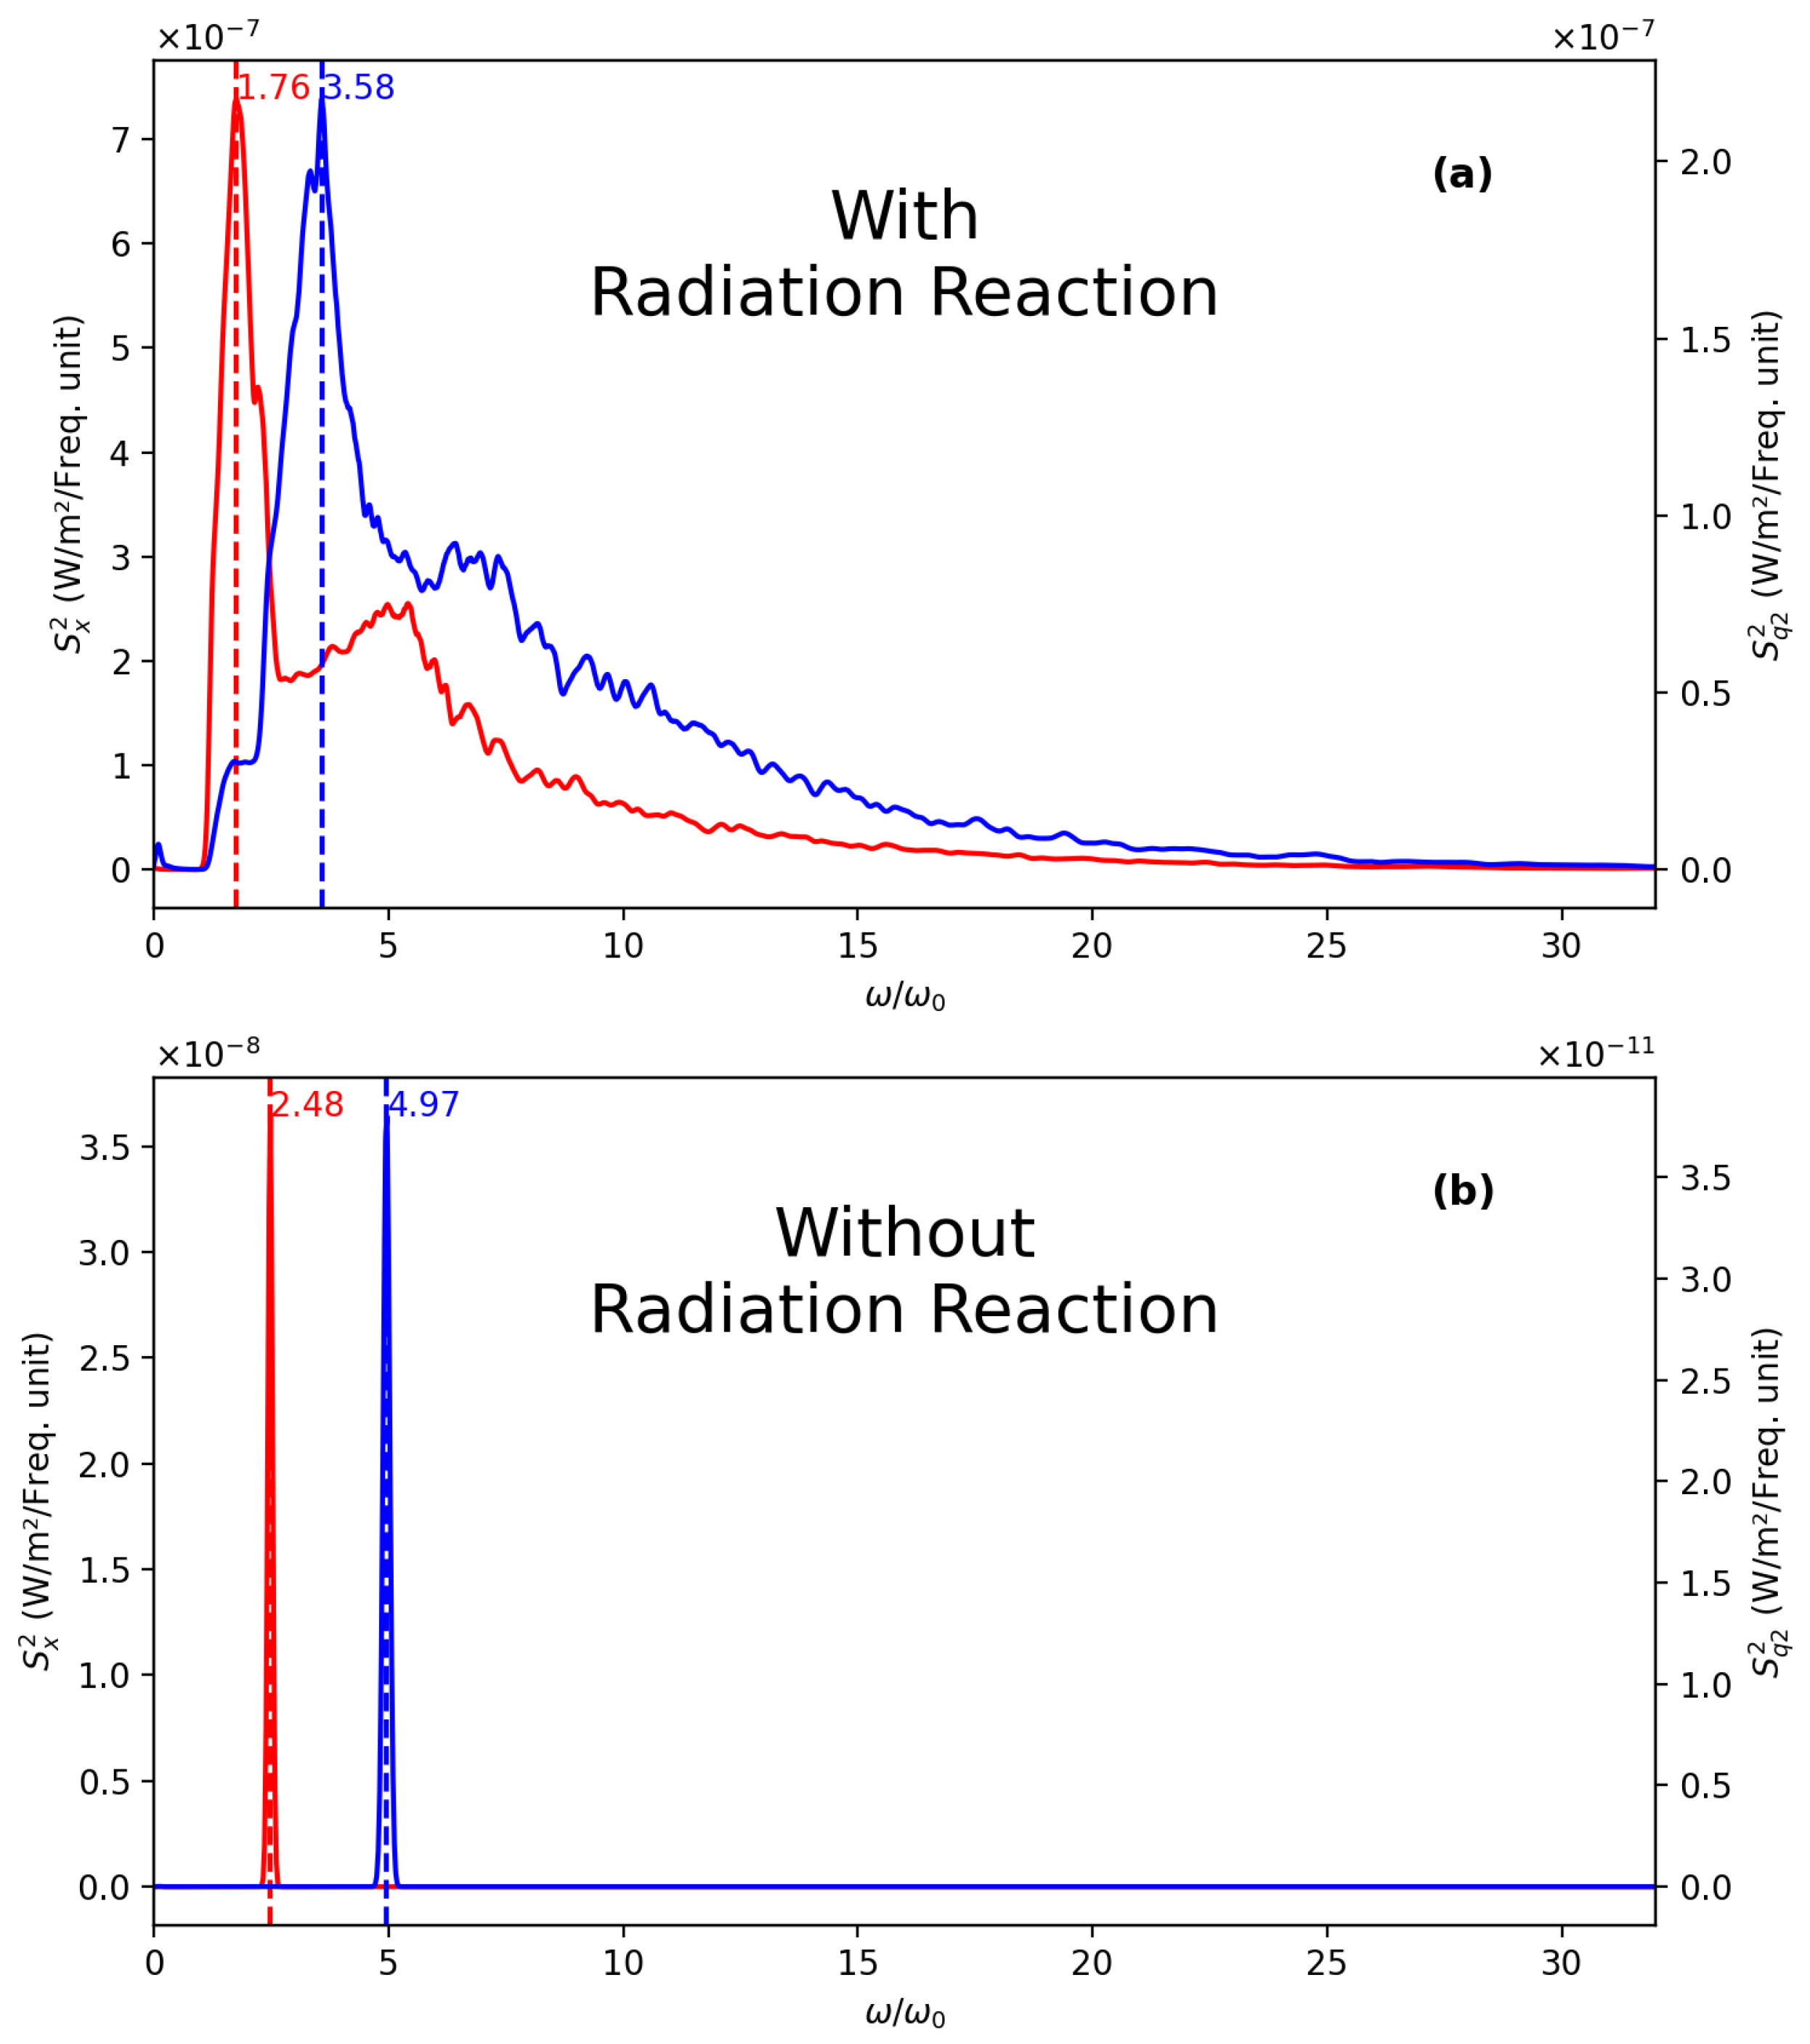
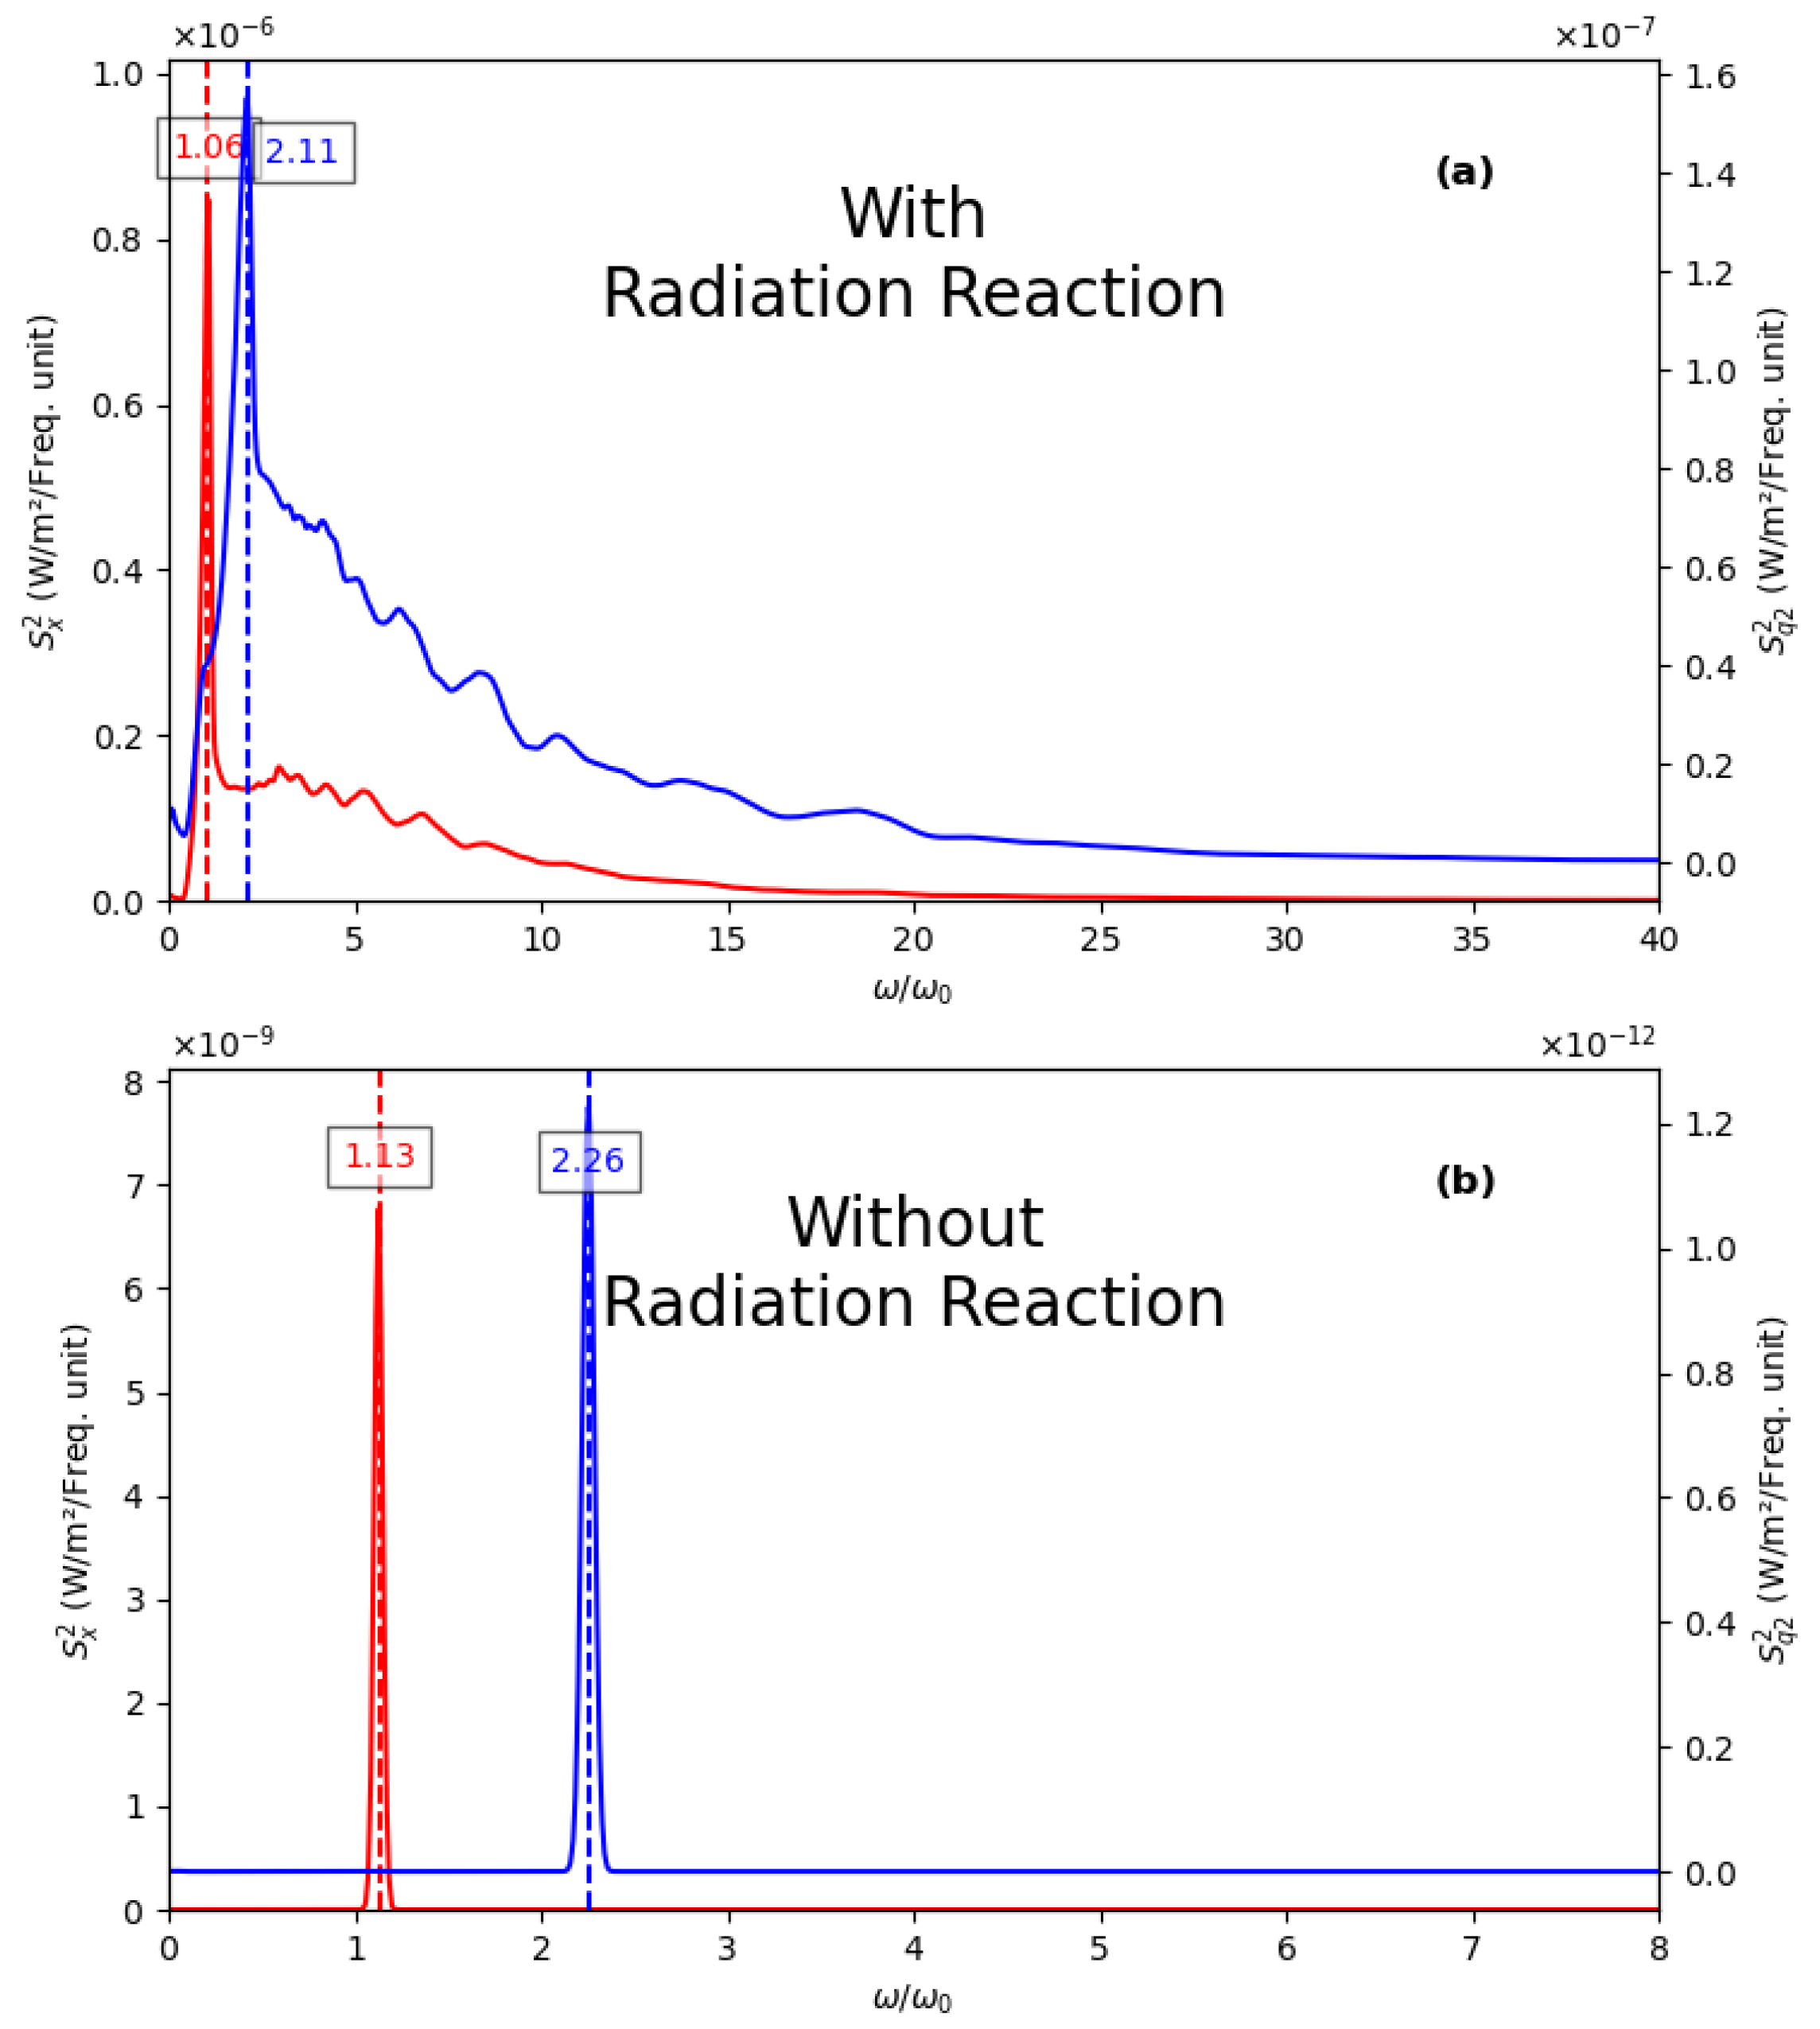
Figure 14 compares the TS emitted spectra with (a) and without (b) RR at a specific scattering angle ( 72 π / 128 ). The inclusion of RR significantly alters the spectra profiles, amplitudes, and power ratios of the two quadratures, suggesting potential experimental methods to detect RR signatures.
RR affects the TS spectra not only by altering the profiles of both quadratures but also by shifting the peak positions. This shift results from the reduced electron speed and thus a reduced Doppler shift of the TS radiation. The frequency positions of these peaks are indicated in Figure 14 relative to ω 0 . Notably, the blue peak remains at twice the frequency of the red one due to the interaction with the laser magnetic field.
The TS spectrum without RR (Figure 14b) illustrates its dramatic influence. Despite our purpose not solely being to show the importance of RR, which is well documented, we aim to propose a method for measuring RR based on the TS spectra. The spectra at a nearly perpendicular angle to the laser propagation direction show clear peaks shifted from ω 0 , thus avoiding infrared background issues and making it feasible to detect in the visible or ultraviolet range where photon detection is more efficient. This measurement can validate the appropriate RR model for the given scenario.

6. Case of an Extreme Laser Pulse with a Wide Focus

In this section, we consider a more extreme case than the previous one by analyzing RR according to our model for a peak intensity of 7.5 × 10 22 W / cm 2 . While this intensity has been experimentally achieved, the laser waist is w 0 = 8   μ m , placing the pulse energy at the cutting edge of current laser technology. The configuration and other parameters (pulse length, electron bunch size, initial position, and initial energy) remain consistent with those described in previous sections.
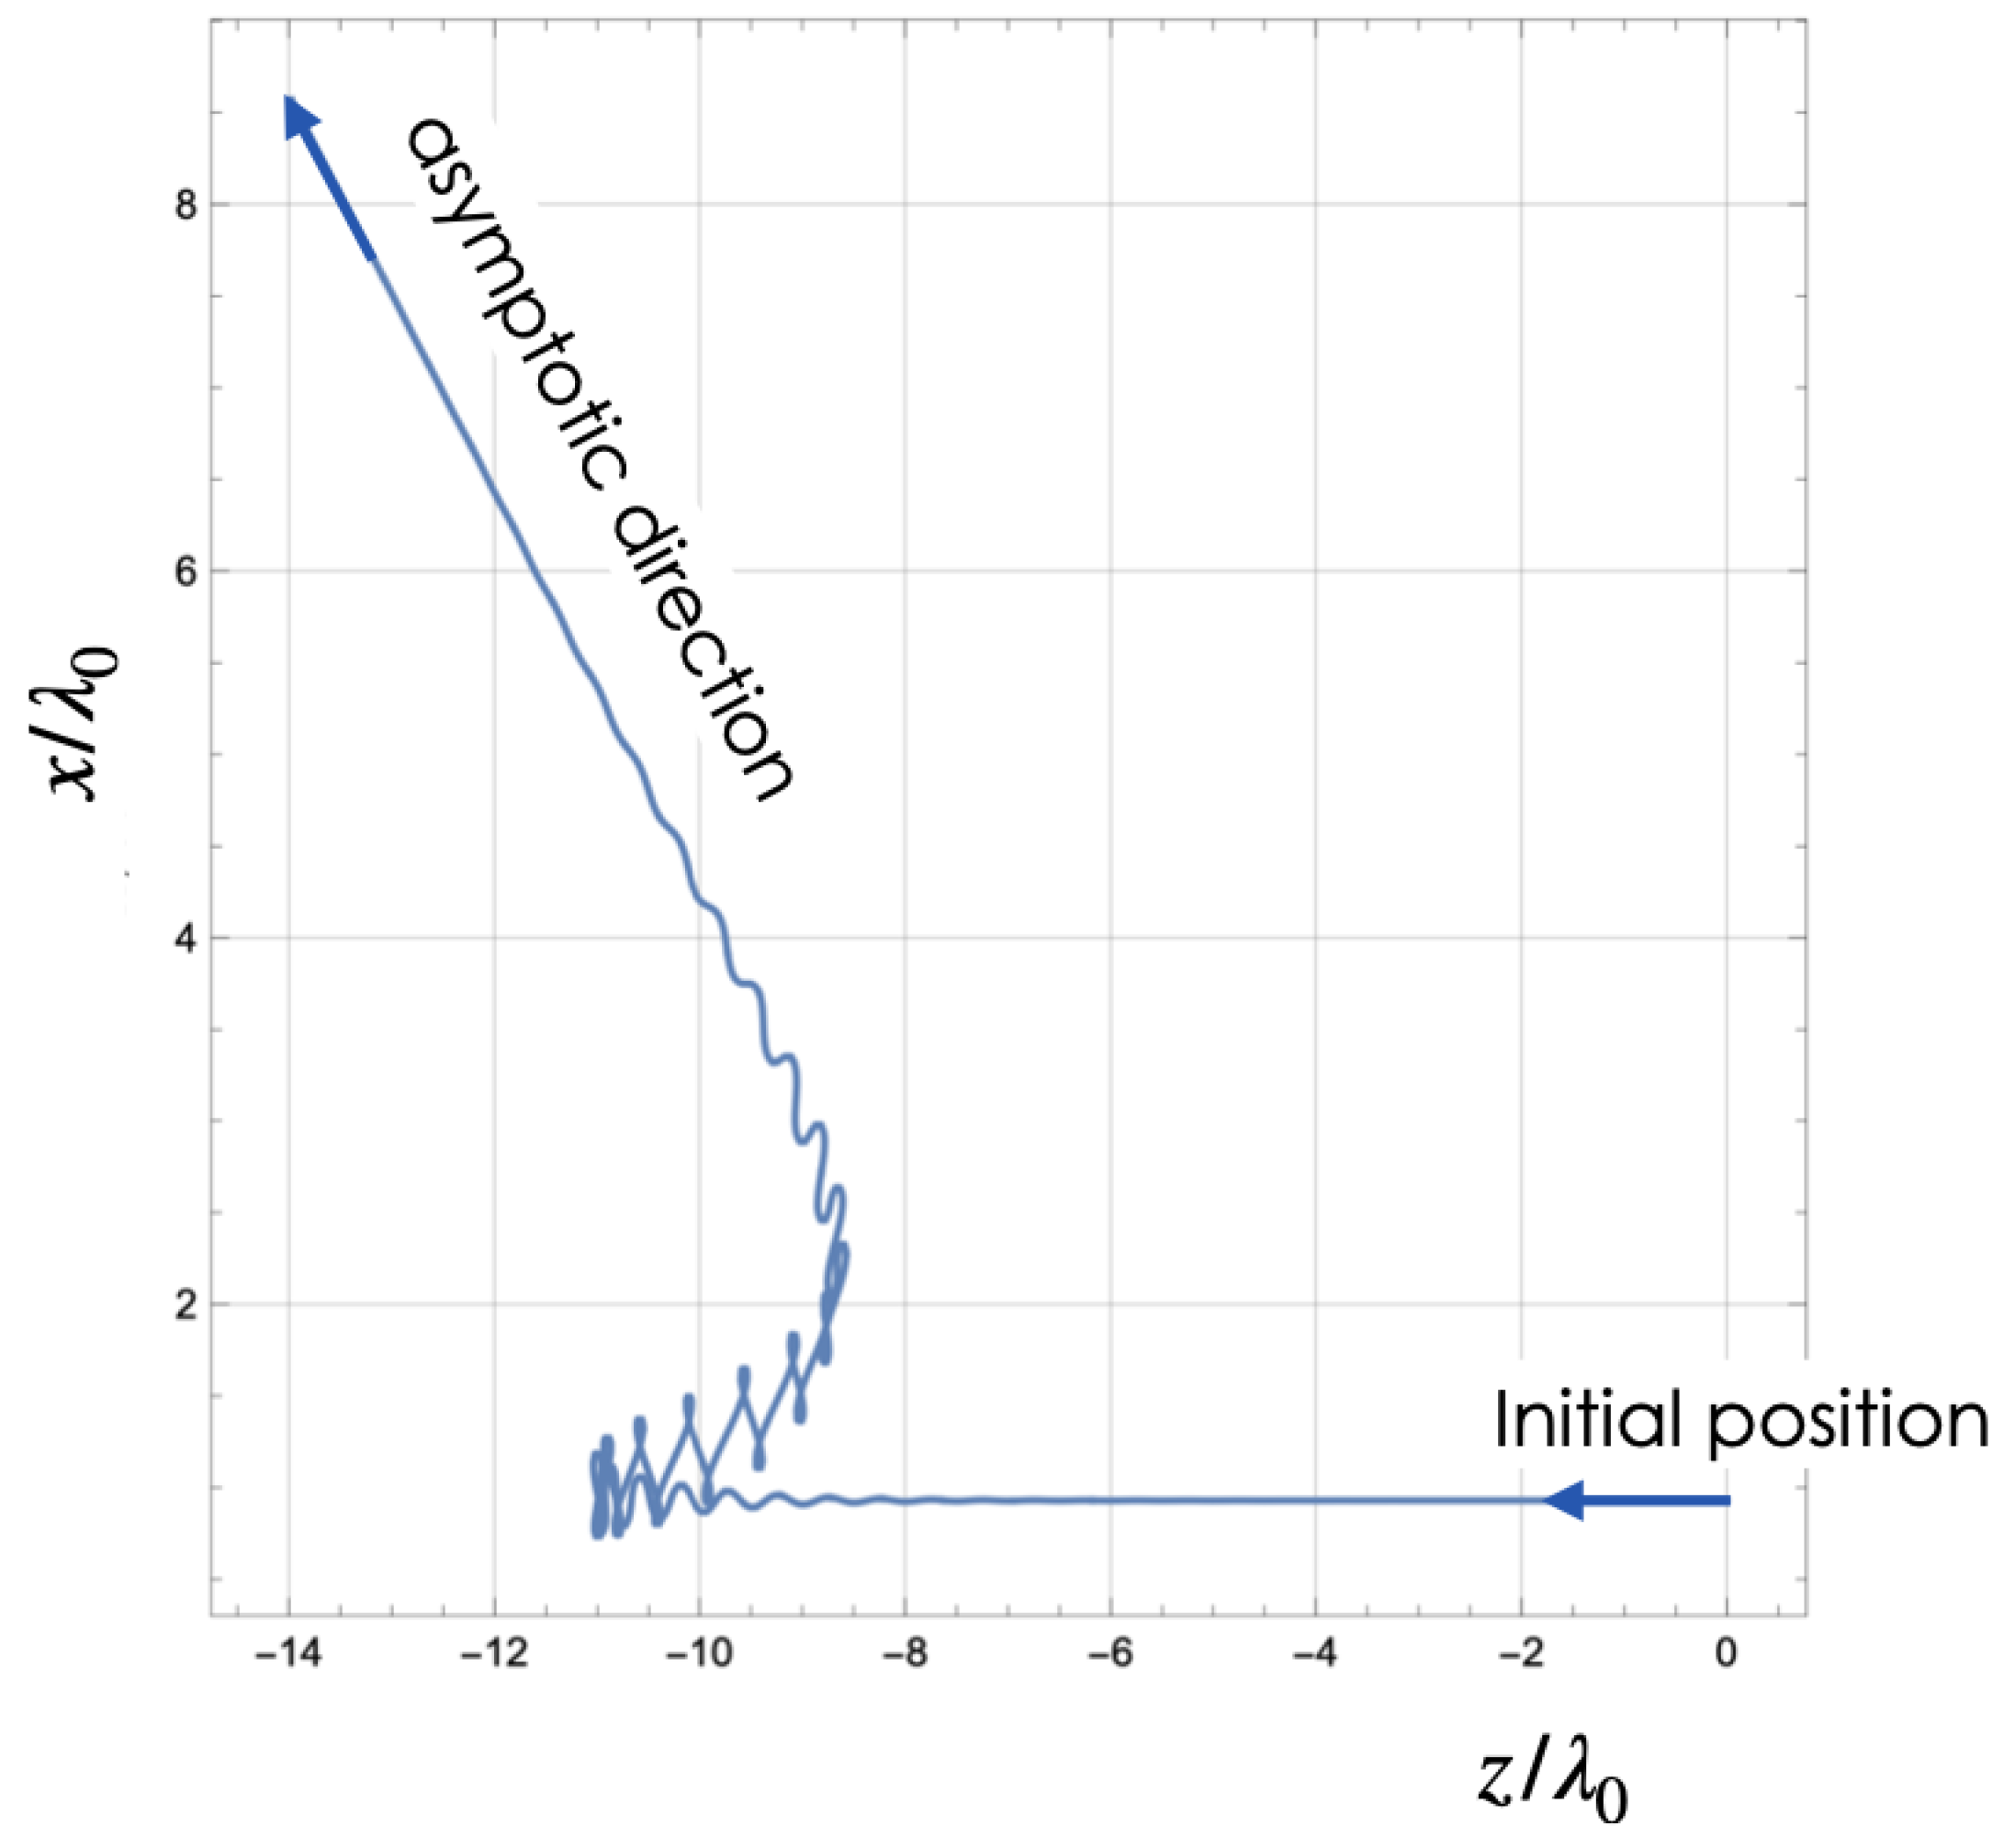
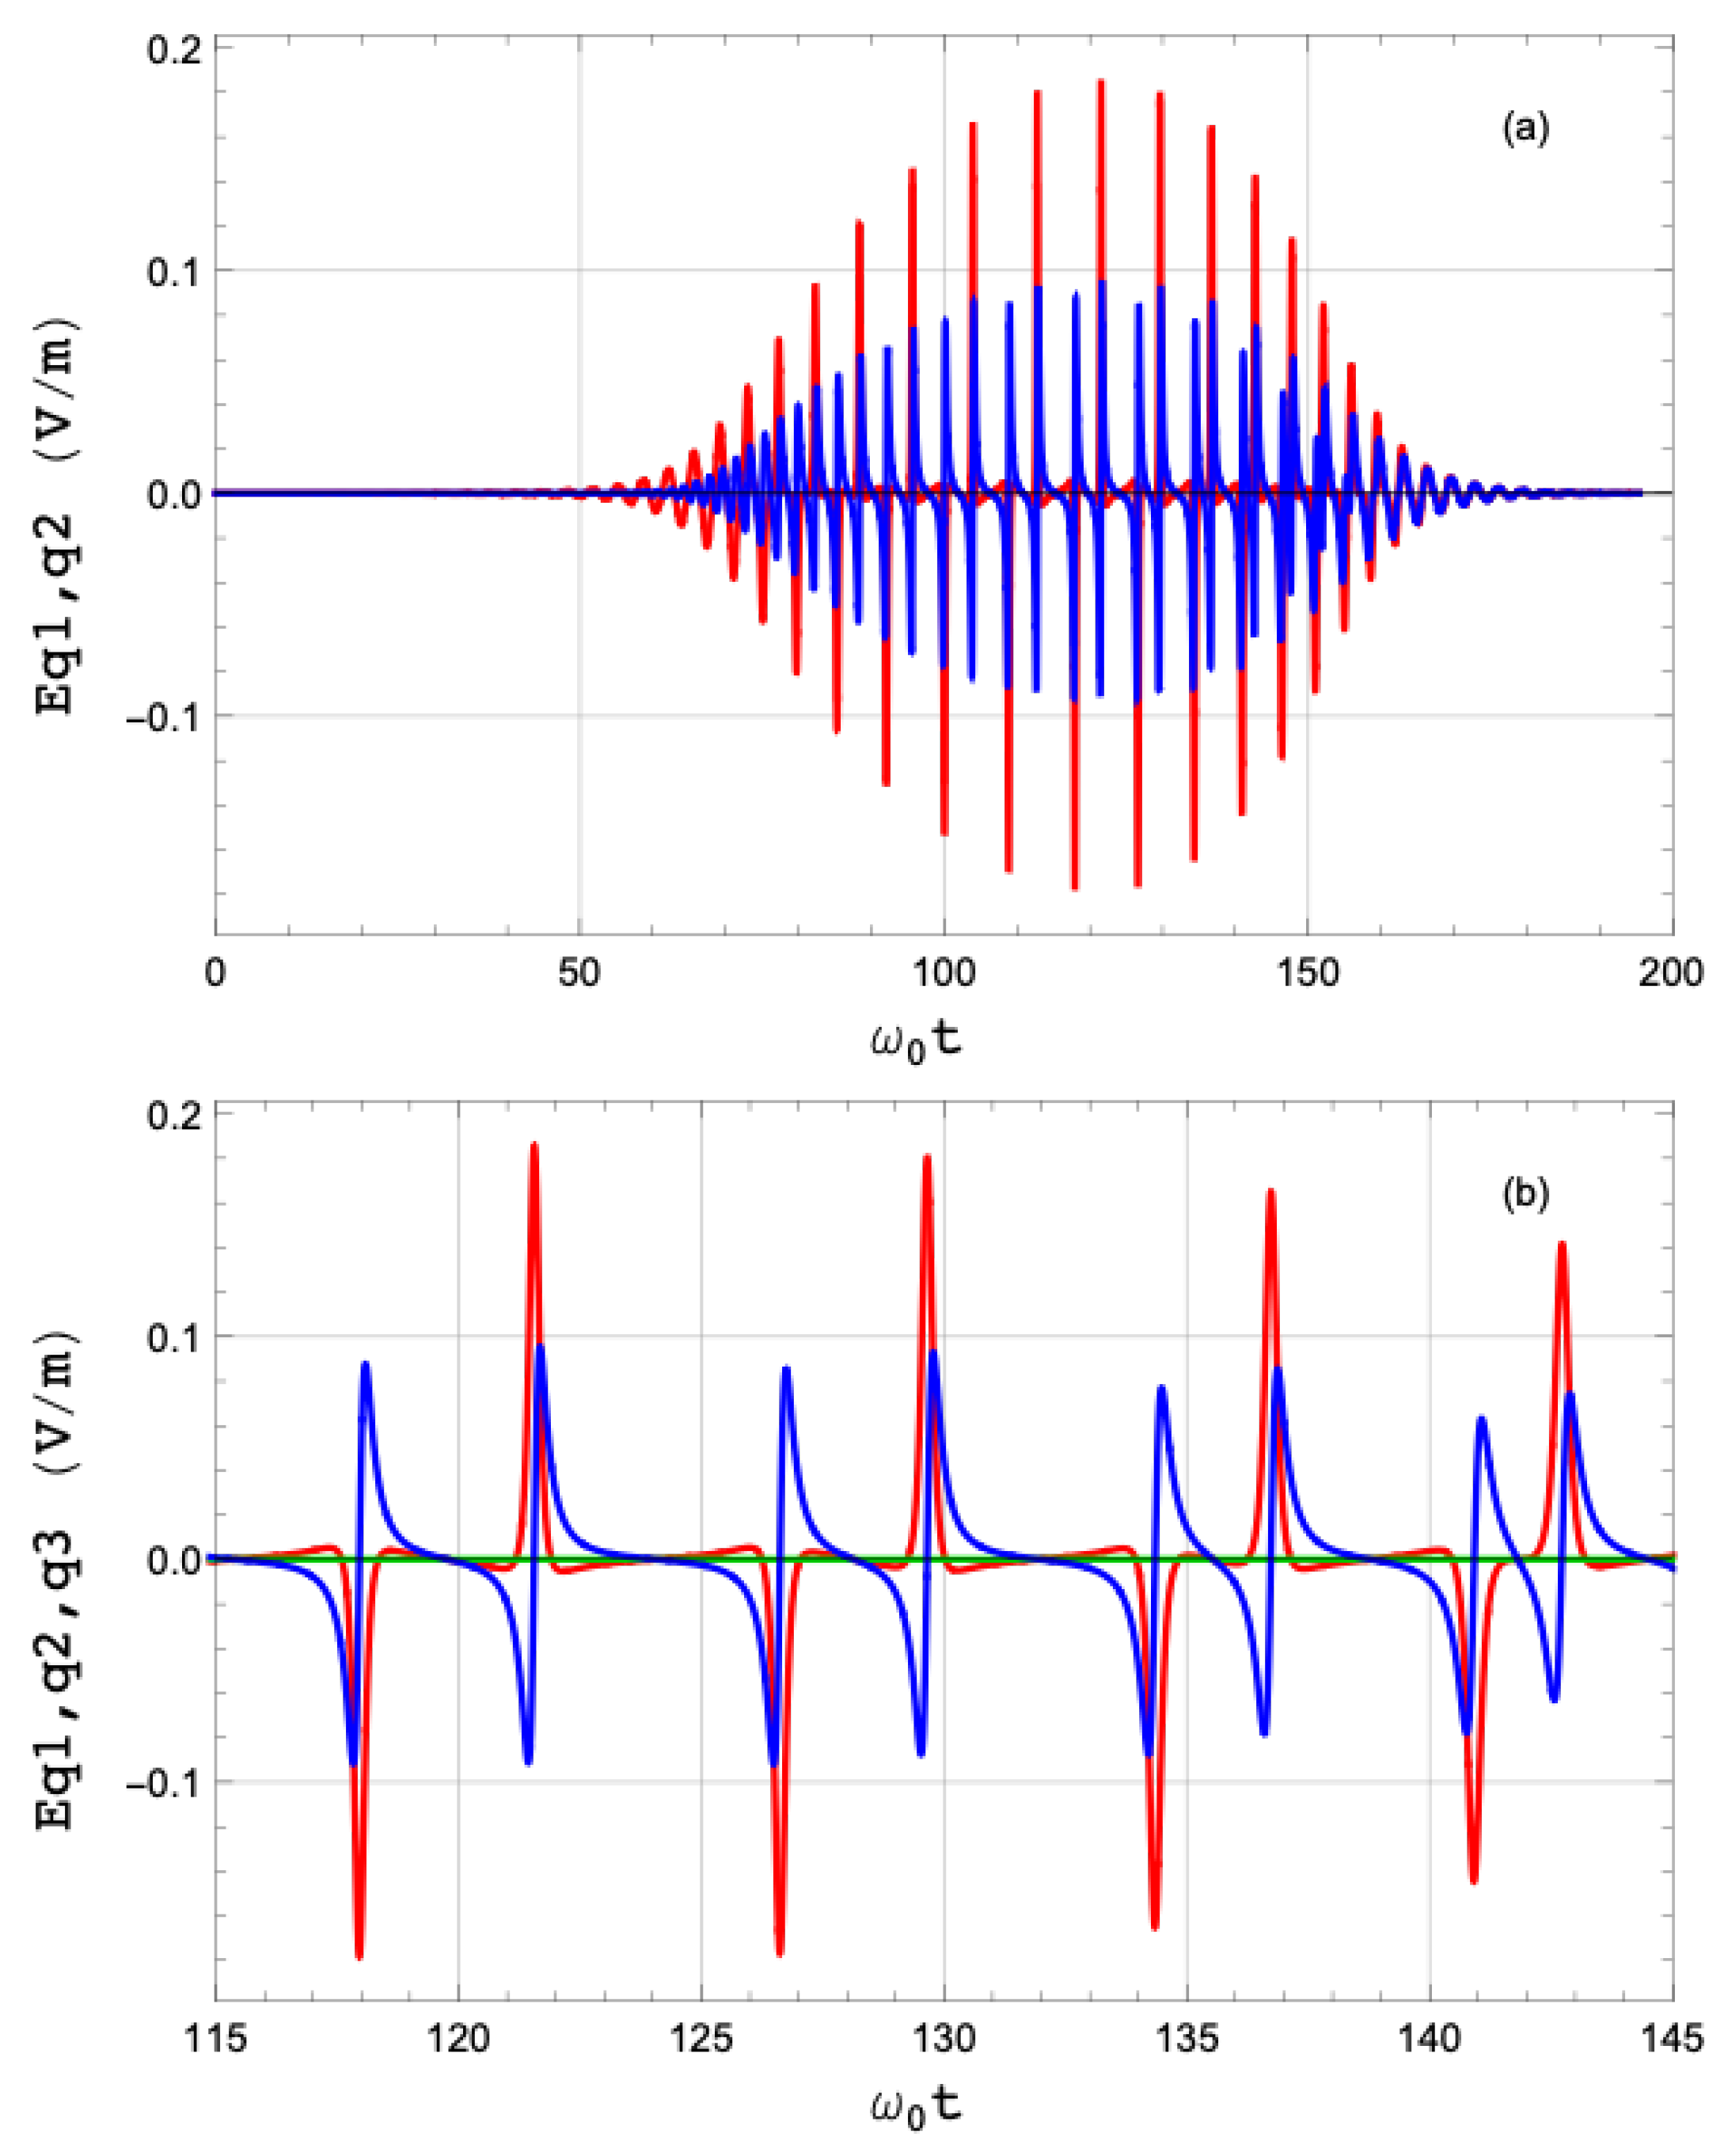
As before, observations are made at a distance of 0.5 m from the focus. The scattering angle is systematically varied from 48 π / 128 to 80 π / 128 . Under these conditions, the electron experiences significant deflection, and its energy is rapidly diminished due to RR effects, as illustrated in Figure 15 and Figure 16. Figure 15 depicts a projection of the electron trajectory onto the XZ plane, showing the intricate path of the driven electron. Figure 16a,b show the time evolution of the relativistic γ factor and the normalized velocity ( v / c ), while Figure 17 illustrates the radiated electric field at the detector in the time domain for this driven trajectory. A comparison with the previous case reveals that the electron motion is reversed for several laser cycles.
The dynamics are evident in Figure 16, where two distinct regions are observed. The first region shows deceleration, where γ decreases from an initial value of 2000 to a few hundred. This region corresponds to a “collision” between the electron and the pulse, resulting in a sudden reduction in the Lorentz boost. The electron transitions from “seeing” an X-ray laser to an optical laser. The second part of the trajectory corresponds to very intense driving with oscillations following the laser period and high nonlinearity. The trajectory predominantly follows the x direction (due to laser polarization) and the z direction (due to the coupling of the x-direction velocity with the laser’s magnetic field). A smaller motion in the y direction (green curve in Figure 16) results from the combined transverse and longitudinal fields, highlighting the importance of including longitudinal fields as noted in the literature [12].
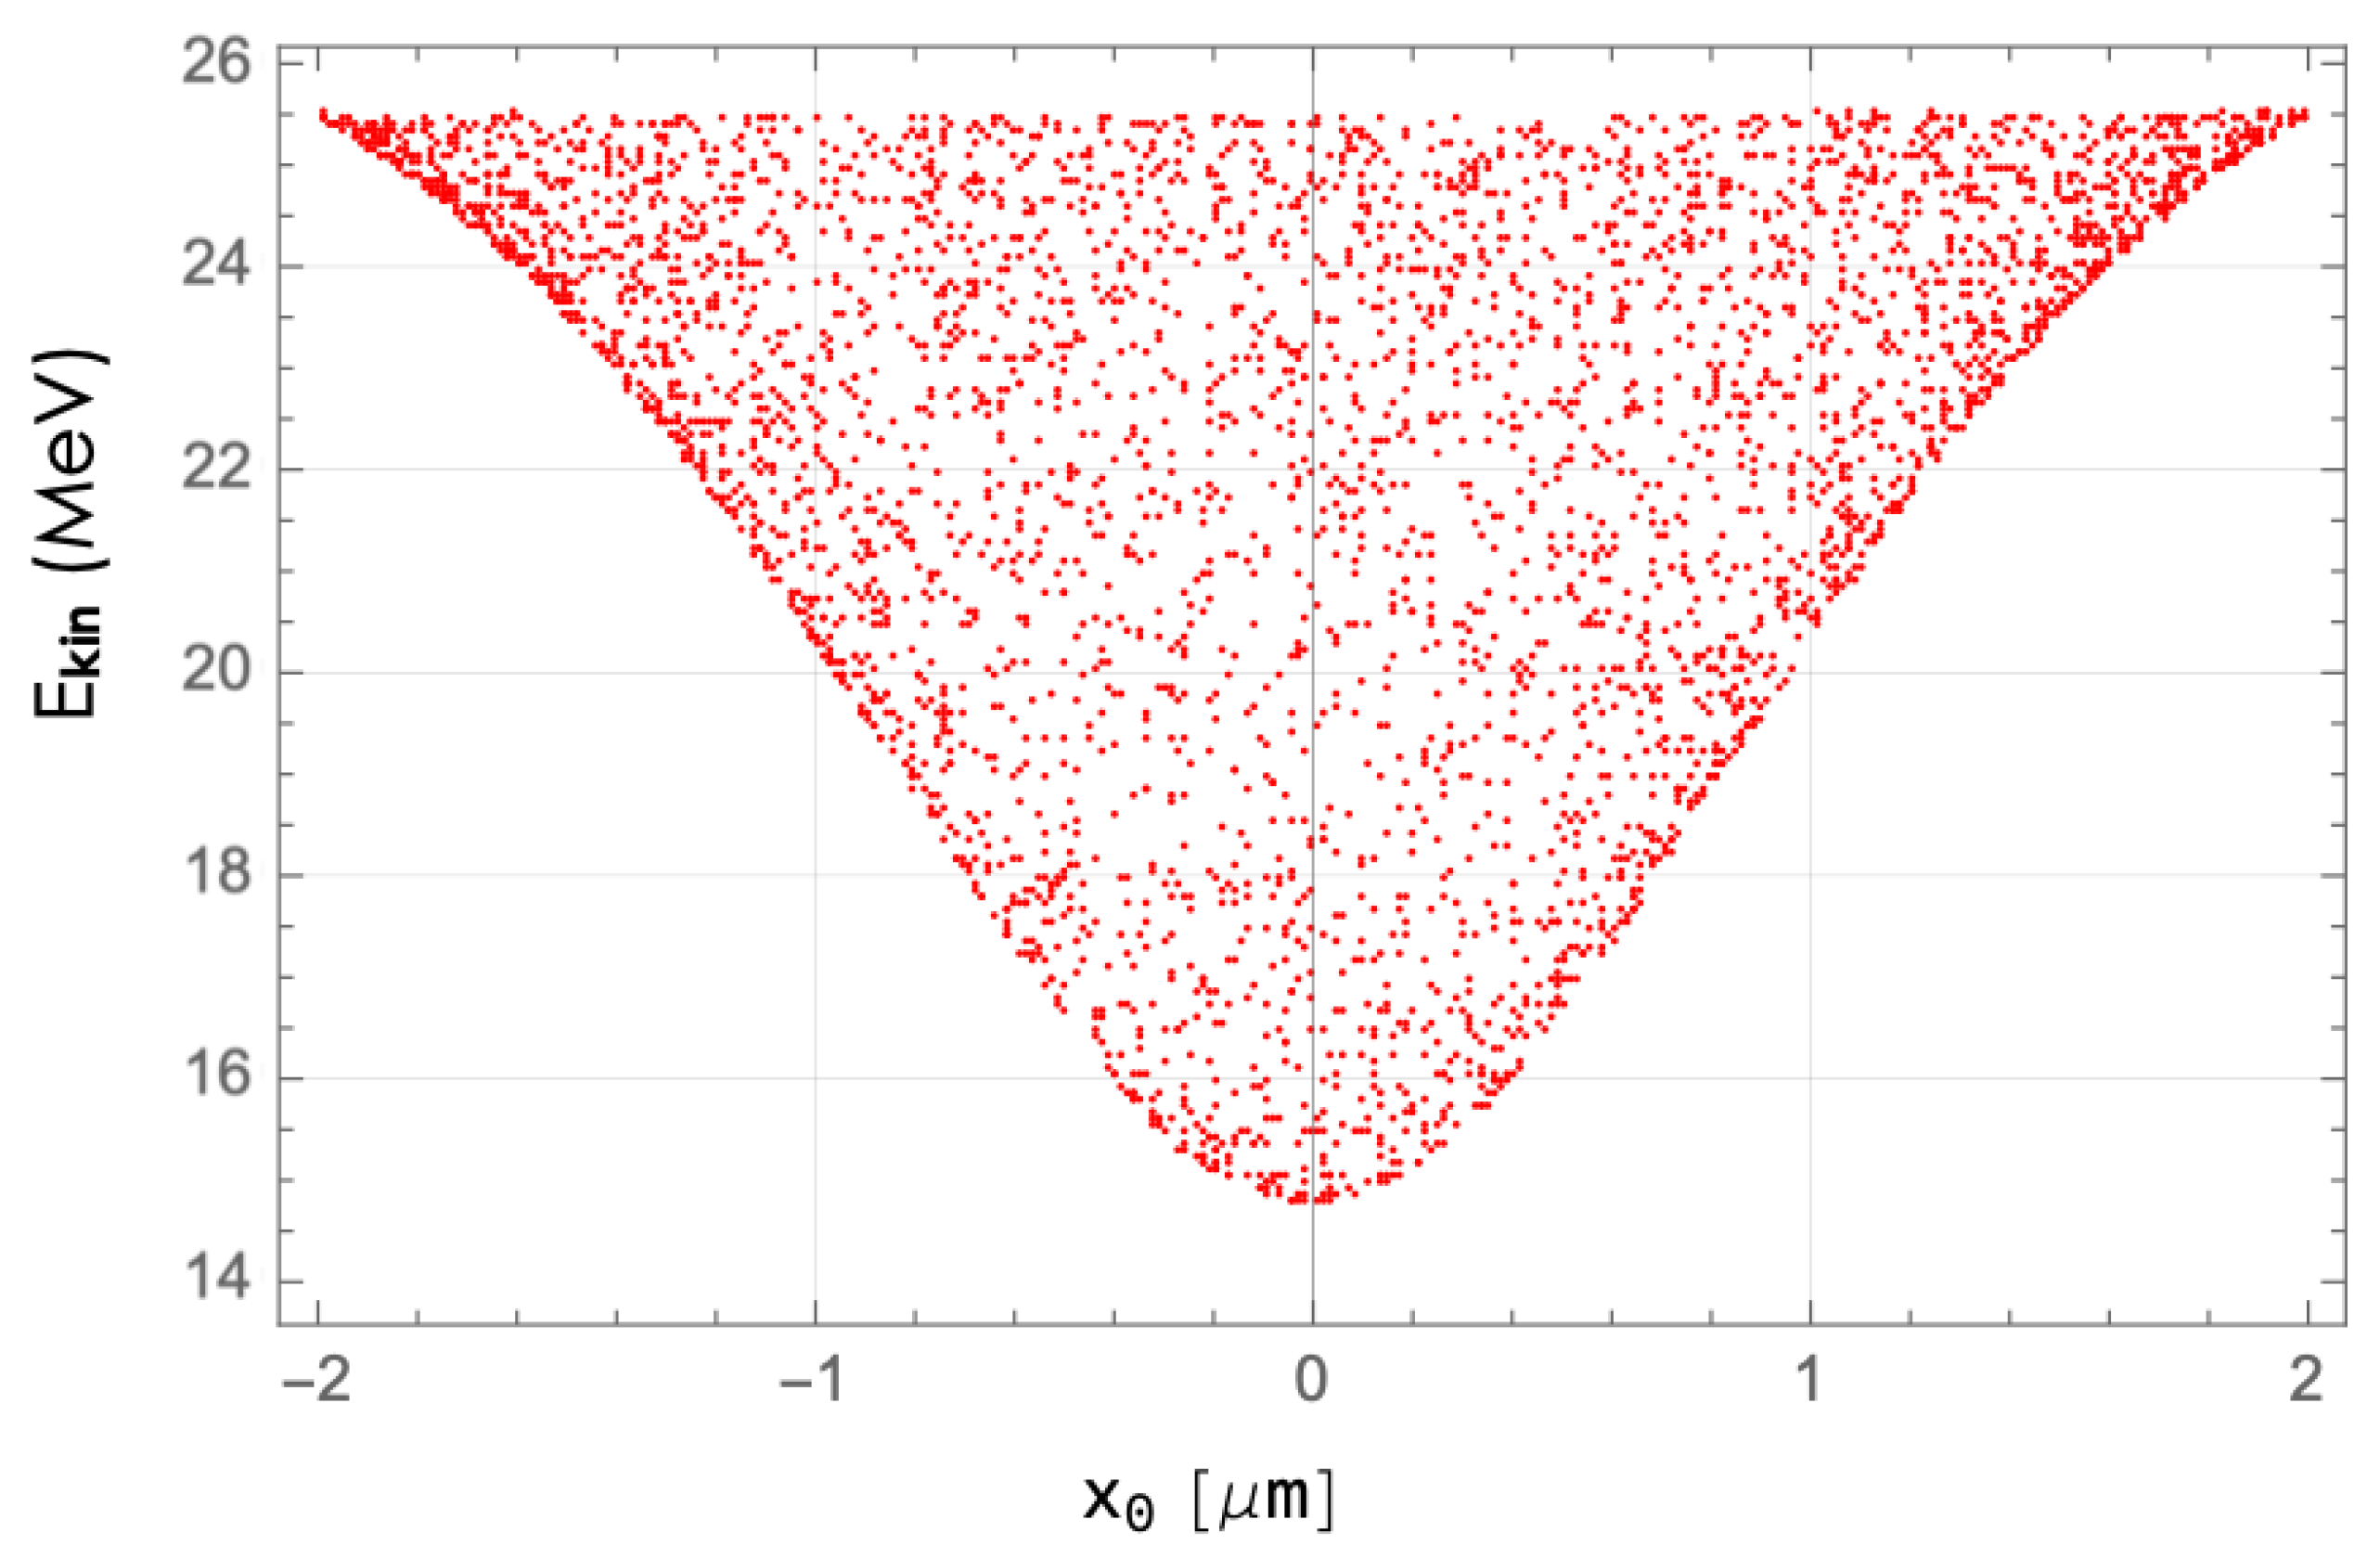
Figure 18 and Figure 19 summarize the asymptotic distributions of momentum and energy for this case study. The symmetrical patterns in these figures are comparable to those in Figure 10 and Figure 11. Notably, Figure 19 shows a significant reduction in kinetic energy, from 1 GeV to as low as 15 MeV for electrons near the laser center. Despite partial reversal of the trajectory during the laser pulse interaction, the asymptotic velocity remains in the initial direction. For even higher intensities, as discussed in the next section, the asymptotic velocity can also reverse. The final energy distribution in Figure 19 shows a cylindrical symmetry similar to that in Figure 11.
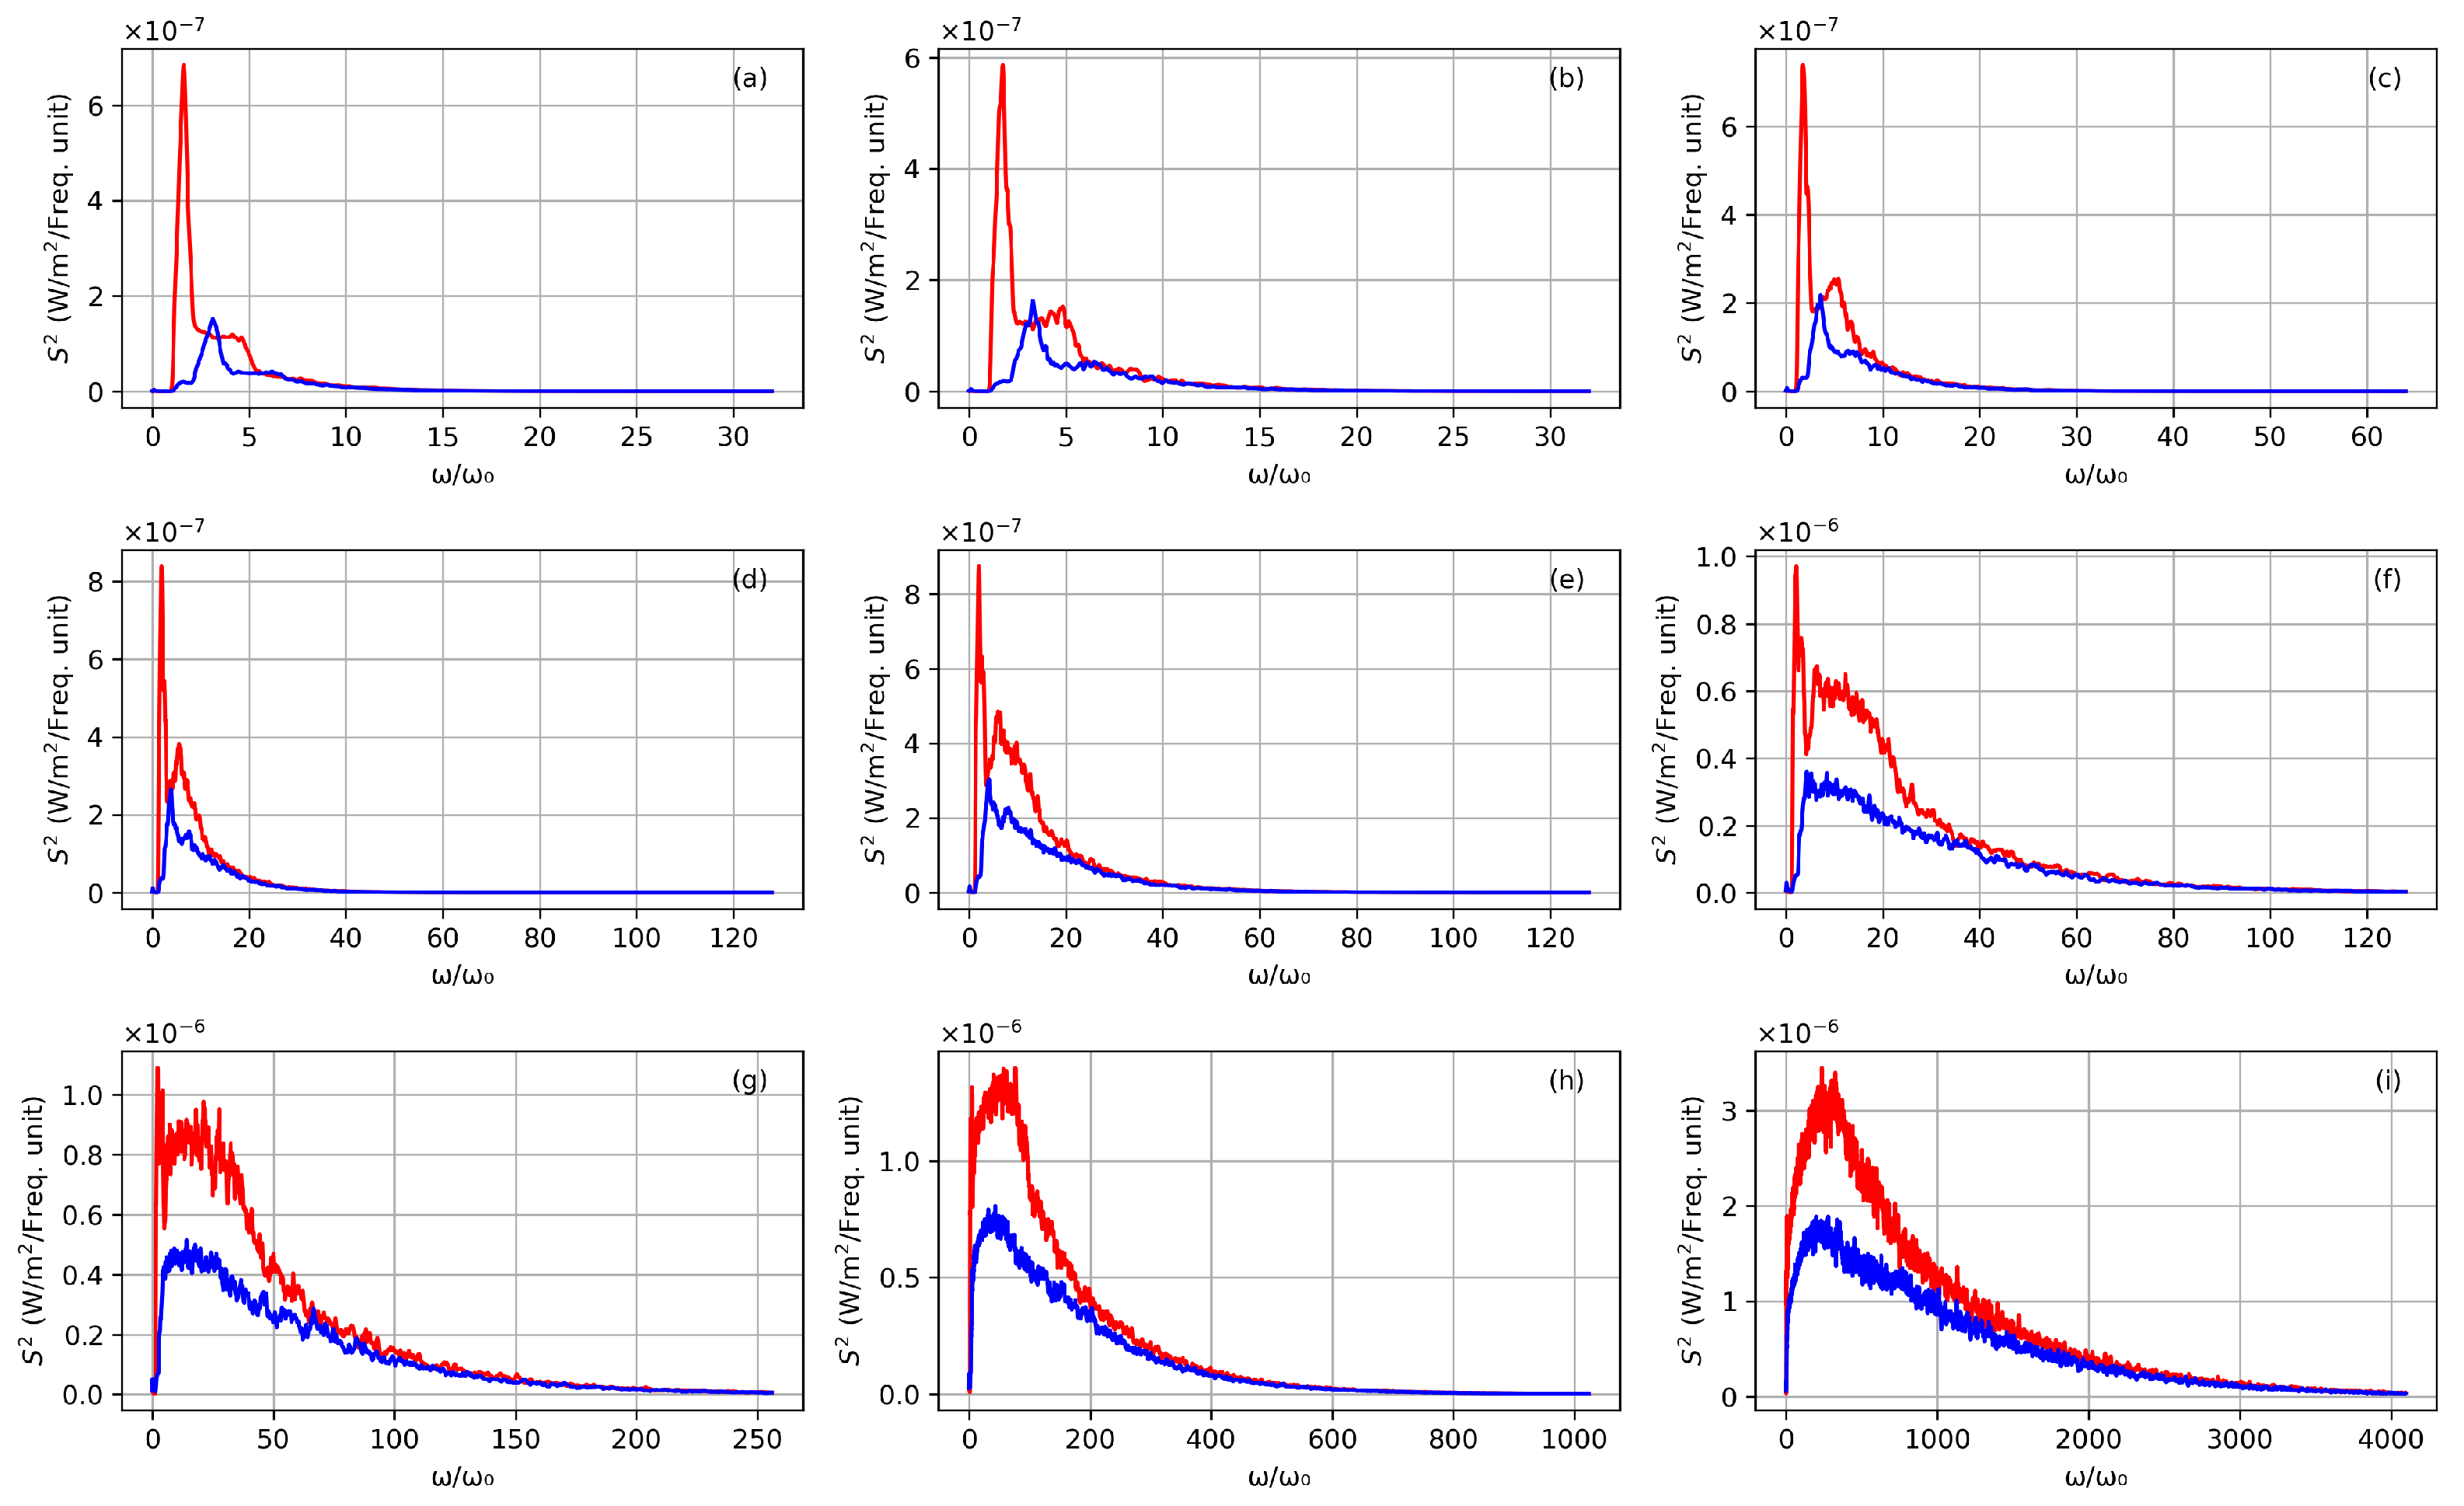
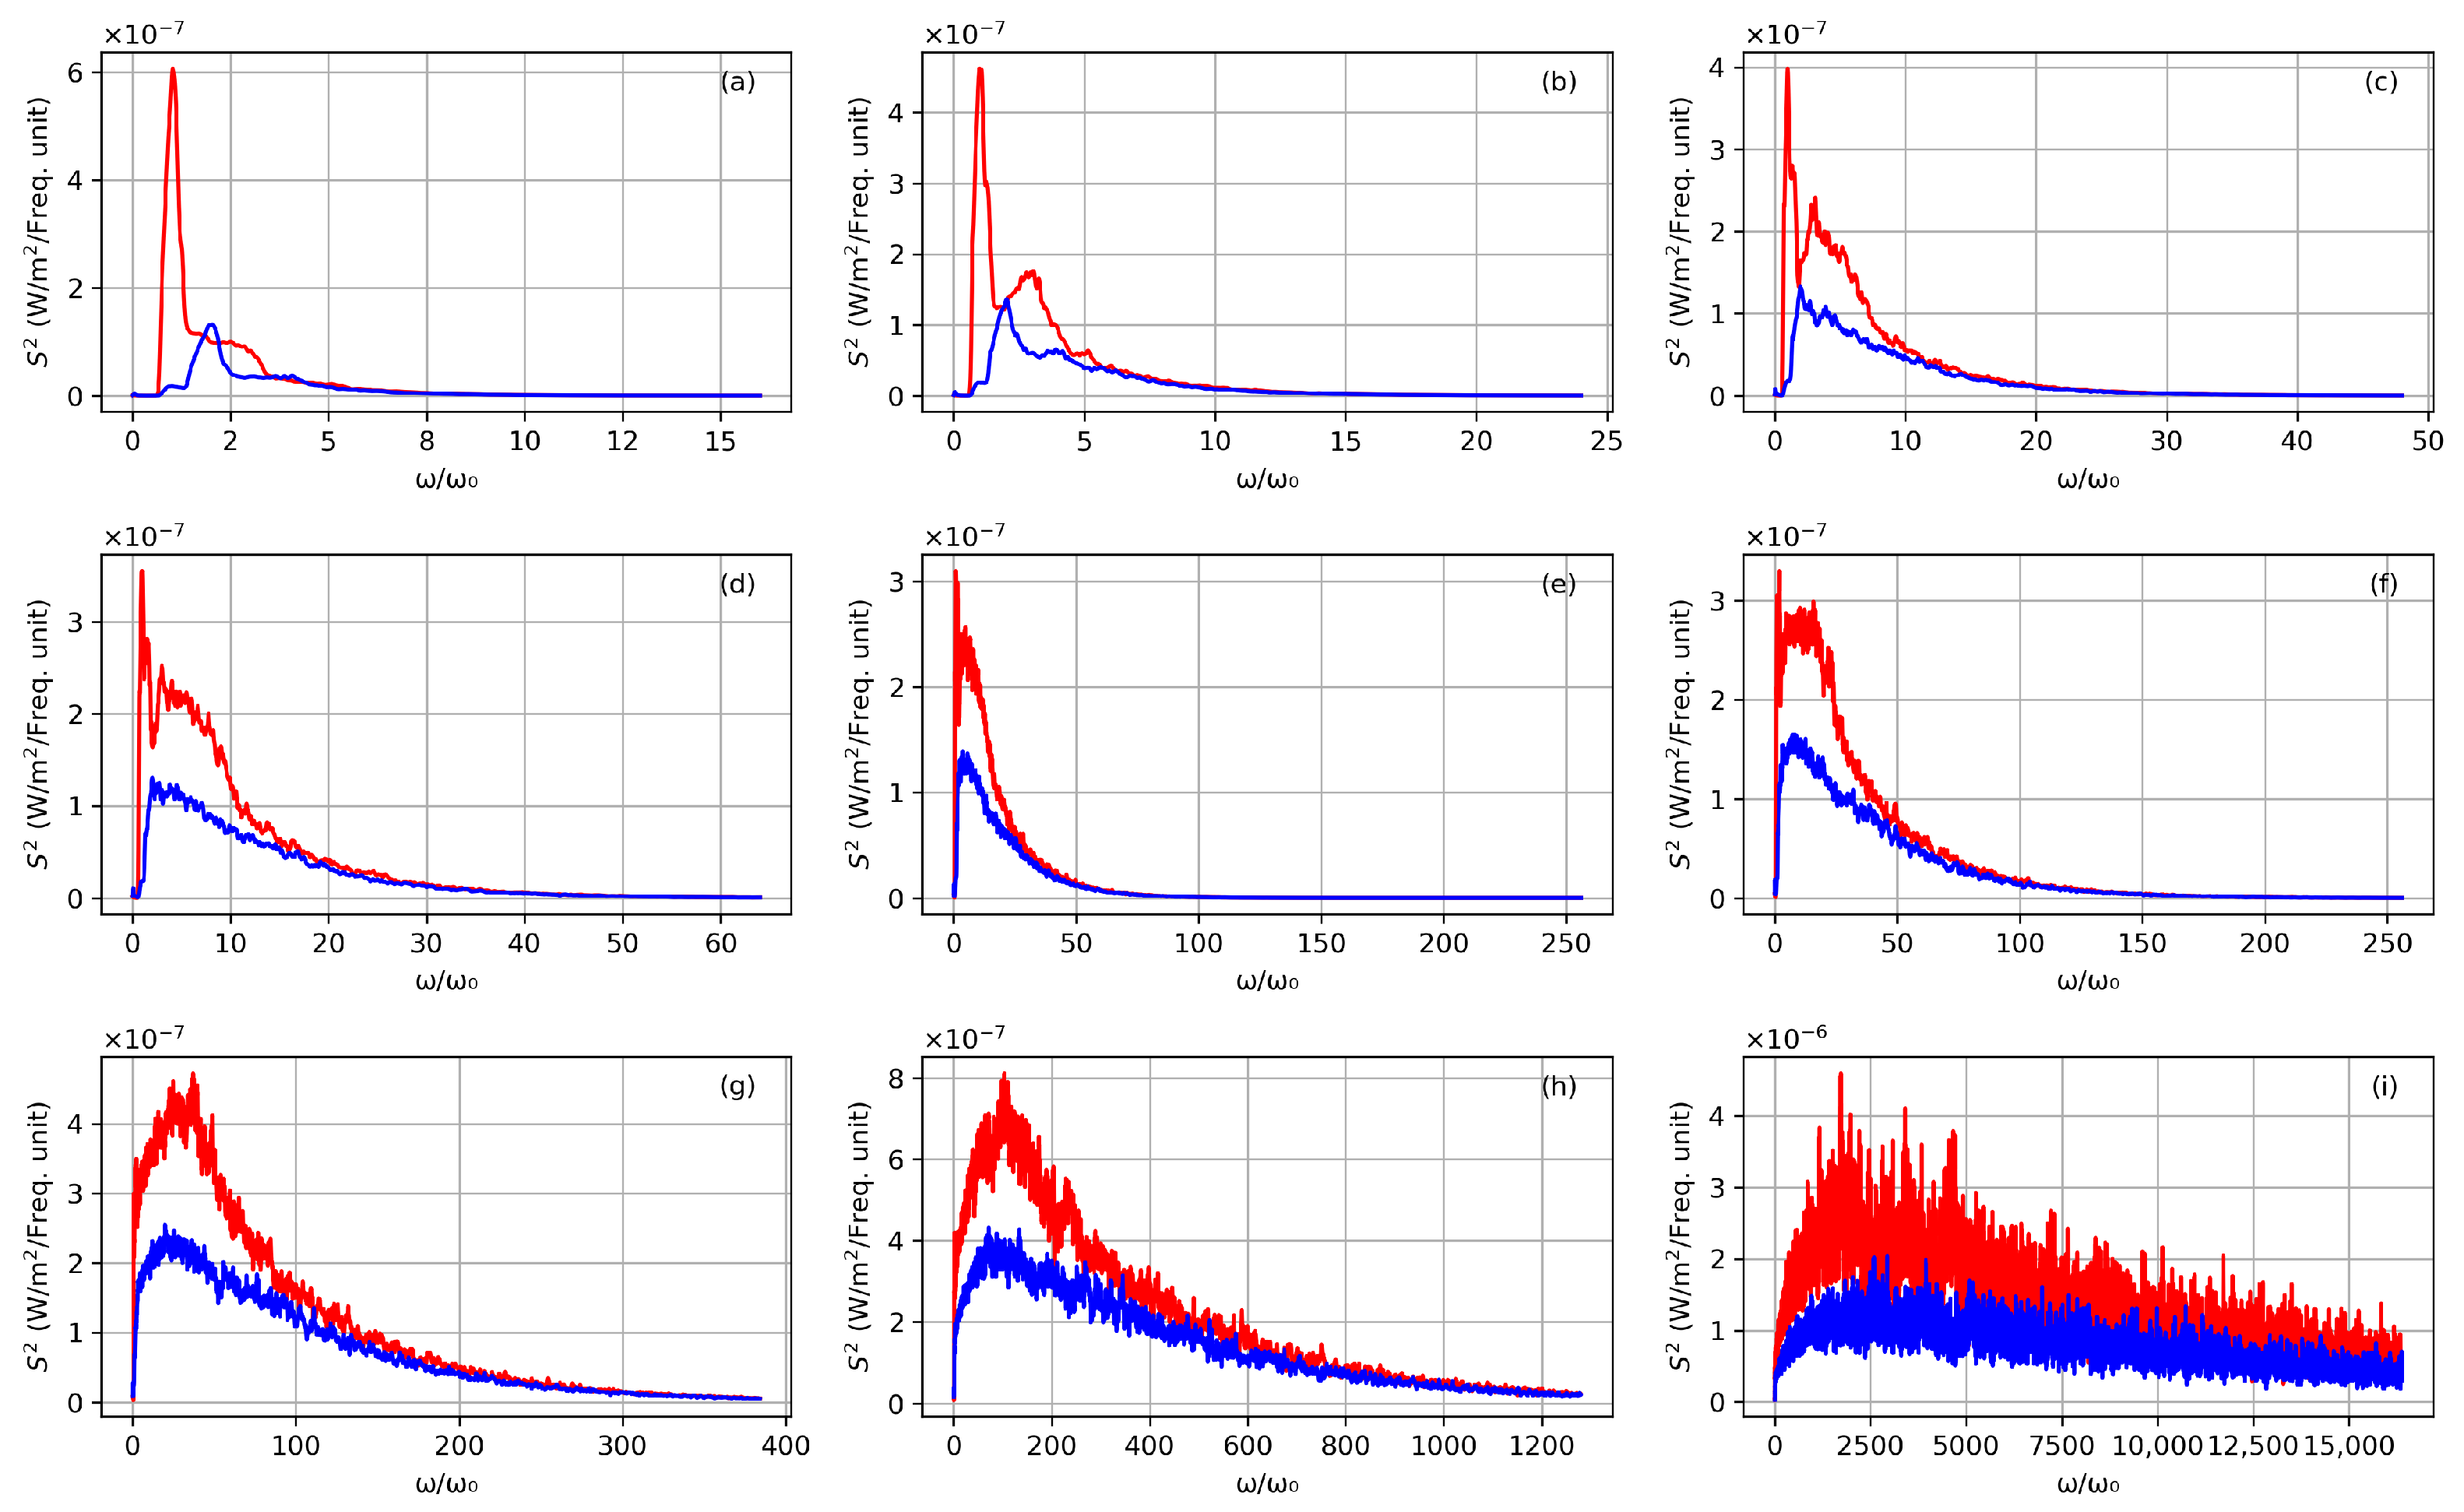
Figure 20i has to be compared to Figure 13i and Figure 6i. Here, Figure 20i corresponds to an angle of 80 π / 128 , whereas Figure 13i and Figure 6i correspond to 96 π / 128 and 127 π / 128 , respectively. Although the scattering angle is closer to the polarization direction, the emission spectrum in Figure 20a is significantly broader compared to the previous sections, with no distinct Doppler-shifted peaks, indicating a continuous spectrum. This broad spectrum is attributed to the rapid deceleration of the electron, as shown in Figure 16, where the electron slows from 1 GeV ( γ = 2000 ) to 100 MeV ( γ = 200 ) within a few laser cycles. The dissipation of about 90% of the initial electron energy is a noteworthy feature of the RR process. Following this, the electron oscillates under the extreme laser pulse, exhibiting dynamics similar to an electron initially at rest.
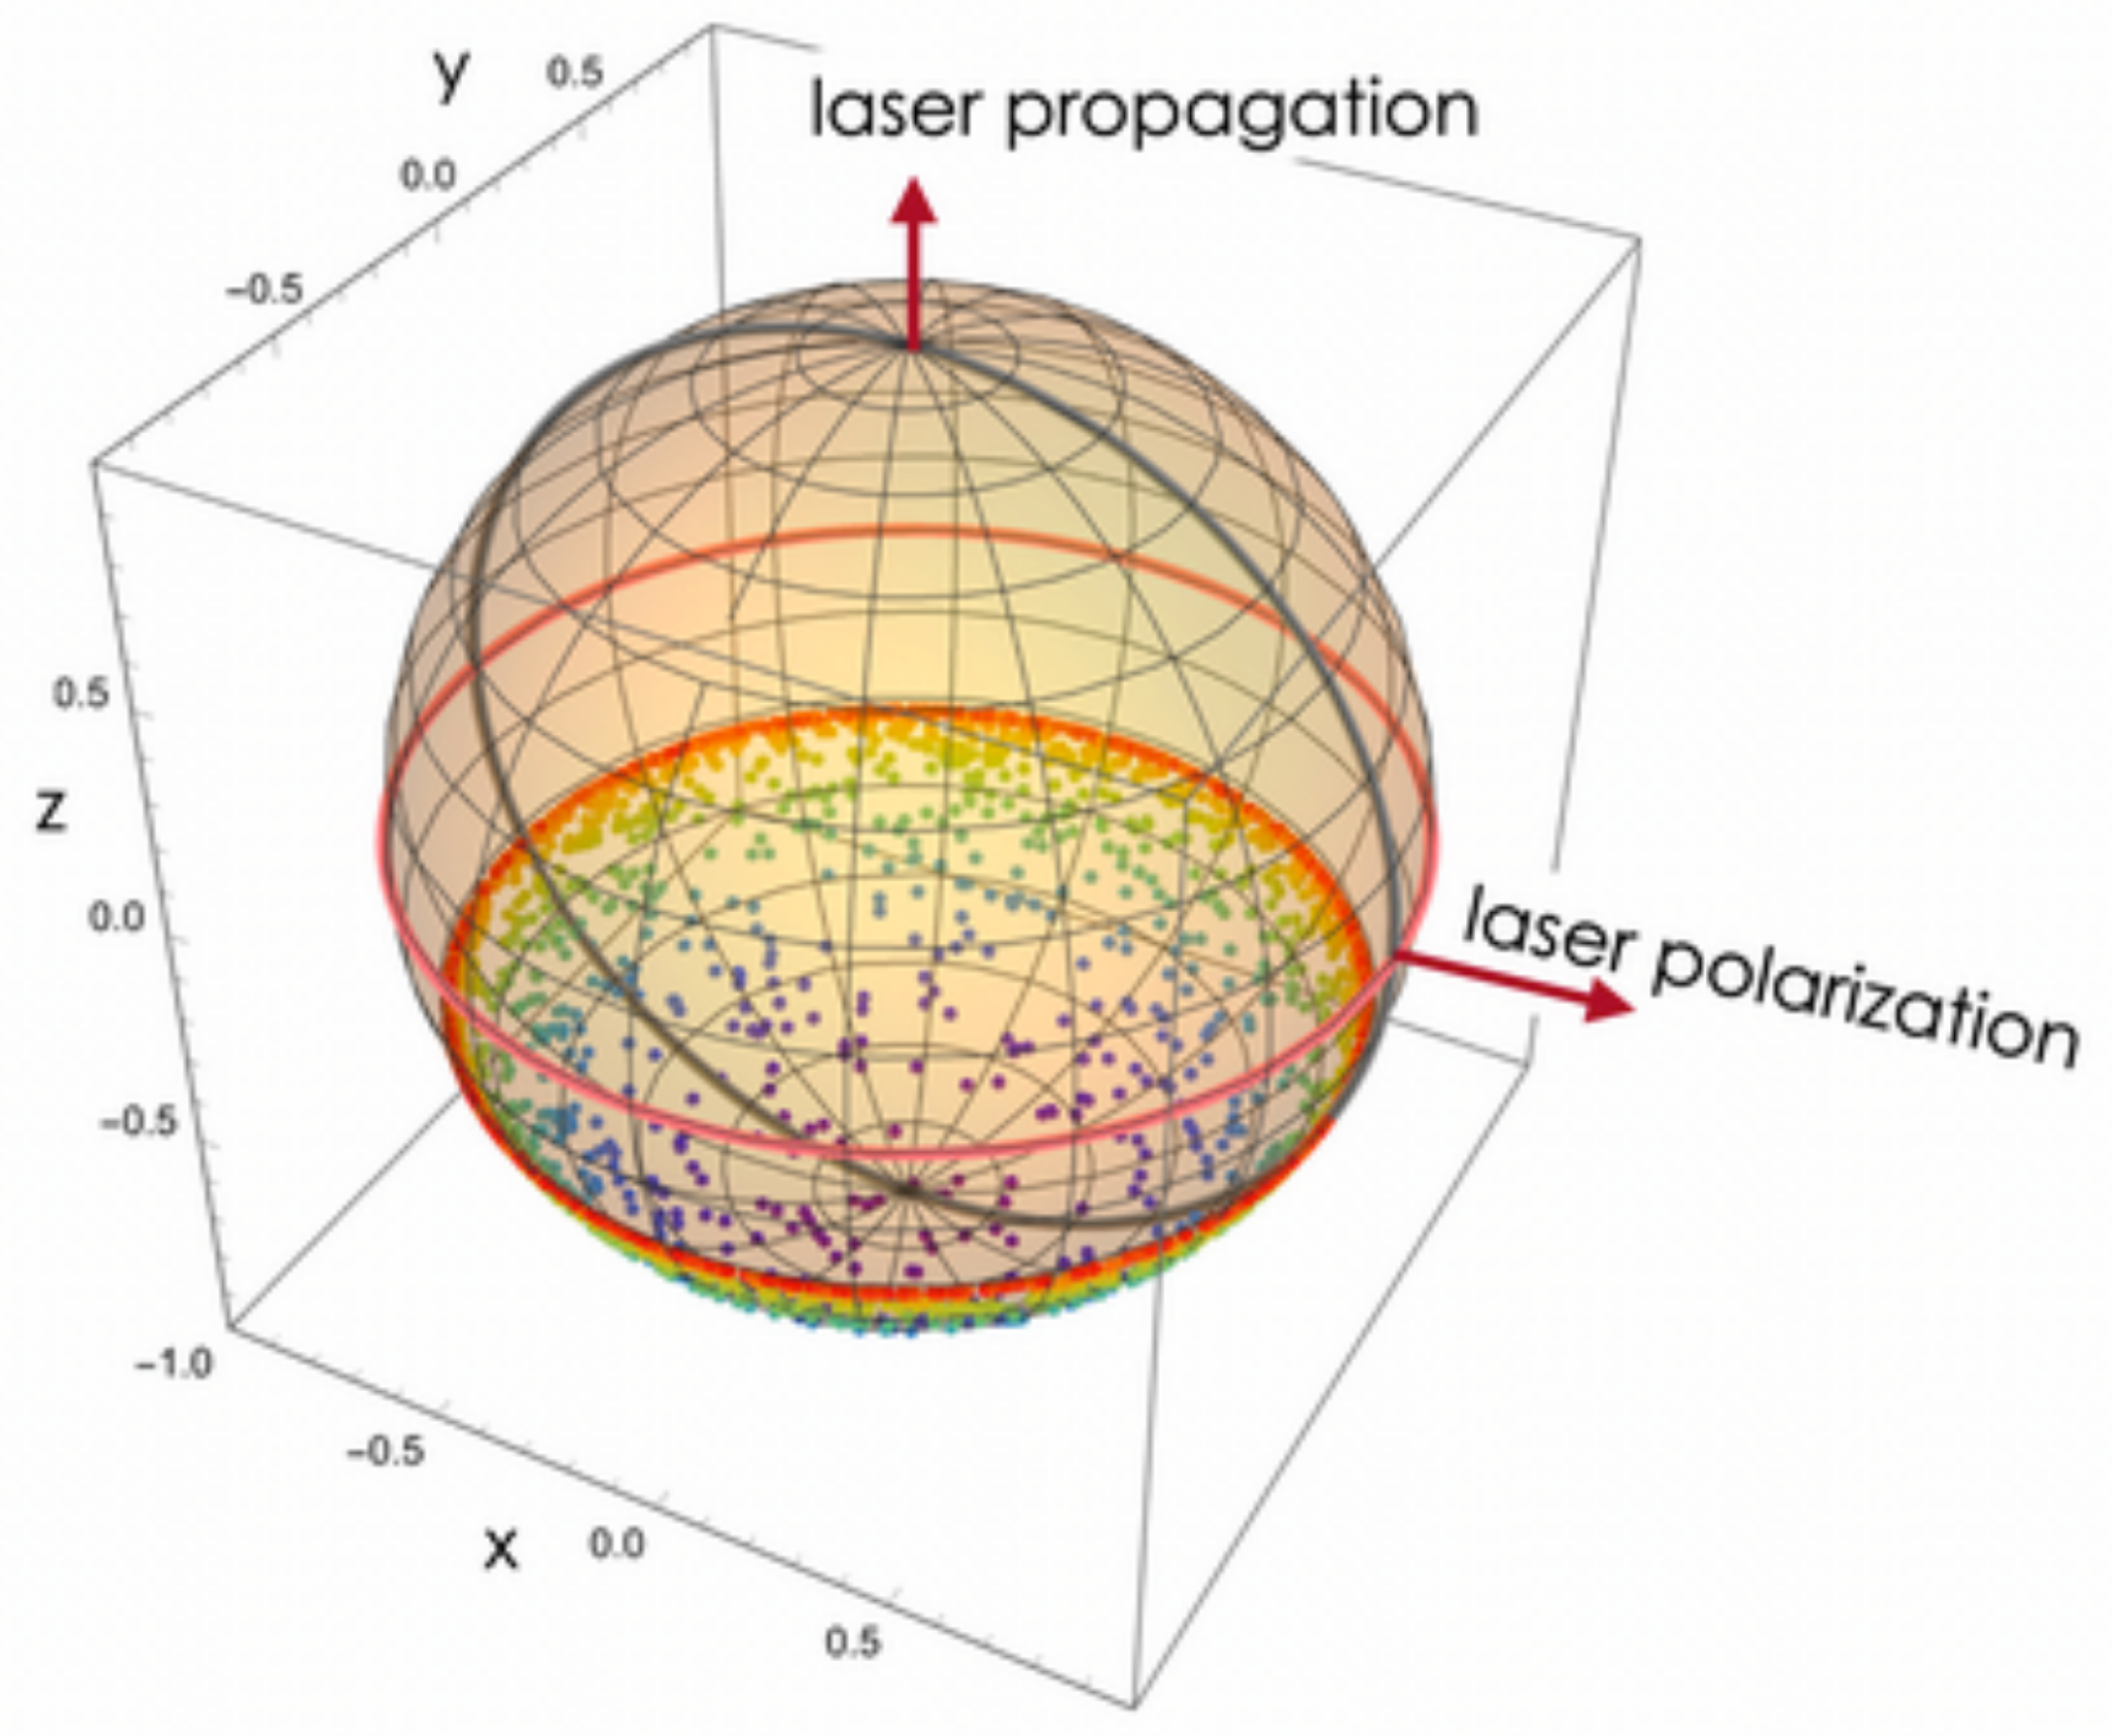
A clear visualization of the electron scattering by the laser pulse can be achieved by depicting the asymptotic directions (final velocities after interaction) on a unit sphere (Figure 21). The upper pole of the sphere indicates the laser direction (positive z-axis), while the lower pole represents the initial electron velocity (counter-propagating to the laser). The orange circle denotes the asymptotic scattering angle for most electrons in the bunch, suggesting that all electrons move within this cone without reversing their velocity after the interaction. The final angle of the trajectory in Figure 15 aligns with this orange circle. Velocity reversal is significant, as it implies ultraviolet deceleration and subsequent acceleration in the laser direction. This phenomenon will be explored further in the next section, which will address even more intense accelerations.

7. Case of a Record High Peak Intensity

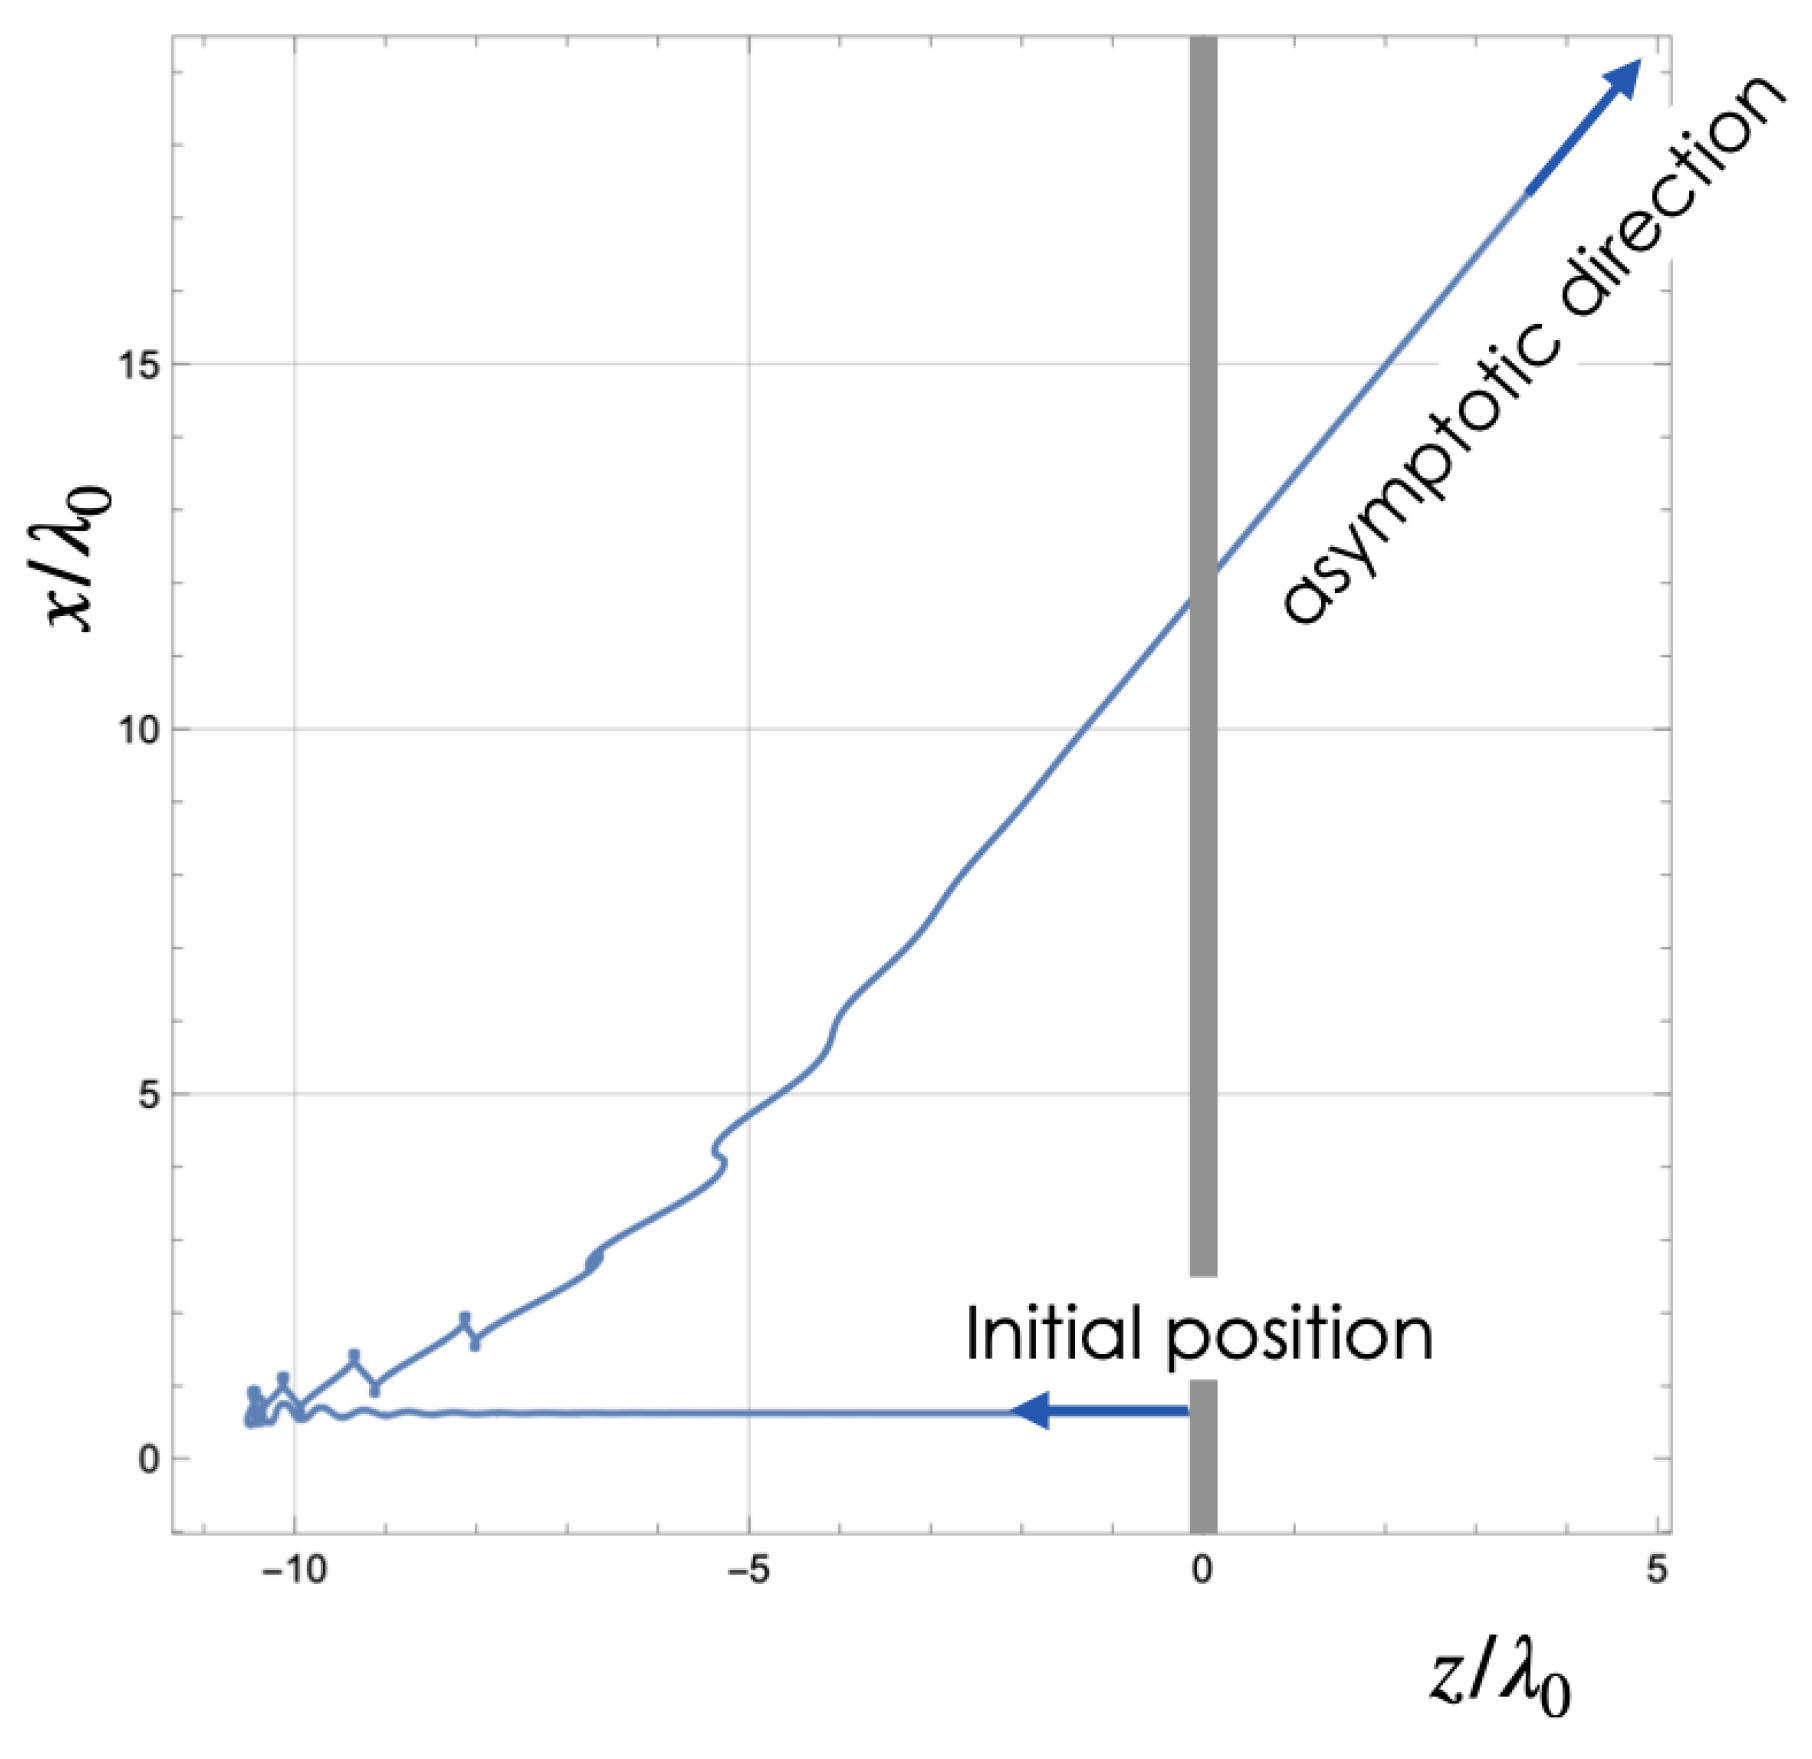
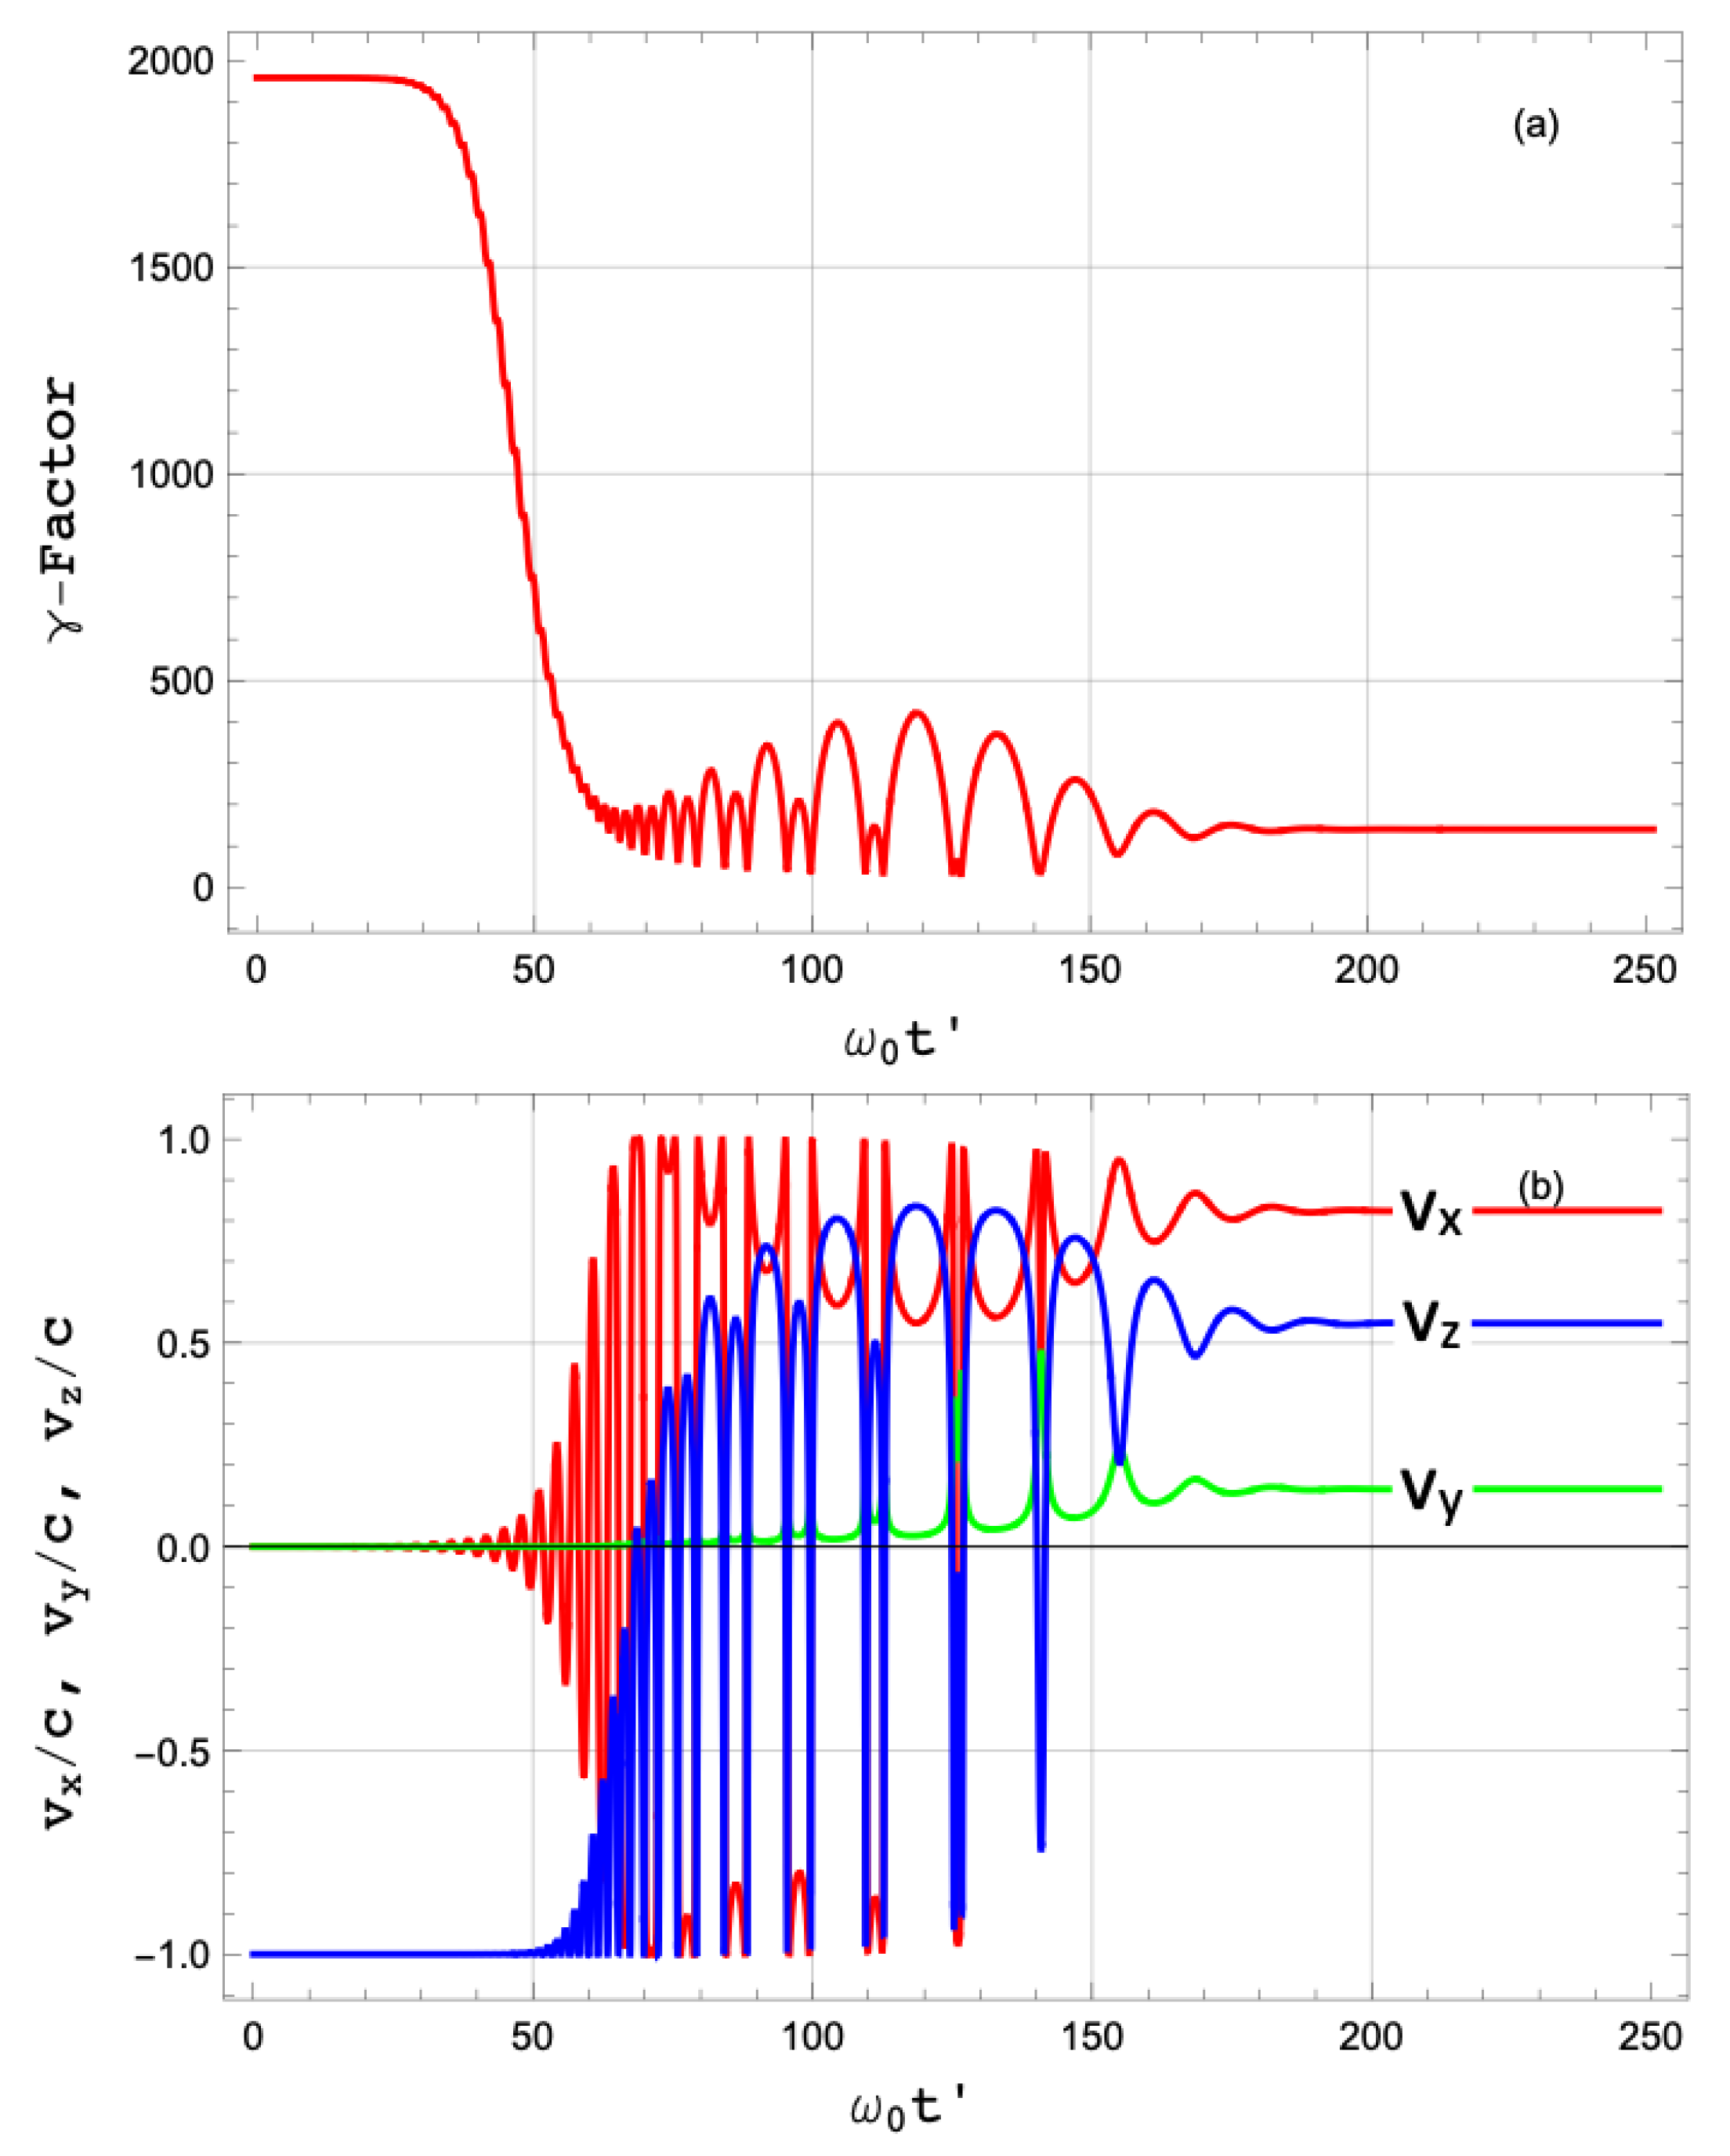
In this case study, we consider a scenario approaching the record intensity achieved to date, but with a slightly less tight focus to maintain the paraxial Gaussian description we have been discussing. We describe the radiation RR according to our model for a peak intensity of 10 23 W / cm 2 . This intensity has been experimentally achieved; however, the laser waist is w 0 = 4   μ m . The configuration and other parameters (pulse length, electron bunch size, initial position, and initial energy) remain the same as in previous sections. This section aims to characterize the scattering events at ultra-high intensity, focusing on the spectrum shape and the integrated radiated power in the two orthogonal quadratures of the emitted field. Sample plots illustrate that, at such extreme intensities, the asymptotic electron trajectories become partially co-propagating. In other words, electrons undergo scattering of more than 90 from their initial counter-propagating direction. The laser intensity is so high that the electron trajectory can be reversed, and the electron can cross back over its initial position (indicated by the gray line in Figure 22). The curly structure of the parametric trajectory depicted in this figure is characteristic of the motion of an electron driven by a linearly polarized laser field. Here, the reversal of the trajectory is so pronounced that the asymptotic motion is in the opposite direction; the electron enters at 1 GeV against the laser propagation direction and finally moves in a cone along the direction of the laser. This dynamic is also evident from Figure 23, which shows one region of slowing down and another of nonlinear oscillatory driving. However, in this case, the oscillation amplitude is so broad that the electron can eventually (asymptotically) reverse its initial direction of motion. Since this study aims to suggest that TS spectra impact the measurement of RR, the fact that electrons reverse their asymptotic trajectories is beneficial. This is because electrons will escape the interaction region in a cone along the laser propagation direction, leaving space (close to the XY plane, perpendicular to the laser propagation, Z) to perform the spectrometric measurement of the Thomson radiation.
Compare Figure 23 to Figure 8 and Figure 16. The electron dynamics along v x and v z exhibit the characteristic pattern of a relativistically driven electron once the deceleration process ends. The v y component, due to the longitudinal fields, is smaller than the other two but still relevant. Observe the correlation between the deceleration shown in Figure 23a and the oscillatory dynamics in Figure 23b, which becomes significant when the γ factor is reduced from the initial value of 2000 (1 GeV) to about 200 (100 MeV). At this moment, the electron’s initial velocity is less relevant (for this extreme laser intensity), and the dynamics are conceptually similar to those of an electron initially at rest. During this oscillatory phase, the acceleration and radiation are qualitatively similar to the case of an electron initially at rest. However, the fast deceleration phase, from γ = 2000 down to γ 200 , is characteristic of energy loss by radiation. Due to the rapid process, a broad spectrum is expected, even broader than that shown in Figure 20.
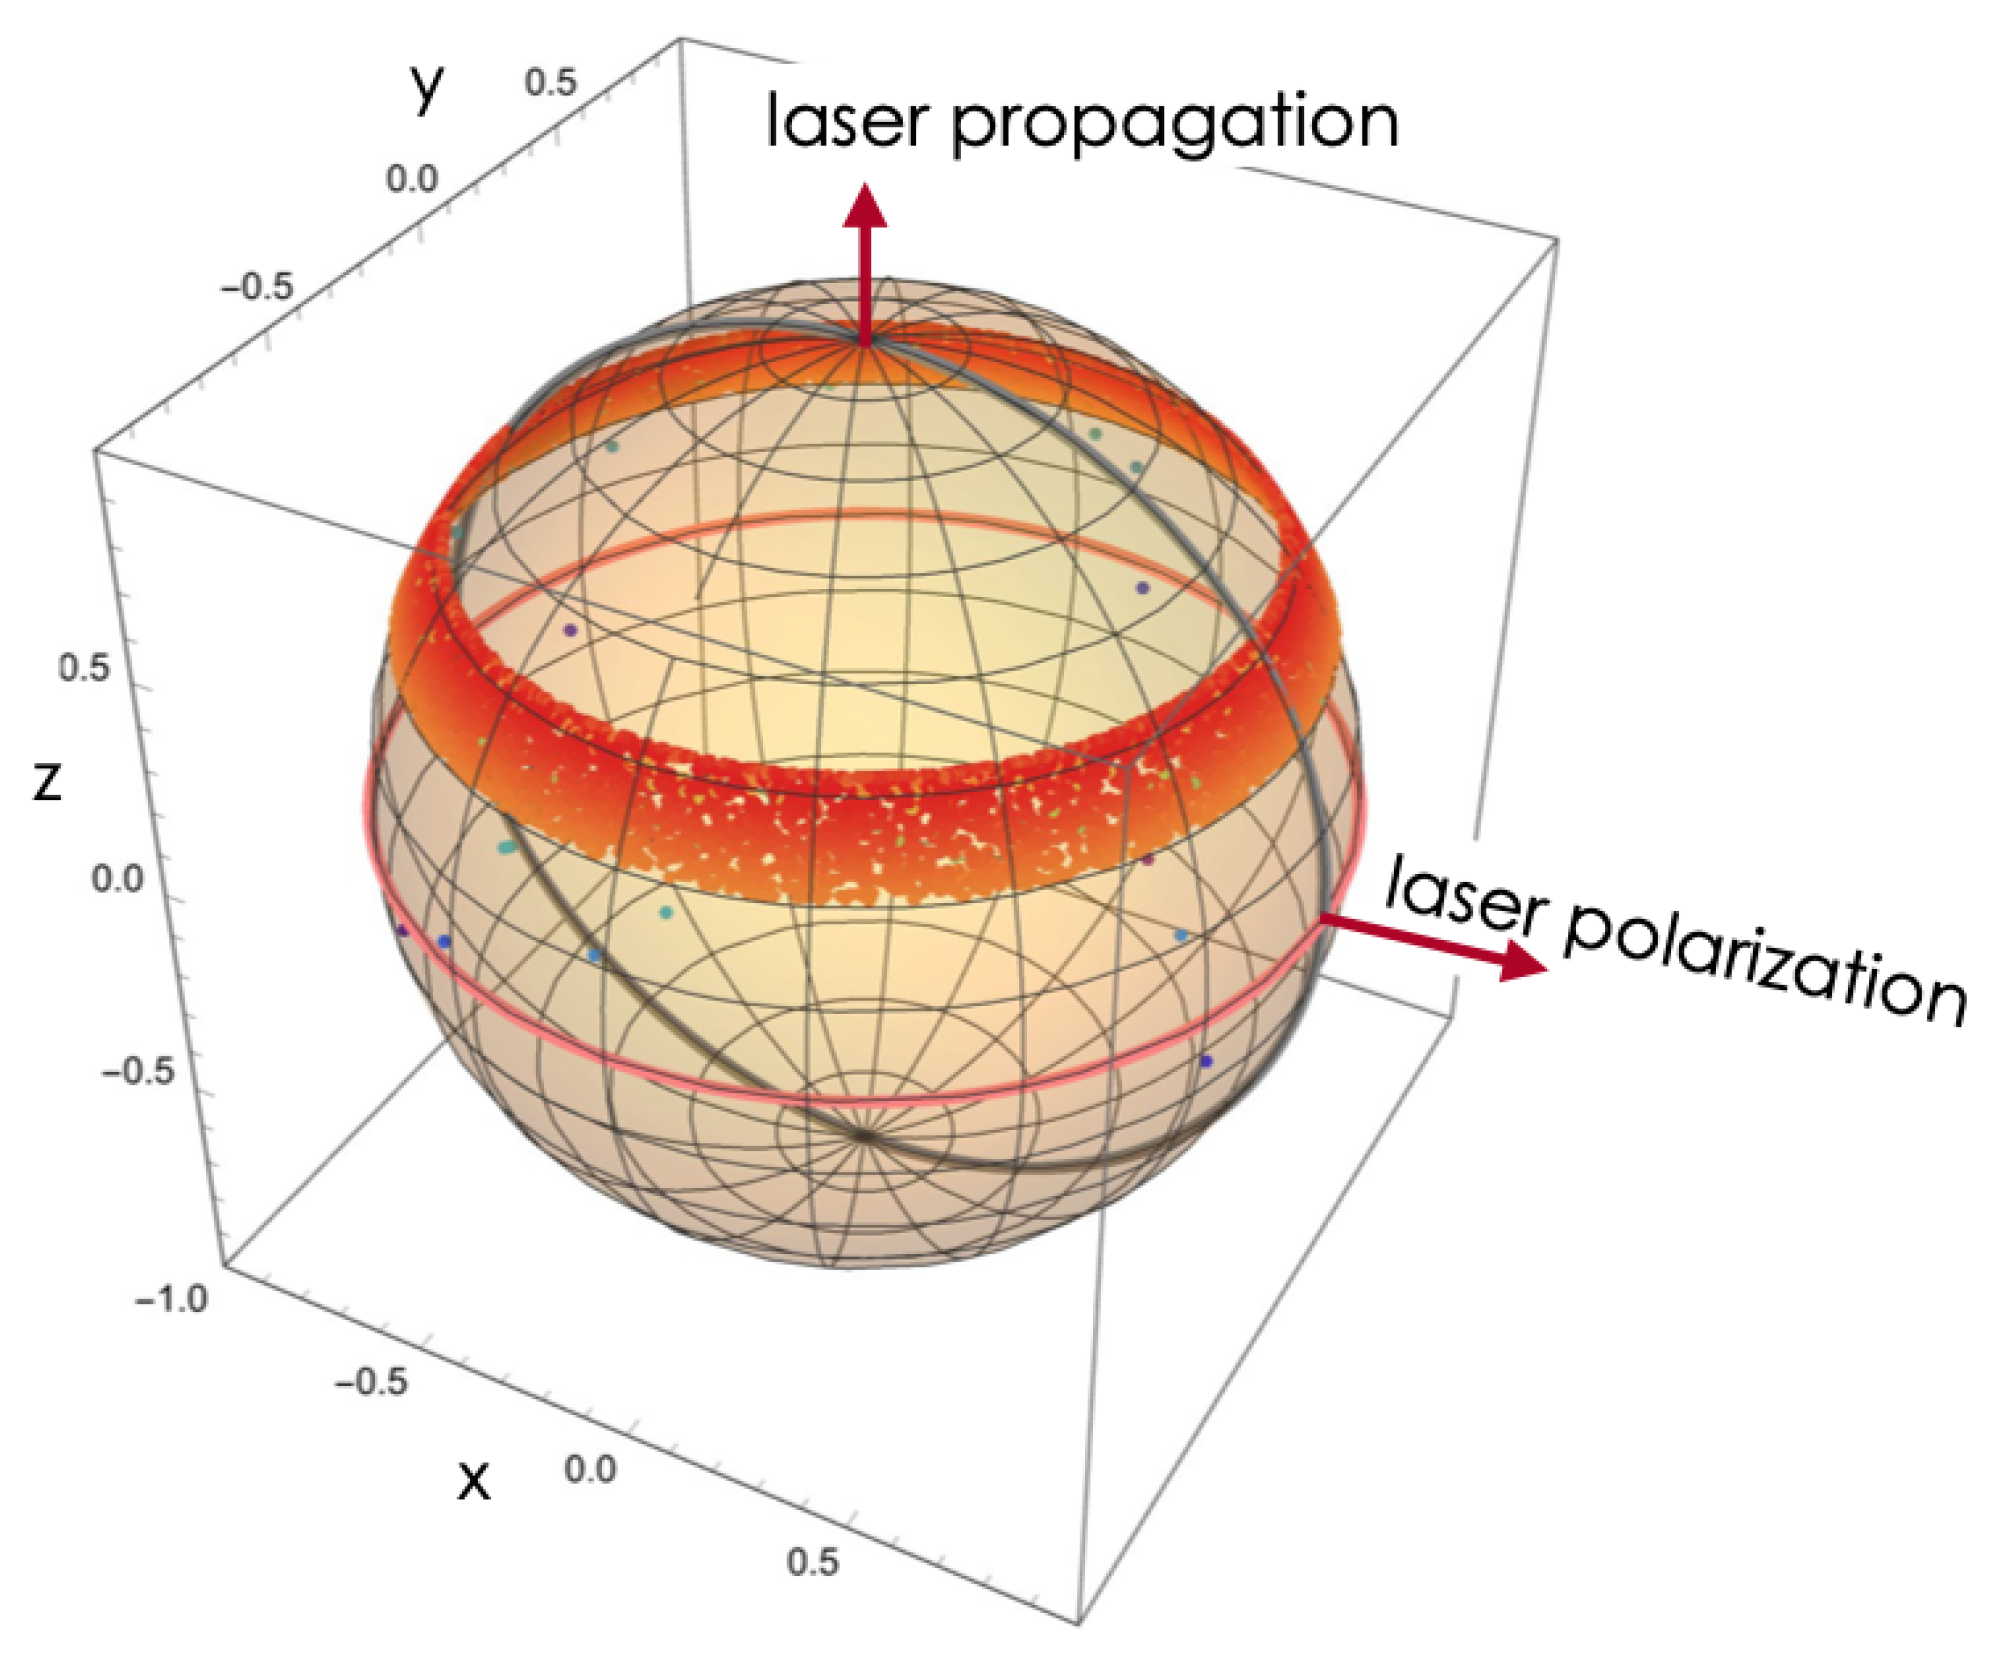
Figure 24 indicates the time evolution of the radiated field, showing the sub-cycle dynamics. Figure 25 summarizes the asymptotic distribution of momentum for this case study. The scattering process with the ultra-strong laser pulse is represented on the unit sphere in Figure 26. Each point on the sphere corresponds to the spherical angles of the asymptotic velocity/momentum. Considering the initial configuration of the electrons as counter-propagating to the laser (i.e., the initial velocity/momentum located at the south pole of the unit sphere), points over the equator circle indicate that the electron experiences a large deviation, making it partially co-propagating. Asymptotic energy is encoded in the color of the points.
To conclude this section, results are presented comparing TS spectra with and without RR for a scattering angle of θ s = 28 π / 128 . The differences in shape, amplitude, and balance between the two radiated quadratures are evident from Figure 27. Given that the proposed scattering angle is experimentally well suited for placing detecting equipment, we suggest such measurements as a quantitative test for RR phenomena and/or the laser pulse itself.

8. Summary and Conclusions

The continued increase in peak laser intensity over recent decades has enabled intensity values as high as 10 23 W/ cm 2 to be achieved, thus revealing a regime where electrons experience significant relativistic dynamics, with RR playing a crucial role. This paper focuses on the dynamics of pre-accelerated 1 GeV electrons moving in a counter-propagating direction to a near-infrared Ti:Sapphire ultra-fast ultra-intense laser pulse and on computing their trajectories under the combined effect of the standard Lorentz force and RR, modeled here using the Landau–Lifshitz–Hartemann equation.
We consider an eight-cycle Gaussian laser pulse in the TEM 00 mode propagating along the Z-axis, with a beam waist size of either 8 μ m or 4 μ m in the paraxial approximation, including the longitudinal E z and B z fields. This makes our modeled laser pulse quite realistic, going beyond a simplistic plane wave pulse, which lacks some essential features of real ultra-short pulsed lasers. Apart from describing the electron dynamics over two orders of magnitude in laser intensity, the paper extensively computes TS from samples of radiating electrons, and characterizes emissions at several scattering angles. This has allowed us to propose experimental tests that can discriminate and gauge, in a quantitative way, the importance of RR at such extreme intensities.
This work examines scenarios with varying laser intensities, from 10 21 W/ cm 2 to 10 23 W/ cm 2 , emphasizing the importance of RR in accurately describing electron behavior under extreme conditions. Our simulations show that RR significantly alters electron trajectories, reducing their kinetic energy and producing distinct radiation patterns. These patterns can be used to infer the dynamics of electrons and the intensity of the laser field. Hence, we propose TS as a promising tool for studying RR, and address the selection of experimental setups (scattering geometry and scattering angles) feasible with current technology to detect emissions from electrons under such conditions.
The results presented here clearly show that at extreme laser intensities, Thomson radiation patterns with and without RR are radically different, and this is established for a realistic and feasible interaction geometry of high-energy electrons (mono-energetic) counter-propagating with respect to the laser beam. In particular, the main differences found are that without RR, averaged TS spectra are nearly monochromatic, while the intensity ratio of the two orthogonal quadratures ( I x / I q 2 1000 ) indicates that the scattered radiation is nearly linearly polarized, while including RR makes averaged spectra very broad and unstructured, extending up to ω / ω 0 15 in the cases reported in the paper, and with a more balanced contribution of the two orthogonal quadratures at the detector. Perhaps even more important than this, the integrated power including RR can be several orders of magnitude larger than without it, as is apparent from Figure 14 and Figure 27. Many of the ingredients needed to test these predictions exist or can be combined in modern facilities featuring both accelerator and extreme laser technologies, so the experimental measurement of RR can be addressed in a clean experimental set-up. We think this is a necessary condition to move on to the characterization of more exotic phenomena, like cascades or pair production, to name a few.
Some trends are apparent on the pathway to extreme intensities, for instance, electron trajectories are significantly deflected as the intensity grows, and at the record intensity computed in this paper ( 10 23 W/ cm 2 ), the majority of them reverse their direction, from counter-propagating to partially co-propagating (meaning that the v z or p z component changes sign asymptotically). At record intensities, more than 98.5% of the electron’s energy can be lost through RR, and this clearly enhances the intensity of the TS radiation as compared to the case when RR is not included. Averaged TS spectra with RR tend to be rather broad, even for moderate scattering angles, especially at intensities larger than 5.0 × 10 22 W/ cm 2 . All these findings suggest that the TS spectra can serve as a tool to measure RR effects, offering experimental validation opportunities for different RR models under extreme conditions.
Future extensions of this work will focus on exploring higher laser intensities and more complex interaction geometries to further understand the effects of RR and other extreme field phenomena.

Author Contributions

Conceptualization, I.P., L.R. and R.F.Á.-E.; methodology, I.P., L.R., R.F.Á.-E. and F.C.; software, I.P. and L.R.; validation, I.P. and L.R.; formal analysis, R.F.Á.-E. and L.R.; investigation, I.P., L.R., R.F.Á.-E. and F.C.; writing—original draft preparation, I.P., L.R., R.F.Á.-E. and F.C.; writing—review and editing, I.P., L.R. and R.F.Á.-E. All authors have read and agreed to the published version of the manuscript.

Funding

This research received no external funding.

Institutional Review Board Statement

Not applicable.

Informed Consent Statement

Not applicable.

Data Availability Statement

Numerical data supporting this research can be obtained from the corresponding author upon reasonable request.

Acknowledgments

This work is partially supported by Ministerio de Ciencia, Innovación y Universidades (Spain), Agencia Estatal de Investigacion (AEI, Spain, 10.13039/501100011033) and the European Regional Development Fund (ERDF, A Way of making Europe) through Grant PID2022-136374NB-C21: R. F. A. E. is related to them. L. R. acknowledges support from Laserlab V (Grant Agreement No. 871124, European Union Horizon 2020 INFRAIA), from IMPULSE (Grant Agreement No. 871161, European Union Horizon 2020 INFRADEV), and from the Spanish Ministerio de Ciencia, Innovación y Universidades (Grant No. PID2022-140593NB-C22, FEDER funded). R. F. A.-E. and F. C. are associate members of Instituto de Biocomputación y Física de los Sistemas Complejos, Universidad de Zaragoza, Zaragoza, Spain.

Conflicts of Interest

The authors declare no conflicts of interest.

References

  1. Strickland, D.; Mourou, G. Compression of amplified chirped optical pulses. Opt. Commun. 1985, 56, 219. [Google Scholar] [CrossRef]
  2. Danson, C.N.; Haefner, C.; Bromage, J.; Butcher, T.; Chanteloup, J.-C.F.; Chowdhury, E.A.; Galvanauskas, A.; Gizzi, L.A.; Hein, J.; Hillier, D.I.; et al. Petawatt and exawatt class lasers worldwide. High Power Laser Sci. Eng. 2019, 7, e54. [Google Scholar] [CrossRef]
  3. Yoon, J.W.; Kim, Y.G.; Choi, I.W.; Sung, J.H.; Lee, H.W.; Lee, S.K.; Nam, C.H. Realization of laser intensity over 1023 W/cm2. Optica 2021, 8, 630. [Google Scholar] [CrossRef]
  4. Jones, E.C.; Andreula, Z.P.; Walker, B.C. Polarizability, Stark shifts, and field ionization of highly charged ions in ultraintense lasers. Phys. Rev. A 2023, 107, 033102. [Google Scholar] [CrossRef]
  5. Sarachik, E.S.; Schappert, G.T. Classical theory of the scattering of intense laser radiation by free electrons. Phys. Rev. D 1970, 1, 2738. [Google Scholar] [CrossRef]
  6. Di Piazza, A.; Müller, C.; Hatsagortsyan, K.Z.; Keitel, C.H. Extremely High- Intensity Laser Interactions with Fundamental Quantum Systems. Rev. Mod. Phys. 2012, 84, 1177. [Google Scholar] [CrossRef]
  7. Fedotov, A.; Ilderton, A.; Karbstein, F.; King, B.; Seipt, D.; Taya, H.; Torgrimsson, G. Advances in QED with intense background fields. Phys. Rep. 2023, 1010, 1–138. [Google Scholar]
  8. Tarbox, G.; Cunningham, E.; Sandberg, R.; Peatross, J.; Ware, M. Radiation from free electrons in a laser focus at 1018W/cm2: Modeling of photon yields and required focal conditions. J. Opt. Soc. Am. B 2015, 32, 743–750. [Google Scholar] [CrossRef]
  9. He, C.Z.; Longman, A.; Perez-Hernandez, J.A.; De Marco, M.; Salgado, C.; Zeraouli, G.; Gatti, G.; Roso, L.; Fedosejevs, R.; Hill, W.T. Towards an in situ, full-power gauge of the focal-volume intensity of petawatt-class lasers. Opt. Express 2019, 27, 30020–30030. [Google Scholar] [CrossRef]
  10. Esarey, E.; Sprangle, P.; Krall, J. Laser acceleration of electrons in vacuum. Phys. Rev. E 1995, 52.5, 5443. [Google Scholar] [CrossRef]
  11. Mourou, G.A.; Tajima, T.; Bulanov, S.V. Optics in the relativistic regime. Rev. Mod. Phys. 2006, 78, 309–371. [Google Scholar] [CrossRef]
  12. Erikson, W.L.; Singh, S. Polarization properties of Maxwell-Gaussian laser beams. Phys. Rev. E 1994, 49, 5778. [Google Scholar] [CrossRef]
  13. Breit, G.; Wheeler, J.A. Collision of Two Light Quanta. Phys. Rev. 1934, 46, 1087. [Google Scholar] [CrossRef]
  14. Reiss, H.R. Absorption of Light by Light. J. Math. Phys. 1962, 3, 59. [Google Scholar] [CrossRef]
  15. Alvarez-Estrada, R.F.; Pastor, I.; Roso, L.; Castejón, F. Classical relativistic electron-field dynamics: Hamiltonian approach to radiation reaction. J. Phys. Comm. 2023, 7, 12500. [Google Scholar] [CrossRef]
  16. Pastor, I.; Pastor, I.; Roso, L.; Castejón, F. Classical Scattering of High-Energy Electrons off Ultra-Intense Laser Beams Taking into Account Radiation Reaction. Photonics 2024, 11, 113. [Google Scholar] [CrossRef]
  17. Landau, L.D.; Lifshitz, E.M. The Classical Theory of Fields, 4th ed.; Pergamon Press: New York, NY, USA, 1975. [Google Scholar]
  18. Fulton, T.; Rohrlich, F. Classical radiation from a uniformly accelerated charge. Ann. Phys. 1960, 9, 499. [Google Scholar] [CrossRef]
  19. Rohrlich, F. The self-force and radiation reaction. Am. J. Phys. 2000, 68, 1109. [Google Scholar] [CrossRef]
  20. Rohrlich, F. The correct equation of motion of a classical point charge. Phys. Lett. A 2001, 283, 276. [Google Scholar] [CrossRef]
  21. Rohrlich, F. Classical Charged Particles, 3rd ed.; World Scientific: Singapore, 2007. [Google Scholar]
  22. Griffiths, D.J.; Szeto, E.W. Dumbbell model for the classical radiation reaction. Am. J. Phys. 1978, 46, 244–248. [Google Scholar] [CrossRef]
  23. Abbott, T.A.; Griffiths, D.J. Acceleration without radiation. Am. J. Phys. 1985, 53, 1203–1211. [Google Scholar] [CrossRef]
  24. Vranic, M.; Martins, J.L.; Vieira, J.; Fonseca, R.A.; Silva, L.O. All-optical radiation reaction at 1021 W/cm2. Phys. Rev. Lett. 2014, 113, 134801. [Google Scholar] [CrossRef]
  25. Thomas, A.G.R.; Ridgers, C.P.; Bulanov, S.S.; Griffin, B.J.; Mangles, S.P.D. Strong radiation-damping effects in a gamma-ray source generated by the interaction of a high-intensity laser with a wakefield-accelerated electron beam. Phys. Rev. X 2012, 2, 041004. [Google Scholar] [CrossRef]
  26. Vranic, M.; Grismayer, T.; Fonseca, R.A.; Silva, L.O. Quantum radiation reaction in head-on laser-electron beam interaction. New J. Phys. 2016, 18, 073035. [Google Scholar] [CrossRef]
  27. Gonoskov, A.; Blackburn, T.G.; Marklund, M.; Bulanov, S.S. Charged particle motion and radiation in strong electromagnetic fields. Rev. Mod. Phys. 2022, 94, 045001. [Google Scholar] [CrossRef]
  28. Poder, K.; Tamburini, M.; Sarri, G.; Di Piazza, A.; Kuschel, S.; Baird, C.D.; Behm, K.; Bohlen, S.; Cole, J.M.; Corvan, D.J.; et al. Experimental signatures of the quantum nature of radiation reaction in the field of an ultraintense laser. Phys. Rev. X 2018, 8, 031004. [Google Scholar] [CrossRef]
  29. Peatross, J.; Berrondo, M.; Smith, D.; Ware, M. Vector fields in a tight laser focus: Comparison of models. Optics Express 2017, 25, 13990–14007. [Google Scholar] [CrossRef]
  30. Tschentscher, T.; Bressler, C.; Grunert, J.; Madsen, A.; Mancuso, A.P.; Meyer, M.; Scherz, A.; Sinn, H.; Zastrau, U. Photon beam transport and scientific instruments at the European XFEL. Appl. Sci. 2017, 7, 592. [Google Scholar] [CrossRef]
  31. Bamber, C.; Boege, S.J.; Koffas, T.; Kotseroglou, T.; Melissinos, A.C.; Meyerhofer, D.D.; Reis, D.A.; Ragg, W.; Bula, C.; McDonald, K.T.; et al. Studies of nonlinear QED in collisions of 46.6 GeV electrons with intense laser pulses. Phys. Rev. D 1999, 60, 092004. [Google Scholar] [CrossRef]
  32. Mishra, S.K.; Sengupta, S. Exact solution of Hartemann–Luhmann equation of motion for a charged particle interacting with an intense electromagnetic wave/pulse. Eur. Phys. J. Spec. Top. 2021, 230, 4165–4174. [Google Scholar] [CrossRef]
  33. Plaja, L.; Roso, L.; Rzazewski, K.; Lewenstein, M. Generation of attosecond pulse trains during the reflection of a very intense laser on a solid surface. JOSA B 1998, 15, 1904–1911. [Google Scholar] [CrossRef]
  34. Von der Linde, D. Generation of high order optical harmonics from solid surfaces. Appl Phys. B Lasers Opt. 1999, 68, 315–319. [Google Scholar] [CrossRef]
  35. Rzazewski, K.; Plaja, L.; Roso, L.; von der Linde, D. Probe-field reflection on a plasma surface driven by a strong electromagnetic field. J. Phys. B Atomic Mol. Opt. Phys. 2000, 33, 2549–2558. [Google Scholar] [CrossRef]
Figure 1. Schematic representation of the studied process. Initially, the laser and the electron bunch are counter-propagating. The laser moves towards the positive Z-axis, and the electron bunch moves initially in the opposite direction. The upper figure shows the initial position with the electron bunch centered at z 00 = 0 and the laser pulse peak at z = 24 λ 0 (19.2 μ m ). Neglecting the interaction before this point is a reasonable assumption. Since the electron’s initial speed is very close to c, the electron would cross the laser pulse close to z = 12 λ 0 . However, for extreme intensities, as we will describe, the trajectory of the electrons will be significantly modified.
Photonics 11 00971 g001
Figure 2. Schematic representation of the TS radiation pattern. Electrons driven exclusively by the laser polarization radiate mainly in the YZ plane (a). However, electrons driven by the laser magnetic field radiate mostly in the XY plane (b). Comparing Thomson radiation along these two planes provides relevant information on RR-induced dynamics. The YZ pattern, driven by the laser electric field, corresponds to even harmonics of the fundamental frequency. The XY radiation, due to coupling with the laser magnetic field, also shows strong even harmonics. Relativistic distortion of these donut shapes is not depicted for simplicity.
Photonics 11 00971 g002
Figure 3. Spectral location of the Thomson scattered main peak (i.e., ω norm = ω peak / ω 0 ), X-polarization, spectra averaged for an electron sample aimed at the central part of the TEM 00 laser pulse, including RR, as a function of θ s . Scattering is computed in the YZ plane. Notice the extremely fast increase in the (blue-shifted) peak frequency with the scattering angle as the angle approaches π (this corresponds to light scattered counter-propagating with respect to the laser).
Photonics 11 00971 g003
Figure 4. Integrated spectral power, X-polarization in red and the other orthogonal quadrature in blue, averaged for an electron sample aimed at the central part of the TEM 00 laser pulse, including RR, as a function of the scattering angle. Scattering plane is YZ. Notice that for a scattering angle of π / 2 , the light is nearly completely polarized along the X-axis, and notice how the two orthogonal contributions become more balanced as the scattering angle approaches π .
Photonics 11 00971 g004
Figure 5. Schematic representation of the angles where the TS spectra have been calculated. Labels (ai) refer to the directions of observation of the spectra shown in the next figure.
Photonics 11 00971 g005
Figure 6. Averaged TS spectra including RR for several scattering angles in the YZ plane; see main text for details. (ai) Scattering angles are, respectively, 64 π / 128 , 72 π / 128 , 80 π / 128 , 88 π / 128 , 96 π / 128 , 104 π / 128 , 120 π / 128 , 126 π / 128 , and 127 π / 128 . Observe that the last one, (i), corresponds to scattering almost perfectly counter-propagating to the laser pulse. The colors red and blue are the same as in the previous figure, with quadrature q 1 in red (polarization along the electric field) and quadrature q 2 in blue.
Photonics 11 00971 g006
Figure 7. Projection of a sample trajectory onto the XZ plane, including RR. The electron is initially located at z = 0 , moves from right to left, strongly interacts with the laser pulse around z / λ 0 = 12 , and gets deflected, eventually becoming a free electron. The center of the laser pulse was initially at z / λ 0 = 24 and propagates from left to right along the Z axis.
Photonics 11 00971 g007
Figure 8. Time evolution of the relativistic γ factor (a) and the normalized velocity (b) for the sample trajectory in Figure 7. The significant reduction in the γ factor (i.e., the electron energy) due to RR is evident, along with substantial perturbations in v x and v z . Color code in (b): red, green, and blue correspond to v x / c , v y / c , and v z / c , respectively.
Photonics 11 00971 g008
Figure 9. Radiated electric field at the detector in the time domain (a) and a close-up (b) displaying the spike structure under the radiated pulse envelope. The scattering plane is YZ. The electric field component parallel to the X axis is shown in red, while the other component is in blue. In (b), the component along the scattering vector is also displayed in green and is negligible compared to the other components.
Photonics 11 00971 g009
Figure 10. Asymptotic momentum components for counter-propagating 1 GeV electrons, including RR. (ac) correspond respectively to the asymptotic distributions of p x / m c , p y / m c and p z / m c . The sample contains 4096 electrons randomly distributed up to ρ 0 = 0.25 w 0 , with w 0 = 4   μ m . The laser is in the TEM 00 mode, X polarized, with a peak intensity of 5 × 10 22 W / cm 2 .
Photonics 11 00971 g010
Figure 11. Asymptotic kinetic energy for counter-propagating 1 GeV electrons with RR. The sample includes 4096 electrons randomly distributed up to ρ 0 = 0.25 × w 0 , with w 0 = 4   μ m . The laser is in the TEM 00 mode, X polarized, with a peak intensity of 5 × 10 22 W / cm 2 . A strong reduction in kinetic energy is predicted under these conditions with RR. Contour plots of iso-energy show an approximate circular symmetry around the laser propagation axis.
Photonics 11 00971 g011
Figure 12. Integrated spectral power: X-polarization in red and the orthogonal quadrature (q2) in blue, averaged over electron samples (typically 2048 or 4096 at each scattering angle) aimed at the central part of the TEM 00 laser pulse, including RR, as a function of the scattering angle. The scattering plane is YZ. Notice the rapid increase in integrated power with the scattering angle.
Photonics 11 00971 g012
Figure 13. Averaged TS spectra. The scattering plane is YZ. Scattering angles for (ai) are respectively 64 π / 128 , 68 π / 128 , 72 π / 128 , 76 π / 128 , 80 π / 128 , 84 π / 128 , 88 π / 128 , 92 π / 128 , and 96 π / 128 . A spectrum extending up to ω / ω 0 3000 is obtained for θ s = 96 π / 128 .
Photonics 11 00971 g013
Figure 14. Comparison of TS spectra (X-quadrature in red, q2-quadrature in blue) with (a) and without (b) RR. The scattering angle is 72 π / 128 . The shape, amplitude, and power ratio of the two quadratures are altered by RR, which can help distinguish and detect RR signatures in the spectra. See more details in the main text.
Photonics 11 00971 g014
Figure 15. Projection of a sample trajectory onto the X-Z plane, including RR. The electron, initially at z / λ 0 = 0 , moves from right to left, interacts strongly with the laser pulse around z / λ 0 = 11 , and is deflected nearly 45 from its initial direction. Note the reversal in electron motion after deceleration (curly part moving towards the positive side of the z-axis).
Photonics 11 00971 g015
Figure 16. Time evolution of the relativistic γ factor (a) and normalized velocity (b) for the trajectory shown in Figure 15. The strong reduction in γ due to RR is evident, along with substantial perturbations in v x and v z , and to a lesser extent in v y . Note that v z reverses from counter-propagating to co-propagating at various points in the trajectory. In (b), the color code is as follows: red, green, and blue represent v x / c , v y / c , and v z / c , respectively.
Photonics 11 00971 g016
Figure 17. Radiated electric field at the detector in the time domain (a) and a close-up view (b) showing the structure of spikes under the radiated pulse envelope. The scattering plane is Y-Z. The electric field component parallel to the X-axis is shown in red, while the other component is shown in blue. In (b), the component along the scattering vector is also displayed (in green), which is negligible compared to the other components.
Photonics 11 00971 g017
Figure 18. Three-dimensional asymptotic distributions of p x / m c (a), p y / m c (b), and p z / m c (c) as functions of the initial transverse position of the electrons. The panels show 4096 sample electrons, uniformly and randomly distributed up to ρ 0 = 0.25 w 0 .
Photonics 11 00971 g018
Figure 19. Asymptotic distribution of E kin projected onto the X-axis. The panel includes 4096 sample electrons, uniformly and randomly distributed up to ρ 0 = 0.25 × w 0 . RR accounts for up to 98.5% loss of the initial kinetic energy for electrons near the center of the TEM 00 mode laser axis.
Photonics 11 00971 g019
Figure 20. Averaged TS spectra. The scattering plane is YZ, and scattering angles for (ai) are, respectively, 48 π / 128 , 56 π / 128 , 60 π / 128 , 64 π / 128 , 68 π / 128 , 72 π / 128 , 76 π / 128 , 80 π / 128 , and 96 π / 128 . An extremely broad spectrum, extending well beyond ω / ω 0 15 , 000 , is obtained for θ s = 96 π / 128 .
Photonics 11 00971 g020
Figure 21. Visualization of the scattering process on a unit momentum sphere. Each point on the sphere’s surface represents the asymptotic direction of electron scattering; dot colors indicate asymptotic energy, with dark blue representing minimum and red representing maximum energy.
Photonics 11 00971 g021
Figure 22. Projection of a sample trajectory onto the XZ plane, including RR. The electron is initially located at z / λ 0 = 0 , moves from right to left, strongly interacts with the laser pulse around z / λ 0 = 10.5 , and is deflected at an angle larger than 90 with respect to its initial direction. The v z (or p z ) component changes from counter-propagating to co-propagating. The thick gray line indicates the initial position of the electron bunch. For this extreme intensity, the electron trajectory is reversed.
Photonics 11 00971 g022
Figure 23. Time evolution of the relativistic γ factor (a) and of the normalized velocity (b) for the sample trajectory in Figure 22. The strong reduction in γ due to RR is apparent, as well as the large perturbations on v x and v z , and also to some extent on v y . Note that v z asymptotically reverses from counter-propagating to co-propagating. Color code in (b) is red, green, and blue corresponding to v x / c , v y / c , and v z / c , respectively.
Photonics 11 00971 g023
Figure 24. Radiated electric field at the detector in the time domain (a) and a close-up (b) displaying the structure of the spikes under the radiated pulse envelope. The scattering plane is YZ. The electric field component parallel to the X axis is displayed in red, the other one in blue. In (b), the component along the scattering vector is also displayed (in green), showing it to be negligible compared to the other components. Note the highly asymmetric shape of the electric pulse envelope in this particular case.
Photonics 11 00971 g024
Figure 25. Three-dimensional asymptotic normalized momentum components for counter-propagating 1 GeV electrons. (ac) correspond respectively to the asymptotic distributions of p x / m c , p y / m c and p z / m c . The sample includes 4096 electrons randomly distributed up to ρ 0 = 0.25 × w 0 , where w 0 is 4 μ m. The laser is in the TEM 00 mode, X polarized, with a peak intensity of 10 23 W / cm 2 . Close to the center of the laser TEM 00 mode, RR accounts for up to 99 percent energy loss.
Photonics 11 00971 g025
Figure 26. Asymptotic velocity distribution (final velocity of the electrons) depicted over the unit sphere. The pink circle is the equator of the unit sphere and the gray circle crosses the unit sphere poles. The value of the final velocity is given by the color scale. The orange dotted ribbon indicates the multiple trajectories with asymptotic speeds that have been reversed, i.e., points towards the positive values of z.
Photonics 11 00971 g026
Figure 27. A comparison of TS spectra (X-quadrature in red, q2-quadrature in blue) with (a) and without (b) RR. The scattering angle is 28 π / 128 in this case. The shape, amplitude, and power ratio of the two quadratures are altered by RR, which can help distinguish and detect RR signatures in the spectra. See more details in the main text.
Photonics 11 00971 g027
Disclaimer/Publisher’s Note: The statements, opinions and data contained in all publications are solely those of the individual author(s) and contributor(s) and not of MDPI and/or the editor(s). MDPI and/or the editor(s) disclaim responsibility for any injury to people or property resulting from any ideas, methods, instructions or products referred to in the content.