1. Introduction
Strain monitoring is an essential technique for evaluating structural health and ensuring safety, and is widely utilized in civil engineering, aerospace, and heavy industries [
1]. Strain is typically classified into elastic, plastic, and thermal types based on its characteristics [
2]. Elastic strain testing is especially prevalent, as it plays a key role in maintaining structural safety during normal operations. Depending on the direction of deformation, strain can be further categorized into axial strain [
3], shear strain [
4], and bending strain [
5]. To accurately monitor these different types of strain, commonly used methods include mechanical, capacitive, optical fiber, and vibrating wire sensors [
6]. Among these, optical fiber sensors have emerged as the preferred method due to their high sensitivity and immunity to electromagnetic interference, particularly in long-distance or complex environmental applications.
Optical fiber strain sensors can be broadly categorized into distributed, quasi-distributed, and point-based measurements based on their principles, methods, and application areas. Distributed sensing, such as Brillouin optical timedomain analysis (BOTDA) [
7,
8] and Brillouin optical frequency domain analysis (BOFDA) [
9], is well-suited for long-range strain distribution measurements but typically suffers from lower measurement accuracy. Additionally, the large and complex sensor networks required for distributed systems limit their use in small-scale, precision measurements. Quasi-distributed fiber optic strain sensors offer higher measurement accuracy and sensitivity, making them ideal for precise monitoring at critical points. These systems are less complex, easier to manage, and allow flexible customization of measurement points, providing targeted monitoring solutions. Most applications use robust, passive devices, like fiber Bragg grating (FBG) sensors, as individual measurement points. For instance, Nicolas [
10] arranged seven FBGs into a grid embedded in a smart rubber mat for quasi-distributed strain sensing, demonstrating consistent response across all points, with an average sensitivity of 80 N/nm. Zhu [
11] proposed a quasi-distributed sensing system based on microwave photonic interferometry and the Vernier effect, achieving a strain sensitivity of up to 94 MHz/µε using incoherent microwave photonics (MWP) and virtual interferometry. While quasi-distributed sensors can enhance performance across larger monitoring areas by incorporating novel signal demodulation techniques, their system complexity and limitations in sensor element design often result in a lower sensitivity compared with point-based sensors. Furthermore, the sophisticated demodulation equipment increases the sensing system’s cost and maintenance difficulty. Point-based sensors are ideal for high-precision, micro-scale strain measurements, offering diverse measurement methods due to the variety of inherent structures.
Optical fiber sensors based on optical interference utilize various demodulation techniques, including phase demodulation [
12,
13,
14], wavelength demodulation [
15,
16,
17,
18,
19], frequency demodulation [
20], intensity demodulation [
21,
22,
23], and delay line demodulation [
24,
25,
26]. Phase and wavelength demodulation are the most common in point-based fiber optic sensing. Phase demodulation detects strain by observing phase shifts in the light wave’s propagation path within the fiber, providing high sensitivity and responsiveness. For example, a Fabry–Perot interferometer (FPI) sensor [
12], integrated into a microwave photonic-assisted single radio frequency bandpass filter, has achieved a sensitivity of up to 0.00217 rad/µε in both dynamic and static strain measurements. Wavelength demodulation is widely used in point-based strain sensing for its direct correlation with physical changes. Research has progressed from single-point sensors to more integrated systems. A dual-wavelength erbium-doped fiber laser (EDFL) strain sensing system [
16], combining a long-period fiber grating (LPFG) with a Sagnac loop filter, has demonstrated a sensitivity of 8.33 pm/με. Additionally, Zhao [
18] designed a sensitivity-enhanced strain sensor based on shape-modulated multimode fiber (MMF), with a response of up to 55.63 pm/µε, leveraging the effective excitation of multimode light fields for higher sensing sensitivity. In contrast, fiber sensors using frequency and delay line demodulation are less commonly studied due to the complexity of their optical systems and their sensitivity to environmental factors, which can affect measurement accuracy. On the other hand, fiber optic strain sensors based on intensity modulation havebecome popular in recent years because of their fast demodulation speed and simplicity. Both single components [
21] and complex systems [
23] have demonstrated the superior detection capabilities of intensity-based sensors. When combined with advanced optical signal processing algorithms, their performance is further enhanced. For instance, Xie [
22] developed an FBG sensing system using a microwave photonic filter (MPF) and an optical filter (OF) to break periodicity limitations, successfully extending the measurement range while maintaining high precision and achieving adjustable sensitivity. This approach has proven effective in both static and dynamic strain measurements, marking a new direction in point-based strain sensing.
This paper presents the design of an intensity-modulated strain-sensitive dual concave cone fiber optic device. A special arc fusion technique between single-mode fiber (SMF) and polarization-maintaining fiber (PMF) creates a refractive index modulation zone in the cone region, enabling secondary control of the transmitted optical field. The dual ball-shaped tunable zone (DBT) structure, validated through polarization mode interference coupling theory and parametric testing, exhibits balanced spectral distribution and enhanced intensity-based sensing capabilities. In cantilever beam strain tests, the DBT device demonstrated linearity (R² = 0.99) and high sensitivity, with strain sensitivities of 0.049 dB/με and 0.023 dB/με for x- and y-polarization, respectively, over a 0~244.33 με range. Additionally, a temperature-compensated intensity difference and ratio method effectively mitigates the impact of light source fluctuations, achieving high-precision strain measurements with an error of ~± 6 με. This DBT fiber device, combined with a novel demodulation method, shows strong potential for high-precision, stable applications andoffers new insights for developing advanced point-based fiber optic sensing technologies.
2. Principle and Simulation
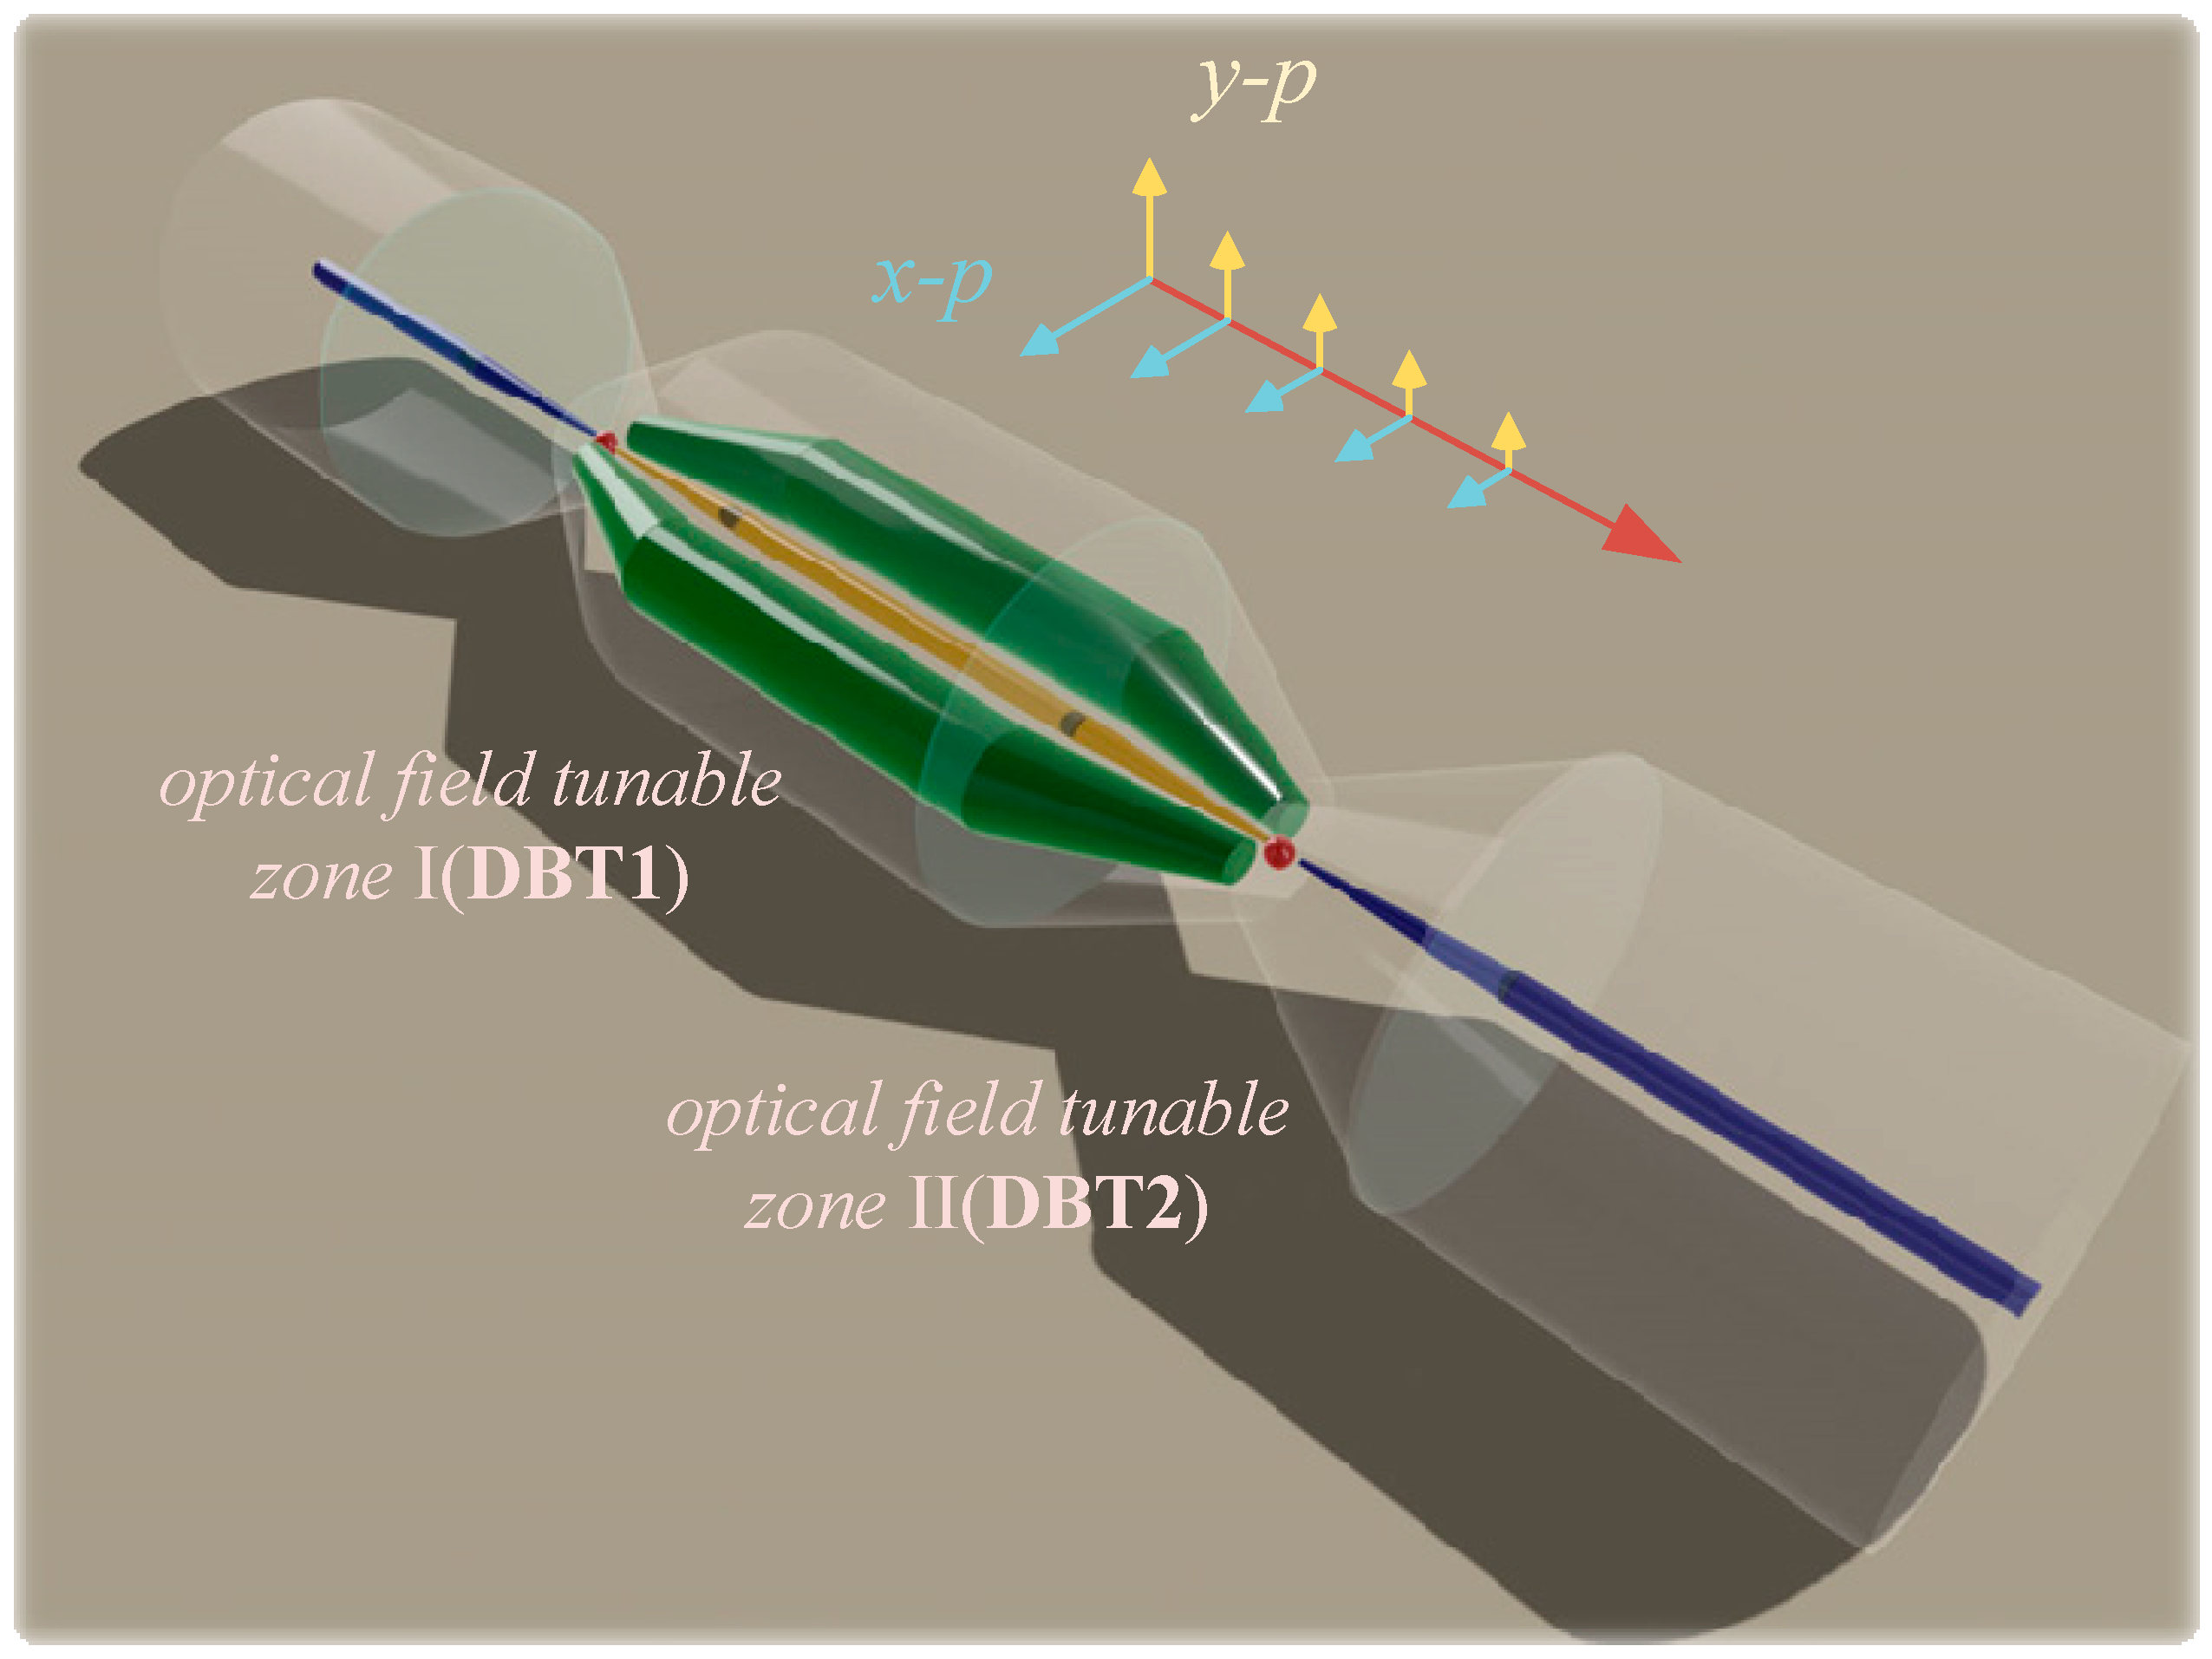
The intrinsic structure of the DBT, as depicted in
Figure 1, consists of two segments of SMF and one segment of PMF (The corresponding effective interference length is recorded as
LPMF), cascaded via tapered fusion splicing. Notably, the use of PMF helps ensure stable mode polarization transmission during cantilever beam bending strain tests. Functionally, the structure adheres to the principles of inline Mach–Zehnder interference (MZI), integrating a mode excitation region, a mode coupling region, and an effective mode transmission region. The PMF primarily handles mode transmission, while the DBT regions, resembling a double-up-taper (DT) structure, serve as the mode excitation and coupling zones. Unlike the DT, the DBT introduces a uniform, spherical-like refractive index region in the middle, formed through non-uniform discharge stacking of silica, enabling secondary coupling and modulation of the light field distribution. When polarized light enters the first BT region, the tapered fiber section causes some of the transmitted light power to leak from the core into the cladding. However, the geometric modulation region in the taper further redistributes this power within the cladding, achieving a secondary light field distribution. During propagation, core and cladding modes travel along the waveguide in the x and y orthogonal polarization directions. The random power transfer between adjacent modes introduces uncertainties in spectral monitoring. The polarization-maintaining ability of the PMF helps mitigate these uncertainties by reducing polarization coupling crosstalk during transmission, thereby enhancing the accuracy of interferometric spectral measurements. As the light passes through the second BT region, multiple polarized light modes are coupled through the spherical-like modulation area. The difference in optical path length between cladding modes and the core fundamental mode introduces a phase difference, leading to mode interference when the matching conditions are met. Additionally, by quantitatively adjusting the geometric characteristics of the modulation region, the coupling and interference between fiber modes can be controlled, optimizing the quality of the interferometric spectrum. Based on the theory of two-beam interference, the optical intensity at the output end of the fiber can be expressed as follows [
27]:
In the equation,
Ii represents the initial intensity of the incident light;
κ1 and
κ2 are the splitting and coupling coefficients of the two tapers, respectively;
c denotes the secondary splitting and coupling coefficient in the spherical modulation region; and
nco and
ncl represent the effective refractive index of the core and cladding modes, respectively. For polarized incident light, the resonant dips corresponding with the orthogonal polarization modes (i.e., x-mode and y-mode) can be expressed as follows:
When the structure is subjected to strain (
ε), the intermodal phase difference changes (denoted as ∆
ϕm) accordingly and can be expressed as follows [
28]:
Among these, the photo elastic coefficient of the core (
γ1) and cladding (
γ2) can be expressed as follows:
When the external temperature changes, the refractive index, length, and diameter of the optical fiber also change, leading to a phase shift that can be expressed as follows:
where
α is the thermal expansion coefficient of the optical fiber and
ξ is the thermal optic coefficient of the fiber mode. The analysis of the above equations indicates that the core factors affecting strain and temperature sensitivity are the fiber’s coupling splitting ratio and the types of modes involved in fiber mode interference. These factors can be directly controlled by adjusting the taper structure and optimizing the BT geometric parameters. For intensity-modulated inline MZIs, the extinction ratio (
ER) directly impacts the sensitivity of optical intensity sensing. As indicated by Equation (7), the critical factors influencing
ER include
κ1,
κ2, transmission loss α(
d), and coupling efficiency c within the modulation region [
29]. With the taper parameters fixed,
κ1,
κ2, and α(
d) remain constant, making
c the key adjustable parameter for optimizing the sensitivity of the intensity-modulated sensing unit to strain, temperature, and other sensing parameters. Additionally, an ideal dual-mode interference spectrum should exhibit a uniform comb-like distribution, which helps prevent nonlinear instabilities in the sensing response due to mode distortion. This scheme serves as the basis for our detailed discussion in subsequent quantitative studies.
The optical field distribution of the two tapered structures obtained through beam propagation method (BPM) simulation is shown in
Figure 2. The simulation parameters are listed in
Table 1. A free-space light source with a wavelength of 1550 nm serves as the incident light source. The cladding/core diameters of the single-mode fiber are 125 µm/8.3 µm, with cladding/core refractive index of 1.4681/1.4521, respectively. The lengths of the DT and DBT tapered regions are set at 380 µm, with a minimum waist diameter of 50 µm. For the DBT structure, the semi-spherical modulation region in the middle has both major and minor axis diameters (
a and
b) set at 20 µm.
Figure 2a shows the distribution of optical field power in the tapered region of the DT structure. Some core power diffuses into the cladding, resulting in a significant decrease in core power. In
Figure 2b, the DBT structure demonstrates that, while core power also diffuses into the cladding, the central spherical modulation region enables secondary coupling and redistribution of the transmitted optical power. At the taper’s narrowest point, this energy convergence redistributes optical power between the core and cladding, partially achieving mode selection within the fiber.
Figure 2c compares the mode distribution in the tapered region of the DT and DBT structures. The vertical axis represents mode purity, while the horizontal axis categorizes the fiber modes. The comparison shows that both structures excite multiple fiber modes in the tapered region, but that their mode purities differ. In the DBT structure, the purity difference between the LP
01 and LP
11 modes is smaller than in the DT structure, with these modes having the highest purity. Generally, higher mode purity indicates a stronger excitation of the fiber mode. Under the prerequisite of satisfying phase-matching conditions, two or more fiber modes with higher mode purity will exhibit stronger coupling and interference effects. Our comparison revealed that both the DT and DBT structures excite multiple fiber modes in the tapered region, but that their mode purities differ. In the DBT structure, the mode purity difference between LP
01 (approximately 0.4) and LP
11 (also approximately 0.3) is smaller compared with the DT structure, resulting in stronger interference between the LP
01 and LP
11 modes in the DBT structure, similar to the ideal two-mode interference discussed earlier. For other fiber modes, the lower mode purity means they do not exhibit significant coupling interference with the LP
01 mode. Additionally, the proportion of the purity of other fiber modes in the DBT structure is lower than in the DT structure. Compared with the DT structure, this reduces the modulation effect of other modes on the stable interference between the LP
01 and LP
11 modes, facilitating better linear response and sensing stability in subsequent strain sensing tests. The shape of the quasi-spherical modulation region within the taper affects the purity of various modes, as shown in
Figure 2d. The modulation region’s ellipticity, represented by the ratio a/b, serves as a parameter by which to analyze how mode purity changes as the modulation region transitions from a prolate to an oblate shape. The analysis shows the following:
a. The purity of the fundamental mode LP01, located in the fiber core, increases with increasing ellipticity, while the purities of higher-order modes (LP02, LP12, LP21, LP31) decrease. This occurs because, as the modulation region becomes more elongated, the LP01 mode maintains stable transmission within the core, while some of the power in the cladding near the core gradually couples into the fine core due to the tapering effect, facilitating core–cladding power interaction. As a result, the mode purity of LP01 increases. In contrast, higher-order modes, which occupy the cladding region, experience a decrease in purity due to complex coupling effects and changes in mode field distribution. The mode purity of LP11 initially increases with rising ellipticity, reaching its peak when the modulation region’s ellipticity is 1 (i.e., when the geometry is spherical). However, as the ellipticity continues to increase, the mode purity gradually decreases. This occurs because the LP11 mode is distributed around the fiber core, and, as the modulation region becomes more elongated (with ellipticity increasing from 0 to 1), part of the cladding modes further from the core gradually couple into the core, enhancing the power distribution of the LP11 mode and increasing its purity. However, with further increases in ellipticity (as it transitions from 1 to 2), the principle of power conservation suggests that the LP11 and LP01 modes enter an over-coupling regime. As a result, part of the LP11 mode’s power is gradually transferred to the LP01 mode, which then stabilizes and transmits within the core. This process causes the purity of the LP11 mode to decrease while the LP01 mode’s purity continues to increase.
b. When the modulation region’s geometric ellipticity is close to 1 (spherical shape), LP11 and LP01 modes show the highest purity, with LP01 being particularly concentrated in this symmetric structure. Higher-order modes, however, maintain low purity due to the significant interference from taper shape changes and mode coupling. Under these conditions, the coupling and interference effects between LP01 and LP11 are more pronounced, similar to dual-mode interference. The minimal difference in their mode purities also contributes to higher spectral quality, making it more suitable for precise monitoring and sensing.
3. Structural Fabrication and Characterization
3.1. Structure Fabrication Process
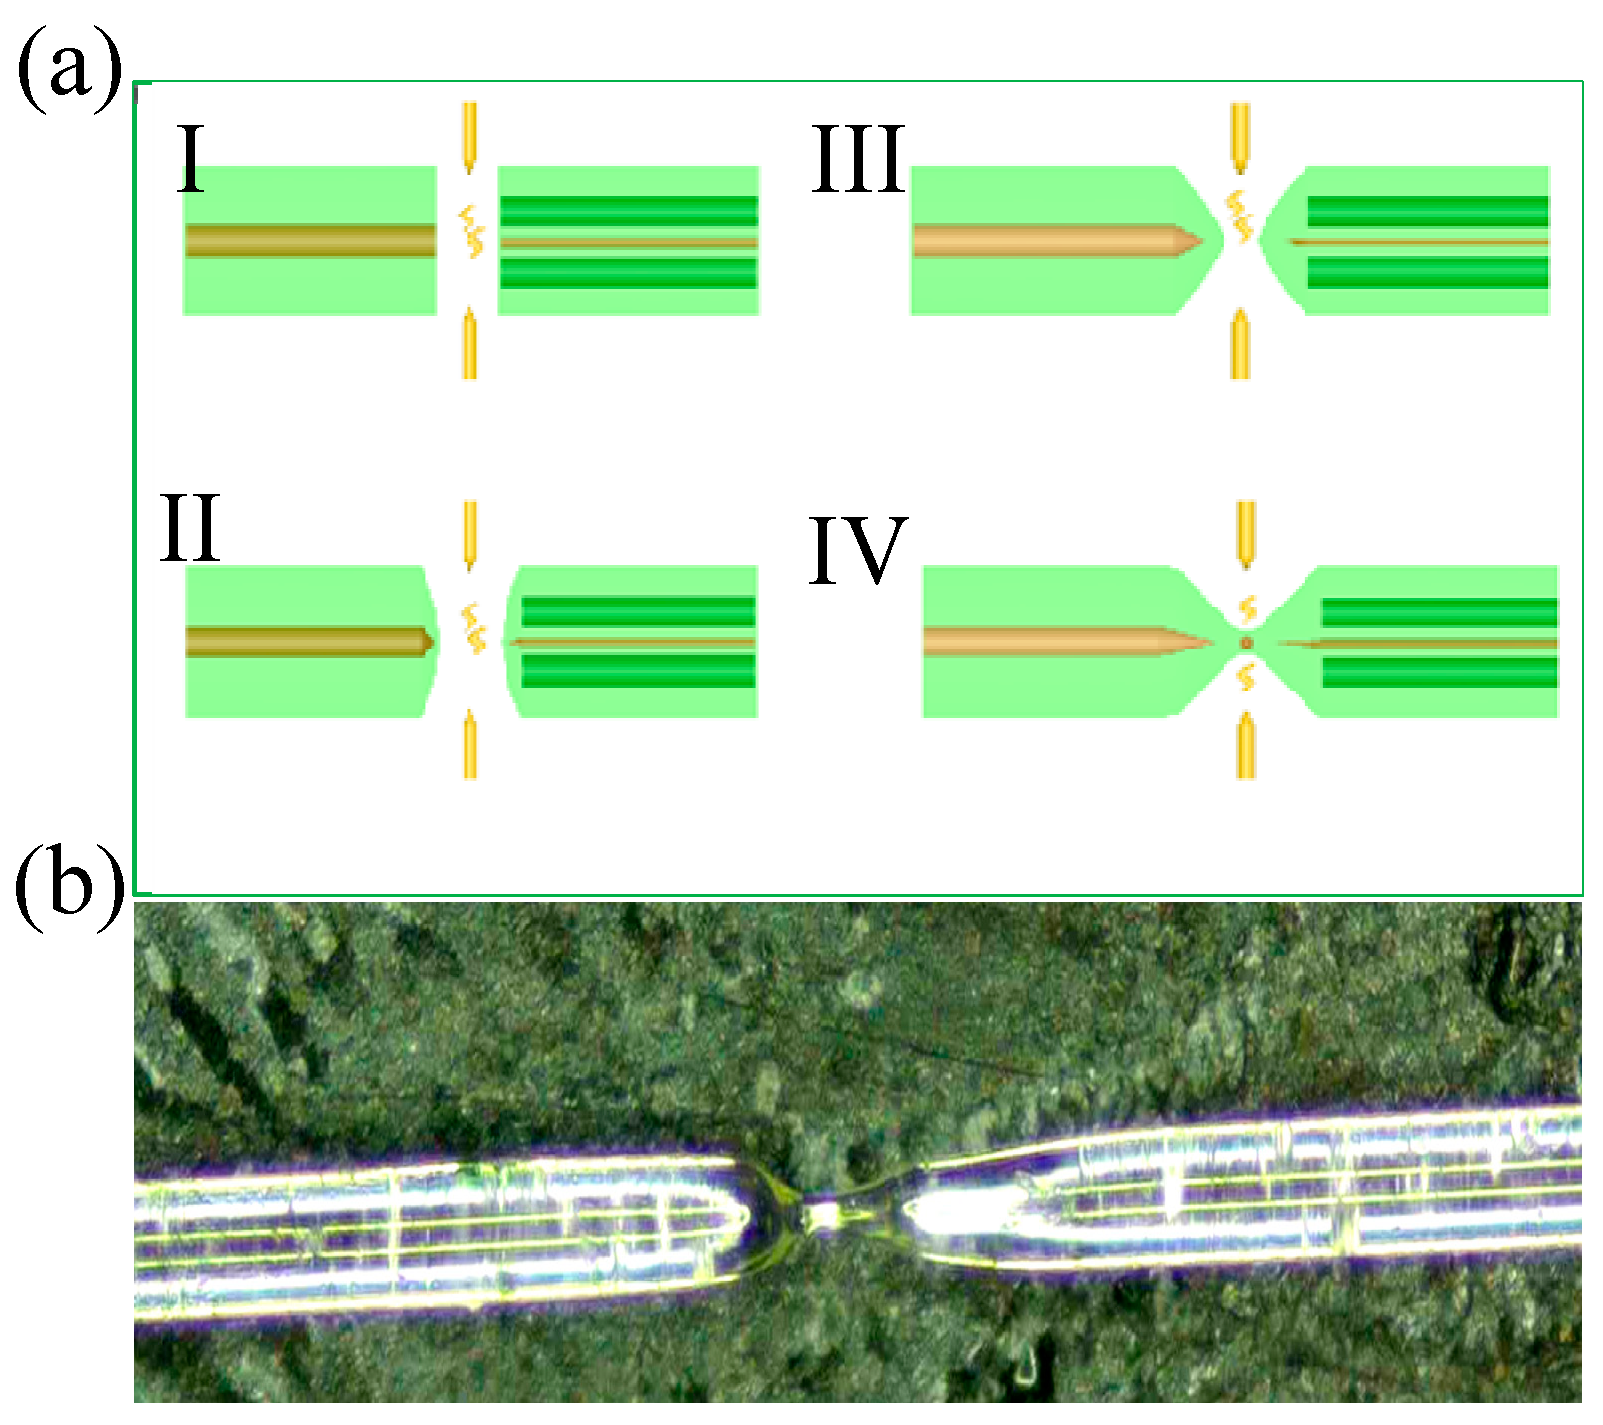
As shown in
Figure 3a, the detailed fabrication process of the DBT structure is outlined in four main steps, as follows:
Step 1: Axially align the single-mode fiber (SMF-28e, CORNING, New York, NY, USA) with the Panda PMF (PM1550-XP, THORLABS, Newton, NJ, USA), and perform an initial end-face pre-fusion discharge treatment with a discharge intensity of 45 bits (a unit of arc fusion power) for 180 ms.
Step 2: Continue the end-face discharge process to thermally fuse the ends of the SMF and PMF, forming a shape resembling a recessed semi-cone. At the shortest point of the taper, the end-face takes on a semi-circular profile. The optimal semi-circular shape is achieved after five cycles of discharge with a discharge intensity of 70 bits and a fusion time of 220 ms per cycle.
Step 3: After micro processing the end-face, align the SMF–PMF pair and adjust the program to the taper fusion mode. Increase the fusion gap to 15 µm, set the discharge intensity to 80 bits, and extend the secondary discharge time to 350 ms. Under these strong discharge conditions, combined with the stretching action of the electrodes, the two fiber ends form a pronounced taper.
Step 4: Modify the fusion program parameters by increasing the overlap fusion distance by 8 µm, raising the discharge intensity to 90 bits, and shortening the discharge time to 30 ms. This step aims to apply a strong current and reverse pressure from the fixture over a short time, causing the partially collapsed fiber ends to expand and form an uneven volume distribution near the fusion point. This expansion results in a structure resembling a fused joint. In the expansion region, the intense current causes a local change in the refractive index of the fiber material, creating a spherical modulation zone. The single BT structure is then complete. It is worth noting that, under the aforementioned parameters, a DBT structure with a uniform geometric modulation region can be fabricated. By increasing the overlap distance of the fiber end-faces and the fusion discharge power intensity, and by reducing the fusion time, the shape of the geometric modulation region will tend to become more elongated (vertical ellipsoid). Conversely, by decreasing the overlap and fusion discharge power intensity, and increasing the fusion time, the shape of the geometric modulation region will tend to become more flattened (oblate ellipsoid). The PMF is cut to a length of approximately 4.5 cm using a precision fiber cleaver on an optical precision platform, and the same fabrication process is applied to create the second BT region, ultimately forming the DBT structure.
The correspondingcharge-coupled device (CCD) microstructure is shown in
Figure 3b, where a spherical modulation zone is visible at the center of the recessed taper.
3.2. Experimental Spectral Characterization
A series of DBT structures are fabricated using the aforementioned method. By adjusting the end–face overlap and the discharge power during fusion (while keeping the first three steps unchanged, the primary adjustments are made in the fourth stage of the preparation process), BT taper structures with varying geometric profiles are produced.
Figure 4 shows a comparison of CCD images and spectral characteristics for DBT structures with different modulation region geometries and a standard concave DT structure labeled as DBT-s1, s2, s3, s4, s5, and DT, respectively. The taper length (
Lt) is maintained at 380 µm, with a minimum waist diameter (
Wt) of approximately 50 µm. The geometric modulation regions of the DBT structures are measured as follows: DBT-S1 (a = 22 μm, b = 5 μm), DBT-S2 (a = 23 μm, b = 7 μm), DBT-S3 (a = 20 μm, b = 18 μm), DBT-S4 (a = 15 μm, b = 22 μm), and DBT-S5 (a = 12 μm, b = 26 μm). These measurements provide a clear comparison of the modulation zone dimensions for each structure. Due to differences in the geometric shape of the modulation region within the taper, the convergence of transmitted light varies, resulting in different aperture distributions. These distributions evolve from an oblate shape at the top to a vertically elongated elliptical shape at the bottom (corresponding with a gradual decrease in ellipticity). The modulation region geometry for DBT-S3 is nearly spherical, with major and minor axis diameters of approximately 20 µm.
The spectral comparison reveals the following:
a. The DBT structure with a uniform and symmetrical modulation region exhibits a consistent spectral distribution, with a significant extinction ratio (ER) and constant free spectral range (FSR), indicating behavior similar to dual-mode interference.
b. For the DBT series, the spectral FSR distribution becomes more uneven as the modulation region’s ellipticity decreases from 1 (spherical) to a more oblate shape, suggesting that multiple fiber modes participate in the interference. The inconsistency in ER across resonant dips further indicates varying degrees of coupling and interference between cladding and core modes.
c. The spectral FSR becomes more uniform as the modulation region’s ellipticity decreases from 1 (spherical) to a vertically elongated ellipse. However, the uniform distribution of ER at the interference dips degrades, and insertion loss increases, indicating a weakening of dual-mode interference.
d. Compared with the DT structure, the DBT structure shows a more uniform overall FSR and superior ER at the interference dips, making it more suitable for precise monitoring and sensing applications.
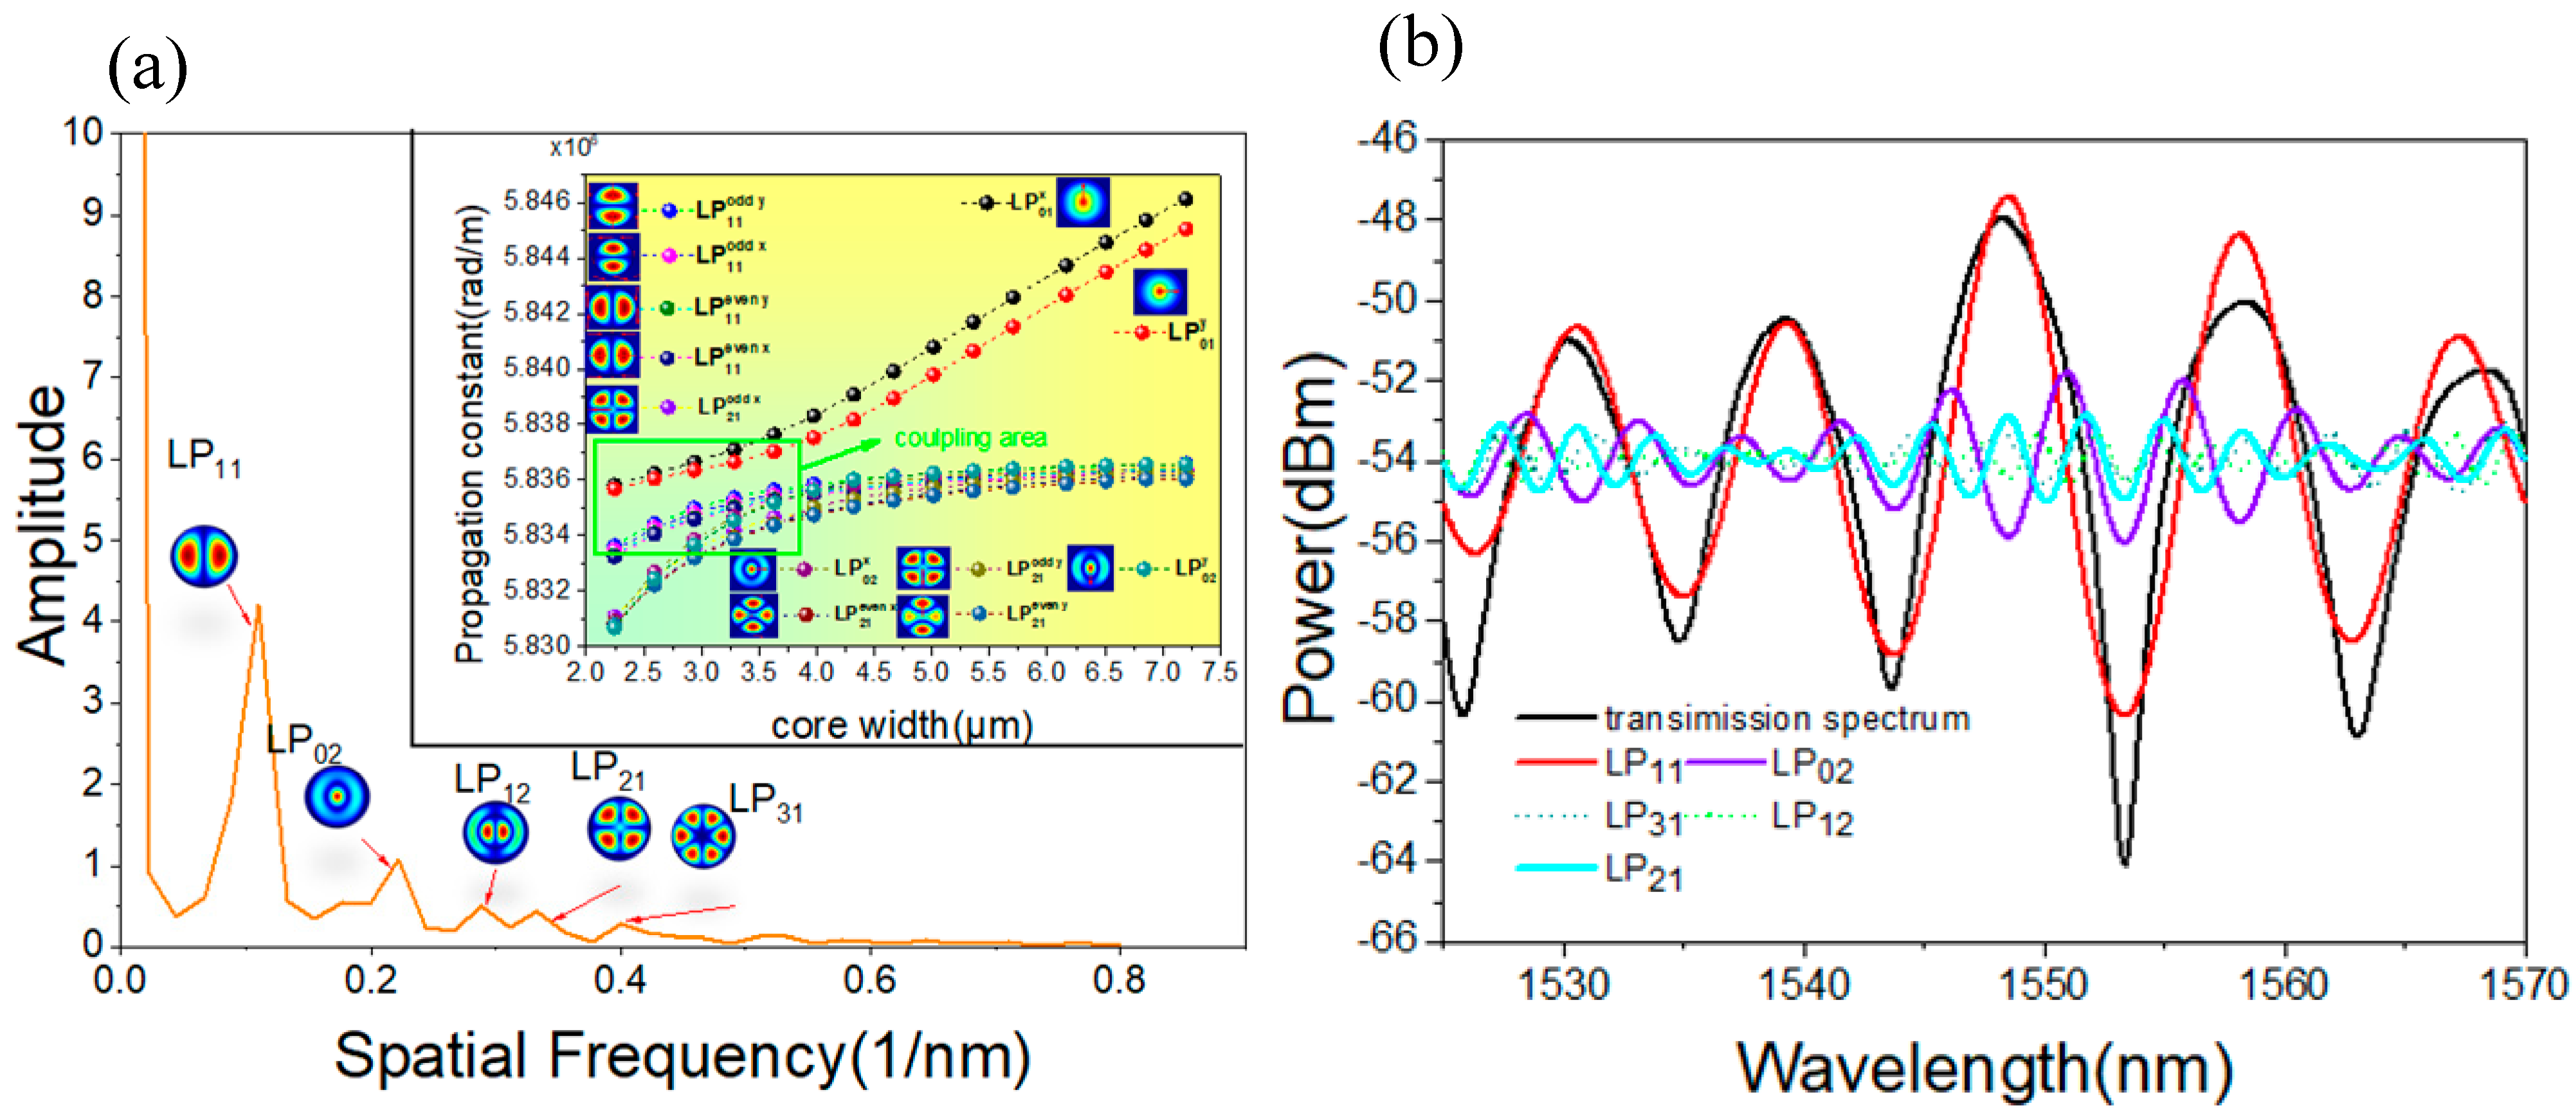
A detailed analysis of mode interference within the tapered PMF region is provided, as illustrated in the inset of
Figure 5a. The simulation shows the mode distribution at different positions within the fiber core’s tapered region, with the vertical axis representing the mode propagation constants along the light propagation direction. The figure demonstrates that when the fiber core diameter undergoes minimal changes, light propagates as two orthogonal polarization modes of the fundamental mode (x-p and y-p) within the core. The cladding modes, located in the cladding region, do not couple with the fundamental modes due to a significant difference in propagation constants, thus preventing the effective excitation of multiple fiber modes. As the fiber core diameter decreases, the difference in propagation constants between the cladding modes (LP
11, LP
02, and LP
21) and LP
01 decreases, leading to enhanced mode coupling. Notably, in the Panda-type PMF structure, the symmetric distribution of the stress region results in minimal differences between the odd and even modes for fiber modes with a degeneracy greater than two, making them approximately consistent.
In the tapered region of the polarization-maintaining fiber, geometric distortion releases stress in certain areas, reducing birefringence and weakening the mode coupling between the LP
01−x and LP
01−y polarization modes. This coupling primarily occurs between the core and cladding polarization modes, as indicated by the green gradient regions in the figure, where strong coupling is observed between various polarization modes. A fast Fourier transform (FFT) analysis of the DBT-S3 spectrum is conducted to determine the mode energy distributioncorresponding with dual-mode interference spectra, as shown in
Figure 5a. The spectrum reveals multiple resonance peaks, indicating the presence of several mode frequency components. A prominent resonance peak at 0.1110 nm
−1 corresponds with the LP
11 mode. According to the mode energy matching principle, the primary interference occurs between the LP
01 and LP
11 modes in the core, with secondary interference involving the LP
02 mode at 0.2221 nm
−1. With weaker energy distribution, the cladding modes also interfere with the core’s fundamental mode, but their effect on the main mode interference is minimal. Specifically, the LP
21 mode corresponds with a frequency of 0.288 nm
−1, the LP
31 mode to 0.333 nm
−1, and the LP
12 mode to 0.399 nm
−1.
To demonstrate that the DBT structure with spherical modulation regions exhibits characteristics of dual-mode interference, an analysis of the corresponding spectrum is conducted using the inverse fast Fourier transform (IFFT), as shown in
Figure 5b. Any signal with periodic variations can be decomposed into sinusoidal signalscorresponding with different frequencies. Therefore, we selected the main peak signals from different spectra for IFFT analysis. The analysis shows that the spectrum formed by the interference of the LP
01 and LP
11 modes closely matches the experimental spectrum, confirming the dual-mode interference characteristics and validating the theoretical analysis. This provides a theoretical foundation for subsequent sensor analysis based on different mode interferences.
4. Sensor Measurement and Analysis
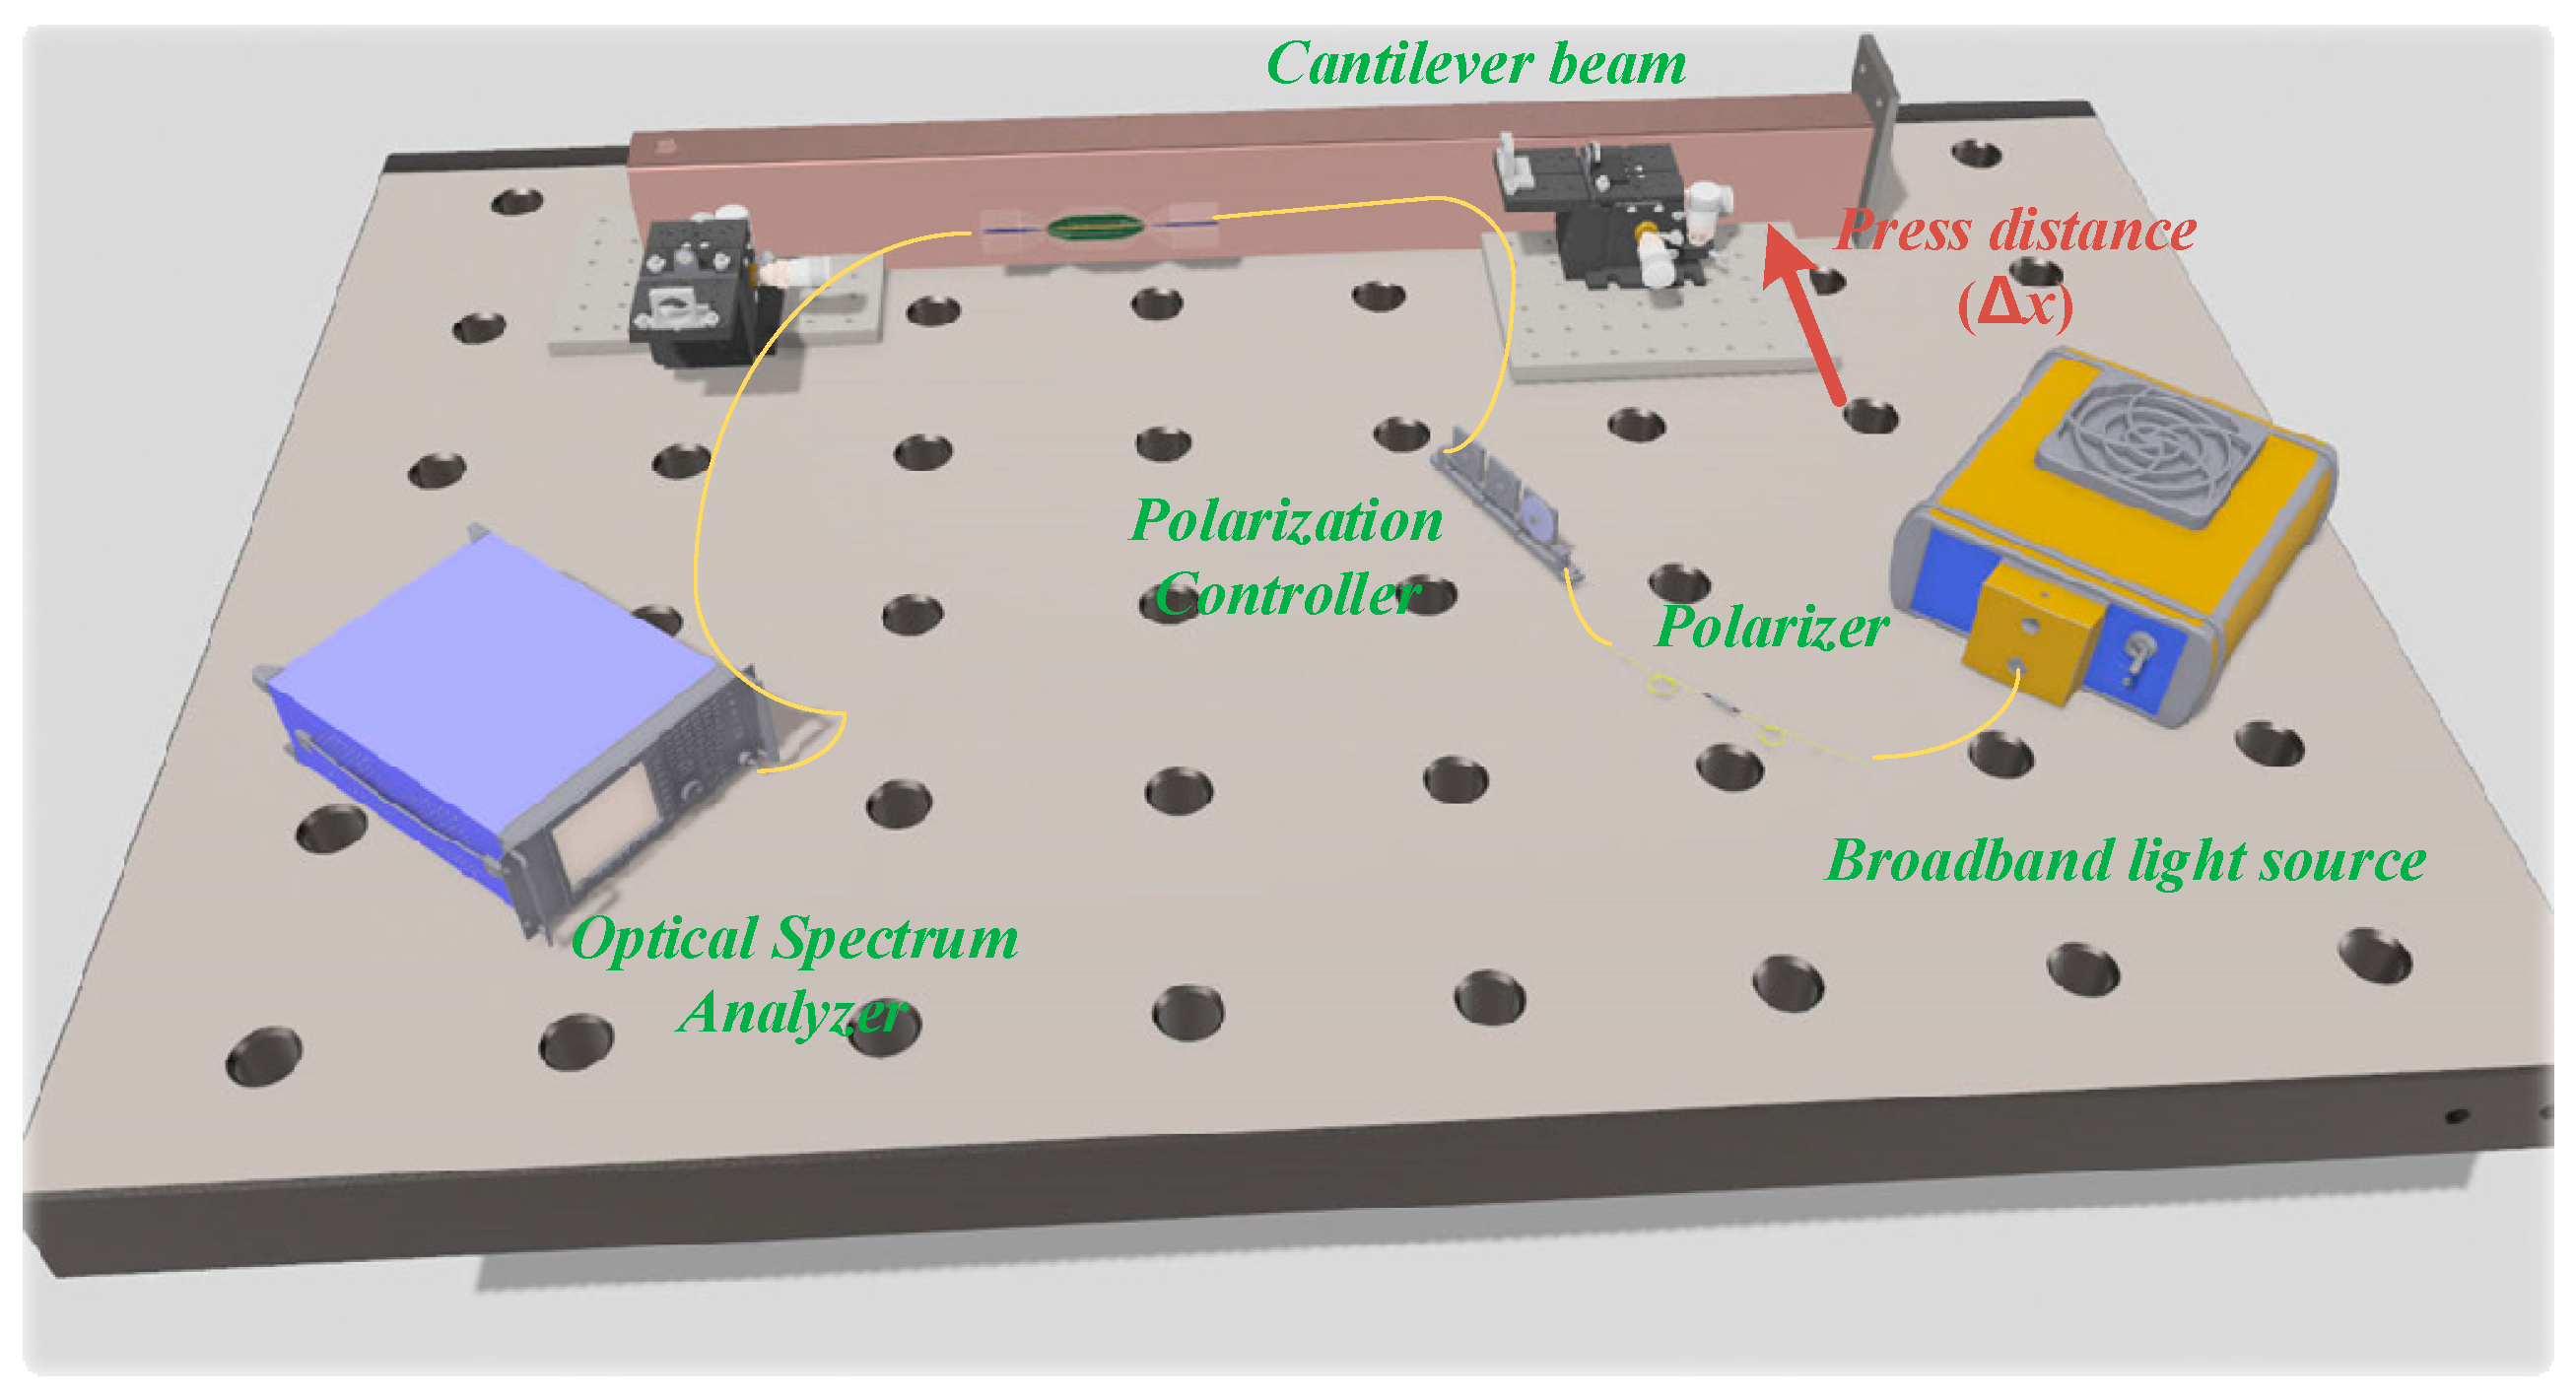
The experiment is conducted at room temperature (25 °C), with the cantilever beam strain measurement system set up as shown in
Figure 6. The sensing system consists of a flattened broadband light source (BBS, output power 120 mW, bandwidth 1525–1565 nm), a polarization controller (PC), a polarizer, SMF jumpers, and an optical spectrum analyzer (OSA, Agilent 86142B, resolution: 0.06 nm/0.01 dB, Santa Clara, CA, USA). The DBT sensing structure is horizontally fixed onto the cantilever beam using UV-curing adhesive, with a distance of L
1 = 19.5 cm between the two fixed points and a beam thickness of h = 0.3 cm. During the test, the broadband light source passes through the linear polarizer, converting it into a linearly polarized light source. The PC then adjusts the polarization angle to achieve 45° polarization before entering the transmission path (the purpose is to ensure that x-p and y-p exist at the same time). One end of the cantilever beam is secured with a mechanical clamp, leaving the rest of the beam free, with the shortest distance between the fixed point and the mechanical clamp being x
0 = 1.2 cm. A precision displacement platform with a resolution of 0.01 mm is used to apply axial stress at the free end through a contact pin in displacement increments of f = 0.1 mm. The strain signal from the DBT sensing structure is closely monitored by the OSA and converted into strain values using Equation (8) [
30]. A temperature control chamber (TC, LICHEN, 202-00T, Jinjiang, China) with a resolution of ±0.2 °C is used to characterize the temperature.
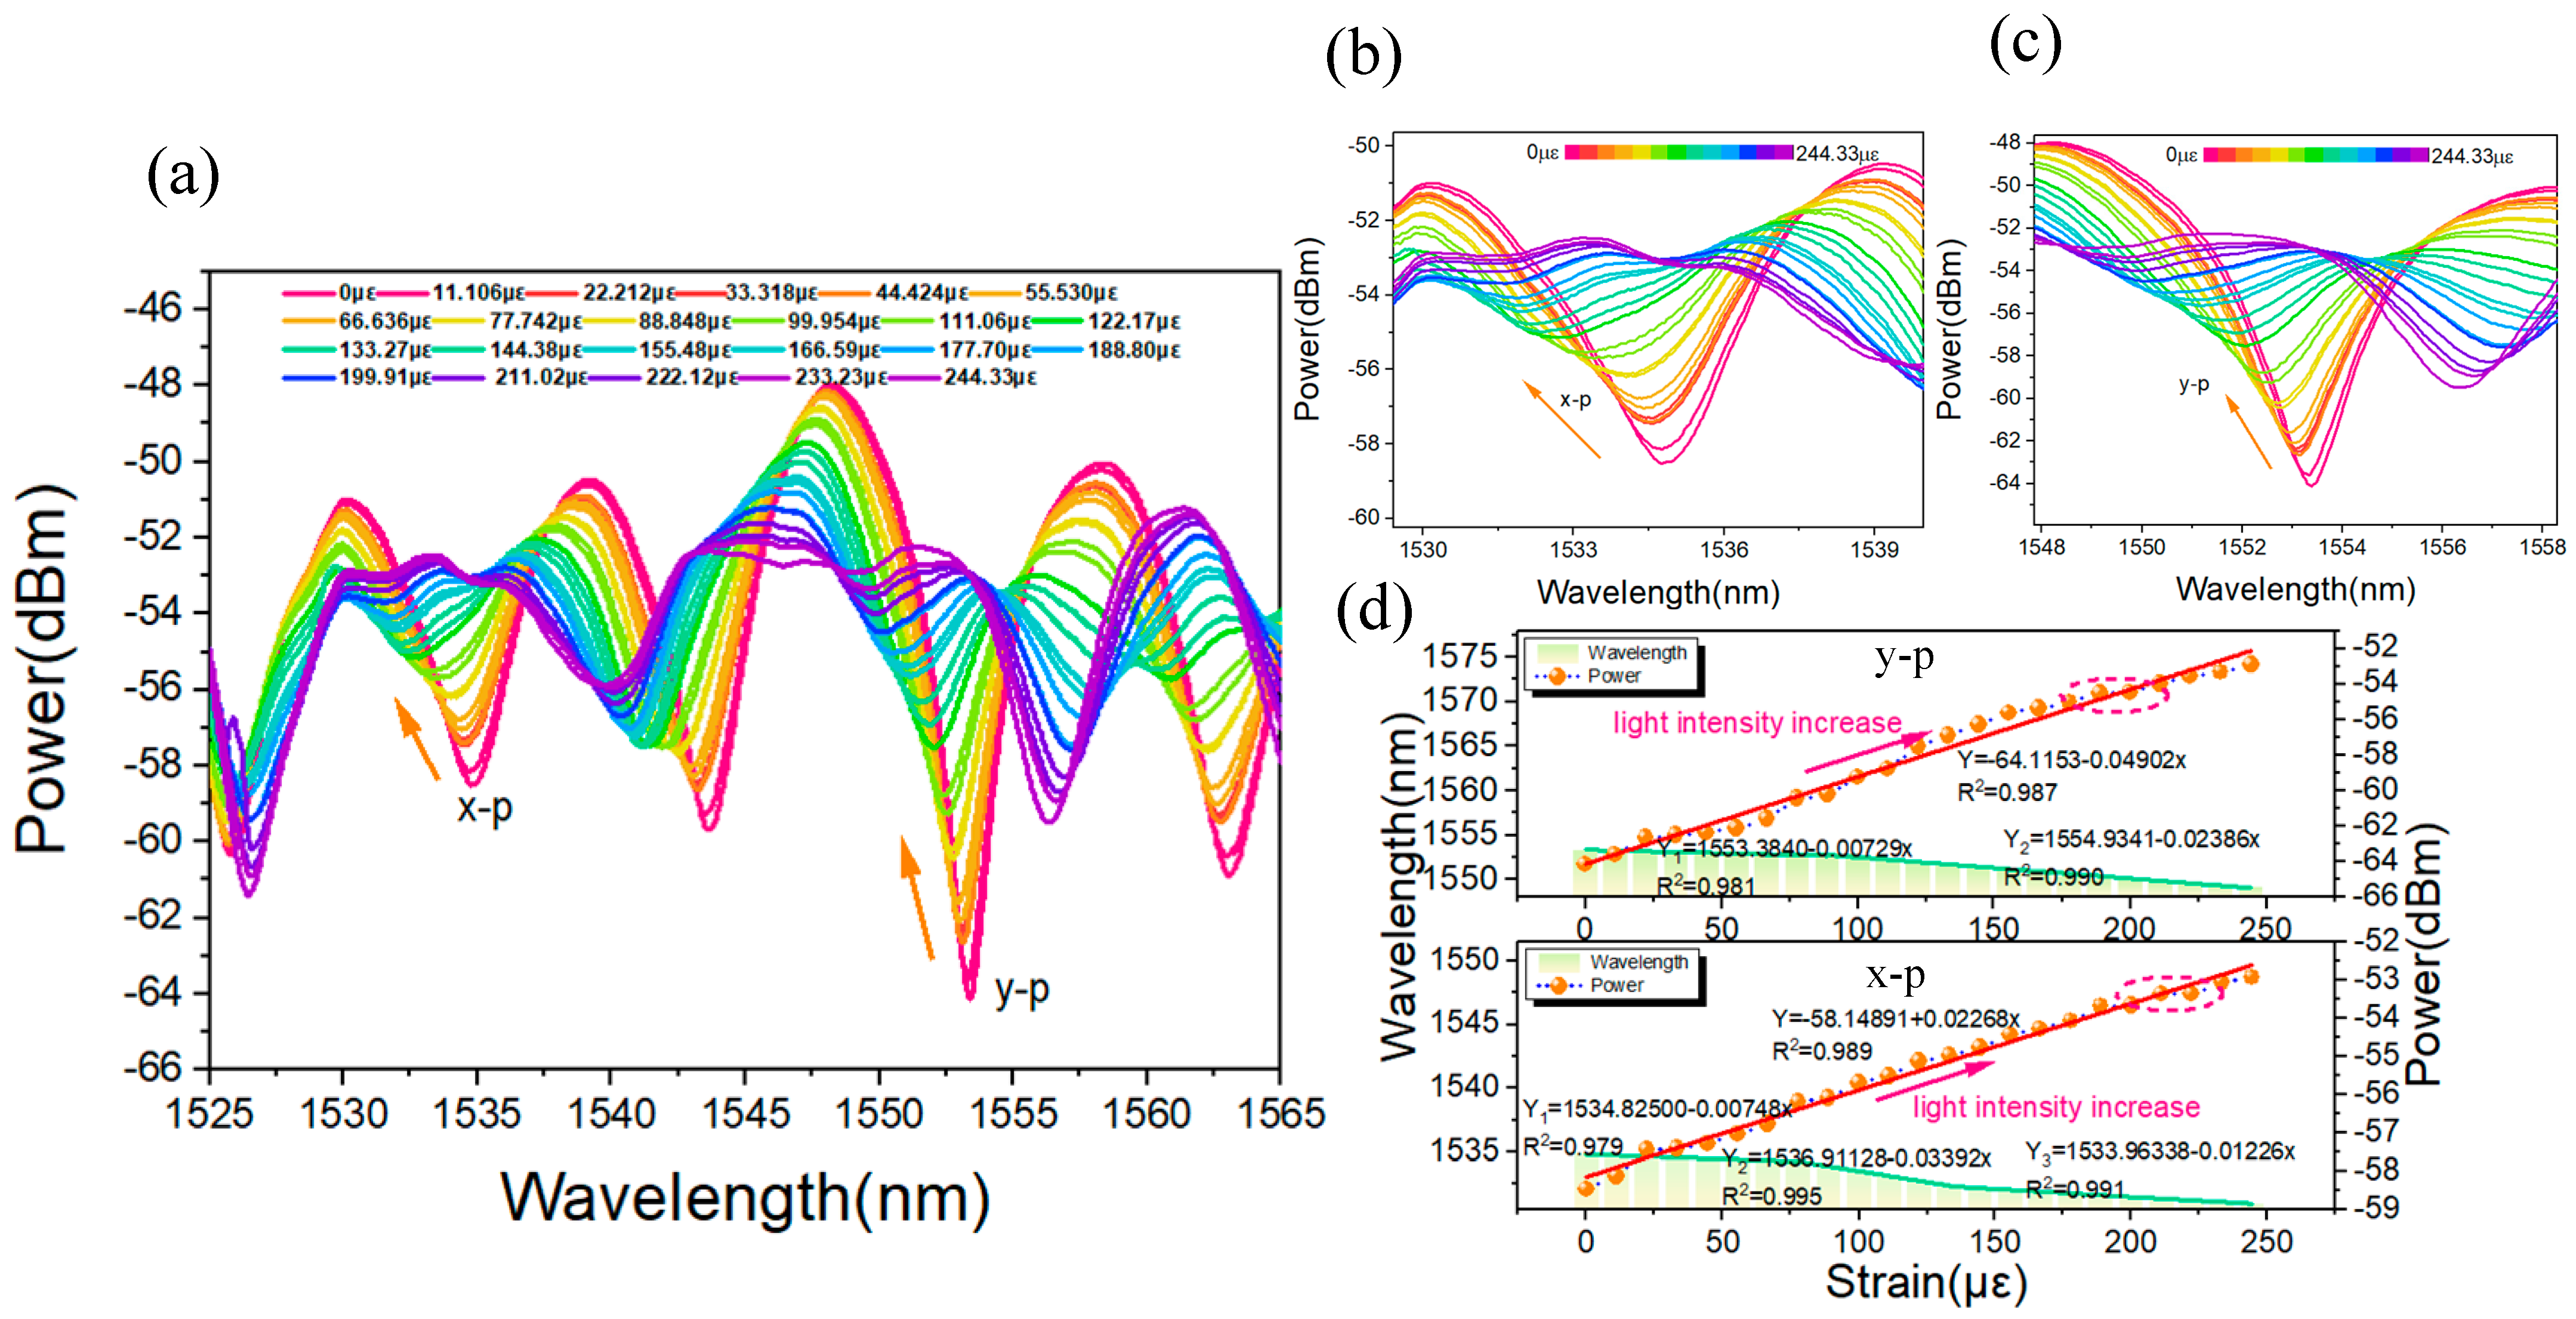
The spectral response of the cantilever beam strain measurement for the DBT structure with spherical light field modulation regions (corresponding with the control group experimental structure DBT-S3) is shown in
Figure 7a. It is evident that this particular double-tapered structure exhibits a significant response in light intensity to the applied strain. As the strain increases, the intensity of the resonance peaks at various levels gradually decreases, and the corresponding
ER of the spectrum also diminishes. Considering the dual-mode coupling interference between the LP
01 and LP
11 modes, the most pronounced resonance wavelengths for x-p and y-p polarization modes can be determined through polarization mode interference analysis (as per Equations (2) and (3)), as shown in
Figure 7b and 7c, respectively. Further numerical analysis of these resonance dips, as illustrated in
Figure 7d, reveals a linear correlation between the intensity of the resonance dips and the applied strain. The strain sensing sensitivities for the x-p and y-p mode interference are 0.049 dB/με and 0.023 dB/με, with linearity (R²) values of 0.987 and 0.989, respectively. In contrast with the light intensity change, the resonance wavelength exhibits some variability, with a segmented linear response (as indicated by the green striped bars in the figure, showing a segmented measurement phenomenon near 155.48 με). This occurs because the structure fixed to the cantilever beam bends at larger angles, leading to weak coupling between some cladding modes and their interaction with core modes, which influences the wavelength position of the interference dips. Consequently, the response shows non-linear changes over the entire strain testing range. Additionally, as the total optical power in the fiber is conserved, the light intensity response remains relatively unaffected. Therefore, using the light intensity modulation method, the DBT structure is more suitable for sensing measurements.
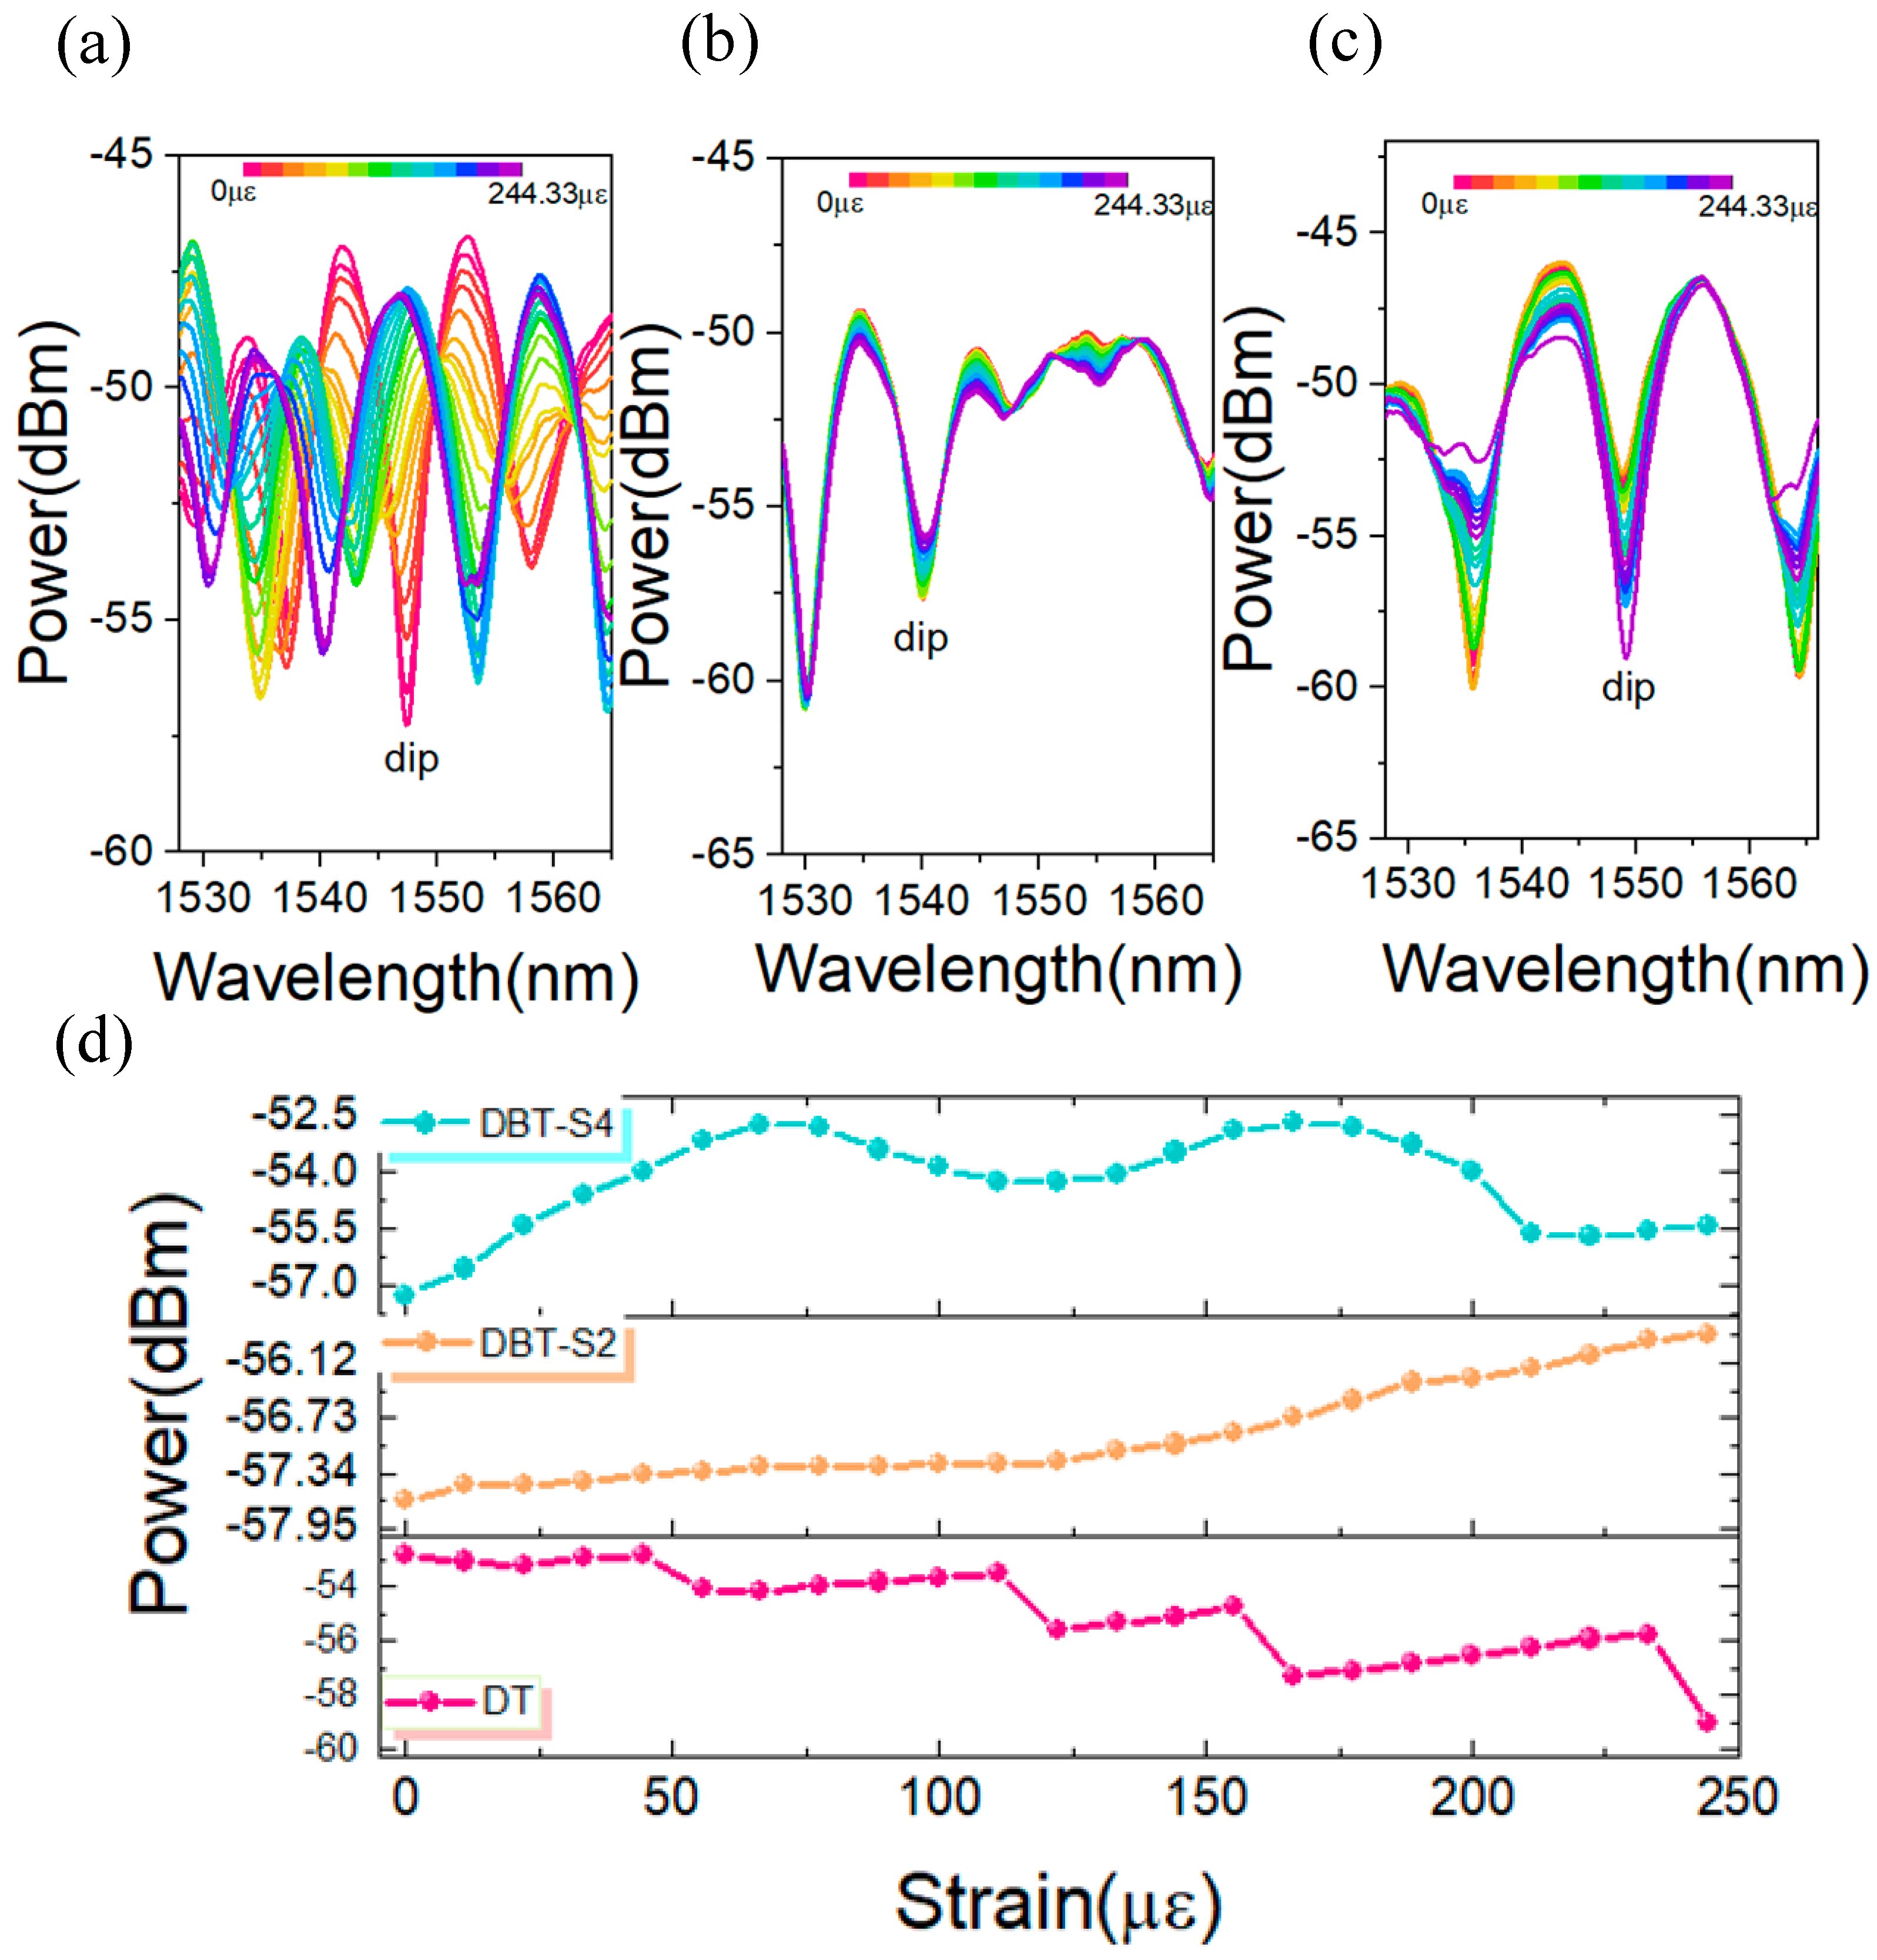
Further strain sensing measurements are conducted on DBT structures with various geometric configurations, as illustrated in
Figure 8. This is where we should add the clarification that the incident light is consistently introduced at a 45° angle along the x-axis of the PMF.
Figure 8a–c show the spectral strain sensing responses for the DBT-S4, DBT-S2, and DT structures, respectively. The results clearly indicate that the primary advantage of tapered structures in strain measurement lies in light intensity response. Consequently, light intensity tracking is employed for monitoring and analysis, with the findings presented in
Figure 8d.
In summary, (a) DBT structures with different parameters, characterized by modulation regions with varying ellipticity, demonstrate less effective mode selection and light intensity integration compared with structures with uniform spherical modulation regions. This results in a non-linear response in light intensity. The presence of multiple mode couplings, exacerbated by applied external strain, further destabilizes mode interference, leading to non-uniform and periodically fluctuating light intensity–strain responses. (b) In the DT structure without modulation regions, the coexistence of multiple modes during fiber mode interference introduces a degree of randomness to the interference spectrum. As the structure undergoes bending while fixed to a thin plate, power variations in different modes cause mode competition, leading to sudden fluctuations in light intensity during strain measurement. This instability significantly hinders the consistency of sensing measurements, making the structure less viable for practical engineering applications.
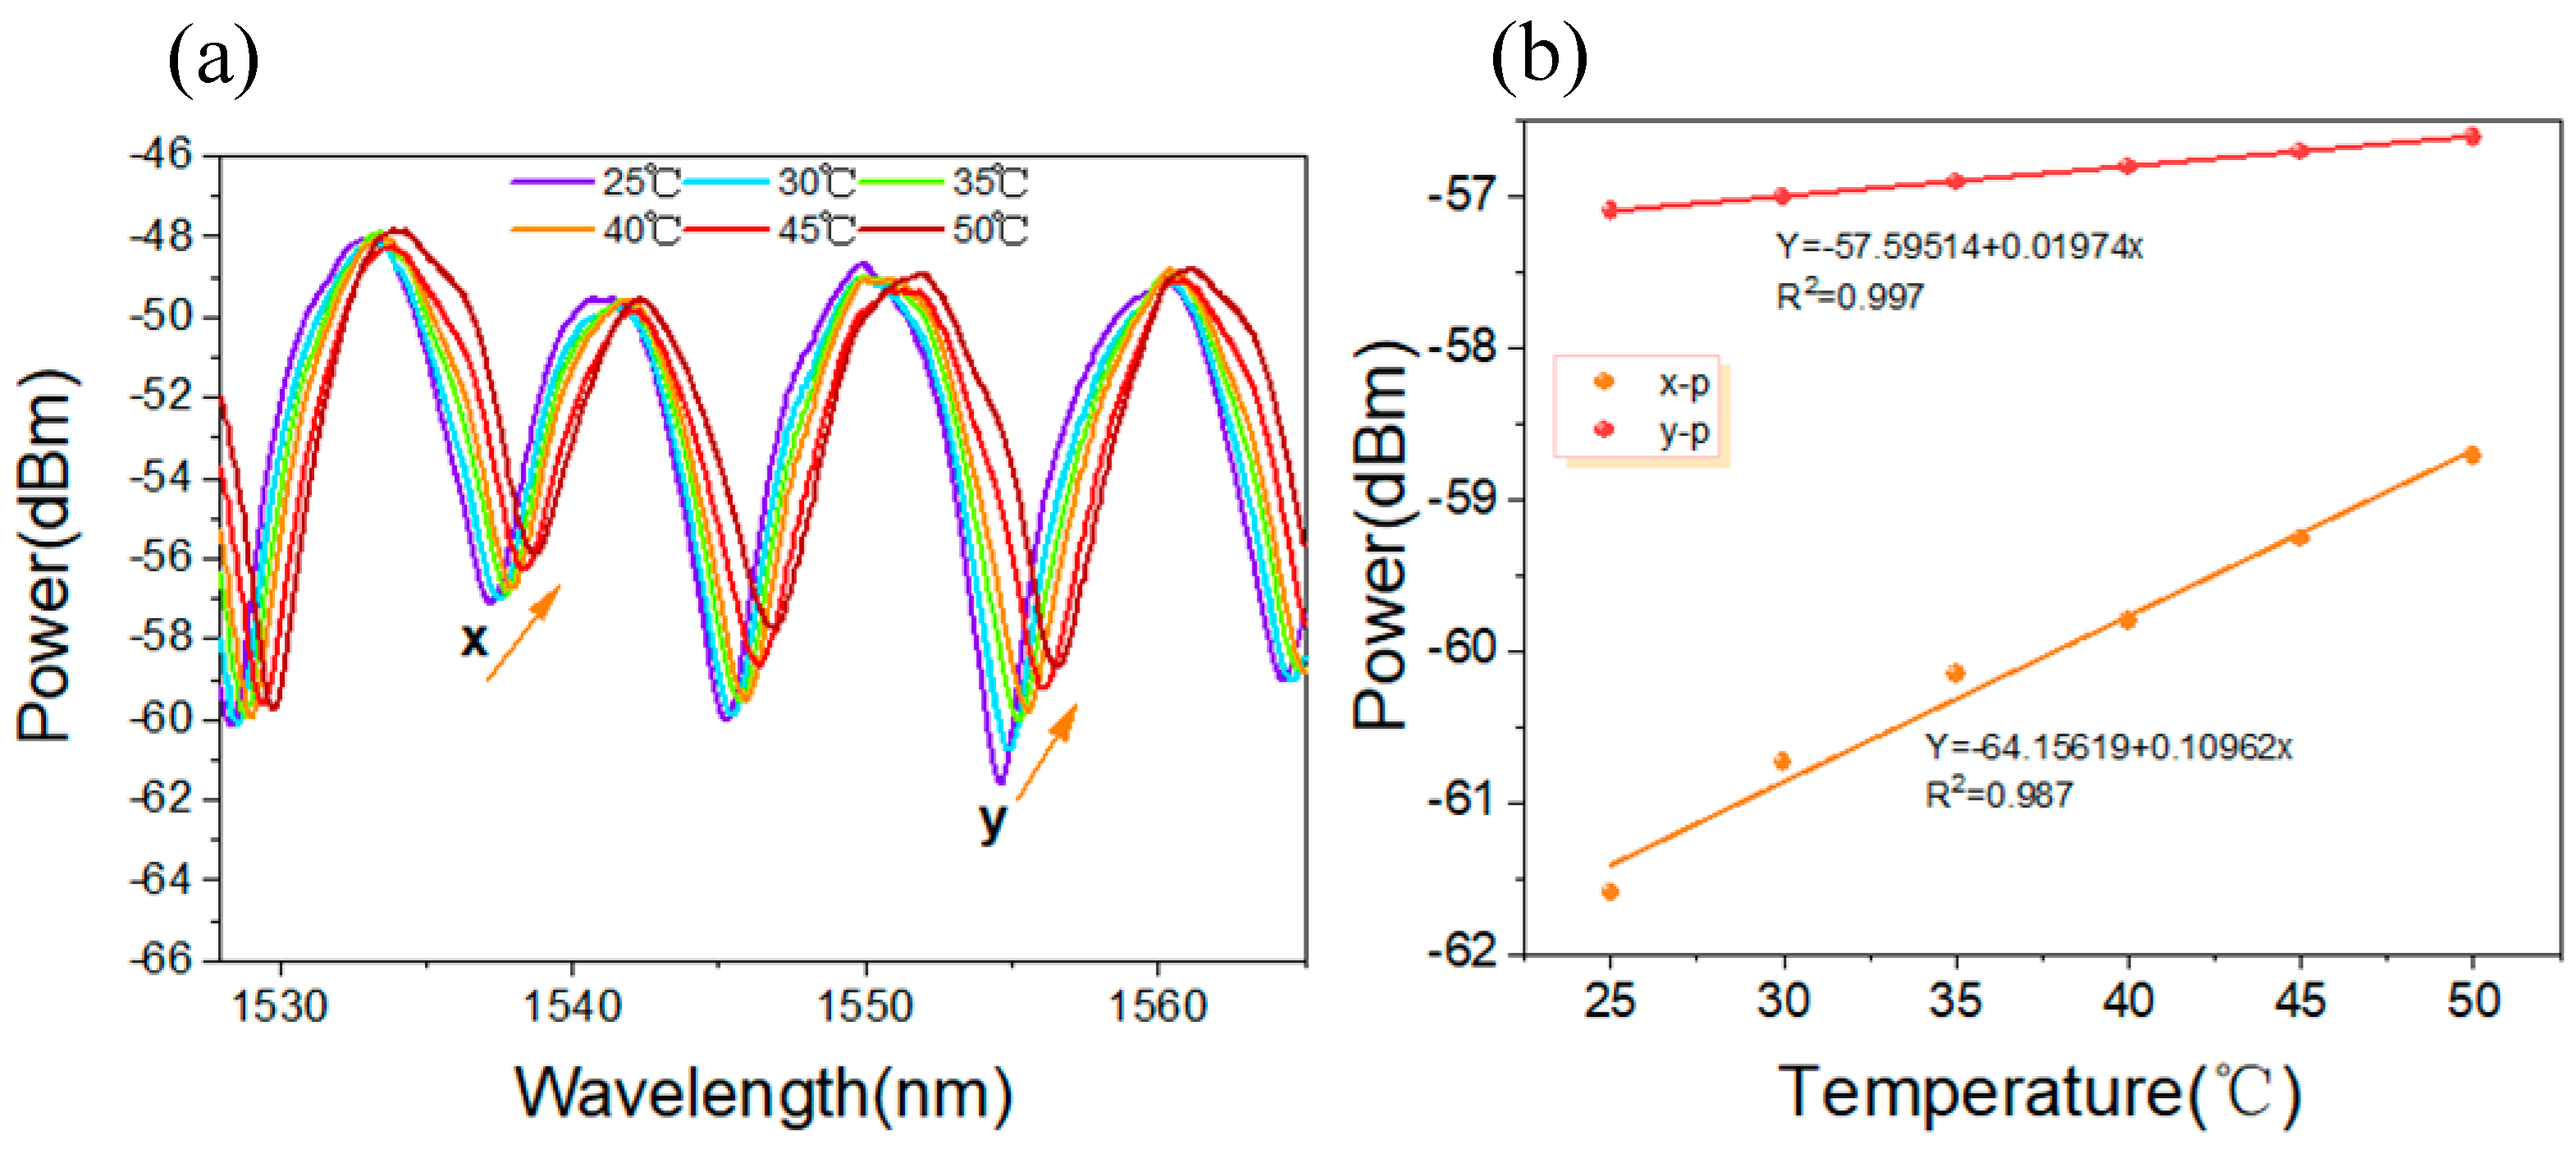
Considering the temperature sensitivity of the DBT structure, spectral measurements are recorded at 5 °C intervals starting from room temperature (25 °C). As shown in
Figure 9a, as the temperature increases, the wavelength corresponding with the interference dips consistently redshifts towards longer wavelengths, accompanied by a decrease in light intensity. Specifically, within the temperature range of 25–50 °C, the interference intensity increases linearly with rising temperature, as shown in
Figure 9b. The temperature sensitivity of the intensity modulation, based on the monitored x-p and y-p polarization mode interference dips, is determined to be 0.020 dB/°C and 0.110 dB/°C, respectively.
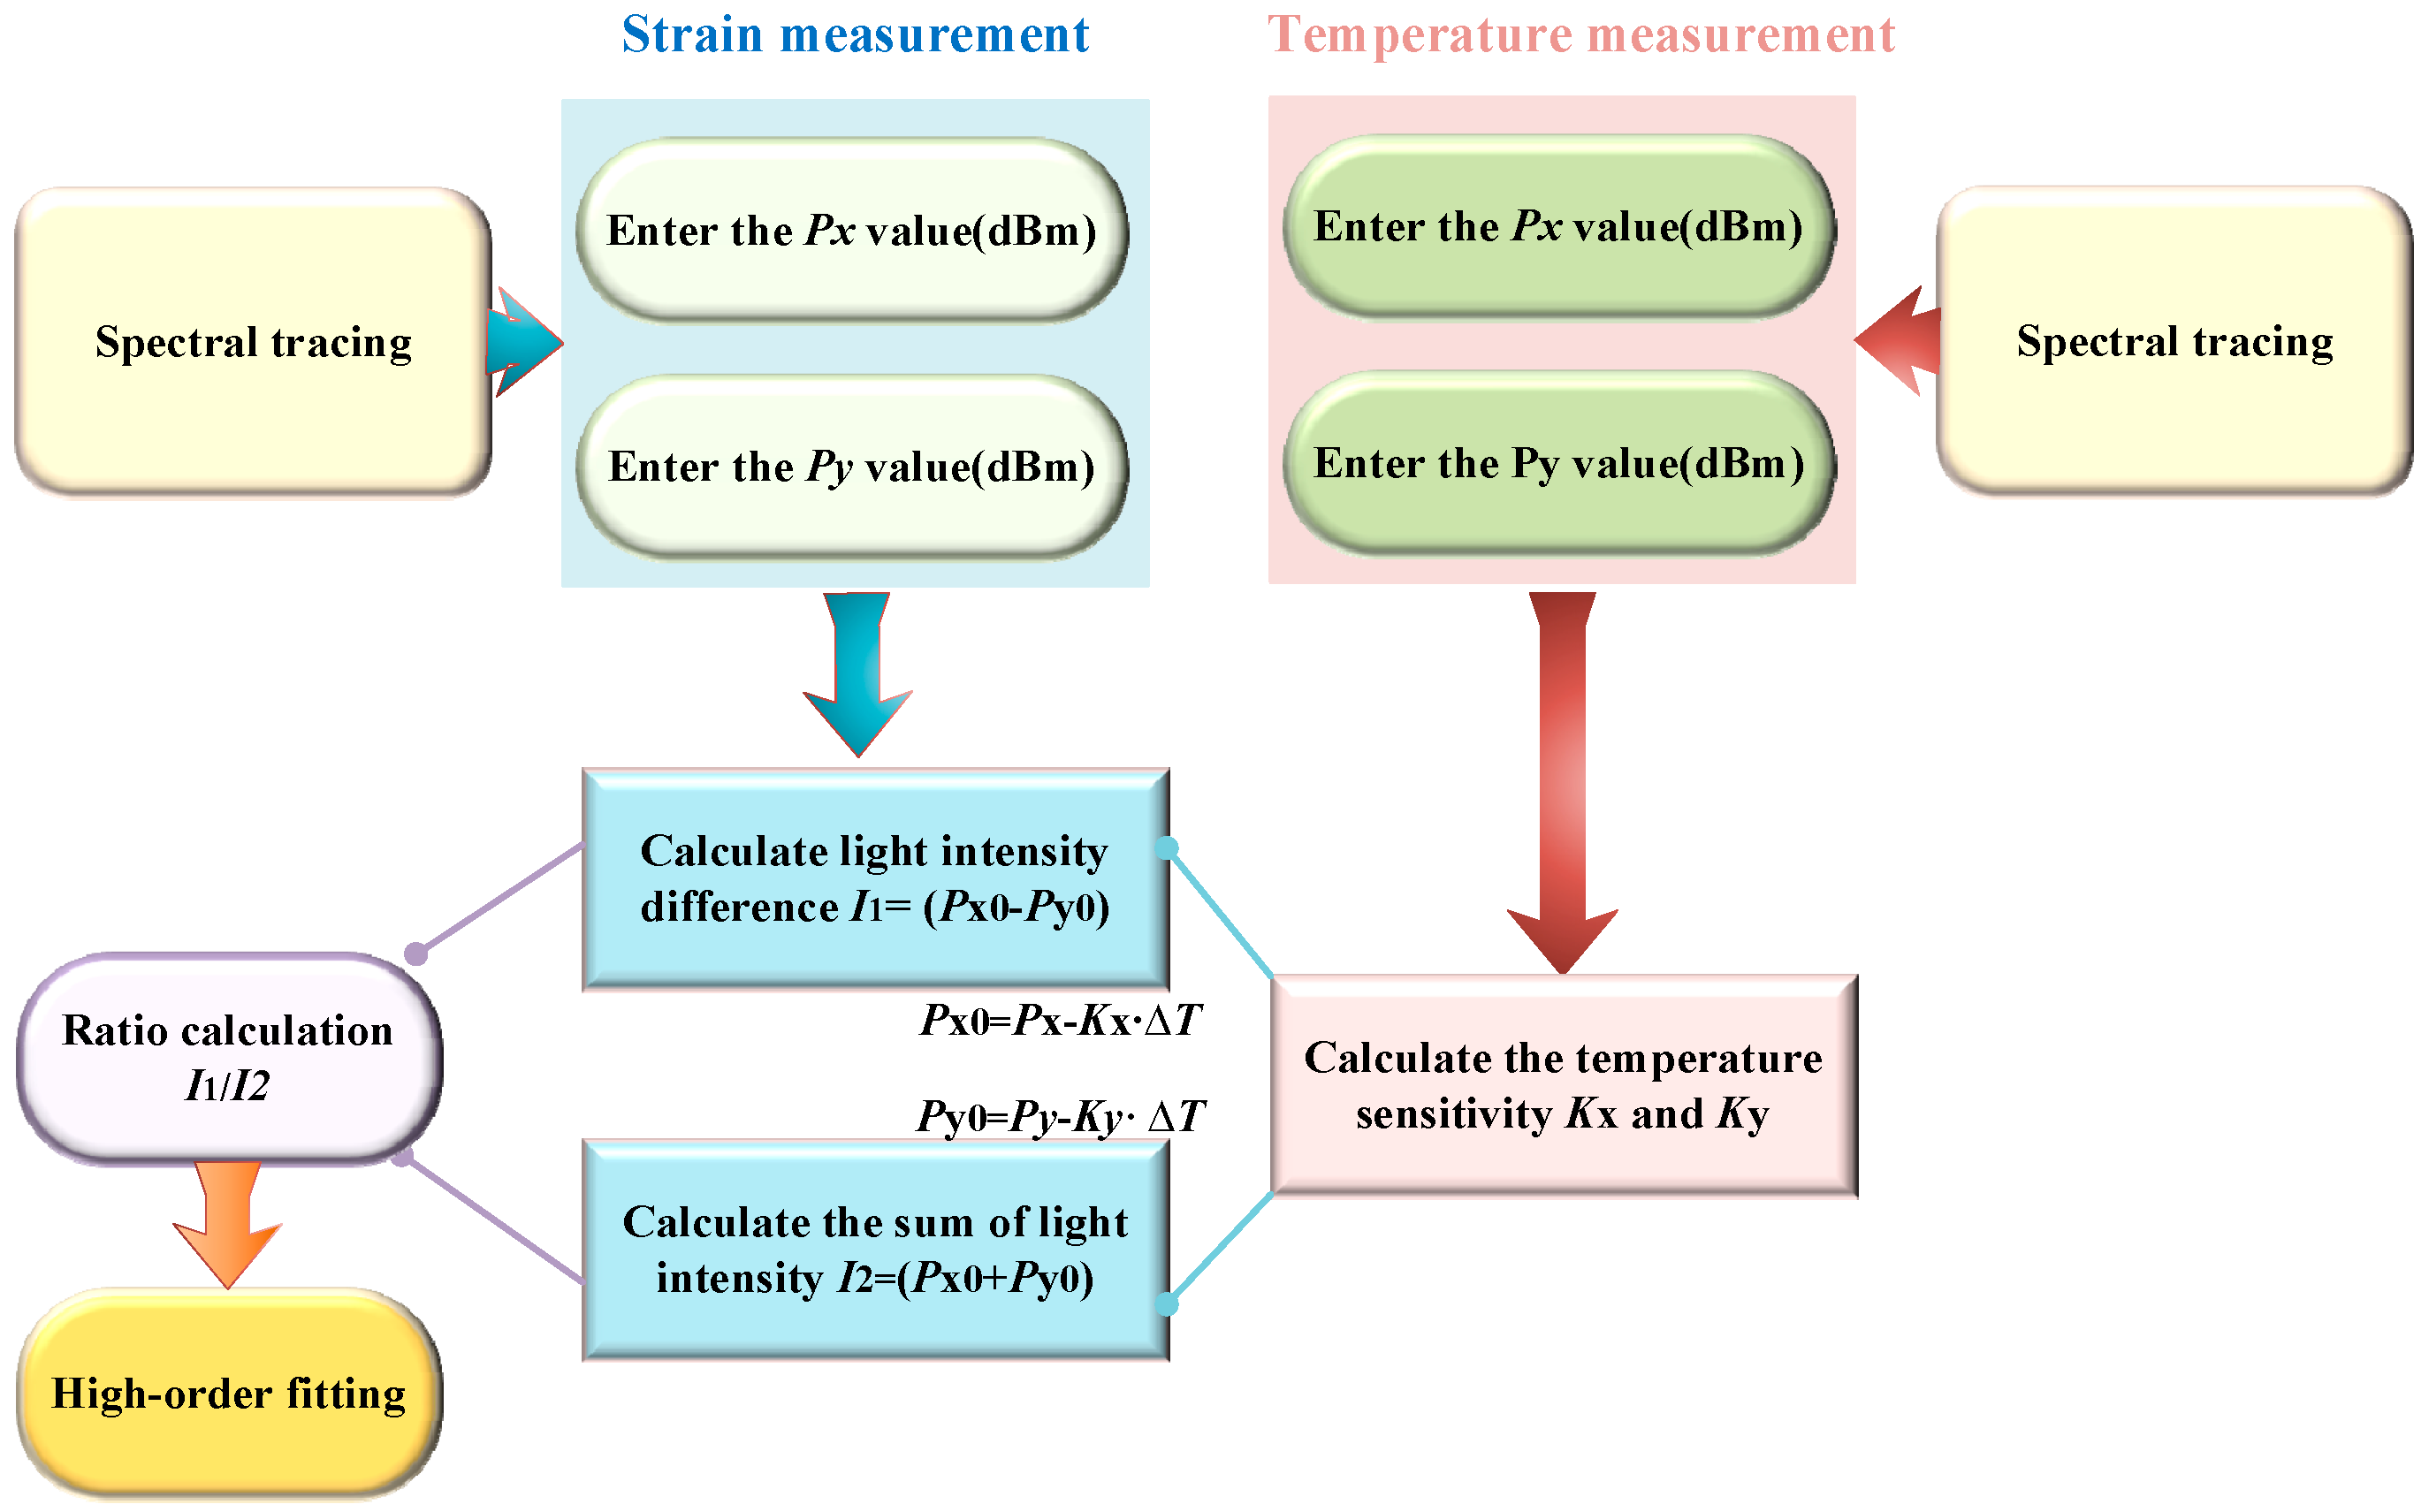
Given that light intensity is selected as the reference physical quantity during measurements, and considering that intensity-sensitive tests can be influenced by temperature fluctuations and variations in the incident light source, a temperature-compensated intensity difference and ratio calculation method is proposed. The specific calculation process is outlined in the flowchart shown in
Figure 10, which can be broadly divided into three computational steps.
The first step involves extracting the spectral sensing signals, where the characteristic dipscorresponding with x-p and y-p in the spectra are identified during the cantilever beam strain tests and temperature tests, with real-time monitoring of the corresponding intensity changes recorded as Px and Py, respectively. Following this, the linear sensitivity of the temperature measurements is analyzed and recorded as Kx and Ky.
The second step is temperature compensation, where the intensity signals are processed during strain measurements to filter out the temperature-induced effects on light intensity. The third step involves the calculation of intensity differences and ratios, where the difference and summation of the two polarization intensity signals are used to compute the ratio, followed by polynomial fitting analysis between the resulting intensity signals and the applied strain. The calculation principle satisfies the following equation:
Among these,
Px0 and
Py0 are expressed as follows:
In the analysis above, the difference (Px0 − Py0) represents the variation in light intensity between two monitored resonant dips, while the sum (Px0 + Py0) reflects the total light intensity of these dips, including fluctuations caused by light source instability. By effectively utilizing the calculation methods of light intensity difference and ratio, temperature-induced intensity fluctuations are mitigated, thereby enhancing the stability and accuracy of measurements. As temperature similarly affects both polarization modes, the difference or ratio operations filter out temperature interference while amplifying the changes in light intensity signals. This method also reduces the impact of external noise, such as light source fluctuations and detector sensitivity variations, ensuring more precise measurement results.
Furthermore, polynomial fitting corrects the relationship between the signal and strain, aligning the measurements more closely with absolute physical quantities. As shown in
Figure 11, using an initial room temperature of 25 °C as the reference, the study examines the relationship between temperature-compensated light intensity difference and ratio calculations, and the measured strain values at temperatures of 25.2 °C, 25.5 °C, 25.8 °C, 26.1 °C, and 26.4 °C. A nonlinear relationship is observed, leading to an analysis using a higher-order polynomial fitting model, as follows: Y = H + Ax − Bx
2 + Cx
3 − Dx
4 + Ex
5 − Fx
6, where H, A, B, C, D, E, and F are the polynomial fitting coefficients. Polynomial fitting is applied to the corresponding light intensity signals under different measurement temperatures, as detailed below.
Overall, the processed light intensity values and strain measurements align closely with the fitted curve, indicating the consistency and reliability of this light intensity signal demodulation analysis. This approach effectively integrates strain measurements under specific environmental temperature conditions, demonstrating its robustness for consistent strain measurement across various scenarios.
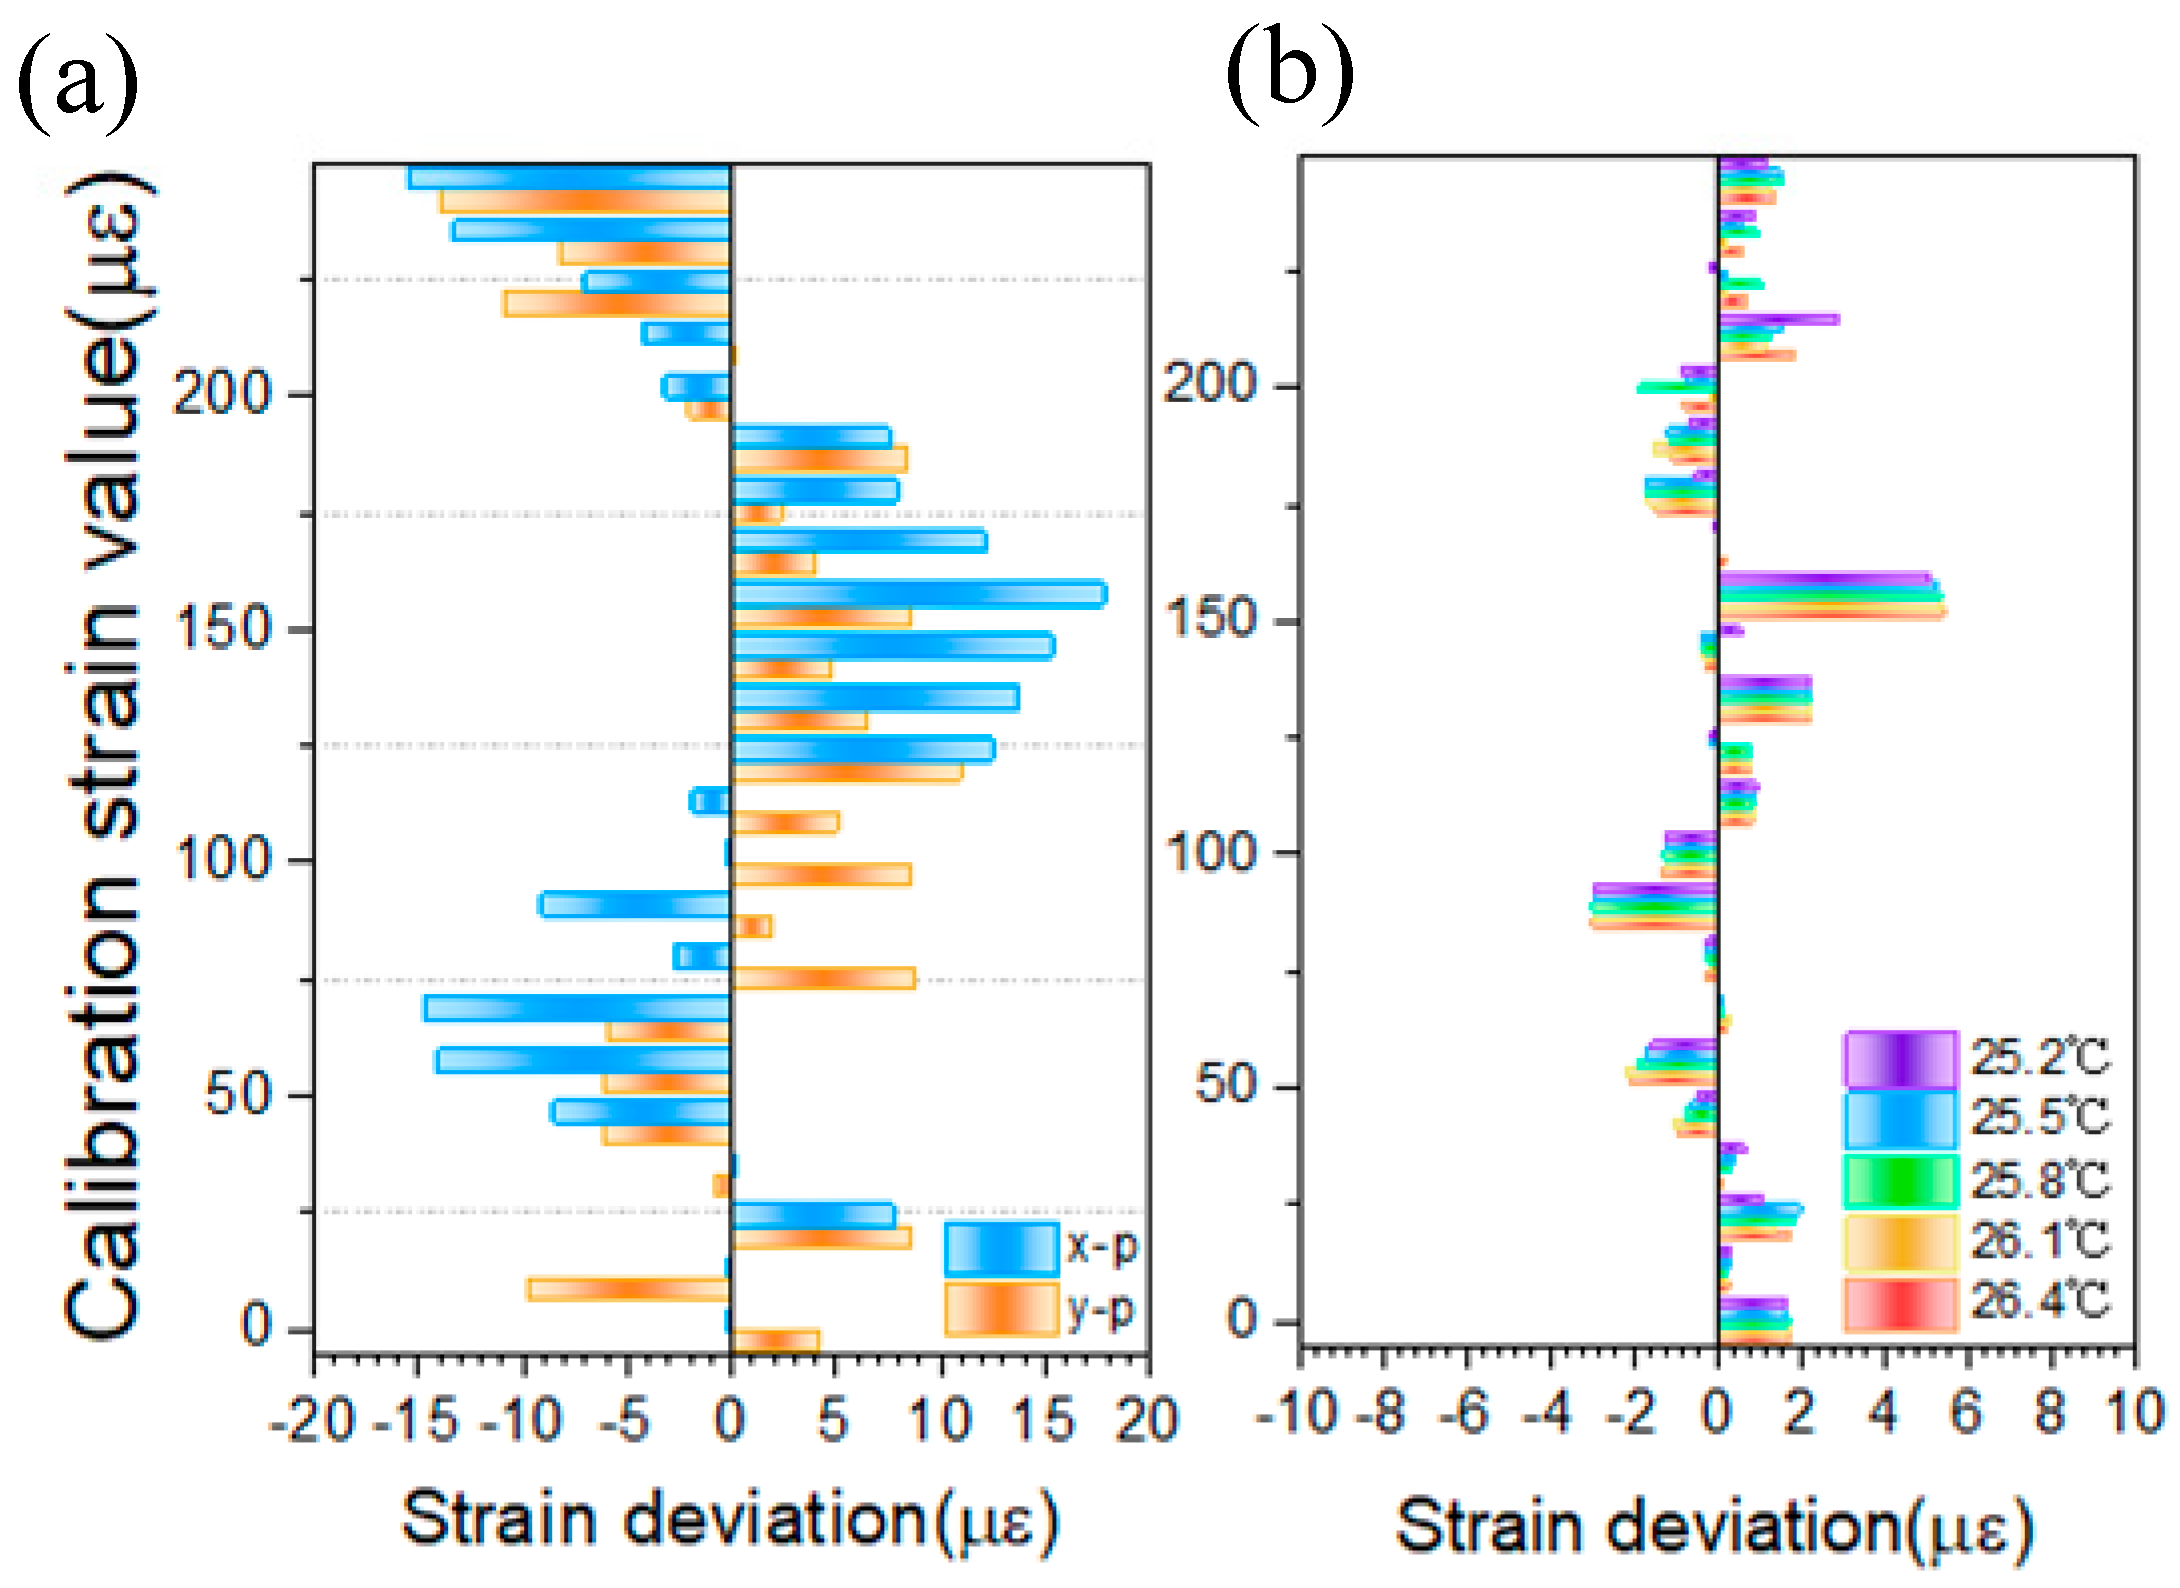
The temperature-compensated light intensity difference and ratio signal processing methods and the linear fitting method for spectral tracking are compared against the calibrated strain values, as shown in
Figure 12a and
Figure 12b, respectively. In the tracking method, x-p and y-p are used as reference points by which to obtain the calibration deviation for each degree of strain measurement, with the overall measurement deviation controlled within ±20 με. In contrast, the temperature-compensated light intensity difference and ratio methods significantly reduce the uncertainty in strain measurements. Using test samples at 25.2 °C, 25.5 °C, 25.8 °C, 26.1 °C, and 26.4 °C, the calculated measurement deviation is reduced to within ±6με. This demonstrates that the signal processing approach offers a highly effective solution for accurate strain measurement of cantilever beams in environments with small temperature fluctuations, highlighting its superior precision and reliability.
