Abstract
Testing accuracy is an essential factor in determining the manufacturing accuracy of aspheric mirrors. Because of the complexity of the null compensation test, the coherent stray lights generated by multiple reflections and transmissions between optical elements and the crosstalk fringes generated by the multi-beam interference of the reference light, test light, and stray lights are superimposed on the interference fringes, resulting in reduced testing accuracy. Focusing on this problem, a simulation analysis method for crosstalk fringes based on ray-tracing and multi-beam interference in interference testing is proposed. The coordinates, amplitudes, and phases of the test light and stray lights on the transmission sphere are traced, and the crosstalk fringes and interference testing fringes and their positions, sizes, and intensity information are simulated via multi-beam interference. The influence of crosstalk fringes on interference fringes is determined. An experimental optical path is built to verify the correctness of the crosstalk fringe simulation method.
1. Introduction
Compared with a spherical optical element, an aspheric optical element has more degrees of freedom and has the advantage of expanding the field of view in an optical system, improving the dynamic MTF (modulation transfer function) and imaging quality of the system, thus simplifying the optical system structure and reducing the system weight. With the development of space-to-earth observation and deep space exploration, higher requirements have been put forward for the resolution of imaging systems, so the requirements for the aperture and surface accuracy of optical components have also increased [1,2,3,4]. A convex aspheric optical element is more difficult to test than a concave aspheric mirror, and the processing time of the compensator required to manufacture a meter-level aspheric mirror is extremely long [5]. Therefore, feasibility analysis when designing the compensator is crucial. Simulating and analyzing the feasibility and stray lights of the testing method in the method design stage can reduce the risk of engineering development and improve efficiency significantly.
Stray lights in interference testing refer to the lights repeatedly reflected and transmitted between optical elements in the interference testing optical path. The crosstalk fringes formed by the interference of stray lights, the reference light, and the testing light are superimposed onto the interference testing fringes, leading to decreased testing accuracy. Interference testing cannot be performed when the crosstalk fringes are significant. Many studies on incoherent stray lights in optical systems and related simulation software have been conducted [6,7,8,9]; however, no simulation software is available for the interference compensation testing of coherent stray lights [10]. There is little research in this field, and existing studies have been unable to obtain specific information on the size and intensity of crosstalk fringes. The feasibility analysis of the compensator cannot be based on this specific information, and, due to the increasing demand for aspherical aperture and accuracy, the impact of crosstalk fringes on the testing results cannot be ignored. Therefore, this study proposes a simulation method for crosstalk fringes in interference compensation testing.
The remainder of this paper is structured as follows. In Section 2, the optical path in interference compensation testing, based on the improved stigmatic null testing method, is introduced. Section 3 presents the number model of the interference compensation testing’s stray light paths, which is suitable for the null compensation test. Section 4 discusses the simulations of crosstalk fringes based on the principle of ray-tracing and the amplitude and phase information of the testing light and stray lights, followed by an analysis of the results of crosstalk fringes generated by multi-beam interference and interference testing fringes. In Section 5, the experiment of the crosstalk fringe simulation method is developed, and the correctness and precision of the simulation method are verified by comparing the experimental results with the simulation results. Section 6 discusses the proposed method concerning aspects of the simulation and the experiment.
2. Introduction to the Hindle Shell Method
When the test mirror is a quadratic cone surface, the null compensation test can be realized using the stigmatic null-testing method [11]. The reference sphere used to test the convex surface is also called a Hindle sphere. When using the stigmatic null-testing method to test convex aspheric mirrors, the Hindle sphere must have a larger aperture than those of the test convex aspheric mirrors, and the optical path has a central obstruction limit [12].
The improved stigmatic null-testing method replaces the reflected Hindle sphere with the transmitted Hindle shell to solve the problem of central obstruction and reduce the reference sphere’s size. Therefore, the Hindle shell testing method makes testing large-diameter convex aspheric mirrors possible.
Aiming at a convex hyperboloid secondary mirror, the zero-compensation interference-testing optical path crosstalk fringes, based on a Hindle shell, are researched. The optical path is shown in Figure 1. For the surface label in the testing optical path, the front surface of the Hindle shell is recorded as ①, the back surface of the Hindle shell is recorded as ②, and the aspheric mirror to be tested is recorded as ③. Each type of stray light is named according to the serial number of the reflective surface.
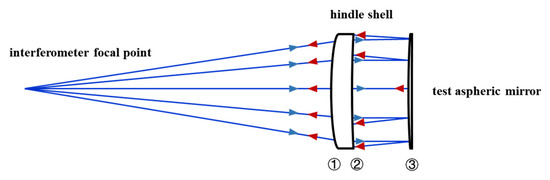
Figure 1.
Hindle shell optical path. The blue arrow is the light emitted, and the red arrow is the light reflected back by the test aspheric mirror.
The optical path is composed of the interferometer, Hindle shell, and test aspheric mirror. After passing through the Hindle shell, the testing light is reflected between the test aspheric mirror and the rear surface of the Hindle shell. Then, it returns to the transmission sphere to interfere with the reference light. The spherical shell parameters are shown in Table 1, and the test convex aspherical surface parameters are shown in Table 2.

Table 1.
Hindle shell parameters.
Table 2.
Test convex aspherical surface parameters.
3. Number Model for Stray Light Paths
In the interference compensation test optical path, the single-reflection stray lights are reflected once between the optical elements, the triple-reflection stray lights are reflected three times, and so on. The intensity of the stray lights decreases with the increase in the reflection times. Low-intensity stray lights have little effect on the interference fringes; therefore, this study only researched single-, triple-, and quintic-reflection stray lights.
The number of compensation mirrors in the interference compensation testing optical path determines the number of stray light paths. The number of single-, triple-, and quintic-reflection stray lights with different numbers of compensation mirrors m were analyzed, as shown in Table 3.
Table 3.
Number of stray lights with different numbers of compensation mirrors m and reflection parameters.
For the data in Table 3, the mathematical models for the number of compensation mirrors and the number of single-, triple-, and quintic-reflection stray lights were determined using the “inductive method”, as shown in Formula (1):
where m denotes the number of compensation mirrors; f(m) denotes the number of single-, triple-, and quintic-reflection stray lights; and z, n, and y denote temporary variables in the equation. This model, which yields the number of stray lights, is suitable for the refractive null-compensation-test optical path. There are 3 types of single-reflection stray lights, 4 types of triple-reflection stray lights (not including the interference test optical path), and 13 types of quintic-reflection stray lights, totaling 20 stray lights as the subsequent stray light simulation object.
4. Simulation of Interference Testing Fringes and Crosstalk Fringes
The optical paths of the 20 stray lights and the testing light were simulated as described in Section 3, and their coordinates, amplitude, and phase information were traced for the simulation. Simulations of the interference testing fringes and crosstalk fringes were carried out, and the simulation results were analyzed.
4.1. Coordinate and Phase Simulation of Stray Lights and Testing Light
The simulation process is shown in Figure 2. First, the testing light path and all stray light paths were simulated. Then, the coordinate and phase information of the testing light and stray lights on the transmission sphere were obtained via ray-tracing. Finally, the obtained data were integrated.
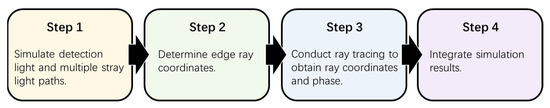
Figure 2.
Coordinate and phase simulation process.
4.1.1. Simulation of Testing Optical Path and Stray Light Paths
The testing light path was simulated as shown in Figure 3, and the stray light paths were simulated as shown in Figure 4. A hole was introduced at the focal point to simulate the spatial filtering effect inside the interferometer so that the simulation result would be closer to the actual situation. The subsequent stray light analysis was conducted on the transmission sphere, which was the evaluation surface. Due to the complex structure of the transmission sphere, a paraxial surface was used to simulate the effect of the transmission sphere, which corresponded to the last surface of the transmission sphere in the experiment.
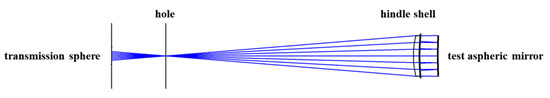
Figure 3.
Simulation of the testing optical path.
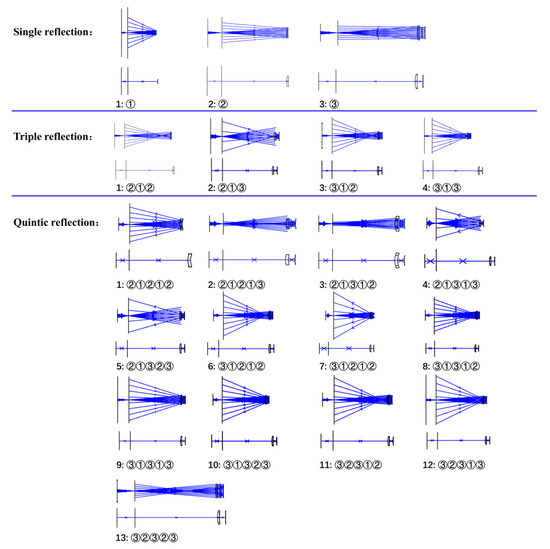
Figure 4.
Simulation of stray light paths, divided into three parts: single-, triple-, and quintic-reflection stray lights. The above image shows the simulation results of displaying light blocked by the hole, while the following image shows the simulation results of not displaying light blocked by the hole.
4.1.2. Simulation of Coordinates and Phases of Testing Light and Stray Lights
The coordinates of the testing light and stray lights passing through the hole were traced and the step size was set, as shown in Table 4. The coordinate of the light that passes through the hole’s edge is called the edge coordinate; the coordinates here refer to the normalized coordinates of the entrance pupil. The entrance pupil of the optical path refers to the effective aperture of the incident beam, which is the image formed by the aperture diaphragm on the optical system ahead. The aperture diaphragm of this interference compensation testing optical path is the test aspheric mirror. The entrance pupil of the stray light path is approximately the same as that of the testing light path, so this paper considers them to be consistent. Normalized coordinates refer to the position coordinates of a ray on the entrance pupil surface divided by the maximum entrance pupil radius. The ray was traced according to the edge coordinate and step size. The phase and coordinate information of the ray to the transmission sphere through the optical path were obtained. The coordinate and phase information of the testing light were integrated with those of the stray lights to provide data for the simulation of subsequent crosstalk fringes and interference testing fringes. Since the optical path is a rotationally symmetric optical path, only the coordinate and phase information of the lights on the x-axis were simulated, and the coordinates and phase information of the lights on the circle where each point on the x-axis was located could be obtained. The simulation time was significantly shortened compared with full-aperture ray-tracing.
Table 4.
Edge coordinates and step values of testing light and stray lights.
4.2. Simulation of Crosstalk Fringes and Interference Testing Fringes
4.2.1. Simulation of Amplitude and Phase of Full-Aperture Testing Light and Stray Lights
The complex amplitude parts of the testing light and stray lights were simulated, followed by a simulation of the amplitude and phase information in the four quadrants, establishing a corresponding relationship between the coordinates and amplitude. The lights emitted from the interferometer were uniformly distributed. Based on the minimal residual aberration of the optical design, the testing light was still uniformly distributed when reaching the transmission sphere after passing through the testing light path. In contrast, the stray lights were unevenly distributed when they reached the transmission sphere after passing through the stray light paths. Therefore, the light densities of the testing light and each stray light on the transmission sphere differed. The amplitude of light was inversely proportional to the light density, and the light density represented the amplitude part of the complex amplitude.
In a rotationally symmetric optical path, the amplitude and phase of the light were the same at the same radius, as shown in Figure 5. The rectangular coordinate system can be converted to a polar coordinate system, in which the coordinate of each ray on the x-axis is the polar coordinate radius and the angle range is [0, 2π]. The coordinates of all rays of the testing light and stray lights with their corresponding amplitude and phase information on the coordinate point could be obtained. The amplitude and phase information obtained at this time was arranged from inside to outside according to the radius value of polar coordinates.
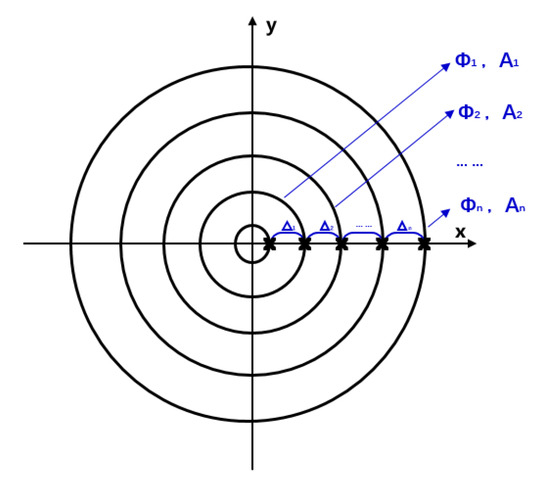
Figure 5.
Light amplitude and phase distribution. ∆ denotes the adjacent ray coordinate difference, Φ denotes the phase of the light, and A denotes the amplitude of the light.
4.2.2. Simulation of the Complex Amplitude of Testing Light and Stray Lights
The complex amplitude distributions of the testing light and stray lights were simulated, as shown in Figure 6. The complex amplitude established the correspondence between the size of the transmission sphere and the number of pixels in the interferometer. The transmission sphere was divided into multiple pixel block regions according to the interferometer. A pixel block region corresponds to an element of the matrix. The amplitude and phase of the testing light and stray lights were placed in the corresponding pixel block region according to the coordinate information. Therefore, each pixel block may have multiple pieces of information, and the pieces of information within the same pixel block are summed and averaged to obtain the amplitude and phase matrix of the testing light and stray lights, and then their complex amplitude distributions were obtained. Subsequently, multi-beam interference was performed based on these complex amplitude distributions.
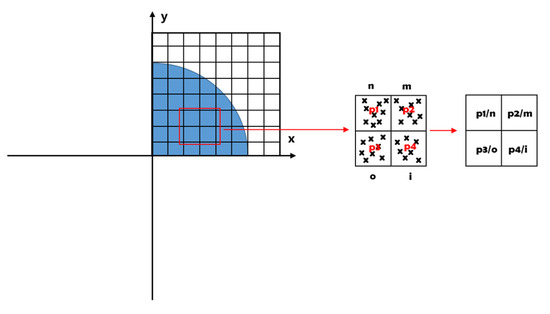
Figure 6.
Established transmission sphere, pixel number correspondence, and data processing, where n, m, o, and i denote the number of lights, and p1.p2.p3.p4 denote the sum of amplitude or phase.
4.2.3. Simulation of Testing Fringes and Crosstalk Fringes
The multi-beam interference intensity is derived in Formula (2):
where E denotes the complex amplitude, A denotes the amplitude, Φ denotes the phase, w denotes the angular frequency, t denotes the time, and n denotes the number of beams. The final expression of the multi-beam interference intensity is divided into amplitude and phase parts [13]. The phase of the reference light is set to zero, and the amplitude is the same as the testing light. The complex amplitude distributions of the testing light, the reference light, and multiple stray lights are substituted into the multi-beam interference intensity formula to obtain the interference intensity matrix. Then, using the maximum–minimum normalization method to obtain the interference testing fringes and crosstalk fringes pattern, the normalized parameters are the maximum and minimum values of the interference intensity of the reference light and the testing light, respectively.
The simulation results of the interference testing fringes and crosstalk fringes are shown in Figure 7, and Figure 8 illustrates the simulation results of the interferometer. Because the residual aberration of the optical design is minimal, the interference testing fringes are close to zero. The diameter and position are determined by the number of pixel blocks in crosstalk fringes and interference testing fringes. According to the simulation results, the crosstalk fringes are superimposed in the middle of the interference testing fringes. The ratio of the diameter of crosstalk fringes to interference testing fringes is 1/39. The maximum normalized intensity of the interference testing fringes is 1, while those of the crosstalk fringes is approximately 1.5; the intensity of the crosstalk fringes is 1.5 times the intensity of the interference testing fringes.
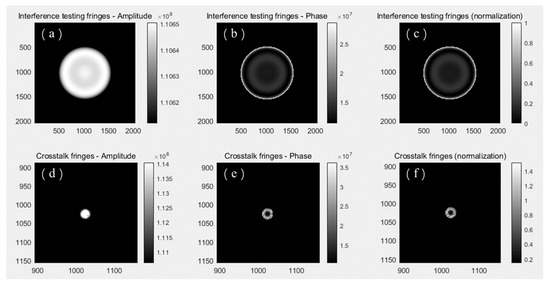
Figure 7.
Simulation results of interference testing fringes and crosstalk fringes: (a) amplitude part of the interference testing fringes; (b) phase part of the interference testing fringes; (c) interference testing fringes pattern (normalization); (d) amplitude part of the crosstalk fringes; (e) phase part of the crosstalk fringes; (f) crosstalk fringes pattern (normalization).
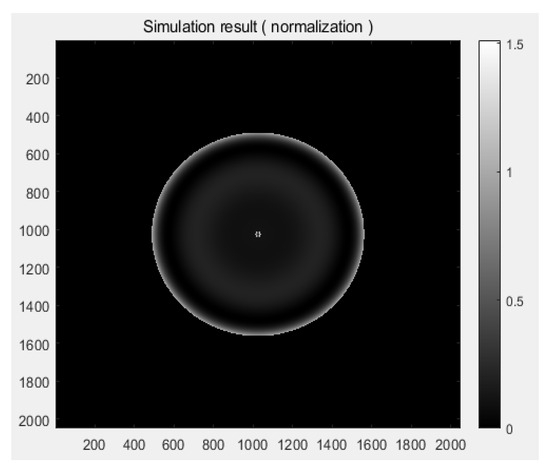
Figure 8.
Simulation result of the interferometer.
5. Experimental Verification of Crosstalk Fringe Simulation Method
The experimental optical path is shown in Figure 9. The interference fringes and crosstalk fringes are shown in Figure 10. When the test convex aspheric mirror was covered, fringes remained in the center. These fringes were mainly generated by the transmission sphere and the internal light of the interferometer. The experimental results of the fringe intensity are shown in Figure 11, where ① represents the fringes generated with the transmission sphere and ② represents the crosstalk fringes generated with other optical components in the interference testing optical path. The simulation in this paper is for ② in Figure 10.
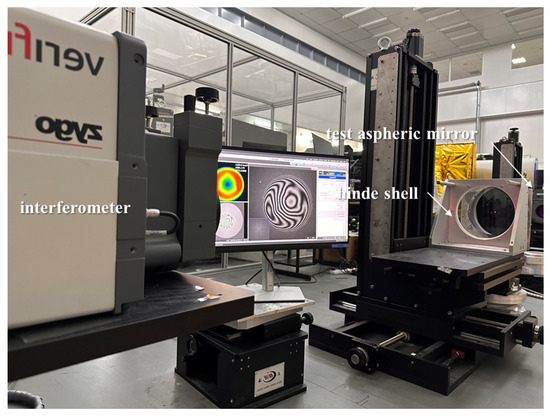
Figure 9.
Experimental optical path: interferometer, Hindle shell, and test convex aspheric mirror.
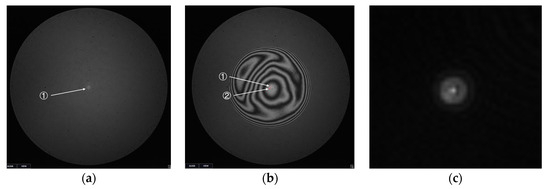
Figure 10.
Results of the fringes: (a) fringes when the test convex aspheric mirror was covered; (b) crosstalk fringes and interference fringes (not covering the test convex aspheric mirror); and (c) crosstalk fringes (not overexposed).
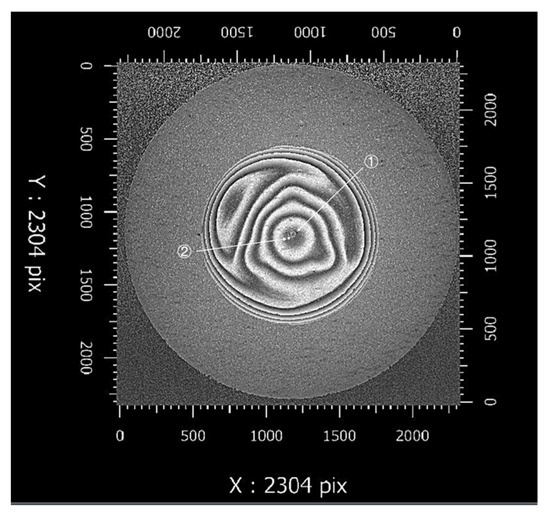
Figure 11.
Results of the fringe intensity: 2D diagram.
The experimental results were compared with the simulation results, as shown in Table 5. In the simulation results, the crosstalk fringes were in the center, the diameter of the interference testing fringes occupied a block of 1073 pixels, and the diameter of the crosstalk fringes occupied a block of 27 pixels. In addition, the ratio of the diameter of crosstalk fringes to interference testing fringes was 1/39, and the intensity of the crosstalk fringes was 1.5 times that of the interference testing fringes. In the experimental results, the position of the crosstalk fringes was below the center, the diameter of the interference testing fringes occupied a block of 1175 pixels, and the diameter of the crosstalk fringes occupied a block of 33 (horizontal) by 34 (vertical) pixels. Additionally, the ratio of the diameter of crosstalk fringes to interference testing fringes was 1/39, and the intensity of the crosstalk fringes was 1.8 times that of the interference testing fringes.
Table 5.
Comparative analysis results of experiment and simulation.
Because the precision of the test aspheric mirror and the wedge angle of the Hindle shell are insufficient, the interference testing fringes in the experiment could not be adjusted to zero fringe, and the position and size of the crosstalk fringes differed from those in the simulation. Furthermore, only the crosstalk fringes generated by single, triple, and quintic reflections were simulated, so the crosstalk fringe intensity in the simulation was less than the experimental crosstalk intensity. The experimental results were similar to the simulation results, which could preliminarily validate the simulation method of crosstalk fringes.
According to the requirements, simulation results, and experimental results of the test mirror in this experiment, the diameter of crosstalk fringes is smaller than the center invalid aperture diameter, indicating that the crosstalk fringes are not within the effective aperture of the test mirror. Therefore, the crosstalk fringes in the interference testing optical path in this paper have no impact on the testing, indicating that the design scheme is feasible.
6. Conclusions
In this paper, coherent stray light in interference testing was studied theoretically, and the position, size, and intensity of crosstalk fringes formed by the multi-beam interference of a coherent stray light with a reference light and testing light were simulated. The influence area of the crosstalk fringes on the interference testing fringes could be clearly determined. The feasibility of the compensator design method was judged according to the simulation results. If the crosstalk fringes were to have no effect on the interference testing fringes, then the compensator design scheme would have been feasible. If the interference fringes were to have an impact on the interference testing fringes, it would have been necessary to modify the compensator design scheme. Ensure the feasibility of the compensator scheme before manufacturing the compensator to avoid the need for reprocessing of the compensator due to interference fringes in the future, thereby reducing engineering risks and improving efficiency. In addition to the simulation analysis, an experiment was carried out to verify the correctness and precision of the crosstalk fringe simulation method.
Author Contributions
Conceptualization, Q.C. and H.H.; methodology, Y.S., Q.C., H.H. and X.Z. (Xin Zhang); software, Y.S.; validation, Y.S. and X.Z. (Xin Zhang); formal analysis, Y.S. and X.Z. (Xin Zhang); investigation, Y.S. and X.Z. (Xin Zhang); resources, L.L. and X.W.; data curation, Y.S.; writing—original draft preparation, Y.S.; writing—review and editing, Q.C., Y.S. and L.L.; visualization, Y.S.; supervision, X.W., D.X. and X.Z. (Xuejun Zhang); project administration, D.X. and X.Z. (Xuejun Zhang); funding acquisition, Q.C., X.W., D.X. and X.Z. (Xuejun Zhang). All authors have read and agreed to the published version of the manuscript.
Funding
This research was funded by the National Natural Science Foundation of China (grant numbers 62127901, 12003034, 62275246, 62075218, and 12003035), the Youth Innovation Promotion Association, CAS (grant number 2022213), the National Defense Basic Science Research Program (grant number 2022-JCJQ-JJ-0777), and the National Undergraduate Innovation and Entrepreneurship Training Program (grant number Y9I838S).
Institutional Review Board Statement
Not applicable.
Informed Consent Statement
Not applicable.
Data Availability Statement
The data presented in this study are available on request from the corresponding author.
Acknowledgments
The authors would like to express our sincere gratitude to the Key Laboratory of Optical System Advanced Manufacturing Technology, Chinese Academy of Sciences, for providing the experimental site and equipment.
Conflicts of Interest
The authors declare no conflicts of interest.
References
- Zhang, X.; Hu, H.; Wang, X.; Luo, X.; Zhang, G.; Zhao, W.; Wang, X.; Liu, Z.; Xiong, L.; Qi, E.; et al. Challenges and strategies in high-accuracy manufacturing of the world’s largest SiC aspheric mirror. Light. Sci. Appl. 2022, 11, 310. [Google Scholar] [CrossRef]
- Luo, X. High-precision fabrication of 4m SiC aspheric mirror. Light. Sci. Appl. 2023, 12, 4. [Google Scholar] [CrossRef] [PubMed]
- Briguglio, R.; Quirós-Pacheco, F.; Males, J.R.; Xompero, M.; Riccardi, A.; Close, L.M.; Morzinski, K.M.; Esposito, S.; Pinna, E.; Puglisi, A.; et al. Optical calibration and performance of the adaptive secondary mirror at the Magellan telescope. Sci. Rep. 2018, 8, 10835. [Google Scholar] [CrossRef]
- Wang, X.; Liu, Z.; Su, H.; Cheng, Q.; Li, L.; Li, F.; Li, W.; Liu, B.; Wang, J.; Cai, M.; et al. Mixed compensation for the testing of large convex aspheres. Results Phys. 2023, 55, 107189. [Google Scholar] [CrossRef]
- Wang, X.; Cai, Z.; Zhang, X.; Hu, H.; Luo, X. Surface Shape Accuracy Testing Device and Testing Method for Large-Aperture Convex Aspheric Optical Elements. Patent CN202011261854.7, 9 March 2021. [Google Scholar]
- Clermont, L.; Uhring, W.; Georges, M. Stray light characterization with ultrafast time-of-flight imaging. Sci. Rep. 2021, 11, 10081. [Google Scholar] [CrossRef]
- Liu, D. Research on Stray Light in Hybrid Diffractiove/Refractive Imaging Optical System. Doctoral Dissertation, University of Chinese Academy of Sciences, Beijing, China, 2018. [Google Scholar]
- Asadnezhad, M.; Eslamimajd, A.; Hajghassem, H. Optical system design of star sensor and stray light analysis. J. Eur. Opt. Soc. -Rapid Publ. 2018, 14, 9. [Google Scholar] [CrossRef]
- Liu, Z.; Wang, J.; Leng, R.; Wang, X.; Zhang, M.; Wang, J.; Cai, M.; Li, W.; Liu, B.; Li, L.; et al. Impact of mirror local defects on system scattering in telescopes. Results Phys. 2023, 2023, 107265. [Google Scholar] [CrossRef]
- Wang, H.; Chen, Q.; Ma, Z.; Yan, H.; Lin, S.; Xue, Y. Development and prospect of stray light suppression and evaluation technology (Invited). Acta Photonica Sin. 2022, 51, 0751406. [Google Scholar]
- Liang, Z.J.; Yang, Y.Y.; Zhao, H.Y.; Liu, S.A. Research progress and latest application of surface shape testing technology for aspheric optical components. China Opt. 2022, 15, 161–186. [Google Scholar]
- Malacara, D. Optical Shop Testing, 3rd ed.; Wiley: Hoboken, NJ, USA, 2007. [Google Scholar]
- Glauert, A. Superposition Effects in Multiple-Beam Interference Fringes. Nature 1951, 168, 861–862. [Google Scholar] [CrossRef]
Disclaimer/Publisher’s Note: The statements, opinions and data contained in all publications are solely those of the individual author(s) and contributor(s) and not of MDPI and/or the editor(s). MDPI and/or the editor(s) disclaim responsibility for any injury to people or property resulting from any ideas, methods, instructions or products referred to in the content. |
© 2024 by the authors. Licensee MDPI, Basel, Switzerland. This article is an open access article distributed under the terms and conditions of the Creative Commons Attribution (CC BY) license (https://creativecommons.org/licenses/by/4.0/).