1. Introduction
Dispersive Fourier transform (DFT) presents a promising approach for the detection of fast non-repetitive events in a wide range of applications [
1,
2], and especially to replace conventional spectrum analyzers with low scanning rates, thereby enabling high-speed real-time spectroscopic measurements [
3]. The DFT method relies on frequency-to-time mapping achieved through the time stretching of an ultra-short optical pulse under study, employing group-velocity dispersion (GVD) provided, for example, by a large span of the optical fiber. As the pulse propagates through a dispersive medium, different spectral components become temporally separated, allowing the broadened pulse to faithfully reproduce its input spectrum. Then, a single-pixel fast photodetector followed by an appropriate analog-to-digital converter is sufficient to acquire and derive the actual radiation spectrum. The efficiency of the DFT method has been demonstrated in various applications, including single-shot characterization of extreme events in optical supercontinuum generation [
4,
5,
6], and the investigation of spectral variations in outputs of mode-locked fiber lasers [
7,
8,
9,
10], as well as wavelength-resolved polarization state along an each ultrashort pulse [
11], and more broadly, for studying nonlinear dynamics in optical systems [
12].
At the same time, the spectral-to-time mapping appeared to bring benefits into absorption spectroscopy of gas mixtures and searching molecular fingerprints. Initially realized with a chirped pulsed quantum-cascade laser for 1,1-difluoroethylene spectroscopy at 10.26 μm [
13], DFT spectroscopy has been effectively applied to investigate the absorption spectra of CH
, utilizing a supercontinuum source [
14]. An unprecedented acquisition rate of DFT spectrometry has facilitated the real-time visualization of chemical reactions during the combustion process of acetylene [
15]. Additionally, the DFT approach has been tested for fiber Bragg grating interrogation [
16]. Recent advancements include several DFT-based techniques that enhance the capabilities of spectral-to-time mapping for spectroscopy. Among these is the combination of optical sampling and DFT spectroscopy, relying on the dynamical tuning of the cavity of the master oscillator mode-locked laser [
17]. This approach eliminates the need for fast photodetectors and acquisition devices typically required in the DFT paradigm. Another example is the implementation of self-heterodyning into the conventional DFT scheme [
18], transferring the time-mapped optical spectrum to the radio-frequency Fourier space. This technique has proven useful for probing HCN absorption in the 1.5 μm range [
18,
19].
Among the various gases of interest for spectroscopic measurements, ammonia stands out prominently due to its status as a well-known environmental gas and its crucial role as a target gas in industrial and agricultural process monitoring, health surveillance, and air pollution studies. The second overtone of the vibrational excitation of ammonia falls within the range of approximately 1520–1530 nm. This positioning makes erbium fibers, endowed with gain in the telecommunication C-band spectral range, promising candidates for creating light sources with ultra-short pulses. Consequently, DFT spectroscopy of ammonia emerges as a potentially fruitful approach. However, the design of a pulsed laser precisely at the ammonia absorption wavelengths can be challenging. Shifting the generation of erbium laser radiation to the short-wavelength end of the amplification spectrum necessitates the use of specialized techniques, such as intracavity spectral filtering or the control of polarization states. It has been demonstrated that spectral filtering, while not disrupting the process of mode locking [
20] and the generation of dissipative solitons [
21], can significantly alter the generation parameters. Consequently, the generation of picosecond pulses in erbium lasers has previously been achieved by integrating filters with sufficiently large spectral widths, such as a Lyot filter [
22] or a tunable interferometric filter [
23]. Techniques like controlling effective losses with an attenuator [
24] and polarization control [
25] can also facilitate lasing near 1530 nm.
In this study, we implement ammonia spectroscopy employing the DFT method for the first time. To achieve this, we designed a pulsed fiber laser with intracavity filtering, operating at a wavelength of 1531.6 nm. The short duration of laser pulses enabled the utilization of the spectral-to-time mapping method with a resulting resolution of 0.2 nm. Consequently, this opened the avenue for conducting ammonia spectroscopy. We showed that even the weak absorption of 10–20 cm/molecule exhibited by ammonia near wavelengths of 1530 nm can be used for its detection using the conventional erbium-doped mode-locked laser.
Our estimates indicate that the created DFT scheme is capable of detecting NH concentrations as low as 0.1%. Furthermore, we explore the potential for enhancing sensitivity to probe concentrations at the ppm level. The implemented approach is distinguished by its ability to measure down to the microsecond time scale. Although the speed of spectroscopic measurement was not an important parameter in the current work, this advantage of the proposed DFT system can be used, for example, in applications related to monitoring reaction rates in chemical plants, where a fast acquisition rate is desirable.
2. Materials and Methods
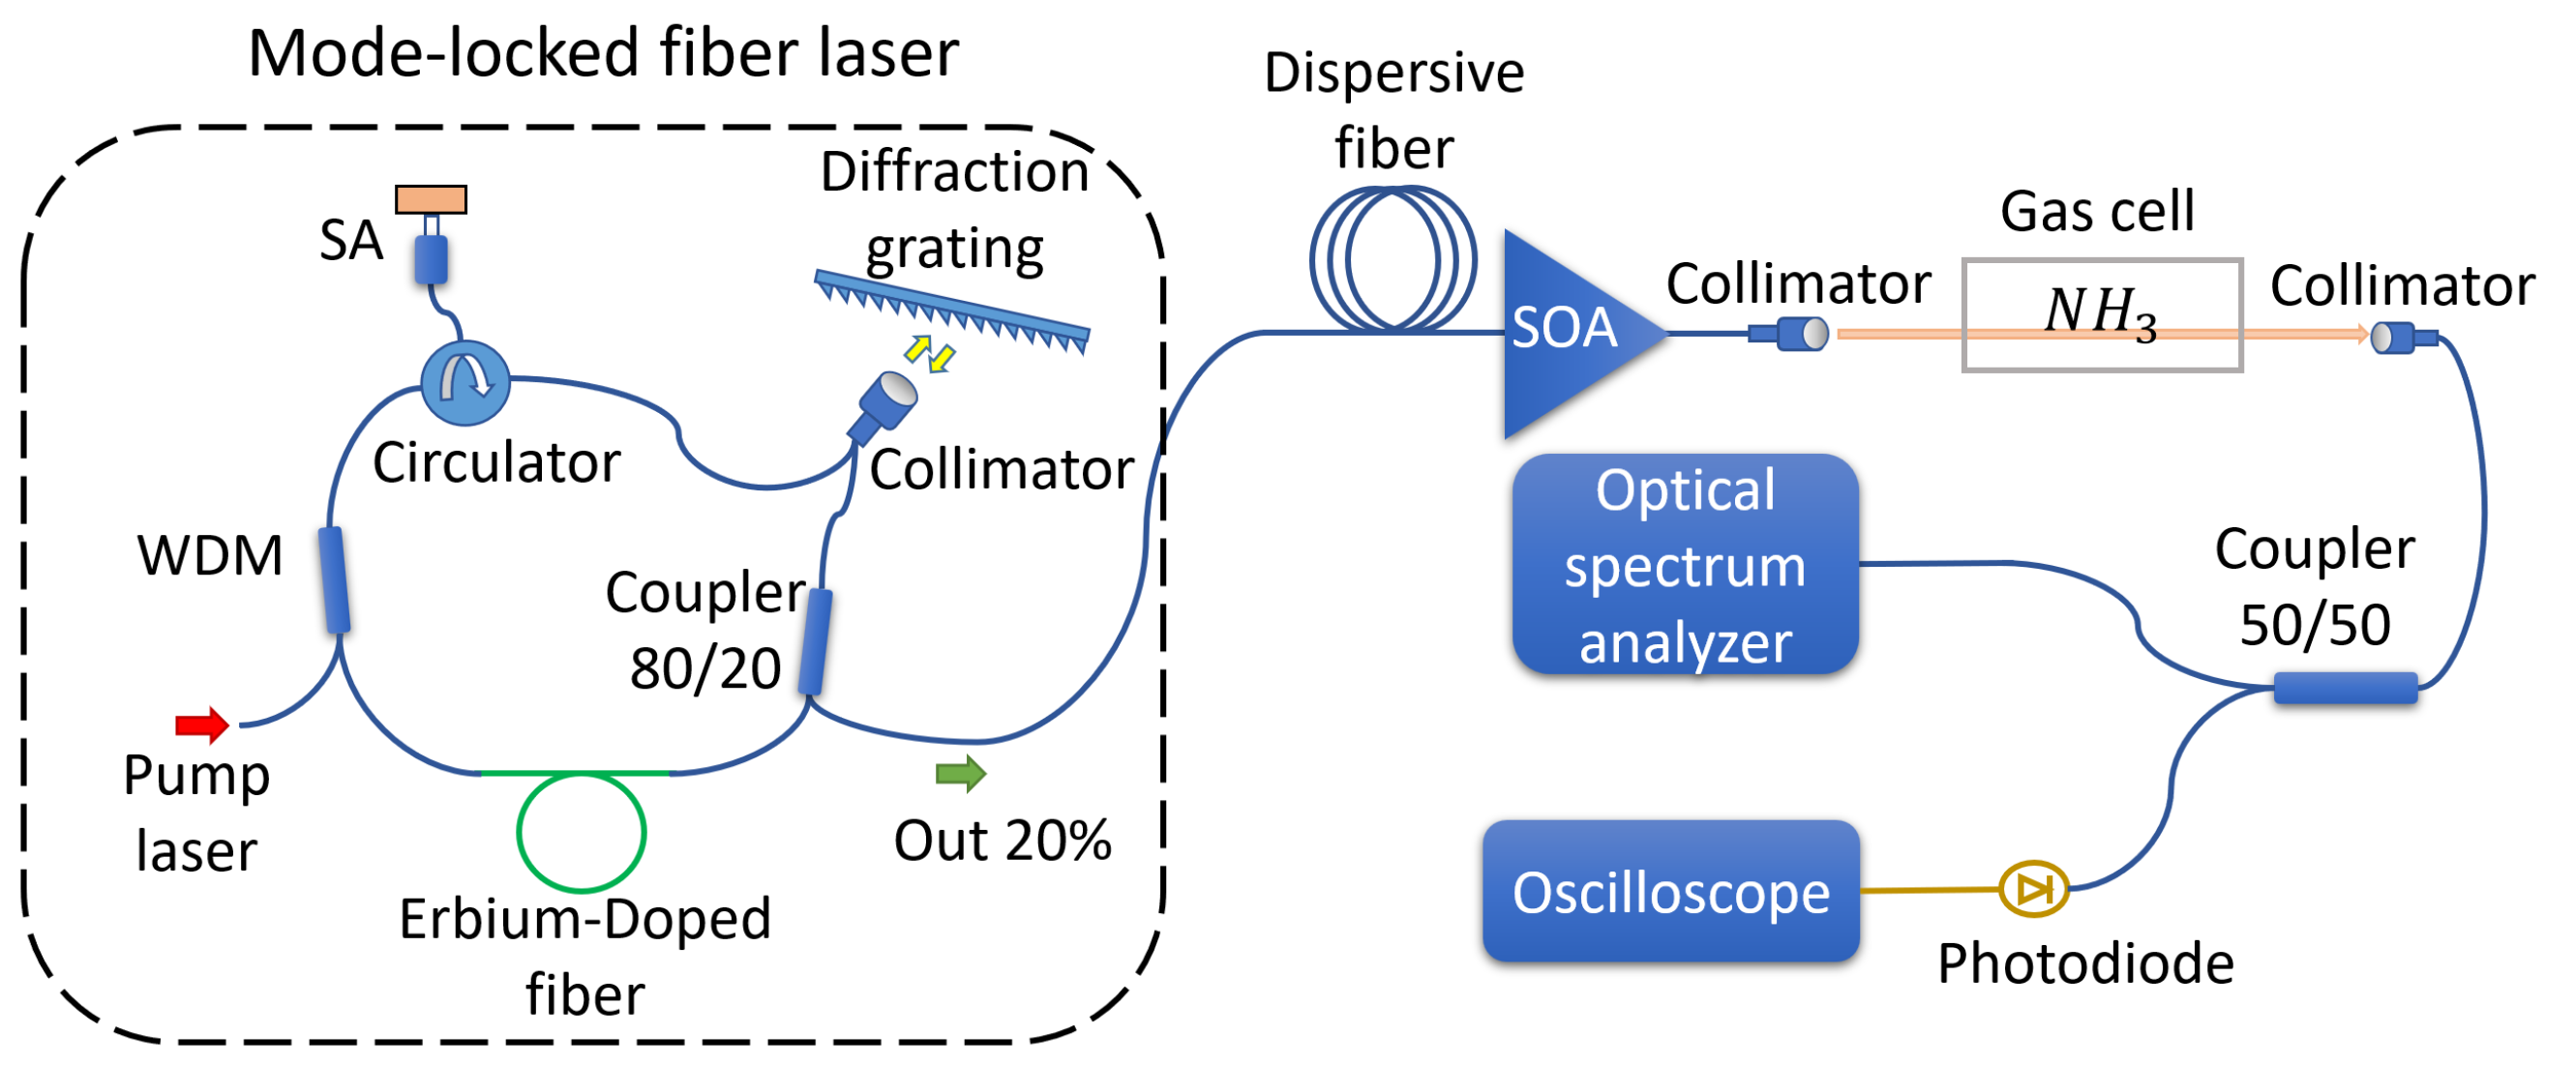
The experimental setup is shown in
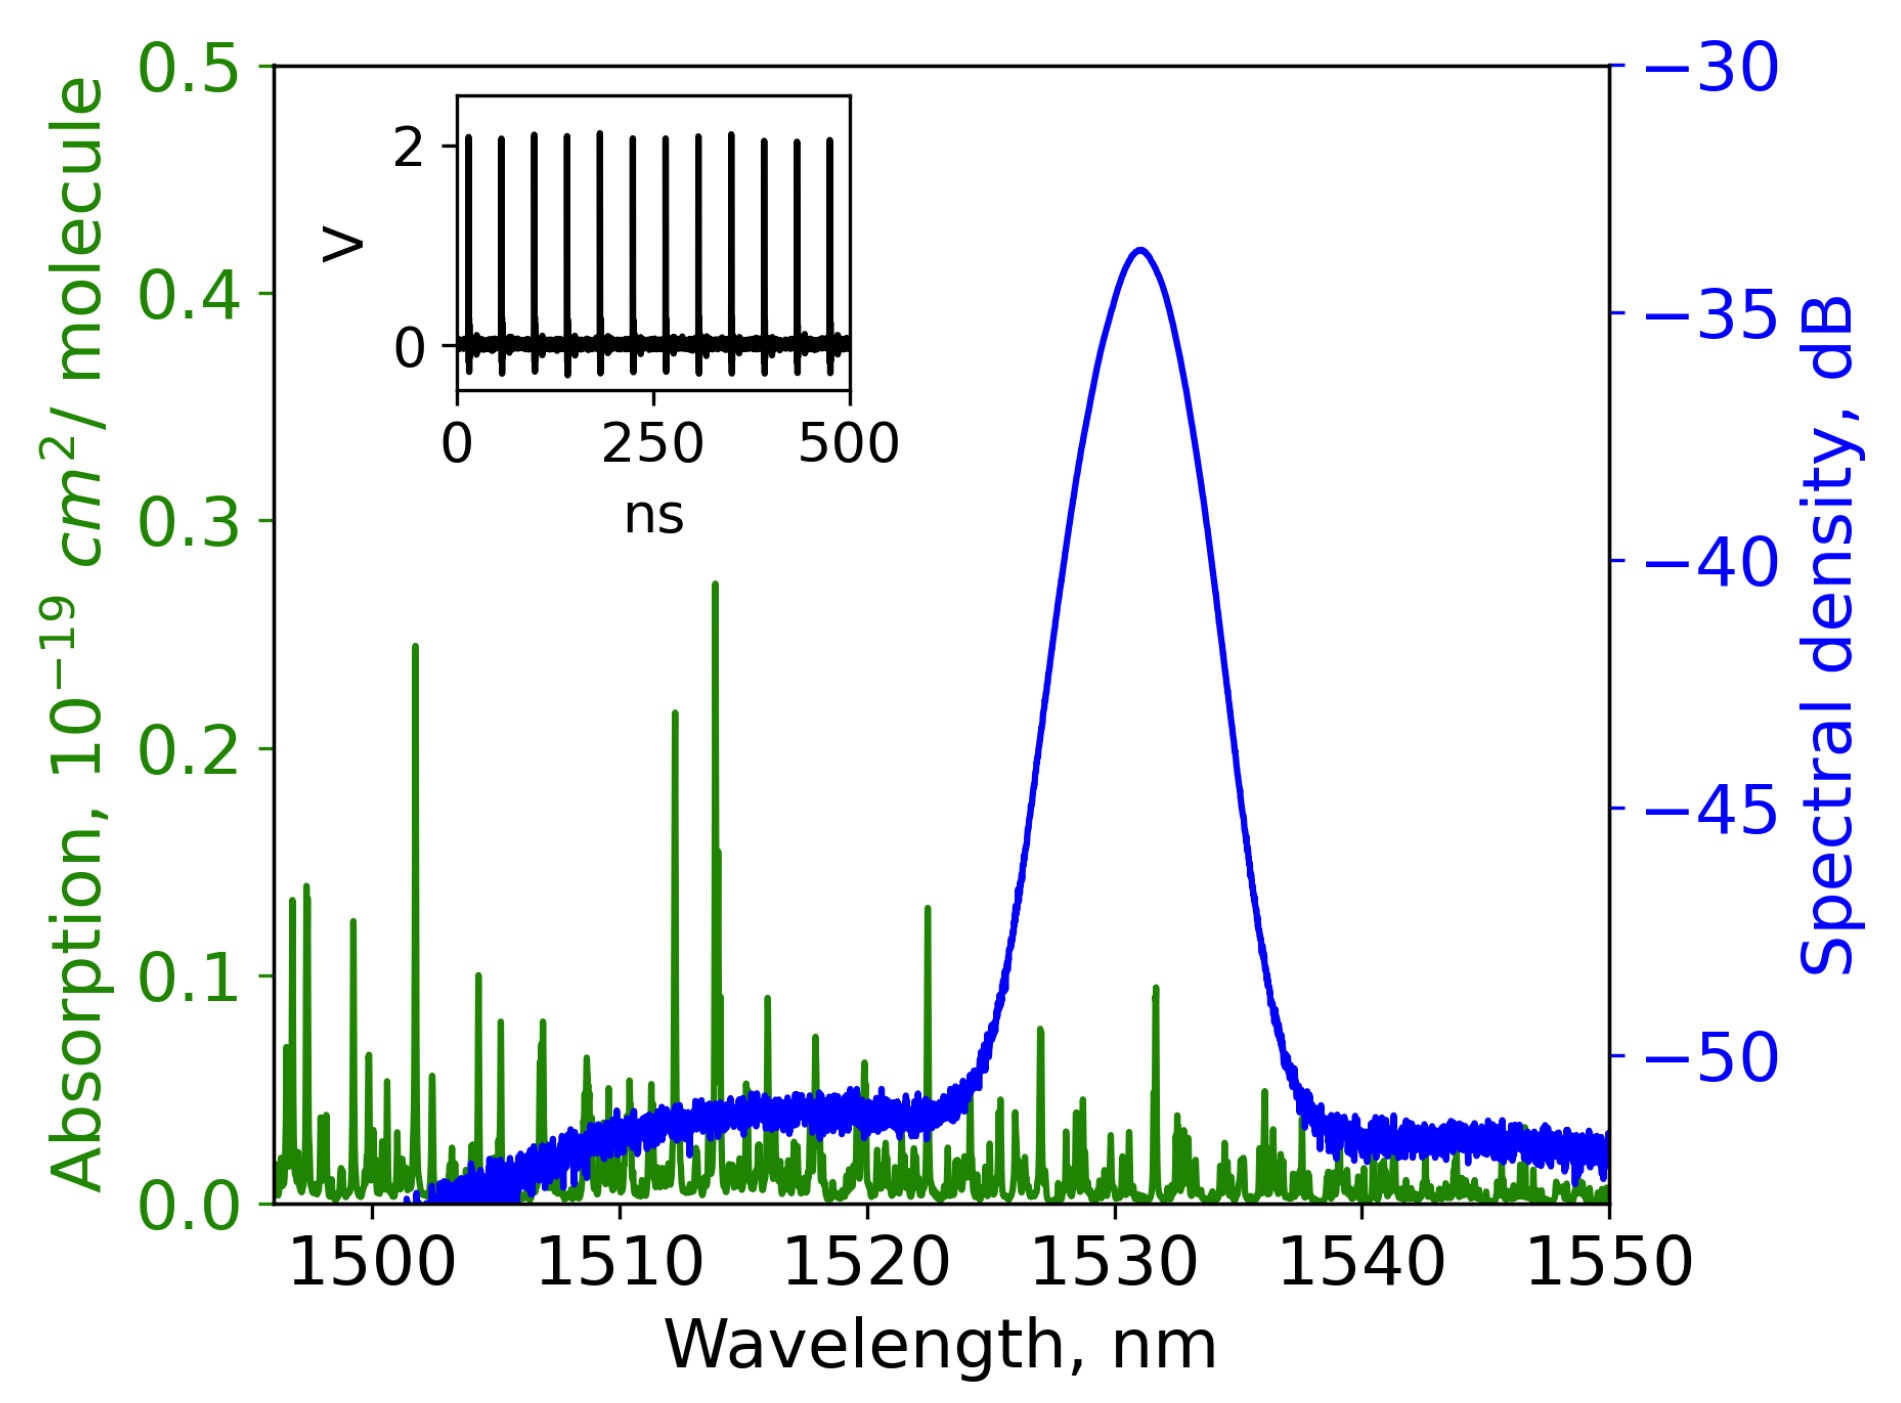
Figure 1. As a source of short pulses suitable for DFT, we implemented a mode-locked fiber laser. The ring cavity of the laser comprised 0.2 m of the Erbium-doped mode with an absorption of 80 dB/m. The full length of the cavity was 8.2 m, corresponding to a repetition rate of 25 MHz. Mode locking was ensured with a reflective semiconductor saturable absorber (BATOP Optoelecronics SAM-1550-25-5ps-FC/APC-PMF1550) incorporated into the cavity by an optical circulator. To adjust the central wavelength of the generation, we introduced a tunable filter based on a reflective diffraction grating with 600 grooves per millimeter and a dual fiber collimator. The filter had a 3 dB bandwidth of 10.9 nm and 2.17 dB losses. The central wavelength of the filter was tuned to 1531.6 nm, corresponding to one of the strong NH
absorption lines concentrated at 1.5 μm. Note that by tuning to wavelengths shorter than 1528 nm, the mode-locked generation is ceased. The resulting generation spectrum in the mode-locked regime at this wavelength appeared to be 3.2 nm wide (see
Figure 2). The pulse duration, measured with an intensity autocorrelator, was estimated as 2 ps. The average power was measured at 80 μW, resulting in a peak power of 1.6 W.
The ultrashort pulses emitted by the master oscillator passed through a telecommunication dispersion compensation module with a net dispersion of −470 ps/nm at a wavelength of 1530 nm. As a result of this distortion, the pulse duration increased from 2 ps to 2 ns. Adhering to the principles of energy conservation, the peak power of the pulse underwent a significant reduction passing through the dispersive fiber. To counteract this reduction, we employed the Thorlabs semiconductor optical amplifier (SOA 1013S) with a gain of 20.5 dB to enhance the pulse power. Following the amplification by the SOA, the pulses were directed into free space using a collimator, passed through a custom-made gas cell with a 20 cm optical path, and were then recaptured by another collimator. The optical signal, carrying information about the transmission spectrum, was subsequently divided into two channels to enable the simultaneous comparison of different gas analysis methods. The first channel involved DFT measurements utilizing the single-pixel photodetector Keyang KY-BPRM-20G-I-FA (with an electrical bandwidth of 20 GHz) and the Agilent Technologies Infiniium DSO-X 92004A oscilloscope (with an 80 GS/s acquisition rate and a 20 GHz electrical bandwidth). The second channel employed a conventional Fourier spectroscopy approach, utilizing the commercially available optical spectrum analyzer (OSA) Redstone OSA305 with a typical resolution of 16 pm.
To estimate the concentration, one should derive the transmission spectrum at the peak absorbance of a gas, or, in general, retrieve the entire transmission spectrum within the range of interest. In accordance with the Beer–Lambert law, the concentration can be determined by:
where
represents the initial pulse peak power before the gas cell,
denotes the output power,
is the absorption coefficient
,
L is the length of a gas cell, and
corresponds to the transmittance in dB. We calculated the ammonia absorbance using the HITRAN database at 0 Celsius degrees and a pressure of 1 atmosphere, without apodization, and using the Hartmann–Tran profile at negligible concentrations of ammonia. Note that this calculation does not imply resonance collision broadening that may occur at a higher NH
concentration. That may bring relative error at the high concentrations, which we estimated at 1%.
The spectral power is reconstructed from the time traces within the spectrum-to-time paradigm, taking into account the net dispersion of the DFT system. The time grid is converted to a wavelength grid as . It is important to note that there is an uncertainty in the central wavelength that cannot be defined from the DFT measurements.
The resolution of the DFT system, denoted as
, is constrained by various factors [
1]. The first factor is the sampling rate of the digitizer, limiting the spectrometer’s resolution to
, where
is the digitizer’s sampling rate. The second factor arises from the analog bandwidth of the detection system, restricting the resolution to
, where
B is the bandwidth of the detection system (the maximum bandwidth of digitizer and photodetector). Lastly, the dispersion process introduces an additional limitation, expressed as
, where
c is the speed of light, and
is the central wavelength of the radiation. The ultimate resolution is determined by the maximum value among these three limiting factors:
In the employed measurement system, the implemented DFT-spectrometer achieves a resolution of 182 pm, constrained by . It should be noted that the NH absorption line at 1531.6 nm has a line width of 40 pm. Consequently, the DFT-derived transmission spectrum is expected to exhibit significant distortion.
3. Results
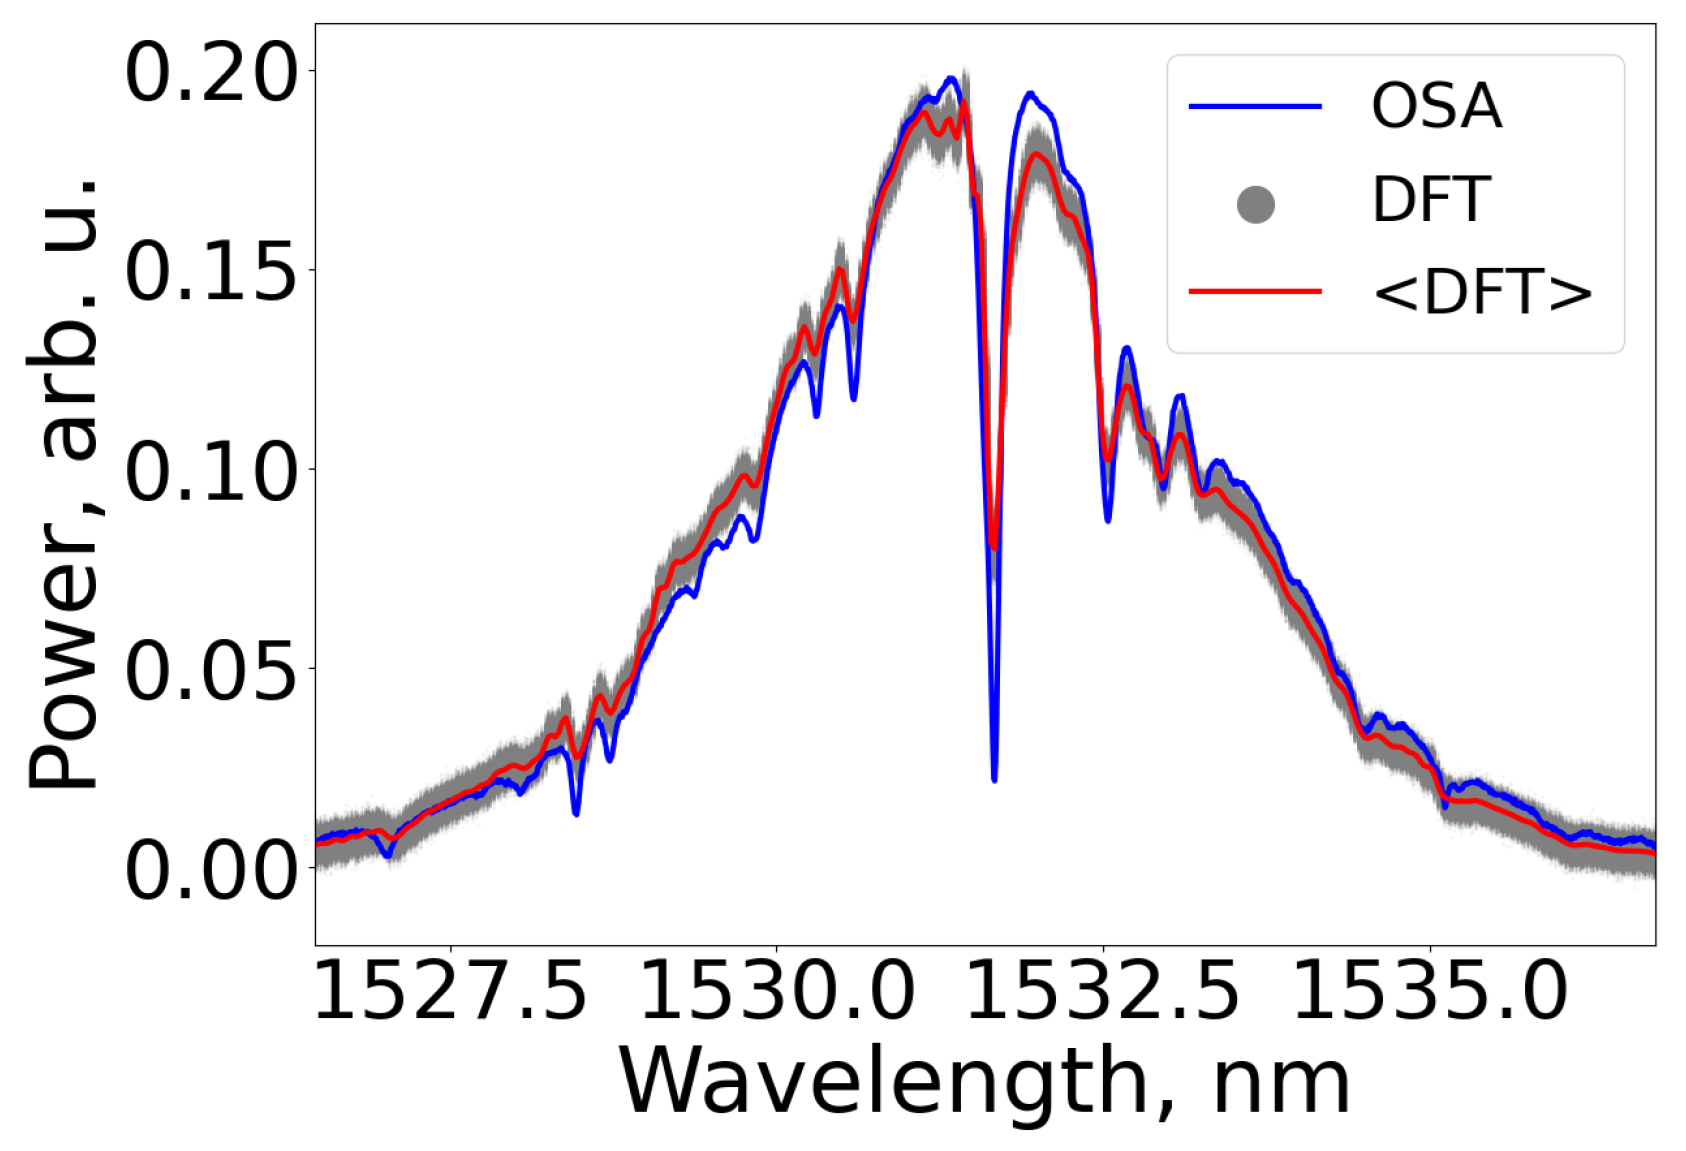
We initially estimated the DFT spectrometer’s performance by comparing the derived spectra with the spectrum obtained by a conventional Fourier spectrometer. Given that high temporal resolution is not critical for the particular study, we averaged spectra acquired from time traces of 6400 consecutive pulses, resulting in an effective time resolution of 0.128 milliseconds. To facilitate a proper comparison, we normalized spectra measured with both the DFT and the optical spectrum analyzer. Despite the disparity in resolutions between the DFT and OSA, as illustrated in
Figure 3, the DFT spectrometer provided reliable data, exhibiting good agreement with the commercial OSA. Note that there are many absorption lines falling into the generation spectrum (as per
Figure 2); spectra of the radiation transmitted through the gas appeared to have many low-prominent dips, with the most intense appearing at 1531.6 nm. The resolution difference between DFT and OSA introduced distortions in the depth of the absorption lines. Notably, a narrow peak preceding the main absorption line was observed, originating from the photodetector’s apparatus function [
14]. In the temporal domain, this peak emerges just after the absorption line. The transmission spectrum was subsequently determined by comparing it with the reference spectrum measured for the empty gas cell.
Whereas the DFT resolution falls short in accurately measuring the depth of the absorption line, we chose the integral form of the Beer–Lambert law to precisely determine the NH
concentration:
where
is a concentration as a percentage,
is the gas molar volume under normal conditions, and
is Avogadro’s constant. Here,
and
should be chosen such that the entire broadened absorption dip in the transmission spectrum lies within the interval [
,
]. We set
, with the integration length being four times the DFT resolution. Thus, the integral was calculated over the red highlighted part of the transmission spectrum shown in
Figure 4.
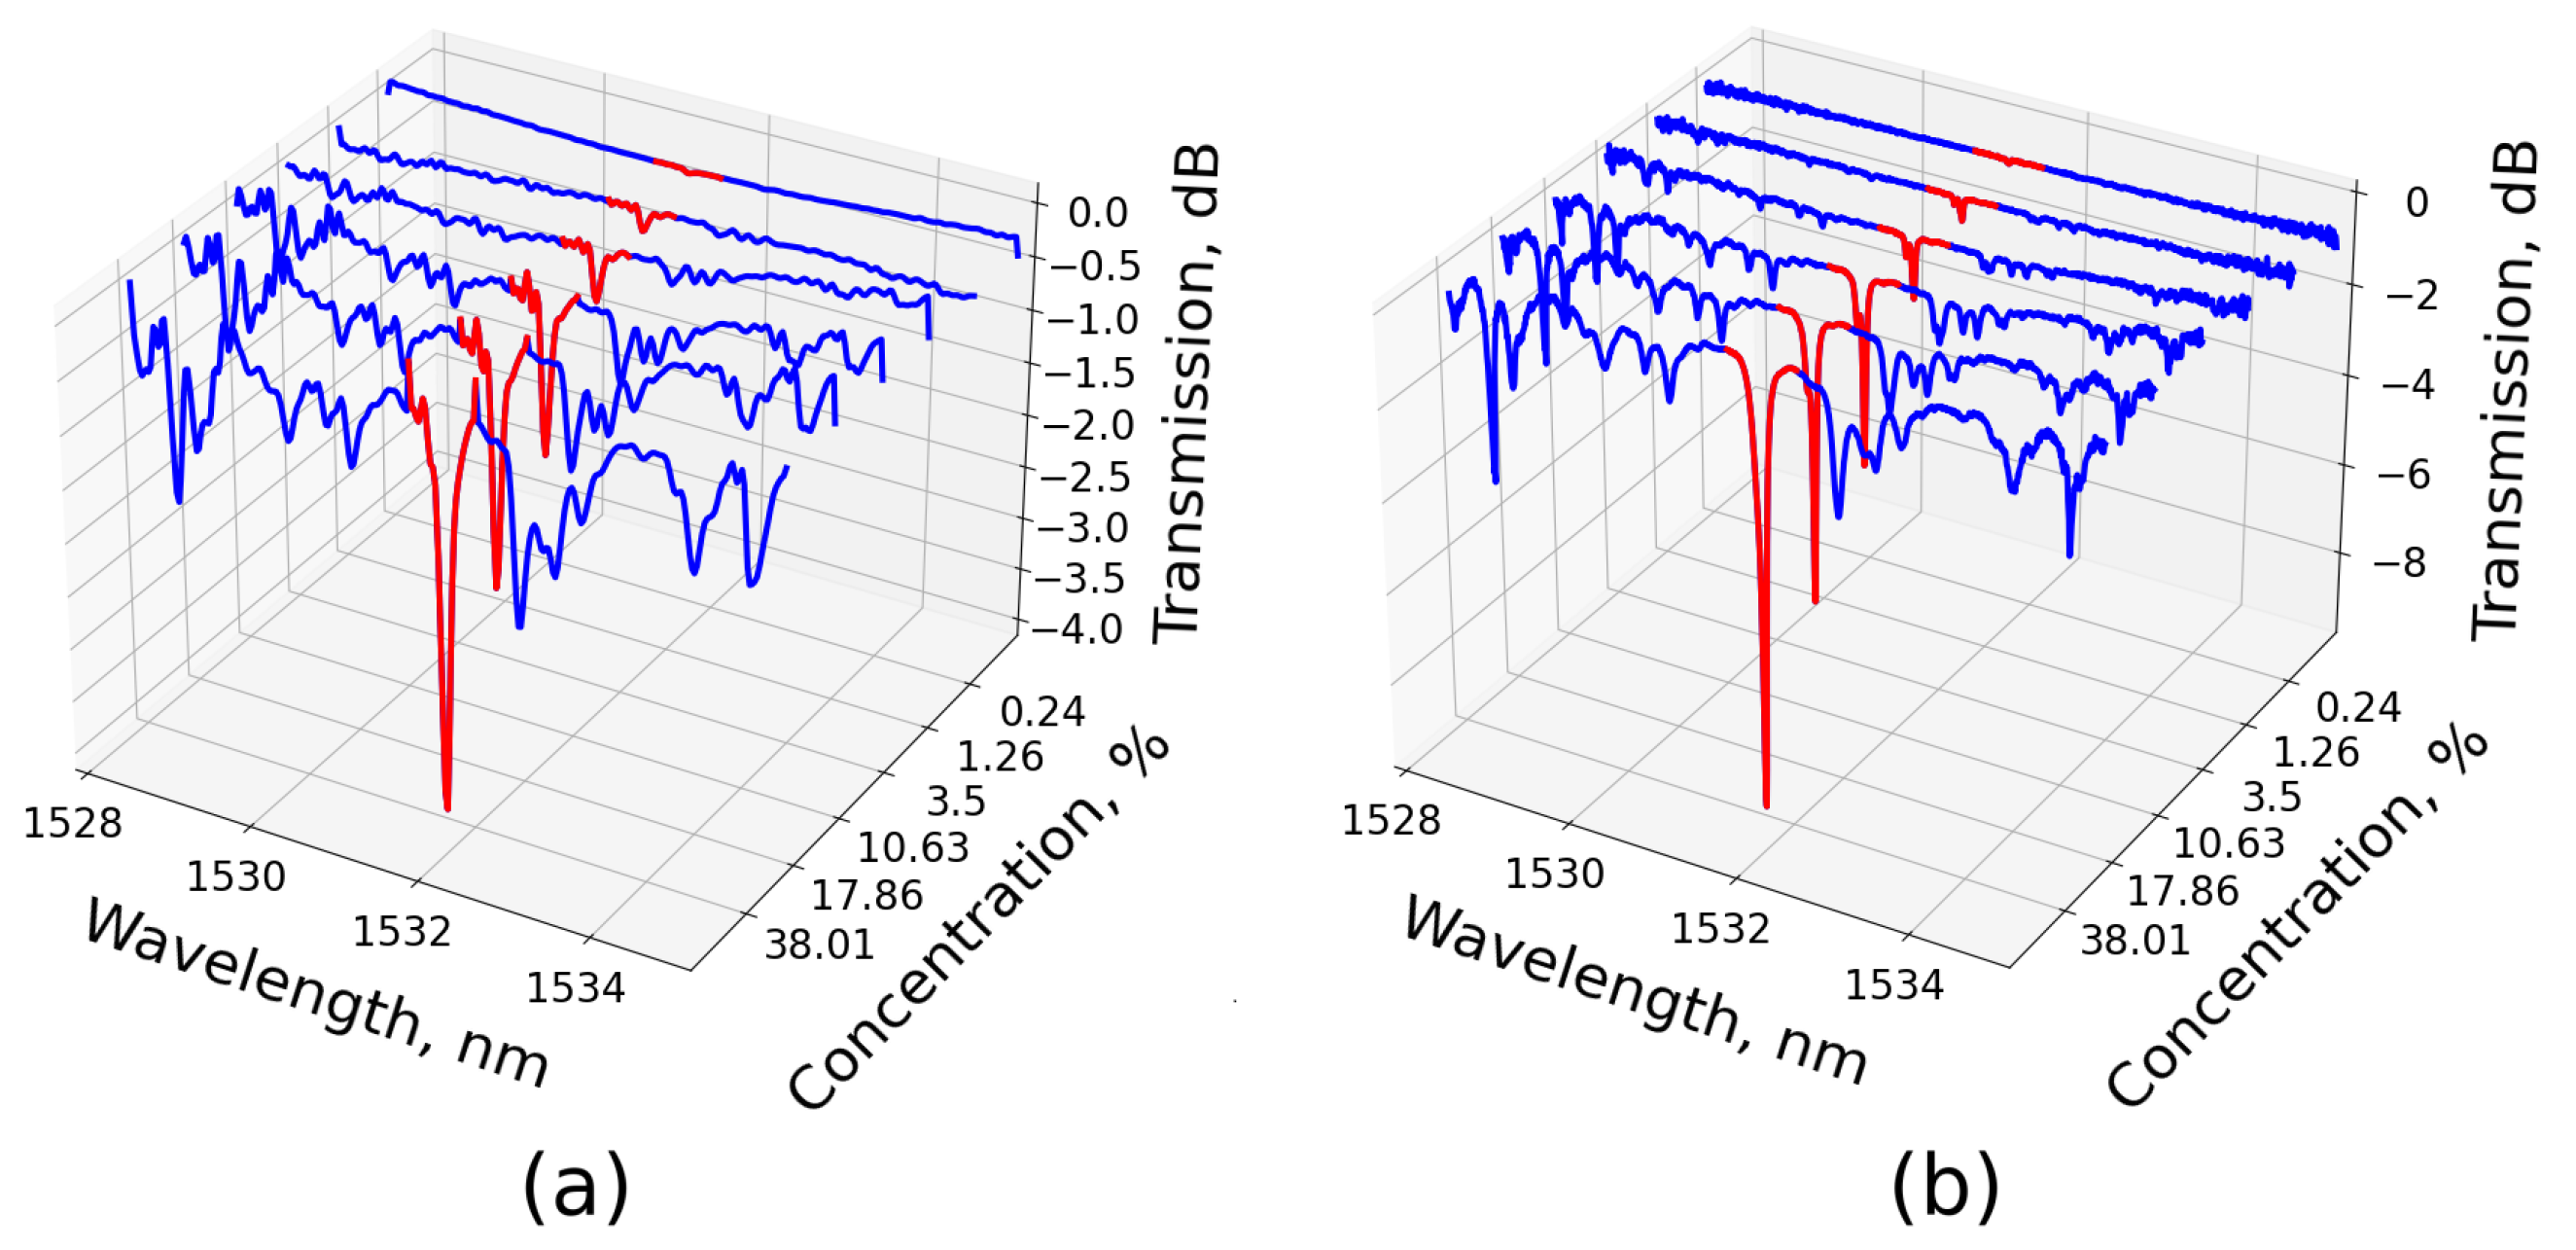
To assess the DFT spectrometer’s capability for quantitative NH3 detection, we conducted the following experiment: initially, the gas cell was filled with a mixture of NH and air, achieving a concentration in the tens of percent range at the atmospheric pressure, and the spectral measurement was performed. Subsequently, the cell was purged with air to reduce the NH concentration while maintaining the atmospheric pressure within. Then, the spectral measurement for the new concentration was conducted. This cycle was repeated multiple times. The volume of the cell was 500 cm. After completely purifying the cell from NH, the baseline spectrum was measured. This spectrum served as a reference to account for all drawbacks of the gas cell, including optical losses, reflections at the cell walls, and the impact of the Fabry–Perot interferometer introducing incidental weak modulation into the transmission spectrum.
With this approach, we investigated different concentrations of ammonia ranging from 40% down to a tenth of a percent (see
Figure 5a). We assumed the measurements made by the commercial OSA to be absolutely reliable, given its higher resolution than the absorption line width. We explored the discrepancy between the DFT and OSA methods, revealing that the two methods provided well-coincided results with a small relative error at high concentrations. However, the error increased at the level of a single percent (see
Figure 5b). The systematic nature of the error was evident, leading to a reduction in the value provided by the DFT method. This effect was attributed to the appearance of side lobes in the time trace due to the finite electrical bandwidth of the system. At higher concentrations, the absorption line increased, causing the side lobes to rise above the baseline level of the transmission curve. Consequently, this positive contribution to the integral in the Beer–Lambert law reduced the concentration value measured by the DFT method.
4. Discussion
The minimum detectable concentration
of the DFT method is determined by the noises of the acquisition system and the optical master oscillator. The gas can still be traced if the absorption dip in the measured transmission spectrum is larger than the noises present in the time trace used for spectrum reconstruction:
where
is the noise level,
is the reference signal level (the signal measured without absorption),
is the resolution of the DFT system, and
is the absorption line spectral width.
As we apply the averaging of the pulse train and use integral absorption, the minimum detectable concentration should acquire a statistical factor:
where
N is the number of averaged pulses, and
M is the number of points in the integral. In our experiments,
and
.
In general, several sources of disturbance contribute to the noise in the time trace of the DFT signal. Firstly, there are noises from the pulse laser, including pulse jitter and amplitude jitter. Secondly, the SOA utilized to amplify the signal possesses a gain that also experiences fluctuations. These two types of noises are attributed as optical noises. Thirdly, there are detector noises, mainly shot noise and thermal noise, contributing at high frequencies. Lastly, there are noises from the oscilloscope, including amplification noise and quantization distortion. These two types of noises, attributed to electrical noises
, may be estimated with measurements of background noise at the absence of the signal at the scope’s input. The joint impact of the optical and electronic noises can be estimated from the statistics acquired for the large pulse train as it appears in
Figure 3. With the given electrical amplification set in our experiments, the electrical noise level amounts to
mV RMS, while the joint impact of both optical and electrical noises yields
mV RMS, which with
mV gives the signal-to-noise ratio of 19 dB. In this case, the minimum detectable concentration is of the order of 0.1%, which aligns well with the minimum concentration observed in the experiments (see
Figure 5). Note that optical noises such as pulse jitter do not have a profound effect on the minimal detectable concentration, being only two times larger than the electrical noises.
To enhance the sensitivity of the spectrometer and lower the minimum detectable concentration to several ppm, which could be of practical interest, various approaches are possible. In addition to the straightforward method of increasing the optical path (using commercial multipass gas cells with an effective length of tens of meters), one can introduce a dispersive element with greater dispersion. However, the additional DCF fiber brings considerable losses that must be compensated with another optical amplifier. Alternatively, a dispersive element can be created using a chirped fiber Bragg grating (CFBG), which can provide dispersion up to 2 ns/nm [
26], or by utilizing the intermodal dispersion in a multimode fiber [
1]. Employing both a multipass gas cell along with a ten-fold dispersion line and utilizing master oscillators with higher pulse energies (which, in principle, can be 1 nJ and higher [
27,
28,
29]) would bring DFT spectroscopy to ppm-level accuracy while preserving its fast response of 0.2 ms. However, it should be noted that adding dispersion should be followed by additional amplification, not only due to losses but also to conserve its peak power. Stretching the pulse by a factor of
reduces the peak power
by this factor, adversely affecting the resulting minimum detectable concentration.
Another challenge preventing the practical application of DFT systems is the high cost associated with broad bandwidth photodetectors and oscilloscopes. However, as the resolution is inversely proportional to the measurement system bandwidth and net dispersion, increasing the latter becomes necessary to maintain both the resolution and the minimum detectable concentration. This implies that limiting the photodetector and oscilloscope bandwidth to 1 GHz, in order to preserve a resolution of ∼200 pm in our measurement setup, requires a tenfold increase in net dispersion. It is important to note that the peak power is reduced by the same order due to this adjustment, necessitating a 1 dB increase in gain to maintain the minimum detectable concentration. This complication adds challenges to the efforts aimed at cost reduction.
5. Conclusions
We investigated the capability of NH concentration analysis using the DFT method. To achieve spectrum-to-time mapping, we developed a pulsed fiber laser as a master oscillator, employing SESAM for mode locking. The central wavelength was tuned by adjusting the intracavity filter based on a diffraction grating with a bandwidth of 10.9 nm and 2.17 dB losses. The resulting output pulses exhibited a spectrum width of 3.2 nm, pulse duration of 2 ps, average power of 80 μW, and a repetition rate of 25 MHz. The DFT spectrometer proposed in this study possesses a resolution of 0.2 nm, enabling a minimum detectable concentration of NH on the order of 0.1%, despite its weak absorption of only 10–20 cm/molecule near the operation wavelength of the laser. The achieved resolution and sensitivity open avenues for practical applications, demanding high acquisition rates, such as monitoring intermediate the products of chemical reactions in chemical production, where the fast and easily implemented proposed realization might be especially desirable. Potentially, an increase in sensitivity can be achieved by using a mode-locked laser with a higher peak power, as well as by utilizing a multipath gas cell and stronger dispersion line. In general, our suggested enhancements provide a roadmap for further improving the method’s performance in gas sensing and related domains.
Author Contributions
Conceptualization, I.D.V. and A.A.R.; methodology, A.A.R., N.A.A., D.S.K. and I.D.V.; investigation, N.A.A.; resources, I.D.V. and D.S.K.; data curation, I.D.V. and D.S.K.; writing—original draft preparation, N.A.A.; writing—review and editing, N.A.A., I.D.V., D.S.K. and A.A.R.; supervision, I.D.V. and A.A.R.; project administration, I.D.V.; funding acquisition, A.A.R. All authors have read and agreed to the published version of the manuscript.
Funding
This research was funded by the Ministry of Education and Science of the Russian Federation (FSUS-2021-0015) and by the state budget of IAE SB RAS (project No 121030500067-5).
Institutional Review Board Statement
Not applicable.
Informed Consent Statement
Not applicable.
Data Availability Statement
Data underlying the results presented in this paper are not publicly available but may be obtained from the authors upon reasonable request.
Conflicts of Interest
The authors declare no conflicts of interest.
References
- Goda, K.; Jalali, B. Dispersive Fourier Transformation for Fast Continuous Single-Shot Measurements. Nat. Photon. 2013, 7, 102–112. [Google Scholar] [CrossRef]
- Godin, T.; Sader, L.; Khodadad Kashi, A.; Hanzard, P.-H.; Hideur, A.; Moss, D.J.; Morandotti, R.; Genty, G.; Dudley, J.M.; Pasquazi, A.; et al. Recent advances on time-stretch dispersive Fourier transform and its applications. Adv. Phys. X 2022, 7, 2067487. [Google Scholar] [CrossRef]
- Mahjoubfar, A.; Churkin, D.V.; Barland, S.; Broderick, N.; Turitsyn, S.K.; Jalali, B. Time Stretch and Its Applications. Nat. Photonics 2017, 11, 341–351. [Google Scholar] [CrossRef]
- Solli, D.R.; Ropers, C.; Koonath, P.; Jalali, B. Optical Rogue Waves. Nature 2007, 450, 1054–1057. [Google Scholar] [CrossRef]
- Godin, T.; Wetzel, B.; Sylvestre, T.; Larger, L.; Kudlinski, A.; Mussot, A.; Ben Salem, A.; Zghal, M.; Genty, G.; Dias, F.; et al. Real Time Noise and Wavelength Correlations in Octave-Spanning Supercontinuum Generation. Opt. Express 2013, 21, 18452. [Google Scholar] [CrossRef]
- Meng, F.; Lapre, C.; Billet, C.; Sylvestre, T.; Merolla, J.M.; Finot, C.; Turitsyn, S.K.; Genty, G.; Dudley, J.M. Intracavity Incoherent Supercontinuum Dynamics and Rogue Waves in a Broadband Dissipative Soliton Laser. Nat. Commun. 2021, 12, 5567. [Google Scholar] [CrossRef]
- Chernysheva, M.; Sugavanam, S.; Turitsyn, S. Real-Time Observation of the Optical Sagnac Effect in Ultrafast Bidirectional Fibre Lasers. APL Photonics 2020, 5, 016104. [Google Scholar] [CrossRef]
- Runge, A.F.J.; Aguergaray, C.; Broderick, N.G.R.; Erkintalo, M. Coherence and Shot-to-Shot Spectral Fluctuations in Noise-like Ultrafast Fiber Lasers. Opt. Lett. 2013, 38, 4327. [Google Scholar] [CrossRef]
- Peng, J.; Sorokina, M.; Zeng, H. Spectral Correlations in Laser Instabilities Beyond Stable Mode Locking. J. Light. Technol. 2021, 39, 6579–6584. [Google Scholar] [CrossRef]
- Runge, A.F.J.; Broderick, N.G.R.; Erkintalo, M. Observation of Soliton Explosions in a Passively Mode-Locked Fiber Laser. Optica 2015, 2, 36. [Google Scholar] [CrossRef]
- Wu, Q.; Gao, L.; Cao, Y.; Wabnitz, S.; Chang, Z.; Liu, A.; Huang, J.; Huang, L.; Zhu, T. Single-shot measurement of wavelength-resolved state of polarization dynamics in ultrafast lasers using dispersed division-of-amplitude. Photonics Res. 2023, 11, 35–43. [Google Scholar] [CrossRef]
- Dudley, J.M.; Dias, F.; Erkintalo, M.; Genty, G. Instabilities, Breathers and Rogue Waves in Optics. Nat. Photonics 2014, 8, 755–764. [Google Scholar] [CrossRef]
- Normand, E.; McCulloch, M.; Duxbury, G.; Langford, N. Fast, Real-Time Spectrometer Based on a Pulsed Quantum-Cascade Laser. Opt. Lett. 2003, 28, 16. [Google Scholar] [CrossRef]
- Hult, J.; Watt, R.S.; Kaminski, C.F. High Bandwidth Absorption Spectroscopy with a Dispersed Supercontinuum Source. Opt. Express 2007, 15, 11385. [Google Scholar] [CrossRef]
- Mance, J.G.; La Lone, B.M.; Madajian, J.A.; Turley, W.D.; Veeser, L.R. Time-Stretch Spectroscopy for Fast Infrared Absorption Spectra of Acetylene and Hydroxyl Radicals during Combustion. Opt. Express 2020, 28, 29004. [Google Scholar] [CrossRef]
- Yamaguchi, T.; Endo, W.; Shinoda, Y. Real-Time Spectroscopy System for Continuous Measurement with Fourier-Domain Mode-Locked Laser at 1550 Nm. IEEE Sens. Lett. 2021, 5, 1–4. [Google Scholar] [CrossRef]
- Soundararajan, S.J.; Duan, L. Real-Time TWOS Spectroscopy with Sub-GHz Resolution and High Sensitivity. Opt. Express 2021, 29, 41512. [Google Scholar] [CrossRef]
- Zhang, Z.; Xia, H.; Yu, S.; Zhao, L.; Wei, T.; Li, M. Femtosecond Imbalanced Time-Stretch Spectroscopy for Ultrafast Gas Detection. Appl. Phys. Lett. 2020, 116, 171106. [Google Scholar] [CrossRef]
- Jin, B.; Jia, L.; Zhang, F.; Qu, X.; Zheng, J.; Niu, Q.; Gu, W. High-Precision Nanosecond Detection of a Gas Absorption Spectrum Based on Optical Frequency Comb Time–Frequency Mapping. Opt. Lett. 2023, 48, 2034. [Google Scholar] [CrossRef]
- Nyushkov, B.; Kobtsev, S.; Antropov, A.; Kolker, D.; Pivtsov, V. Femtosecond 78-nm Tunable Er:Fibre Laser Based on Drop-Shaped Resonator Topology. J. Light. Technol. 2019, 37, 1359–1363. [Google Scholar] [CrossRef]
- Zhdanov, I.S.; Bednyakova, A.E.; Volosi, V.M.; Kharenko, D.S. Energy Scaling of an Erbium-Doped Mode-Locked Fiber Laser Oscillator. OSA Contin. 2021, 4, 2663. [Google Scholar] [CrossRef]
- Zhu, Y.; Cui, Z.; Sun, X.; Shirahata, T.; Jin, L.; Yamashita, S.; Set, S.Y. Fiber-Based Dynamically Tunable Lyot Filter for Dual-Wavelength and Tunable Single-Wavelength Mode-Locking of Fiber Lasers. Opt. Express 2020, 28, 27250. [Google Scholar] [CrossRef]
- Sun, Z.; Popa, D.; Hasan, T.; Torrisi, F.; Wang, F.; Kelleher, E.J.R.; Travers, J.C.; Nicolosi, V.; Ferrari, A.C. A Stable, Wideband Tunable, near Transform-Limited, Graphene-Mode-Locked, Ultrafast Laser. Nano Res. 2010, 3, 653–660. [Google Scholar] [CrossRef]
- Lin, J.; Dong, Z.; Dong, T.; Zhang, Y.; Dai, C.; Yao, P.; Gu, C.; Xu, L. Wavelength Switchable All-Fiber Mode-Locked Laser Based on Nonlinear Multimode Interference. Opt. Laser Technol. 2021, 141, 107093. [Google Scholar] [CrossRef]
- Rosdin, R.Z.R.; Ali, N.M.; Arof, H.; Harun, S.W. A Passively Harmonically Mode-locked Soliton Erbium-doped Fiber Laser with Low Pumping Threshold Using a Single-walled Carbon Nanotubes. Microw. Opt. Technol. Lett. 2015, 57, 799–803. [Google Scholar] [CrossRef]
- Tan, Z.; Wang, Y.; Ren, W.; Liu, Y.; Li, B.; Ning, T.; Jian, S. Transmission System over 3000 Km with Dispersion Compensated by Chirped Fiber Bragg Gratings. Optik 2009, 120, 9–13. [Google Scholar] [CrossRef]
- Kharenko, D.S.; Zhdanov, I.S.; Bednyakova, A.E.; Podivilov, E.V.; Fedoruk, M.P.; Apolonski, A.; Turitsyn, S.K.; Babin, S.A. All-fiber highly chirped dissipative soliton generation in the telecom range. Opt. Lett. 2017, 42, 3221–3224. [Google Scholar] [CrossRef] [PubMed]
- Gao, L.; Zhu, T.; Li, Y.J.; Huang, W.; Liu, M. Watt-Level Ultrafast Fiber Laser Based on Weak Evanescent Interaction with Reduced Graphene Oxide. IEEE Photonics Technol. Lett. 2016, 28, 1245–1248. [Google Scholar] [CrossRef]
- Olivier, M.; Boulanger, V.; Guilbert-Savary, F.; Sidorenko, P.; Wise, F.W.; Piché, M. Femtosecond fiber Mamyshev oscillator at 1550 nm. Opt. Lett. 2019, 44, 851–854. [Google Scholar] [CrossRef] [PubMed]
| Disclaimer/Publisher’s Note: The statements, opinions and data contained in all publications are solely those of the individual author(s) and contributor(s) and not of MDPI and/or the editor(s). MDPI and/or the editor(s) disclaim responsibility for any injury to people or property resulting from any ideas, methods, instructions or products referred to in the content. |
© 2023 by the authors. Licensee MDPI, Basel, Switzerland. This article is an open access article distributed under the terms and conditions of the Creative Commons Attribution (CC BY) license (https://creativecommons.org/licenses/by/4.0/).

