Article

Design of a Scanning Module in a Confocal Microscopic Imaging System for Live-Cell Imaging

1
Shanghai Institute of Technical Physics, Chinese Academy of Sciences, Shanghai 200083, China
2
University of Chinese Academy of Sciences, Beijing 100049, China
*
Authors to whom correspondence should be addressed.
Photonics 2024, 11(1), 26; https://doi.org/10.3390/photonics11010026
Submission received: 13 November 2023 / Revised: 19 December 2023 / Accepted: 19 December 2023 / Published: 28 December 2023
(This article belongs to the Special Issue Optical Imaging Systems in Biomedicine)

Abstract

:
This study proposes a Nipkow-based pinhole disk laser scanning confocal microscopic imaging system for ordinary optical microscopy, fluorescence microscopy, and confocal microscopy imaging of biological samples in order to realize the dynamic experimental monitoring of space-based life science experiments and the fine observation of biological samples. Confocal microscopic imaging is mainly completed by a scanning module that is composed of a spinning disk and other components. The parameters of the spinning disk directly determine the quality of the image. During the design process, the resolution and signal-to-noise ratios caused by different pinhole diameters in the spinning disk are the main considerations. Changes and image blurring caused by crosstalk due to the pinhole arrangement and different pinhole spacings are addressed. The high photon efficiency of the new EMCCD (electron-multiplying charge-coupled device) and CMOS (complementary metal-oxide-semiconductor) camera reduces the exposure time as much as possible, reduces damage to living cells, and achieves high-speed confocal imaging. It is shown in a confocal imaging experiment with a variable magnification of 1–40× that the imaging resolution of the system can reach a maximum of 2592 × 1944, the spatial resolution can reach 1 μm, and the highest sampling frequency is 10 fps, thus meeting the design requirements for high-speed live-cell imaging.

1. Introduction

Ordinary optical microscopes are mainly used to observe the surfaces of opaque samples and light-transmitting samples with different transmittances. One characteristic of their imaging is that the entire image is formed on the image plane of the system at the same time. Scanning microscopy imaging technology uses the relative movement between a light spot and a sample so that an object point on the sample surface directly corresponds to an image point on the image plane of the system. In 1951, J. Z. Yung proposed the flying-spot scanning microscope [1], which is different from ordinary optical microscopes in that the entire image is formed on the image plane at the same time, but through the relative movement between the scanning laser spot and the sample, thereby establishing a one-to-one correspondence between the object points on the sample surface and the image points on the image plane. In 1957, Marvin Minsky first described some basic principles of scanning confocal microscopy [2]. In 1969, Davidovits et al. proposed the confocal scanning microscope, which is similar in principle to the flying-spot scanning microscope. On the excitation light path, the focused laser spot is used as the light source, but on the detection light path, the reflected or transmitted light of the sample is focused onto a spatial filter through a lens, and then the signal is collected and converted by the detector. In this way, the optical path of detection only detects light from a specific area of the object space, so the spatial resolution of the optical system is greatly improved while the focal depth of the system is reduced, which makes it possible to accurately image sections of interest in biological tissue without damaging their structures [3]. In 1987, Xiao and Kino reduced the reflection by tilting the spinning disk [4]. In 1994, Corle et al. [5] further improved the polarization device in the optical path. Li Chen et al. [6] added a second spinning disk, containing a microlens array, in the optical path. This structure increased lighting efficiency by up to 40%, and this technology was realized and put on the market by Yokogawa Corporation. Confocal imaging techniques have become the standard choice for most applications of fluorescence microscopy. Although the super-resolution imaging method proposed in the past decade has improved the resolution of microscope imaging to the nanometer level, confocal imaging technology is still the preferred choice for space-based life science experiments due to its advantages of non-destructive acquisition and diverse sample applications.
In space-based life science experiments, objects undergoing microscopic observation include complex biological samples, such as living cells, tissues, and structures, which are suspended in culture medium or allowed to grow freely in a microgravity environment. The imaging devices used in such research require high temporal and spatial resolutions and the lowest possible illumination power to reduce light damage, and imaging must be conducted with a three-dimensional spatial distribution or in an unfixed situation. The operations of the experimenters are mainly auxiliary operations, and the experimental instruments are semi-automatically operated. During the entire experimental process, it is necessary to obtain as much experimental data as possible, to control the experimental process, and to minimize the impact on the samples and the experimental environment. Domestic space microscopy equipment has been in development for nearly 20 years. The new generation of platforms for space-based biotechnological experiments places higher demands on microscopic imaging equipment: providing real-time observation functionality for microscopic imaging and fluorescence imaging in biotechnological experimental systems; supporting the observation of dynamic cell processes with multi-level biological samples, such as tissues, cells, and molecules, as research objects through microscopic imaging; accomplishing the dynamic monitoring of space-based experimental processes and the fine observation of biological samples, which can be applied to different experiments through component and module replacement; and automatically searching and carrying out auto-focus imaging of different types of samples in different regions.
In response to these requirements, this study proposes an imaging system using laser confocal microscopy based on a Nipkow spinning disk. The laser spinning confocal microscope is a common structure in area-scanning imaging microscopes. Multi-point parallel scanning can reduce the time required to scan the entire field of view, which greatly improves imaging efficiency and reduces the damage caused by the laser energy to living cells within the integration time [4]. These advantages are in line with the characteristics of biological samples that require microscopic observation in space-based life science experiments. Considering the limitations of the imaging conditions in space-based applications, the customized composite laser confocal microscopy imaging module used here has a compact structure and high reliability, and the system components can be replaced online. It can be used to realize in-orbit automatic searches and fine-focus imaging, support confocal microscopic imaging of multiple fluorescence wavelengths with multiple magnifications, and use domestic lasers to ensure autonomy throughout the duration of an experiment. Research and experiments have proven that a laser confocal microscopy imaging module based on a multi-pinhole spinning disk can be used to realize the task of living target observation in space-based life science experiments, and the spatial resolution of such modules can reach 1 μm. For different types of biological samples and space-based culture modes, by changing the microscope’s objective lens and setting the detectors to different wavelengths, the monitoring of the experimental process, real-time online observation, and in situ analysis of the experimental results during the long-term culture process can be realized.
Section 2 introduces the overall design scheme and functions of the laser confocal microscopic imaging module. Among them, the scanning module is the main structure to realize the composite imaging function. Section 3 discusses and analyzes the main parameters in the design process of the scanning module, and in Section 4, it tests whether it meets the design specifications through ground simulation experiments. Section 5 summarizes and looks forward to the overall ideas and results of the paper.

2. Confocal Principle and System Solution

The main structure of the laser confocal microscopy imaging module is shown in Figure 1. It can be used to realize the functions of ordinary optical microscopy, fluorescence microscopy, and confocal microscopy at the same time. The main function of imaging through confocal microscopy is realized using the scanning module. When observing in confocal fluorescence microscope mode, the spectroscopic system is switched to dichromatic spectroscopic mode, the excitation light source for the corresponding band is selected according to the sample, the spinning disk cuts into the main optical path, and the laser is collimated and expanded by a beam expander to form a uniform beam with a diameter of 8 mm. The light spot passes through the beam splitter, spinning disk, and objective lens of the microscope and irradiates the sample. The fluorescence emitted by the sample after excitation is reflected to the detector through the original path to realize the collection of confocal fluorescence images. During the reflection process, the scanning system and the spectroscopic system perform a filtering function. The target sample is translated on the z-axis to obtain confocal fluorescence images of different sections of the sample, and a three-dimensional image of the sample can be obtained by summarizing the obtained images and performing data processing. In this configuration, the spinning disk is cut out of the main optical path, and the collected image is an ordinary fluorescence microscope image. If the beam-splitting system and the spinning disk are cut out of the main optical path at the same time, the collected image is an ordinary optical microscope image. By configuring the commands, the laser confocal microscopy imaging module can be used for space-based culture experiments on different types of biological samples, such as animal cells, tissues, and individuals.

3. Scanning Module Design

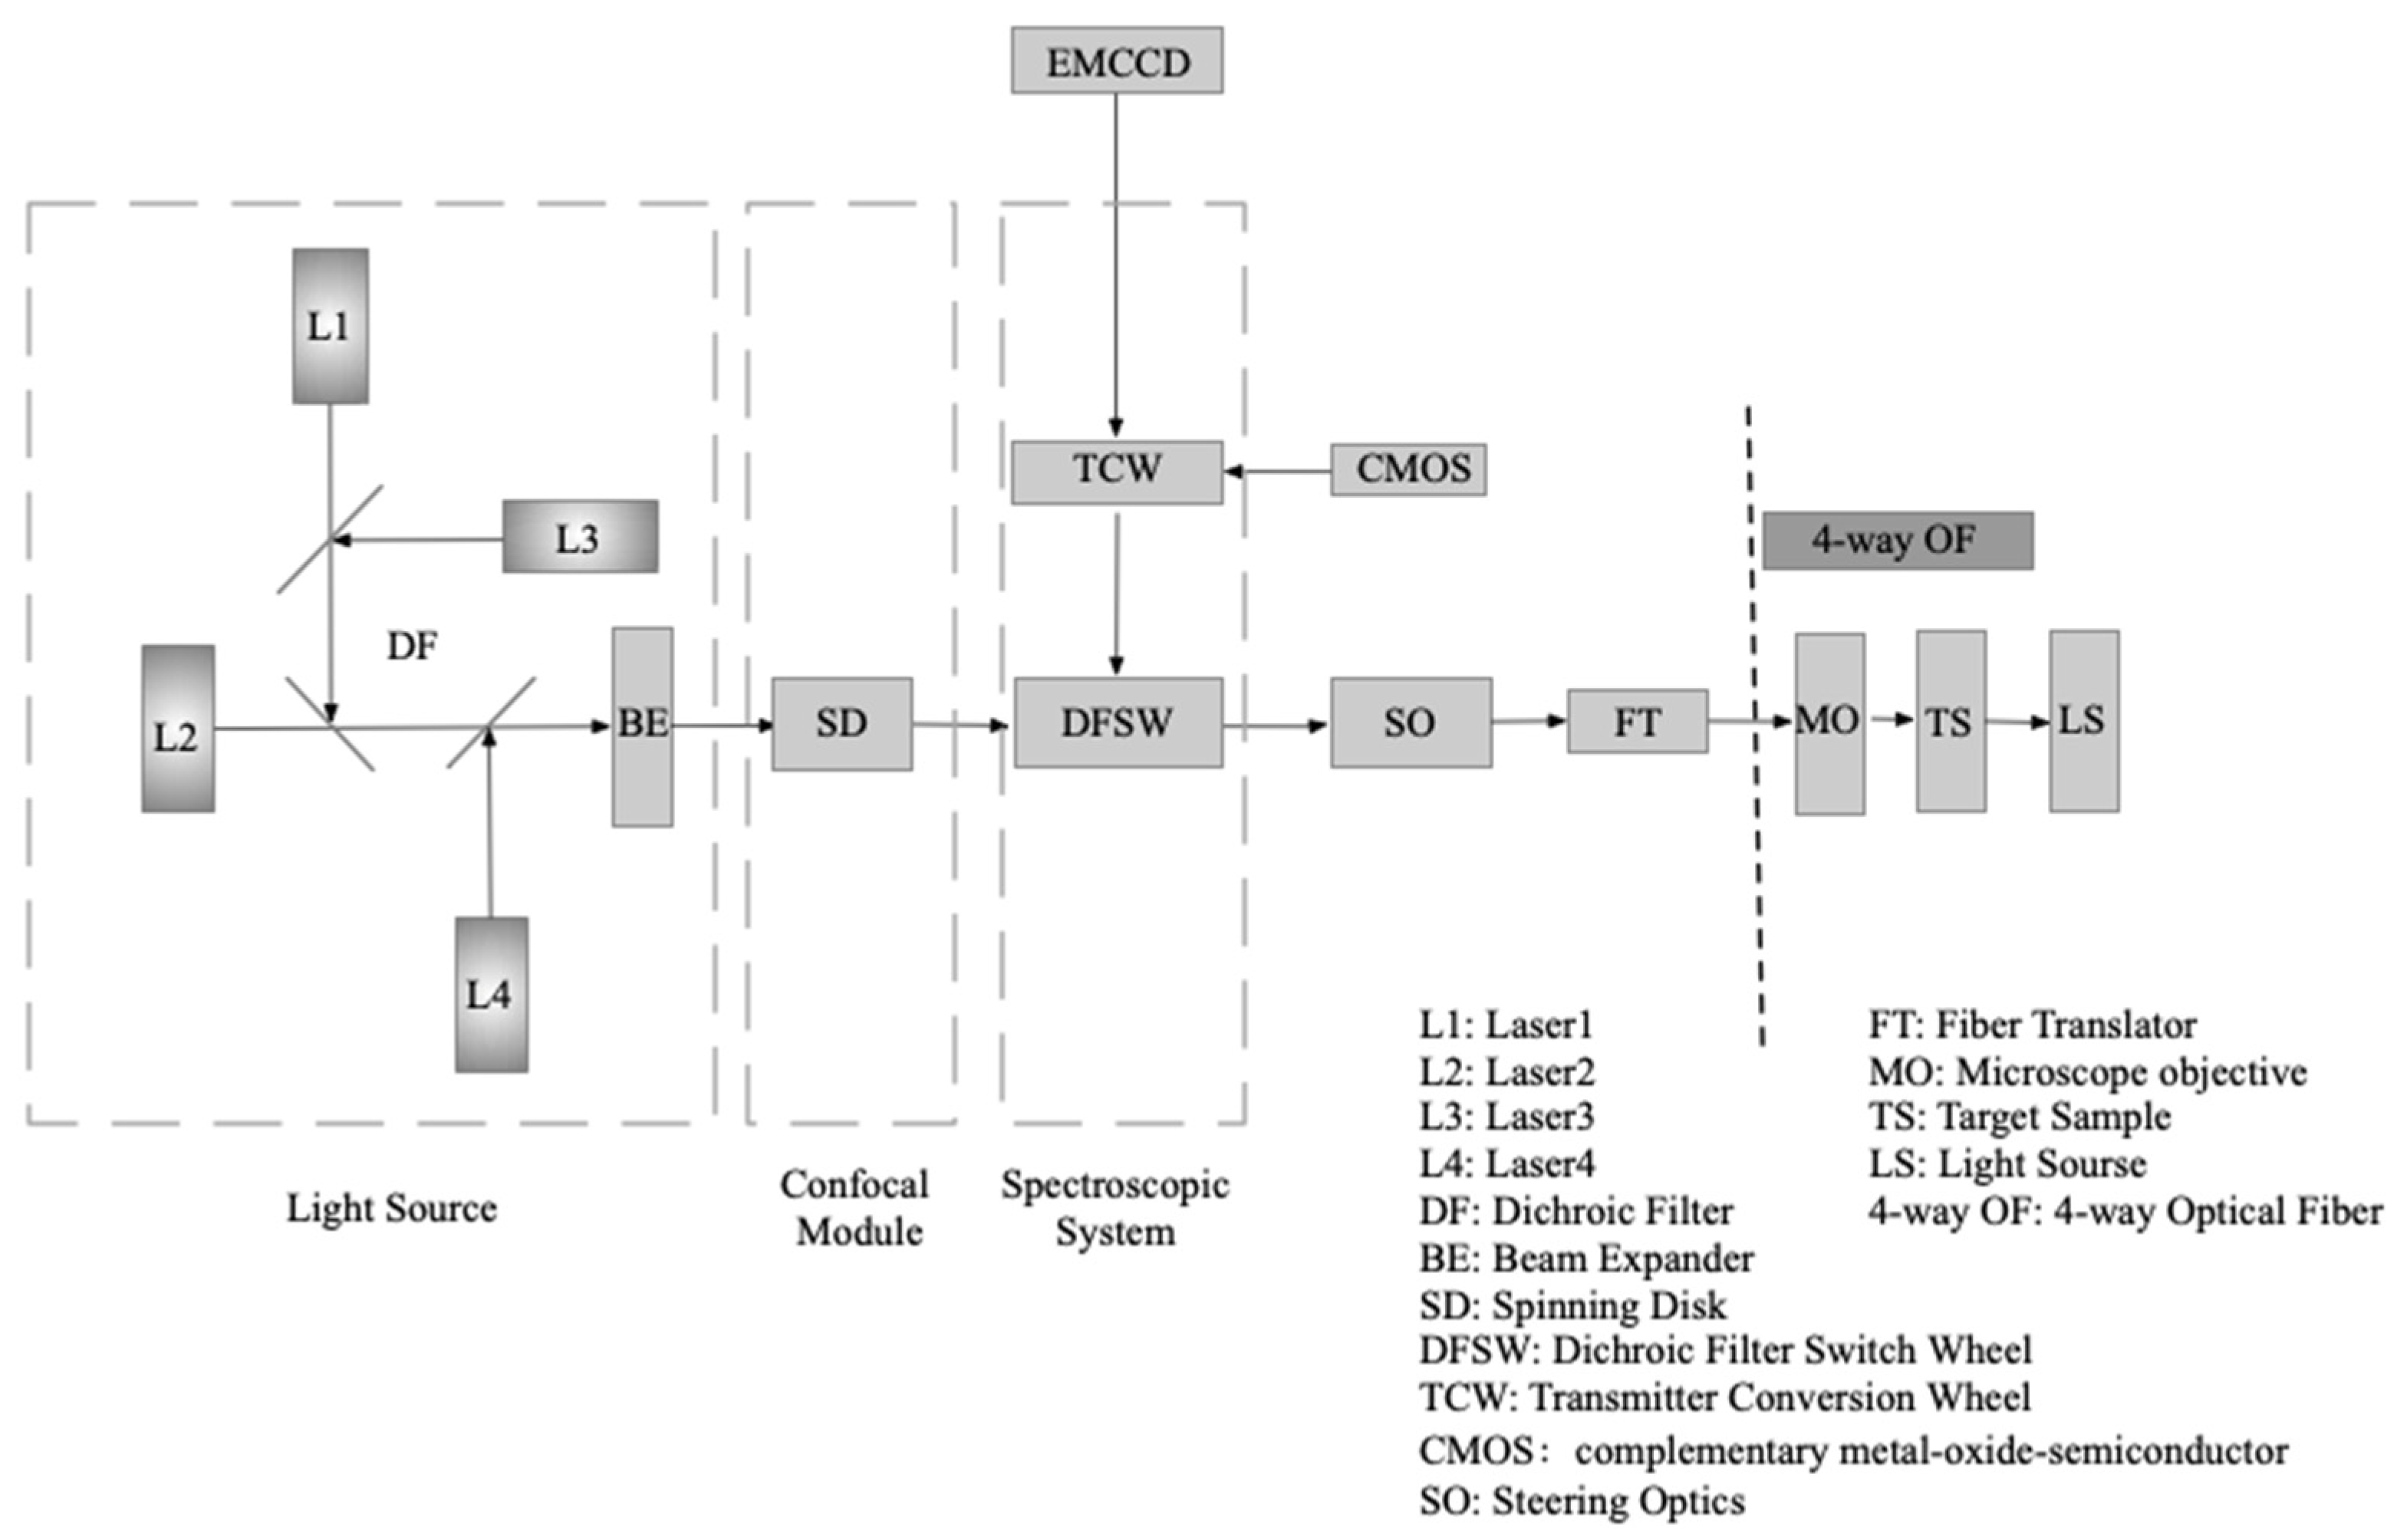
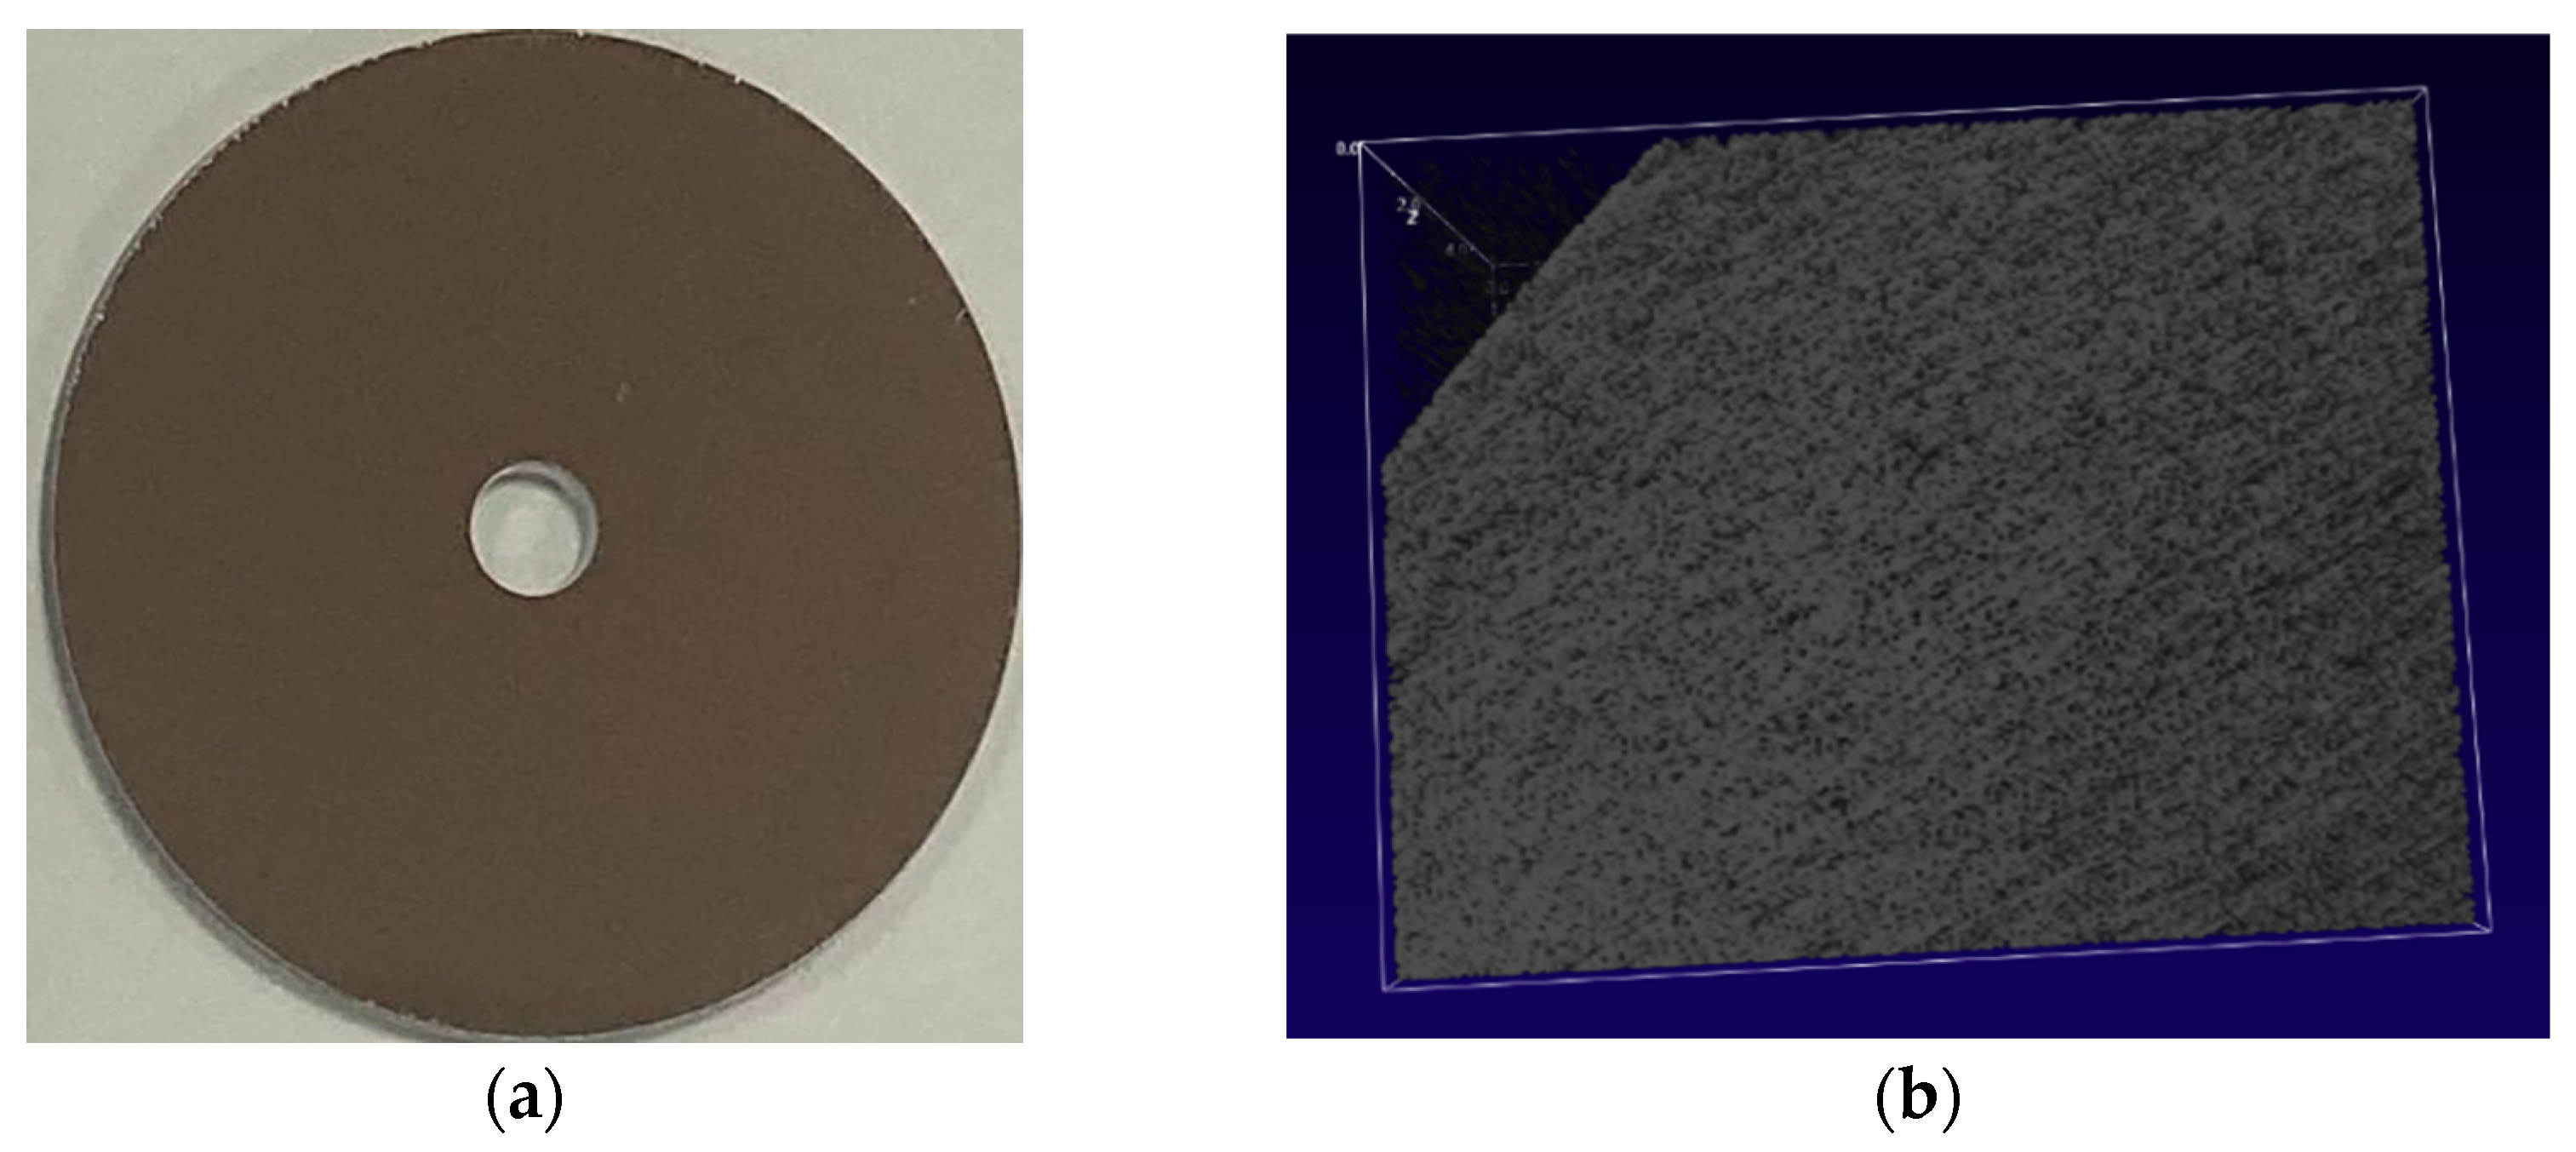
The main function of confocal microscopy imaging is completed by the scanning module, and its main structure is a spinning disk and drive motor customized for the system parameters, as shown in Figure 1. A spinning disk with a pinhole sequence as the scanning unit is also called a Nipkow spinning disk, named after the scientist Paul Nipkow, who first proposed it. In 1967, Edgar and Petráň modified the Nipkow spinning disk and designed a spinning disk with a sequence of pinholes arranged in an Archimedes spiral. In this arrangement, in the light path, the spinning disk not only serves as the illumination pinhole of the microscope, but also as the imaging pinhole conjugate to the sample with respect to the objective lens [7]. Whether the pinhole of the spinning disk is replaced by a strip [8] or the scanning structure of a single spinning disk is replaced by a coupled double disk [9], the confocal microscope can only be adjusted in the spatial structure to improve the signal-to-noise ratio and spatial resolution of the image. The basic principle still follows the confocal principle proposed by Nipkow, that is, the detection and illumination planes are in a conjugate relationship, and both are in focus mode. The principle of confocal imaging can be expressed as
h s y s = ( O × h i l l ) ( h d e t P )
Here, O is the point source function; h i l l and h d e t are the illumination and detection PSF (point spread function), P is the aperture function of the pinhole; and h s y s is the final PSF of the system. The pinhole is used as a detection and filtering element at the same time, and the out-of-focus signal outside the scanning plane can be effectively filtered out. It also has a three-dimensional imaging function as a slice element. When the aperture of the pinhole is infinitely small, its aperture function can be simplified into an impact function. At this point, (1) can be expressed as
h i m = ( O × h i l l ) h d e t
At this time, the PSF of the confocal system can be increased to 1.4 times that of the widefield in both the axial and lateral directions [10]. However, in practical applications, the smaller the aperture of the pinhole is, the weaker the signal that can be detected and the worse the signal-to-noise ratio will be, which affects the improvement in the resolution. Experiments have shown that the best balance between the signal-to-noise ratio and resolution can be achieved at 0.6–0.8 AU (Airy unit) [11]. It can be seen from Formula (2) that the main factors affecting the imaging performance of the point-scanning system are the parameters of the illumination system and the detection system. Spinning-disk confocal microscopy (SDCM) improves on both of these based on the point-scanning system. Firstly, the quantum efficiency (QE) of an enhanced charge-coupled device (CCD) and a new complementary metal–oxide–semiconductor (CMOS) camera can reach 65 to 90%, which is much higher than that in photomultiplier tubes (20%) or avalanche photodiodes (40%). This high-sensitivity detection device can reduce the exposure time required for an experiment, achieve a higher frame rate at the same signal-to-noise ratio, and make it possible to collect images of living cells. Secondly, through the pinhole disk, thousands of beams can simultaneously irradiate and scan the sample. These beams rotate with the spinning disk to scan the same point on the sample multiple times in one cycle of the entire camera exposure, thus improving the mechanical movement form of single-point scanning, which is efficient and fast, and the illumination intensity can be reduced by more than one thousand times. However, it should be noted that in the design process, although the number of pinholes in the spinning disk usually ranges from 2000 to 20,000, the transmittance of the disk surface is still below 5% for fluorescence imaging, and the image blurring caused by expanding the diameter of the pinhole needs to be considered. Furthermore, as the excitation and emission light pass through the pinholes at the same time, the positioning of the pinholes requires high precision. In addition, the crosstalk effect between multiple pinholes is the most important factor affecting the axial resolution of the signal and blurring the background. Therefore, a balance must be struck between the pinhole spacing and the intensity of crosstalk in the background. The parameters of the scanning system directly determine the quality of the image, as will be discussed in detail below.

3.1. Pinhole Spacing

The pinholes of the spinning disk are arranged at equal intervals on its outer periphery in the form of an Archimedes spiral. The number of pinholes determines the amount of light passing through, and the spacing of the pinholes affects the quality of imaging. The denser the pinholes, the higher the transmittance of the disk surface, and the larger the pinhole spacing, the better the axial resolution. T represents the transmission efficiency of the pinhole, then:
T = D S 2
Here, D represents the pinhole diameter, and S represents the pinhole spacing. It can be seen that the transmittance of the spinning disk is not high. Taking the normal D / S in biology as an example, when D / S is 1/5, the transmittance is only 4%. Continuing to reduce the pinholes’ spacing has an impact on the axial resolution, allowing more emitted light to return through adjacent pinholes, especially when observing thick samples. However, if the diameter of the pinhole is increased, the axial resolution of the system will decrease. In the system, the lateral resolution is described by the Abbe equation, which is defined as a function of the wavelength of the emitted light and the numerical aperture of the objective lens:
r A i r y = 0.61 λ o N A o b j
In biological fluorescence confocal microscopy, if the diameter of the pinhole is smaller than the diameter of an Airy disk, the crosstalk between the holes causes the overall performance of the confocal microscope to rapidly drop, and the axial resolution approaches that of a widefield microscope. When the pinhole diameter exceeds two Airy disk diameters, the detector can capture a tiny image that is only a few pixels in size from the light emitted by each pinhole. Within this range, the pinhole spacing should be expanded as much as possible to reduce the occurrence of crosstalk between the holes.
We discuss the occurrence of crosstalk near the spinning disk with a model in which the numerical aperture (NA) is 1.0 and the diameter, D 
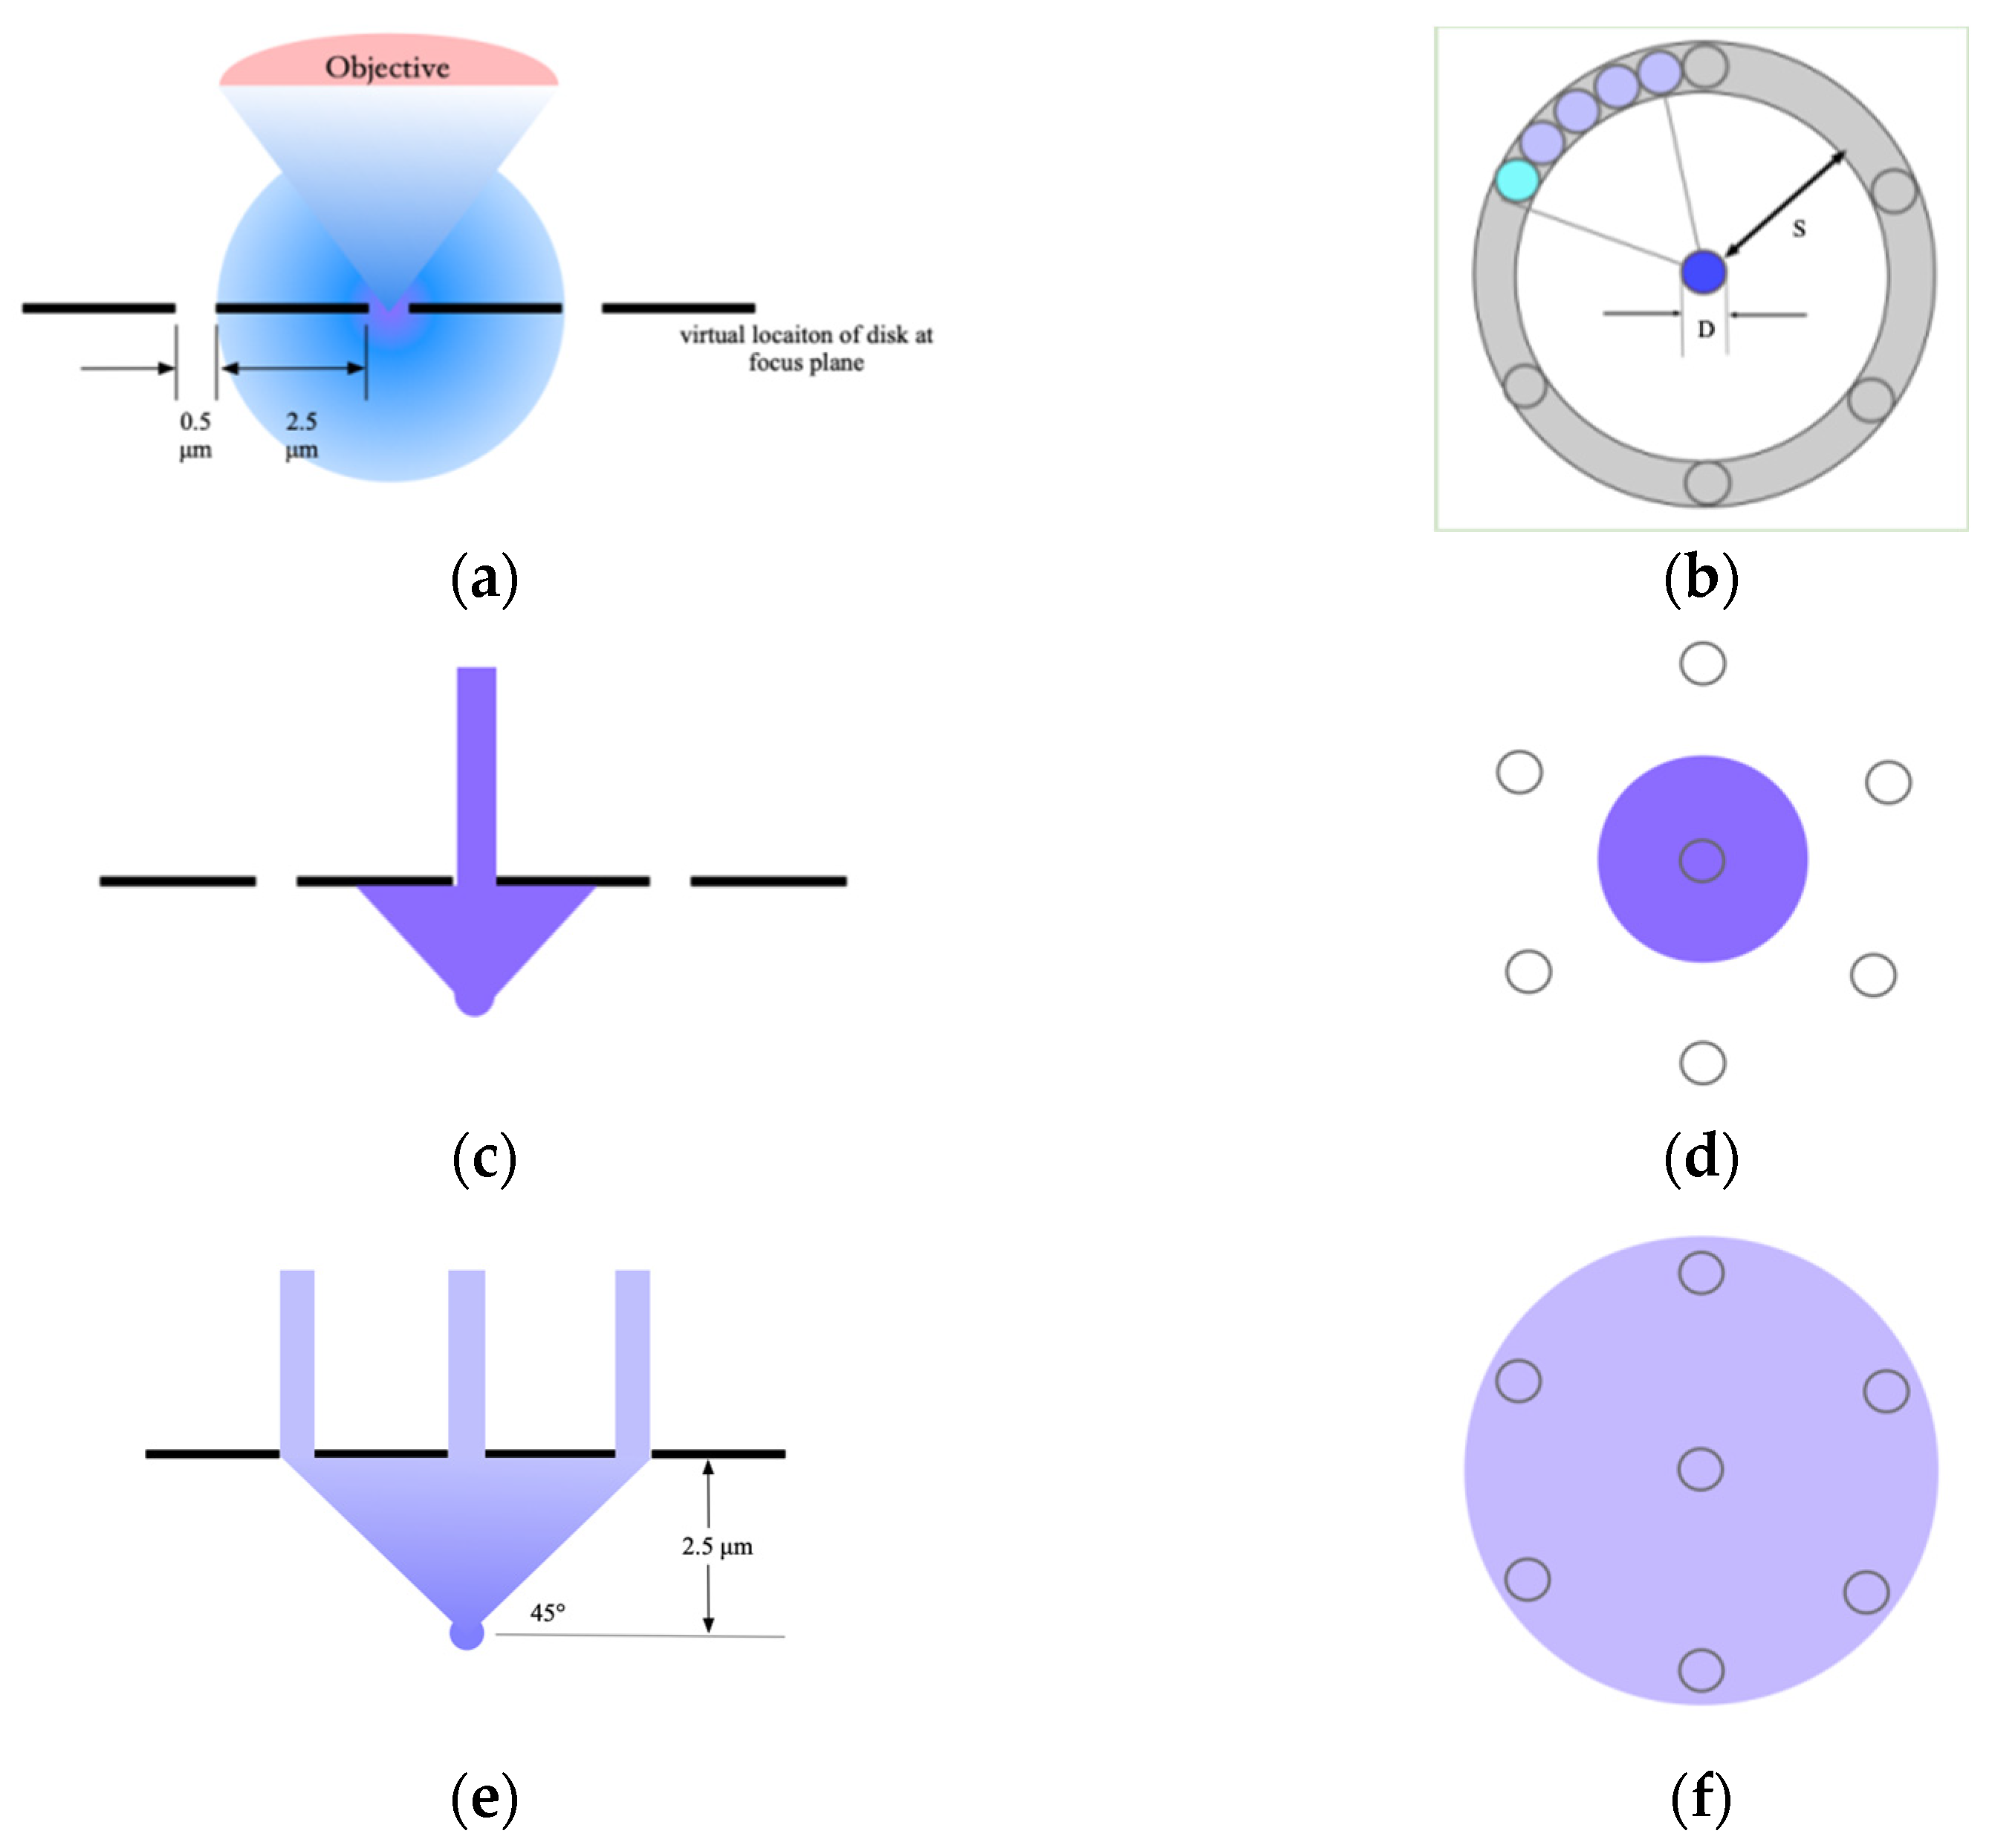
, is 1 Airy. As shown in Figure 2a, the fluorescent spot is located in the focal plane. At this time, the central main maximum value of the Airy disk emitted by the point light source can almost completely pass through the pinhole and be collected by the detector. The light distribution on the disk observed in the optical path is shown in Figure 2b. At this time, D / S is about 1/5, and the total transmission efficiency is about 4%, which is in line with the transmission efficiency of most disk scanning structures used in biological applications. When the stage moves downwards, the position of the point light source drops below the focal plane, and the amount of light passing through the pinhole in the center of the spinning disk decreases, as shown in Figure 2c. At this time, most of the light beams that can be accepted by the objective lens and leave the point light source at any angle are located on the back of the spinning disk, as shown in Figure 2d.
When the point light source is 2.5 mm away from the focal plane, S is the same as the amount of defocus. At this time, a part of the light from the point light source is able to pass through a pinhole in the first circular ring around the pinhole. The strength of the light beam reaching the detector from the wrong pinhole is six times that of the light beam reaching the detector from the correct pinhole. The photons that were originally only distributed in the spot with a diameter of 0.5 mm are now scattered on a spot with a diameter that is five times that of the original and an area that is 25 times that of the original. The attenuation of the emission end and the excitation end is the same. At this time, the number of photons per unit area on the disk is 1/625 of that at the focal point. It can be seen from Figure 2b that only about D/S of the light incident on the torus with diameter S and width D actually passes through the torus. As the point source continues to move away from the spinning disk, the number of photons reaching the detector continues to decrease until some beams begin to pass through pinholes in the second ring around the central pinhole, which are at a distance of about 4–5 mm. When the value of NA is high, this happens with a low amount of defocus, and vice versa.
However, in actual operation, it is impossible to infinitely expand the pinhole spacing in order to pursue an excessively high axial optical resolution. As the pinhole spacing increases, the light transmittance of the pinhole disk gradually decreases, which not only reduces the efficiency of the light source, but also causes an excessive amount of light reflected from the disk to enter the detector and form background noise. At the same time, a smaller amount of transmitted light affects the fluorescence excitation and reduces the fluorescence intensity. These two disadvantages ultimately affect the detector ratio, thereby reducing the image resolution. What we ultimately care about is the clarity of the image presented to us rather than just the optical resolution, so it makes no sense to sacrifice the detector’s signal-to-noise ratio too much in order to improve optical resolution. Therefore, the values of the pinhole spacing and pinhole diameter depend on the detector performance, sample characteristics, and excitation light source.
On the basis of the axial PSF of a single-pinhole scanning fluorescence confocal microscope, the PSF of a multiple-pinhole scanning fluorescence confocal microscope was analyzed. Considering the crosstalk of the focal plane and the crosstalk of stray out-of-focus light, the axial intensity point spread function of the multi-pinhole scanning fluorescence confocal microscope is expressed as:
I m p ( u ) = 0 1 Z 0 Z Z 0 2 D S 2 I ( u ) d z
where Z 0 Z Z 0 2 is the defocus correction parameter and D S 2 is the transmittance of the spinning disk.
I ( u ) = 0 1 e 1 2 i u ρ 2 ρ d ρ 4 = s i n ( u / 4 ) u / 4 4
In order to compare the influence of the crosstalk caused by different pinhole spacings on the axial intensity point spread function of the system, two commonly used pinhole disks were selected for analysis, and their parameters are shown in Table 1.
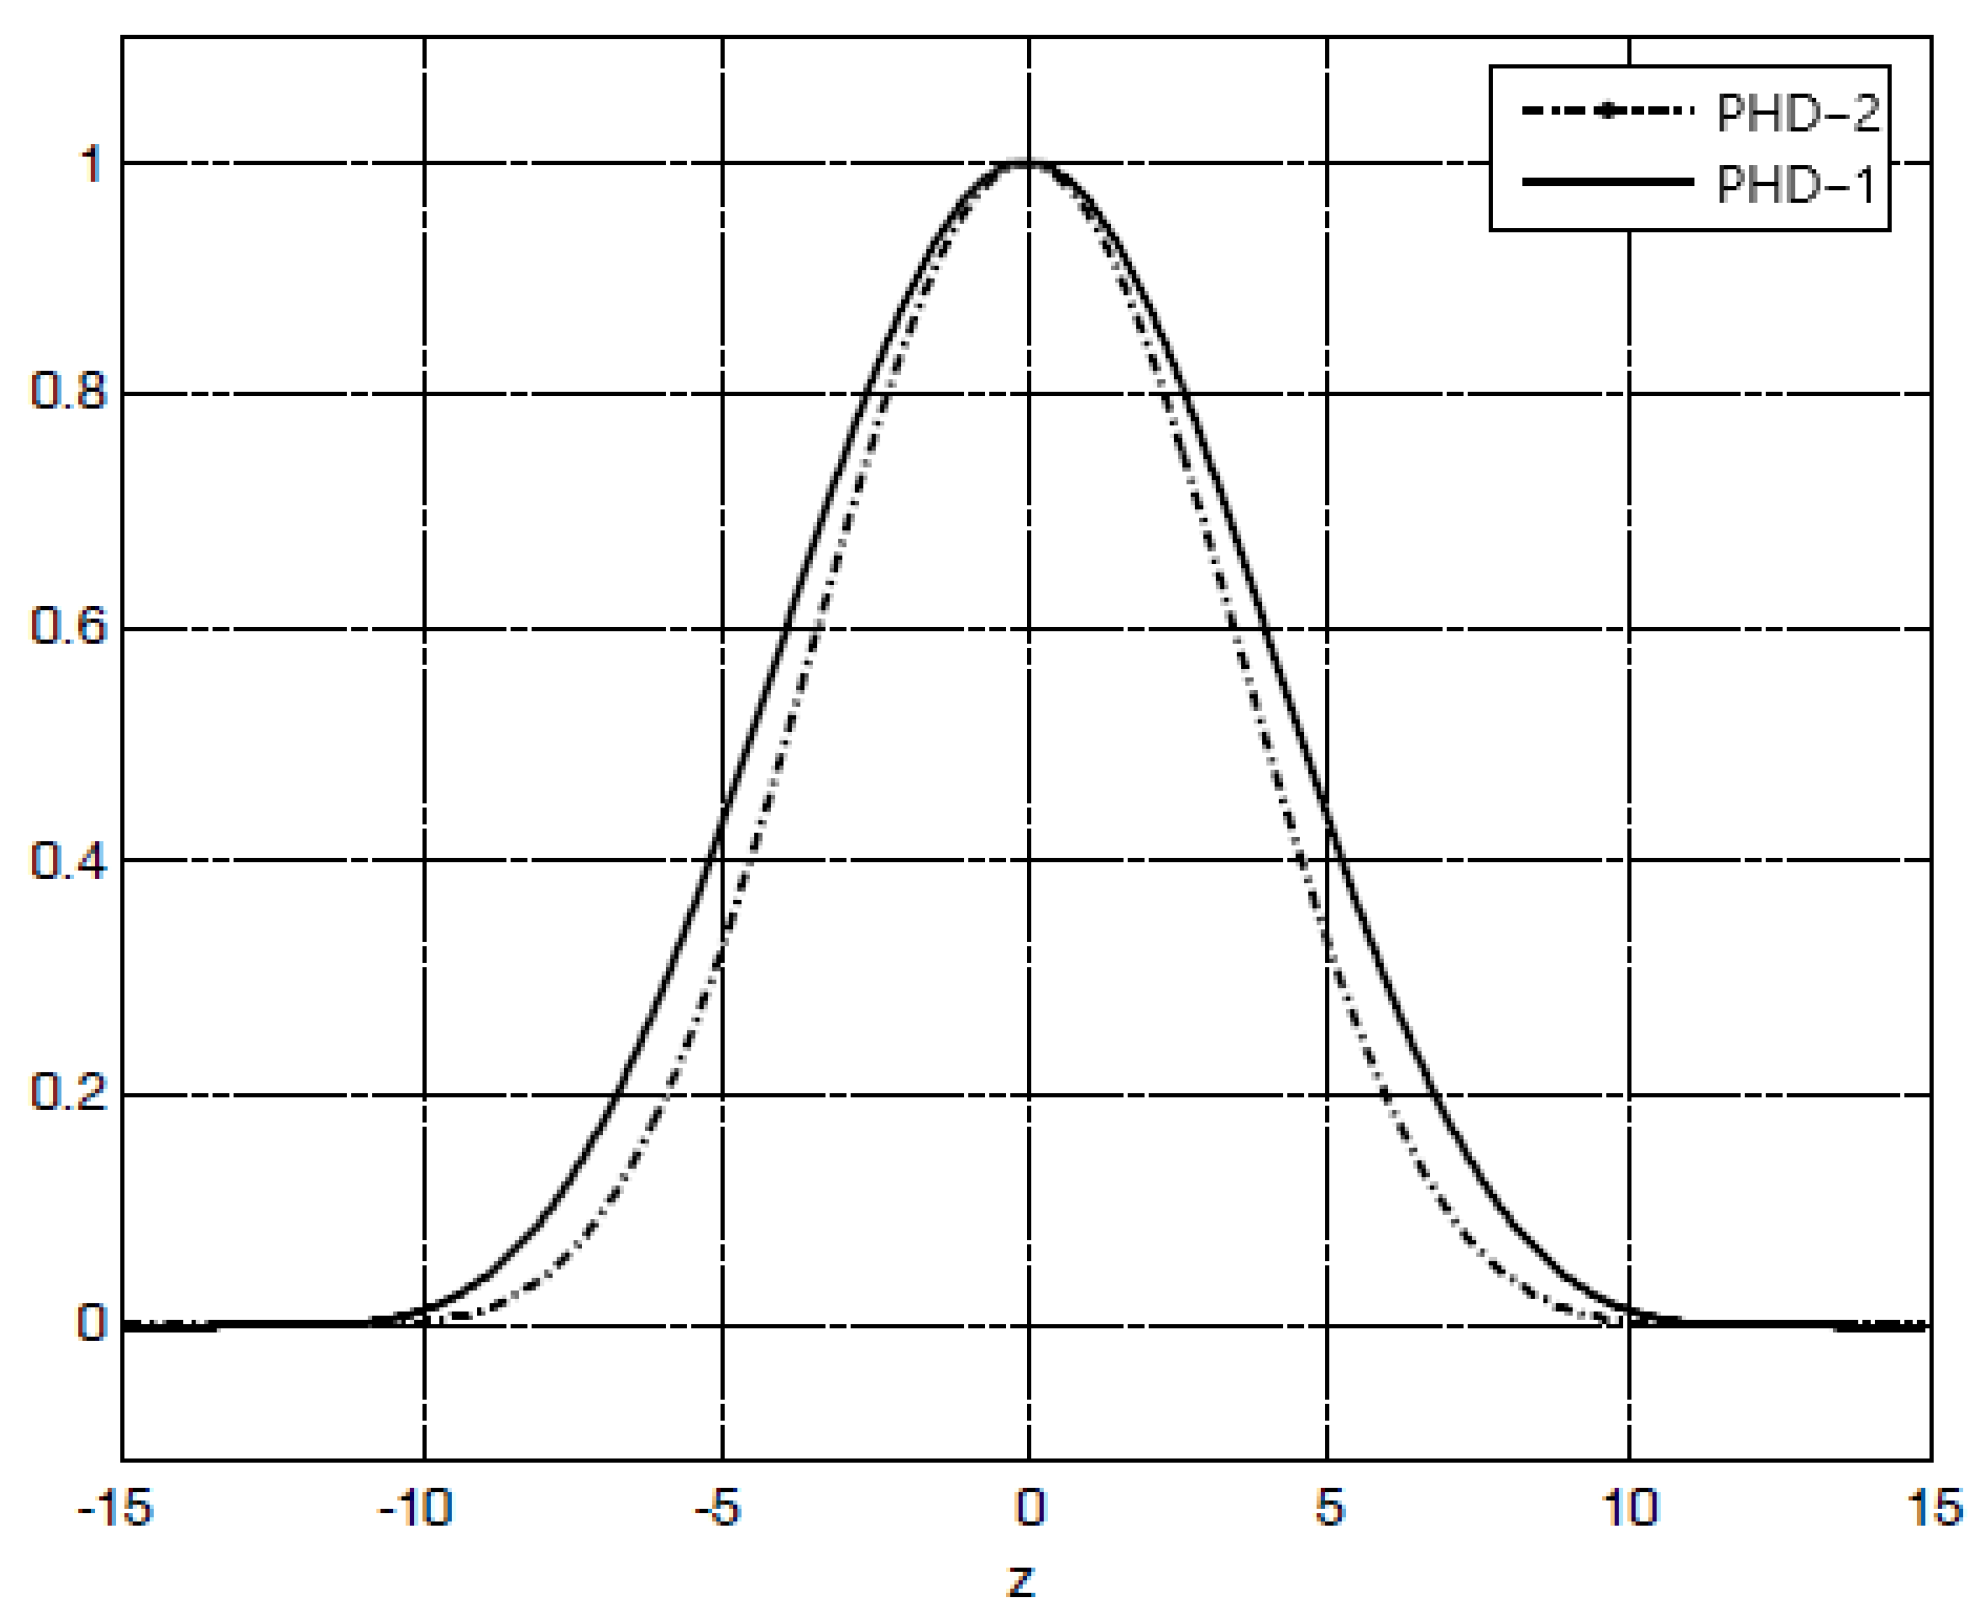
We put the above parameters into Formulas (5) and (6) and drew their respective intensity point diffusion curves, as shown in Figure 3. It can be seen from the figure that the intensity point spread function of pinhole disk 2 (PHD-2) was narrower than that of pinhole disk 1 (PHD-1). The normalized full widths at half maximum of the obtained intensity point spread curves of the two were 8.13 and 9.21, respectively. Compared to PHD-1, when using PHD-2, the system resolution was increased by about 11%.
In the system, the objective lens with the highest magnification is given priority. Considering the imaging situation with a 40× objective lens, the NA is 0.6, and the defocus distance is 5.2 μm. That is to say, no crosstalk will occur when the system observes a sample of 10.4 μm, which is close to the thickness value of the observed system sample. When the pinhole size is 50 μm (as shown below), the pinhole spacing is 250 μm, which meets the design requirements.

3.2. Pinhole Size

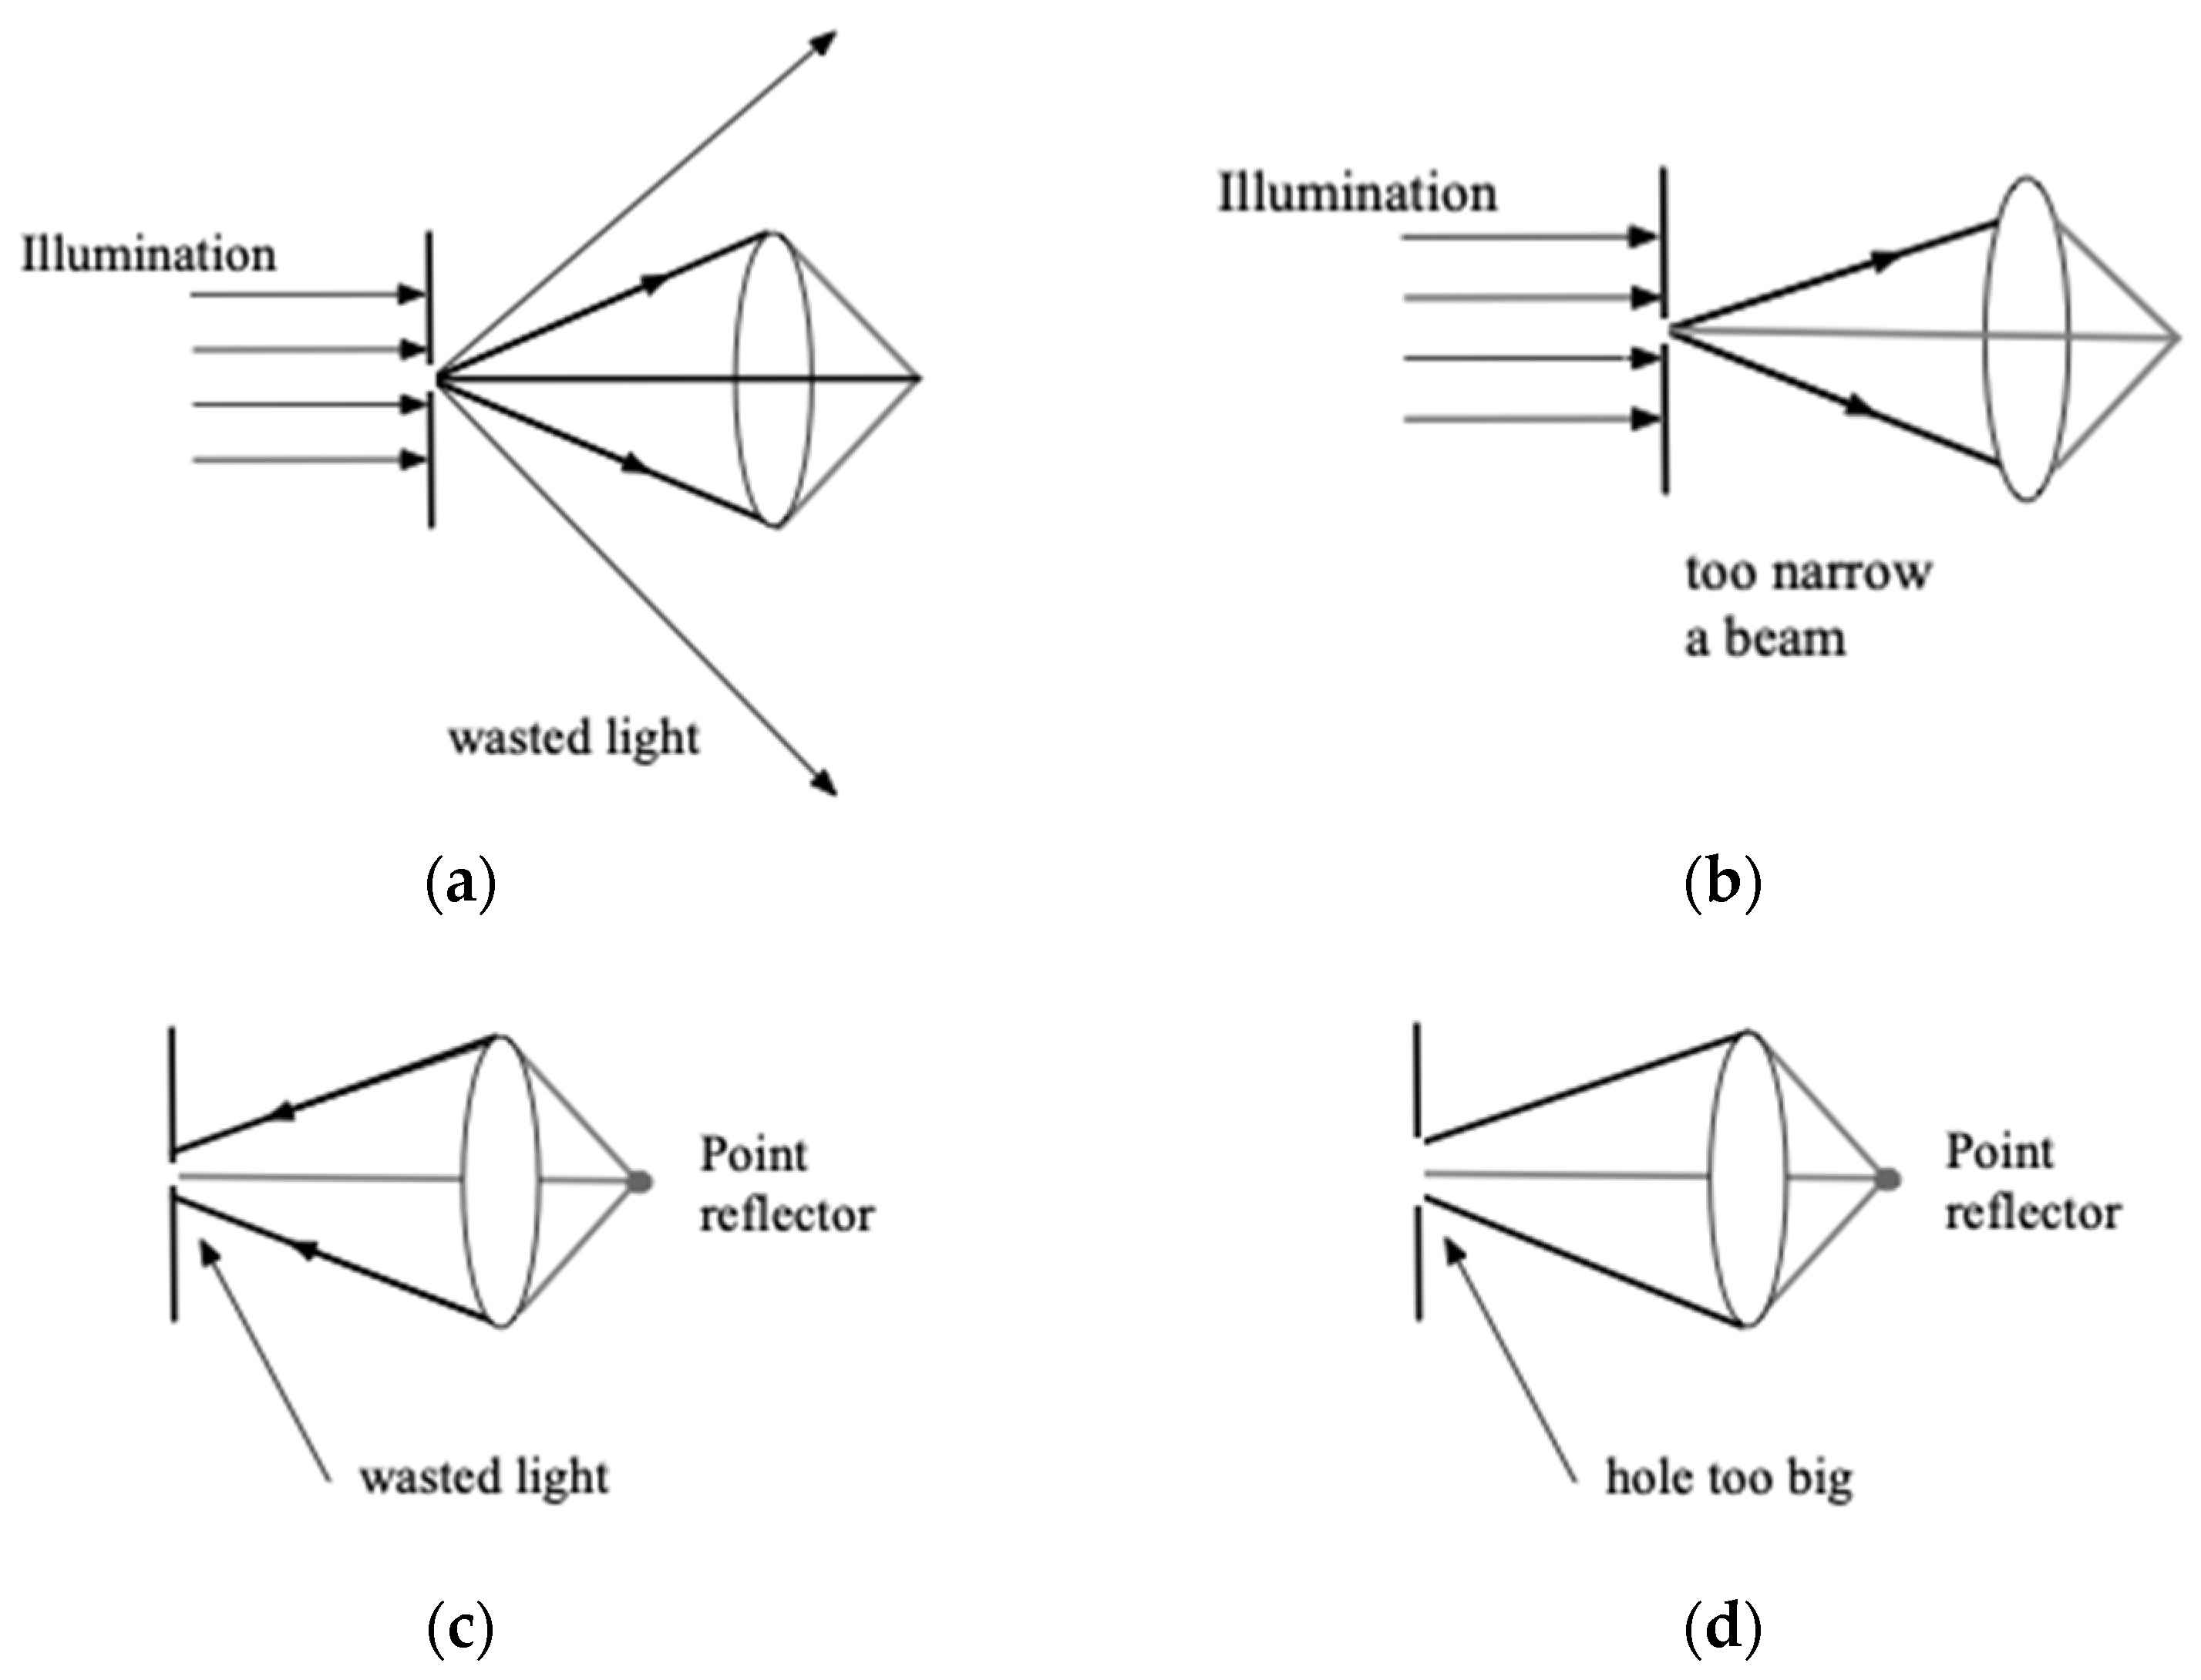
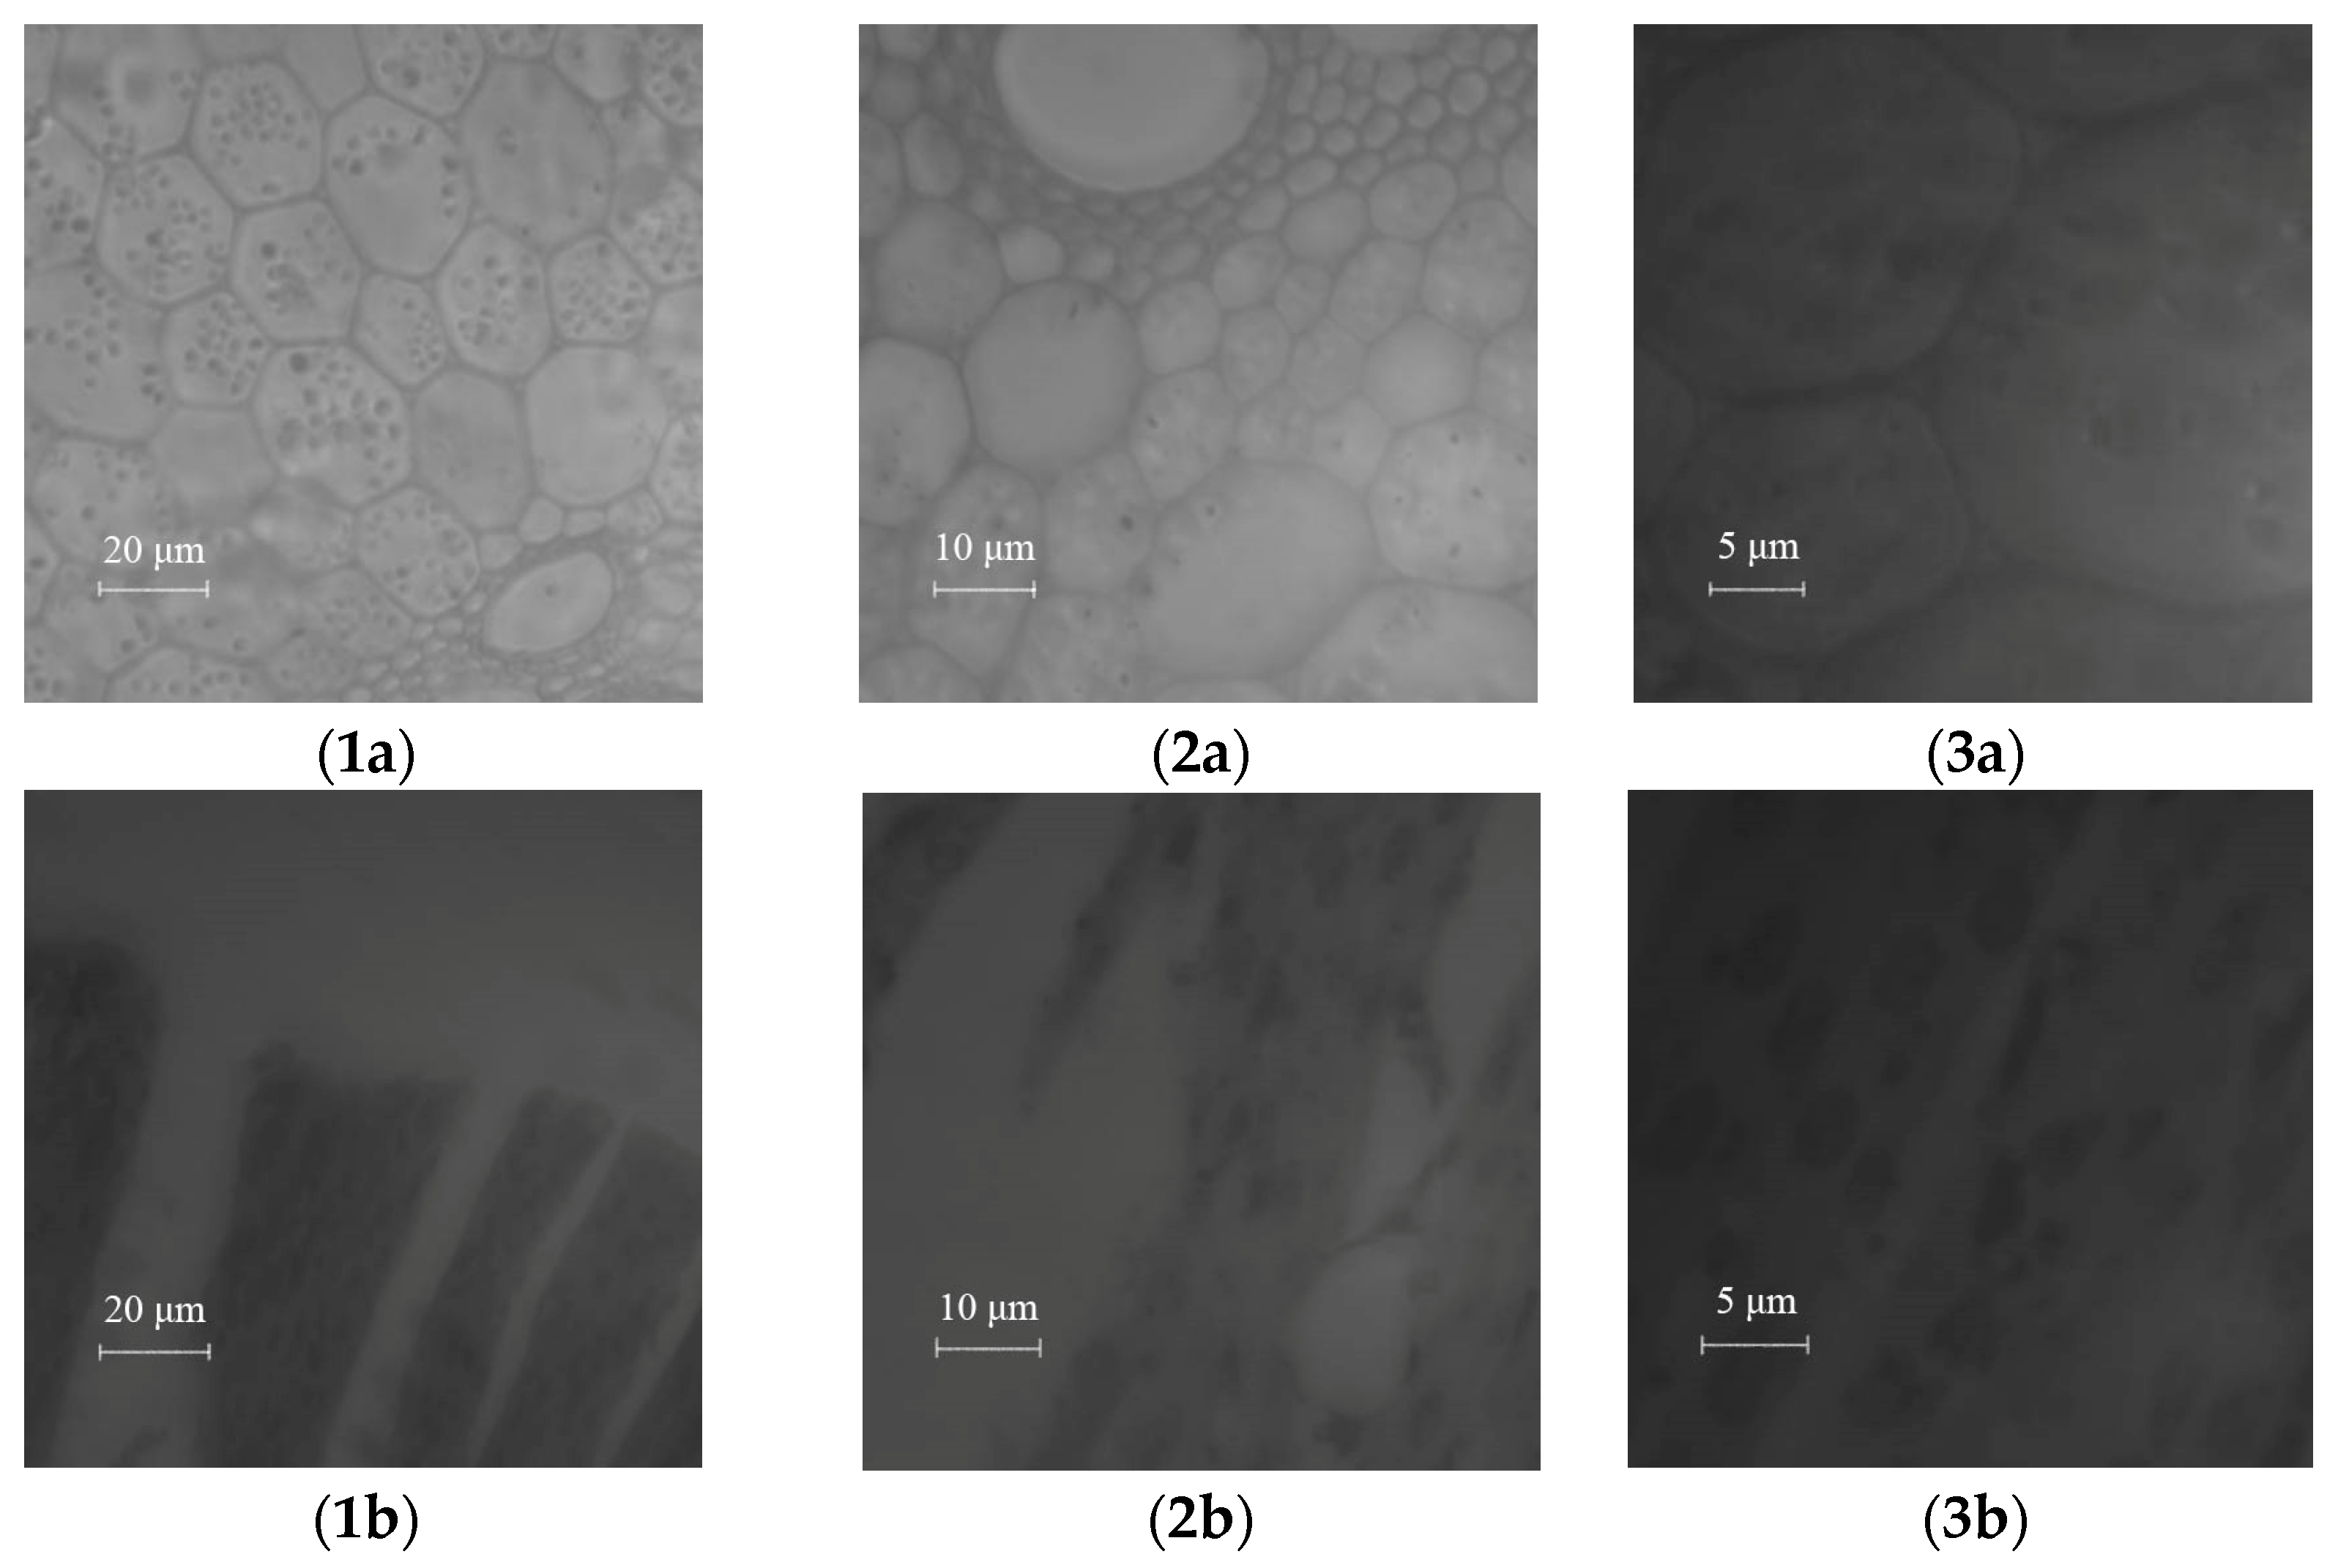
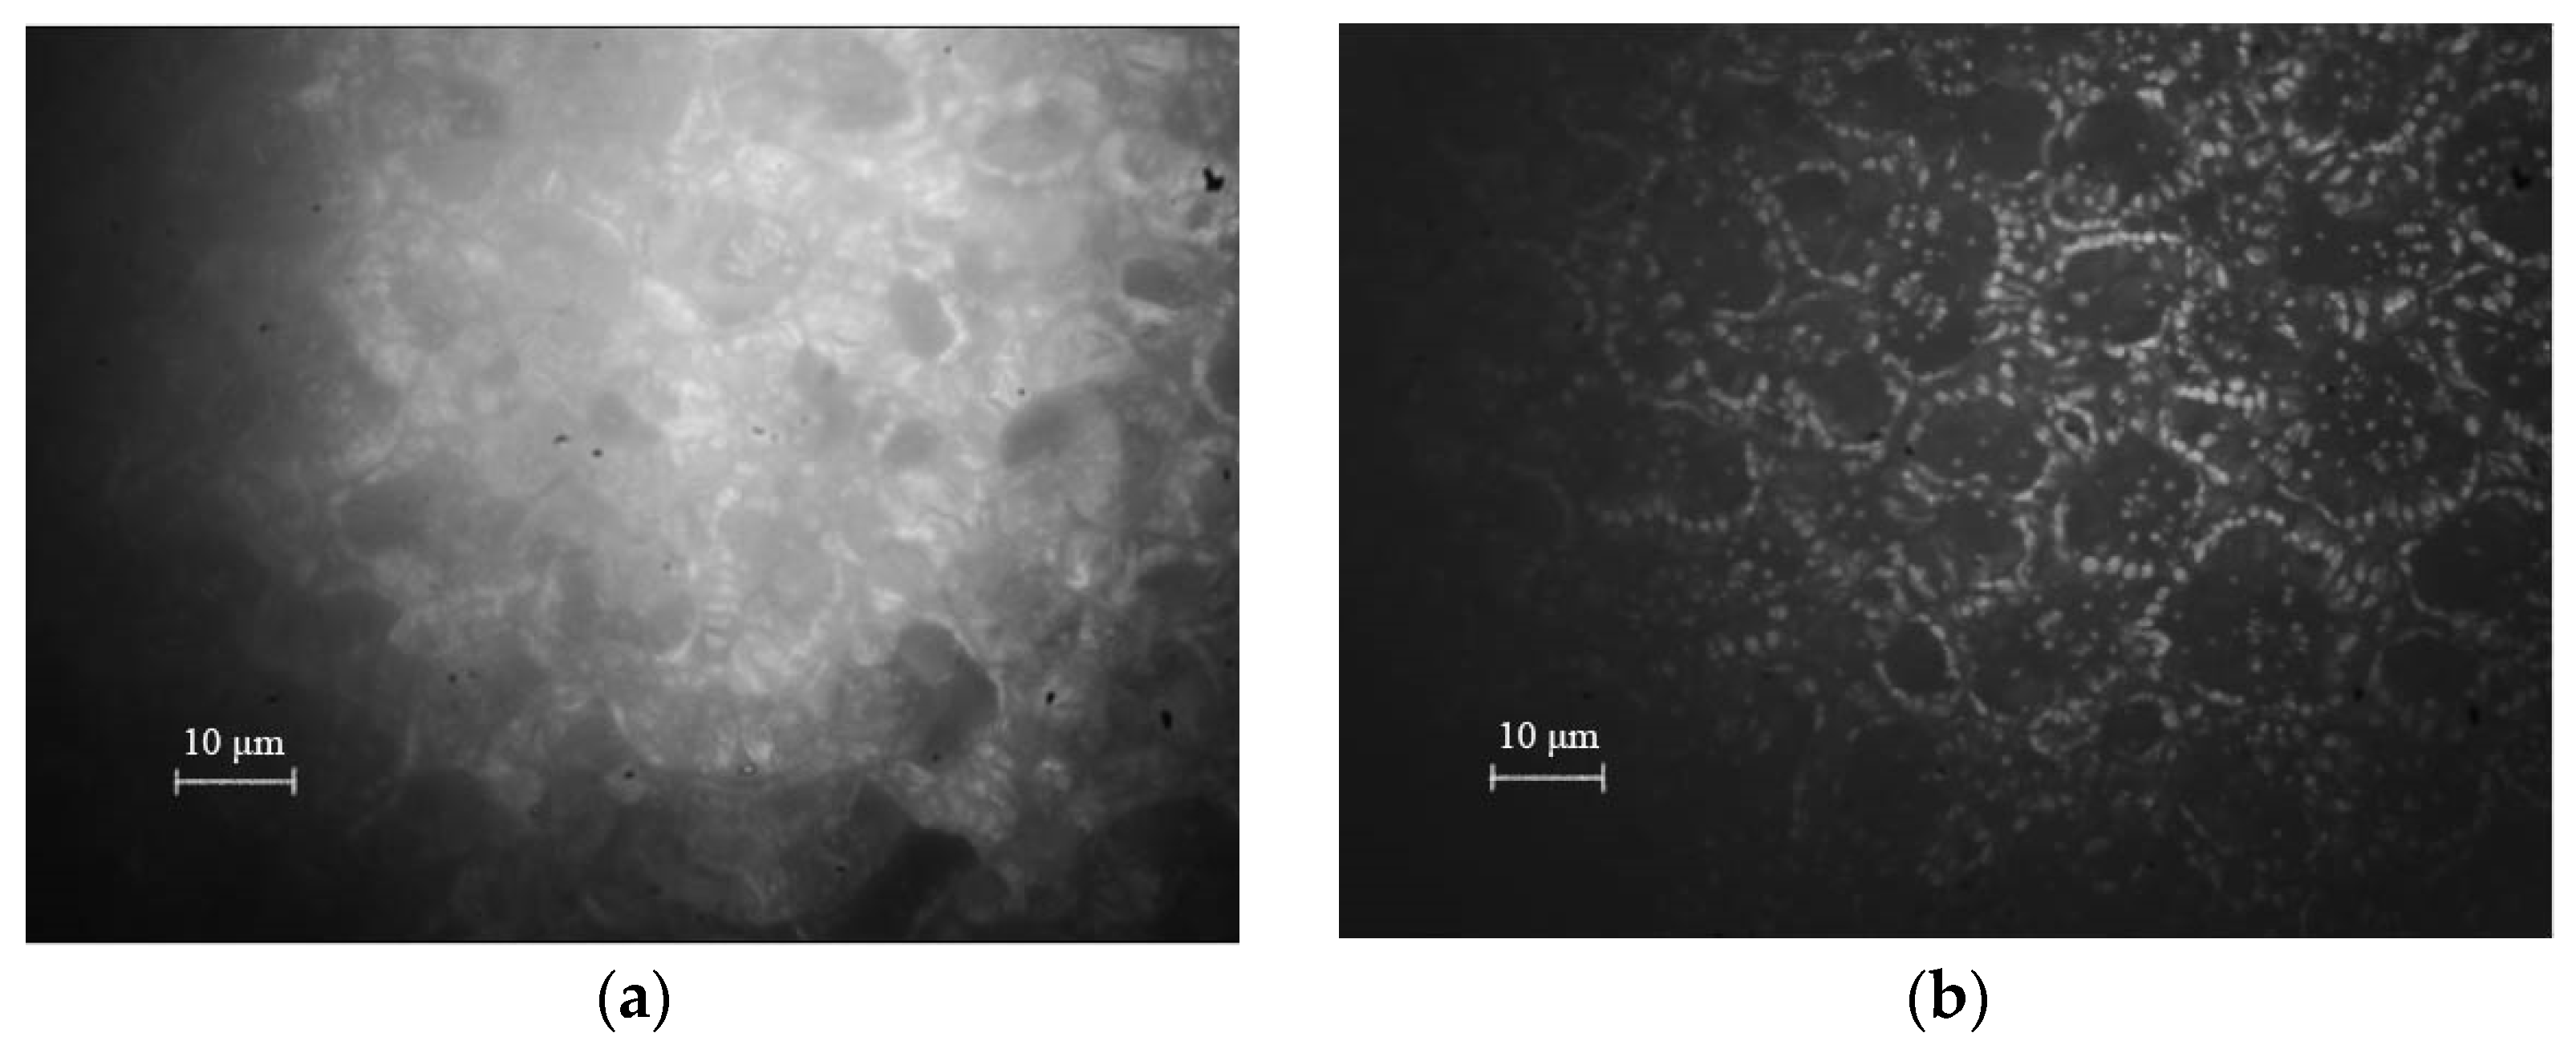
Next, we analyze the light transmission process with different pinhole sizes, as shown in Figure 4.
When the pinhole is too small (Figure 4a,c), the transmittance of the pinhole is reduced, generating a diffraction effect at the pinhole. Its size exceeds the entrance pupil of the objective lens, causing part of the light to be wasted. When the diffracted light passes through, the pinholes that are too small simultaneously block the diffracted light, reducing the signal-to-noise ratio of the system. When the pinhole is too large (Figure 4b,d), the incident light is collimated and may not be completely diffracted, and the light spot cannot cover the entire entrance pupil. The amount of diffracted light increases, but the resolution of the z-axis becomes relatively worse [12]. Only when the diameter of the pinhole is the optimal value can the excitation light evenly cover the entire entrance pupil, and the pinhole can receive the emitted light to the maximum extent. At this time, the system can achieve its relatively ideal resolution.
In confocal microscopy imaging, in the optical path, each pinhole on the spinning disk has the same diameter and is fixed as an excitation and detection pinhole at the same time. The excitation light irradiating the sample is no longer a beam of light transmitted by a single diffraction point but is simultaneously illuminated by thousands of excitation pinholes. This makes the pinhole size even more important. Usually, the optimal size of the pinhole is determined using the Fraunhofer formula, which is the FWHM of the Airy disk size [13,14,15]:
D o p t = 0.5 λ h 1 b = 0.5 λ M N A
Here, D o p t represents the diameter of the pinhole, M represents the magnification of the objective lens, NA represents the numerical aperture of the objective lens, and λ is the wavelength of the reflected light. In the formula, the pinhole diameter is defined as the full width at half maximum of the Airy disk, and this allows about 75% of the light at the central main maximum to pass through. In biology, considering the low light transmission efficiency of biological samples, the pinhole diameter is defined as the distance between the first-order zero points of the Airy disk, which is approximately twice that of Formula (7):
D o p t = 1.2 λ M N A
It can be seen that in a confocal microscope with the same fixed-pinhole diameter, different M/NA ratios are required depending on the different excitation light sources to achieve the optimal confocal effect. However, in practical applications, the pinhole diameter of the pinhole disk in a system is often the optimal pinhole diameter corresponding to the high-magnification objective lens, so the system may sacrifice its resolution performance when using a low-magnification objective lens. This is a problem that is common in confocal microscopy based on fixed-diameter pinhole disks, but it can usually be ignored when observing live targets. For reference, in commercial single-disk confocal microscopes, high-magnification and high-NA objectives are usually given priority to meet design requirements, and the maximum fixed-pinhole size is about 50–70 μm. The above formula was used to calculate the optimal pinhole diameter corresponding to each microscopic objective lens in the system when imaging, as shown in Table 2.
According to the calculation results in the table, the pinhole disk diameter that was finally determined for the system was 50 μm.

3.3. Quantum Efficiency

The original detector used in spinning-disk confocal microscopy (SDCM) was an enhanced camera. It is still currently used as a detector for spinning-disk synchronized-timing video signals in Yokogawa’s core CSU series, with a frame rate of 50 or 60 Hz. The frame rate of 50 Hz is the field rate for the European interlaced video standard CCIR, while 60 Hz is the rate for the American and Japanese RS170 standards. Enhanced cameras have a limited dynamic range and are sensitive and vulnerable to damage in indoor ambient light, making them unsuitable for general use. The timescale and dynamic range of the phenomena of life in living cells place higher requirements on detectors, and the low light level used in SDCM limits the frame rates of detectors. However, Andor Technology launched the electron-multiplying CCD (EMCCD), which was not only able to overcome read noise through on-chip electron multiplication gain, but also provided the highest QE (>90%) at an acquisition speed of hundreds of frames per second [16,17,18]. Since then, the deeply cooled EMCCD has become the optimal choice for SDCM detectors, making SDCM the best tool for live-cell imaging.
In recent years, Coates released a scientific complementary metal–oxide–semiconductor (scientific CMOS or sCMOS) for microscopic imaging [19]. Unlike the CCD and EMCCD, the sCMOS mainly utilizes advances in high-density planar semiconductor processing technology to integrate complex circuits onto the same chip as the photoelectric sensor array. A high-density embedded readout circuit, amplifiers, and analog-to-digital converters enable each row of the sensor to be read out via an independent channel while operating in parallel. Therefore, even moderate pixel readout speeds can be used to achieve a low readout noise and yield very high frame rates (hundreds of fps on full chips and thousands of fps on cropped target regions) when executed in parallel. This parallel planar processing feature enables the sCMOS to be used to create powerful sensor arrays. Currently, the peak QE of the sCMOS with the highest quantum efficiency can reach 95%.
In order to fulfill the imaging requirements of the composite laser confocal microscopy module and match the electronic design of the entire system at the same time, the system adopts the CCD97 and Mt9p031v303 on-chip CMOS active-pixel digital image sensors from the British company e2v. CCD97 is a thin back-illuminated frame transfer EMCCD with 512 × 512 effective pixels and a pixel size of 16 × 16 μm. It has both normal-mode and multiplication-mode imaging methods, with two corresponding readout amplifiers. When cooling at −40 °C in doubling mode, its detection capability can reach 30 photons/pixel/s (the integration time is 0.1 s), thus meeting the needs of low-light detection, and its quantum efficiency can reach over 90%, to meet the need for a high frame rate. The effective number of pixels of Mt9p031v303 is 2592 × 1944, the pixel size is 2.2 × 2.2 μm, the full resolution can reach 14 fps, and the low pixel resolution can reach 53 fps. The two work together in different modes to meet the requirements of high-resolution and high-speed confocal imaging in different scenarios.

3.4. Other Parameters Affecting Image Quality

In actual production processes, the condition of the disk surface will have an impact on the image resolution. This impact can be mainly divided into two categories, namely, disk surface reflection and substrate light transmission. The transmittance of the disk is about 4% and the base material is opaque, so the impact of reflected light on the system is the main consideration. The reflected light directly affects the signal-to-noise ratio of the detector, which is mainly because the excitation light irradiating the back of the pinhole disk is reflected, passes through the beam splitter and the receiving filter, and then enters the detector to form background noise. The degree of interference depends on the reflection of the disk and the cut-off depth of the receiving filter. The average cut-off depth of the receiving filter is generally around OD4, so reducing the reflectivity of the disk is an effective way to reduce background interference. The reflectivity of the disk can be reduced by coating the surface with an absorbing film. A stable and non-deformable tungsten steel substrate was coated with a black reflective film. The actual spinning disk and an optical coherence tomography (OCT) image of the disk surface are shown in Figure 5.

4. Experimental Results and Analysis

The system was tested according to the design indicators, and different types of samples with sizes of 8–10 μm were selected to test the functions of ordinary optical microscopy imaging, fluorescence microscopy imaging, and confocal microscopy imaging. The magnification of the microscope was 4–40×. Some of the measured data are shown in Table 3.
In ordinary optical microscopy imaging mode, there was no scanning structure in the optical path. The 10×, 20×, and 40× objective lenses were used to image animal and plant cells, as shown in Figure 6.
In confocal microscopic imaging mode, when using a 473 nm solid-state laser as the light source, the chlorophyll-containing fluorescent cells in the leaves of ordinary green plants underwent a fluorescence reaction and emitted red light with a wavelength of about 685 nm. The average diameter of the chloroplasts in the plant cells was 4–10 μm. A 20× objective lens was used for the experiments, and the experimental results are shown in Figure 7. The resolution of both images is 1024 × 768. In confocal mode, the focal-plane images obtained are clear and detailed. Compared with the images obtained in normal mode, this provides more possibilities for subsequent processing, such as cell counting and gray value statistics.
During the experimental operation, according to the experimental sample characteristics and experimental scene control, this module can meet the needs of bright-field microscopic observation and high-resolution, three-dimensional confocal microscopic observation of the sample. It can also be used for positioning and quantitative analysis of fluorescently labeled molecules or structures in tissues and cells, real-time quantitative or semi-quantitative determination of ion concentrations and changes, intercellular communication research, cell membrane fluidity measurement, etc. For biological samples of different levels and types such as cells, tissues, biochemical molecules, small model animals, and microorganisms, switch lenses with different magnifications and lasers with different wavelengths, and select appropriate imaging methods for experimental observations.
This operation is controlled by on-orbit operation or space-ground coordination.

5. Conclusions

In order to achieve the microscope imaging of many different types of cells and tissue samples in a space environment, a set of high-speed, high-resolution, high-stability, and low-damage microscopy imaging solutions have been designed and implemented, and these are especially suitable for the observation of living cells in space-based life science experiments. These solutions enable real-time imaging under a variety of conditions in the process of sample culture. It has been proven in ground simulation experiments that in confocal imaging experiments with a variable magnification of 1–40×, the system’s maximum imaging resolution reached 2592 × 1944, the spatial resolution reached 1 μm, and the maximum sampling frequency was 10 fps, which meets the requirements of high-speed live-cell imaging.
This plan is a targeted design for space life science experiments in the life ecological experimental system of the China Space Station. Through the study of in situ composite microscopic observation technology, multi-sample multiple fixation and storage technology during the experimental process and in situ detection and analysis technology of biological samples, combined with the composite laser confocal microscopy imaging system, it provides a variety of detection and analysis methods for the biotechnology experimental system of the China Space Station, improving the research level of China space-based life science experiments. Its main innovation points are:
This project is the first time to carry out research on in situ composite microscopy imaging technology for space-based life science experimental processes, achieving fully automatic, multi-station laser confocal dynamic microscopy imaging in space, which is somewhat innovative;
By summarizing and innovating existing laser confocal microscopy imaging technology, a customized microscopy imaging observation system dedicated to China space-based life science research was developed. Although there are currently some similar or even more sophisticated technologies and equipment on the ground, they are generally relatively large in size and have poor adaptability to mechanical and other environmental environments, making it difficult to perform in situ detection on biological experimental interfaces. After ground experimental testing, this system has been able to achieve dynamic micro-scale multi-target in situ composite microscopic observation and imaging, multiple sample fixation and storage during long-term experiments, in situ composite detection of biological samples, and metabolite analysis.
In subsequent research, there are still many things that need to be improved in the actual space application and engineering of the system. For example, how to improve the system’s sensitivity and image contrast through EMCCD’s low-light detection capability under low-temperature refrigeration conditions; how to add an axial stepping device on the original basis to obtain the light-section image of the sample, truly realizing in situ three-dimensional detection of biological samples, etc. Of course, a large amount of data storage and data processing in this process are also part of the space environment that need to be considered.
This system will become a platform for biological experiments and research on China’s manned space station. On the level of the national space laboratory, this advanced microscopic observation equipment with innovative technical features is capable of being used to carry out cutting-edge life science research based on space biology and its applications. It will provide strong technical support for China’s space-based life science experiments and for the long-term on-orbit service of the subsequent manned space station.

Author Contributions

Conceptualization, R.T. and T.Z.; methodology, R.T. and T.Z.; software, R.T.; validation, R.T.; formal analysis, R.T.; investigation, R.T.; resources, T.Z.; data curation, R.T.; writing—original draft preparation, R.T.; writing—review and editing, T.Z.; visualization, R.T.; supervision, T.Z.; project administration, T.Z.; funding acquisition, T.Z.. All authors have read and agreed to the published version of the manuscript.

Funding

The financial support for the project comes from scientific projects: Experimental Cabin I Mission Biotechnology Experiment Cabinet Scientific Experiment System, China Manned Space Engineering.

Data Availability Statement

Data are contained within the article.

Conflicts of Interest

The authors declare no conflict of interest.

References

  1. Young, J.Z.; Roberts, F. A flying-spot microscope. Nature 1951, 167, 231. [Google Scholar] [CrossRef] [PubMed]
  2. Nipkow, P. Elektrisches Teleskop. Germany Patent no. 30 105, 6 January 1884. [Google Scholar]
  3. Davidovits, P.; Egger, M.D. Scanning laser microscope. Nature 1969, 223, 831. [Google Scholar] [CrossRef] [PubMed]
  4. Xiao, G.Q.; Kino, G.S. A real-time confocal scanning optical microscope. In Scanning Imaging Technology; SPIE: Bellingham, WA, USA, 1987; Volume 809, pp. 107–113. [Google Scholar]
  5. Corle, T.R.; Mantalas, L.C.; Kaack, T.R.; LaComb, L.J. Polarization-enhanced imaging of photoresist gratings in the real-time scanning optical microscope. Appl. Opt. 1994, 33, 670–677. [Google Scholar] [CrossRef] [PubMed]
  6. Chen, L. Novel Designs in Confocal Optical Microscopy; Wayne State University: Detroit, MI, USA, 1992. [Google Scholar]
  7. Egger, M.D.; Petran, M. New reflected-light microscope for viewing unstained brain and ganglion cells. Science 1967, 157, 305–307. [Google Scholar] [CrossRef] [PubMed]
  8. Sheppard, C.J.R.; Mao, X.Q. Confocal microscopes with slit apertures. J. Mod. Opt. 1988, 35, 1169–1185. [Google Scholar] [CrossRef]
  9. New Technologies for CSU-X1 Confocal Scanner Unit. Available online: https://www.yokogawa.com/library/resources/yokogawa-technical-reports/new-technologies-for-csu-x1-confocal-scanner-unit/ (accessed on 1 April 2021).
  10. Hibbs, A.R. Confocal Microscopy for Biologists; Springer Science & Business Media: Berlin/Heidelberg, Germany, 2004. [Google Scholar]
  11. Davis, M. Nikon NIS-Elements Denoise. ai Software: Utilizing Deep Learning to Denoise Confocal Data. Nat. Methods. 2019. Available online: https://www.microscope.healthcare.nikon.com/en_EU/resources/application-notes/nikon-nis-elements-denoise-ai-software-utilizing-deep-learning-to-denoise-confocal-data (accessed on 25 April 2021).
  12. Sako, Y.; Yanagida, T. Single-molecule visualization in cell biology. Nat. Rev. Mol. Cell Biol. 2003, SS1–SS5. [Google Scholar]
  13. Goodman, J.W. Introduction to Fourier Optics; McGraw-Hill: New York, NY, USA, 1968. [Google Scholar]
  14. Kino, G.S. Acoustic Waves: Devices, Imaging, and Analog Signal Processing; Prentice-Hall: Upper Saddle River, NJ, USA, 1987. [Google Scholar]
  15. Kino, G.S.; Xiao, G.Q. Real-time scanning optical microscopes. In Scanning Optical Microscopes; Wilson, T., Ed.; Pergamon Press: Oxford, UK, 1990; pp. 361–387. [Google Scholar]
  16. Coates, C.G.; Denvir, D.J.; Conroy, E.; McHale, N.G.; Thornbury, K.; Hollywood, M. Back-illuminated electron multiplying technology: The world’ s most sensitive CCD for ultralow-light microscopy. In Manipulation and Analysis of Biomolecules, Cells, and Tissues; SPIE: Bellingham, WA, USA, 2003; Volume 4962, pp. 319–328. [Google Scholar]
  17. Coates, C.G.; Denvir, D.J.; McHale, N.G.; Thornbury, K.D.; Hollywood, M.A. Ultra-sensitivity, speed and resolution: Optimizing low-light microscopy with the back-illuminated electron multiplying CCD. In European Conference on Biomedical Optics; Optica Publishing Group: Washington, DC, USA, 2003; pp. 5139–5156. [Google Scholar]
  18. Toomre, D.; Pawley, J.B. Disk-scanning confocal microscopy. In Handbook of Biological Confocal Microscopy; Springer Science & Business Media: Berlin/Heidelberg, Germany, 2006; pp. 221–238. [Google Scholar]
  19. Coates, C. New sCMOS vs. current microscopy cameras. Biophotonics Int. 2011, 18, 24–27. [Google Scholar]
Figure 1. Functional block diagram of the core components of the laser.
Photonics 11 00026 g001
Figure 2. Blurring of light from out-of-focus planes passing through adjacent pinholes and the effects of objective convergence and pinholes: (a) The NA value is 1, the pinhole diameter is 0.5 mm, the pinhole spacing is 2.5 mm, and the central main maximum value of the point object can just pass through the pinhole; (b) part of (a) observed from the front of the pinhole disk; (c) the stage moves downward and the amount of light decreases; (d) distribution of light amount on the scanning disk plane in (c); (e) the distance between the point light source and the focal plane is the same as the pinhole spacing, in which part of the light passes through the pinholes around the pinhole; (f) light distribution on the scanning disk plane in (e).
Photonics 11 00026 g002
Figure 3. Axial intensity point diffusion curves of two kinds of pinhole disks. The dotted line corresponds to PHD-2, and the solid line corresponds to PHD-1.
Photonics 11 00026 g003
Figure 4. Optical transmission paths with different pinhole sizes: (a) the pinhole is too small, the relative beam is too wide, and a large amount of excitation light is blocked; (b) the pinhole is too large, resulting in a narrow beam and small effective aperture; (c) the pinhole is too small and the emitted light is blocked; (d) the pinhole is too large and the definition is reduced.
Photonics 11 00026 g004
Figure 5. Tungsten steel spinning disk (a) and a local OCT scan (b); the surface of the disk is basically flat.
Photonics 11 00026 g005
Figure 6. Wheat cell slice images: (1a) 10× objective lens; (2a) 20× objective lens; (3a) 40× objective lens and cardiomyocyte images: (1b) 10× objective lens; (2b) 20× objective lens; (3b) 40× objective lens.
Photonics 11 00026 g006
Figure 7. Images of chlorophyll fluorescence in common plant leaves: (a) imaging in normal mode; (b) confocal scanning microscope imaging.
Photonics 11 00026 g007
Table 1. Parameters of two types of pinhole disks.
Pinhole Serial NumberPinhole Diameter (μm)Hole Spacing (μm)Transmittance (%)
PHD-1502504
PHD-2505000.8
Table 2. Optimal pinhole diameter when the system used each microscope objective lens.
No.MagnificationNumerical ApertureFluorescence Emission Wavelength (nm)Optimal Pinhole Diameter (μm)
10.04488–64914.64–19.47
20.06488–64919.52–25.96
30.15488–64919.52–25.96
410×0.3488–64919.52–25.96
520×0.45488–64920.03–34.61
640×0.6488–64939.04–51.92
Table 3. Experimental results with different sets of objective lenses.
No.Objective Lens MagnificationNon-Confocal Imaging ResolutionConfocal Imaging Resolution
120×/0.451.74 μm (measured)1.23 μm (measured)
0.69 μm (theoretical)0.5 μm (theoretical)
240×/0.60.87 μm (measured)0.8 μm (measured)
0.52 μm (theoretical)0.38 μm (theoretical)
Disclaimer/Publisher’s Note: The statements, opinions and data contained in all publications are solely those of the individual author(s) and contributor(s) and not of MDPI and/or the editor(s). MDPI and/or the editor(s) disclaim responsibility for any injury to people or property resulting from any ideas, methods, instructions or products referred to in the content.

