Abstract
In order to establish a transferring chain from a photon flux of a single-photon source in quantum radiometry, the nonlinearity of the photodetector needs to be accurately measured. Using the flux superposition method, a nonlinearity measurement setup has been designed. The measurement setup consists of two tungsten halogen lamps, parent–child integrating spheres, an adjustable aperture, a diaphragm tube, and an optical filter. It has the advantage of low polarization error, low interference error, and low stray light effect. The Si photodiode to be measured is cooled to −40 °C to obtain a low noise level for low-flux radiation measurement. The nonlinearity of the Si photodetector is measured for photocurrent ranges from 10−12 A~10−6 A level, with a relative standard uncertainty from 0.0092~0.023%. The relative standard uncertainty of the nonlinearity correction factor ranged from 0.023~0.049%.
1. Introduction
The photometric and radiometric community is constantly working to extend the dynamic range of radiation standards from the classical radiometry regime to the quantum radiometry regime [1]. A single-photon source as the core device for quantum radiometry [2,3] is available in many reliable methods. For example, quantum-dots-based single-photon source [4], the molecule-based single-photon source [5], and correlated photon source using spontaneous parametric down-conversion (SPDC) [6], etc. However, the practical application of single-photon sources will involve the transfer of standards [7,8,9].
A space radiometric benchmark based on correlated photon sources has been proposed [10]. The absolute spectral responsivity of the photodetector is calibrated using the correlated photon source at 108 photons per second, corresponding to a photocurrent of about 10−12 A level for a Si photodiode. A calibrated photodetector is used for solar radiation detection with a radiation power of approximately 10−6 W, corresponding to a photocurrent of about 10−6 A level for a Si photodiode. The standard transferring relies on the absolute responsivity of the photodetector. Ideally, the detector is linear, and its responsivity remains constant at different amounts of radiation. In practice, the precision of solar radiation detection is affected by the nonlinearity error of the photodetector, for which a precise nonlinearity measurement is required.
Methods for testing the nonlinearity of the photodetector have been studied for many years and can be divided into indirect and direct measurement methods [11]. Indirect measurement methods such as Bouguer’s law [12], rotating sectors [13], and the inverse square method [14] require supplementary measurements such as filter transmittance, duty cycle, and distance, which may cause measurement errors. The superposition method is a direct measurement method that does not require the measurement of other physical quantities and has the advantages of simplicity and high accuracy.
A nonlinearity measurement setup based on the superposition method needs to provide two radiation fluxes. Using a single light source to provide multiple radiation fluxes with the double-aperture method has been studied by Sander [15], Boivin [16], etc. In order to cover a wide dynamic range, these setups require custom-made, expensive multi-aperture turntables and precision positioning devices. In contrast, the setup based on the beam-addition method is simple in structure, the flux is controlled by simply adjusting the injection current of the laser [17]. However, in order to reduce interference effects, the difficulty of optical design will be increased [13]. Shin used two light-emitting diodes as light sources [18]. Large dynamic range radiation flux adjustment is achieved by varying the supply current. The nonlinearity of the Si photodiode is tested with a relative standard uncertainty ranging from 0.002% to 0.006% as the photocurrent varies from 10−8 A to 10−3 A. However, the central wavelength of the light-emitting diodes drifts with the variation of the supply current, causing measurement errors. Moreover, the dynamic range is limited by the supply current, and in order to achieve a low radiation flux, an expensive and precise weak current source is required.
In this paper, a high-precision nonlinearity measurement setup based on the superposition method is designed. Two tungsten halogen lamps are mounted on integrating spheres as light sources, which effectively avoids errors caused by polarization and interference effects. The structure of the parent and child integrating spheres is used. The adjustable aperture between two integrating spheres is used to adjust radiation flux. In contrast to adjusting the supply current, this method avoids measurement errors caused by variations in the color temperature of the light source. The nonlinearity of the Si photodetector is measured at 430 nm, 671 nm, and 1000 nm from photocurrent of 10−12 A to 10−6 A with relative standard uncertainty from 0.0092~0.023%. The relative standard uncertainty of the nonlinearity correction factor ranged from 0.023~0.049%.
2. Method
The correlated photon radiometric benchmark uses Si photodiode as radiometer and the preamplifier is transimpedance amplifier (TIA). The combination of Si photodiode and TIA is called Si photodetector. Si photodiode converts radiant flux into current through the photovoltaic effect. The relationship between the radiant flux Φ and its response current Id can be expressed as [19]:
where R represents the responsivity of the photodiode.
The response current passes through the feedback resistor of the TIA and generates a voltage V at the outlet of TIA. The ratio of voltage to current is called the gain G, which is approximately equal to the nominal value of the feedback resistor, which is
However, due to the photodiode shunt resistance and the tolerance of the feedback resistor, the actual gain g of the TIA is different from its nominal gain G. The ratio of the actual gain to the nominal gain is called the gain correction coefficient M:
Then, the output voltage V of Si photodetector can be described as:
where V0 represents the background voltage of the Si photodetector.
In actual measurement, when the Si photodetector receives different ranges of radiant flux, the TIA will adopt different gains. In order to compare signals under different gains, we convert the V into the equivalent current signal I:
The measurement method we used is flux superposition method. Using IA and IB to denote two equivalent current signals corresponding to two radiant fluxes ΦA and ΦB measured by the Si photodetector. When radiant fluxes are superimposed, equivalent current signal is IAB. According to the superposition principle, the nonlinearity L of the photodetector is expressed as [20]:
Intensity of the light source is set with the index n. According to Equations (5) and (6), the nth step nonlinearity of Si photodetector can be expressed as:
Since the superposition of radiant flux is linear, therefore the following relationship exists between the two radiant fluxes and the superimposed radiant flux:
If two radiant fluxes are approximately equal, that is , then the responsivity of the Si photodetector is also considered to be approximately equal, that is . Meanwhile, same TIA gain is used for single channel radiant flux measurement, that is . Therefore, the nonlinearity of Si photodetector can be written as
and it can be seen that the nonlinearity of the Si photodetector is determined by the nonlinearity of the responsivity of the photodiode and the gain correction coefficient of the TIA. The nonlinearity test of Si photodetector takes full consideration of not only the nonlinearity of the photodiode, but also the error of the preamplifier circuit, which is conducive to a more accurate error calibration.
In order to perform nonlinearity correction in a large dynamic range, the superposition of radiant flux in the test needs to satisfy the condition: . In this way, the nonlinearity correction factor Q of the Si photodetector for the entire measurement dynamic range can be expressed as [18]:
3. Detector and Measurement Device
3.1. Cooled Si Photodiode
The correlated photon space radiometric benchmark requires Si photodiode to perform high-precision radiation detection under low radiation flux, that is, Si photodiode is required to have low noise. As shown in Figure 1, the Si photodiode (Hamamatsu, model S3477-03) is cooled by a thermoelectric cooler (TEC) [21]. The photodiode chip is mounted at the cold side of a two-stage thermoelectric cooler (TEC). Meanwhile, a thermistor is also mounted at the cold side of the TEC for temperature monitoring. The Si photodiode chip, two-stage TEC, and thermistor are sealed in a metal package filled with inert gas. The two-stage TEC guarantees the photodiode to be cooled to −20 °C at room temperature. In order to reduce dark current shot noise and thermal noise, etc., we designed a TEC-based heat dissipation structure. Then, we contacted the cold side of another single-stage TEC to the bottom of the metal package through a heat sink, thereby further reducing the temperature of the photodiode chip to −40 °C.
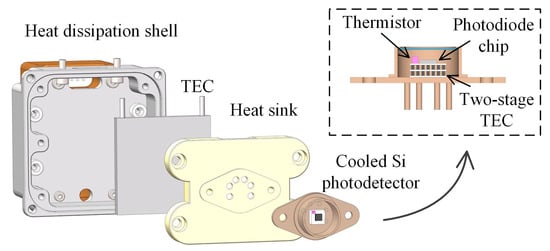
Figure 1.
Design drawing of TEC-cooled Si photodiode.
A temperature control circuit based on the PID algorithm is designed, as shown in Figure 2. The temperature sampling module sends the temperature signal from the thermistor to the PID module after the A/D conversion. The PID module processes the program to generate a control signal and after D/A conversion, it is sent to the TEC current drive module. A triode is selected as the current control device, it controls the TEC driving current by changing the base current. The temperature of TEC changes under the action of the driving current and the temperature feedback is carried out by the thermistor to form a closed-loop control. Finally, the operating temperature of the photodiode chip can be controlled at −40 ± 0.01 °C.

Figure 2.
Si photodiode temperature control flow chart.
We tested and evaluated the performance of the cooled Si photodiode. In the absence of light, the dark current and shunt resistance were measured under a reverse voltage of −100 mV, and the test results were 5 TΩ and 20 fA, respectively. Using a light source composed of a halogen lamp and a monochromator to output monochromatic light of 380~1000 nm, we recorded the spectral response data of a standard Si-trap detector and cooled Si photodiode. The absolute spectral responsivity of the standard Si-trap detector was calibrated by the National Institute of Metrology of China. Comparing the data of the two detectors, the relative spectral responsivity of the cooled Si photodiode can be obtained. Then, by using a laser light source, the absolute spectral responsivity ratio of the Si-trap detector to the cooled Si photodiode at 632.8 nm was tested. Combining the relative spectral responsivity and single-wavelength absolute spectral responsivity ratio, the absolute spectral responsivity of the cooled Si photodiode can be calculated, and the results are shown in Figure 3.
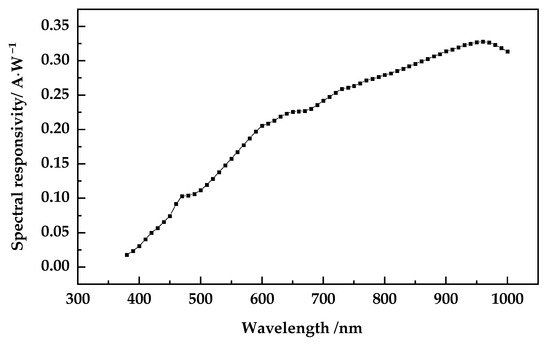
Figure 3.
Spectral responsivity of cooled Si photodiode.
3.2. Wide Dynamic Range Irradiance Integrating Sphere Source (WISS)
Aiming at measuring the nonlinearity of Si photodetectors for low irradiance detection, WISS is designed. Figure 4 shows a schematic diagram of the WISS. The device consists of two tungsten halogen lamps, parent–child integrating spheres, an adjustable aperture, a diaphragm tube, and an optical filter. Halogen tungsten lamp A and B are installed on both sides of the child integrating sphere, and they are powered by an external precision current source (Keithley-2601). An openable baffle is installed between the halogen tungsten lamp and the child integrating sphere. The radiation flux is provided by two independent light sources, which effectively avoid interference effects. The integrating sphere is also an ideal depolarization component, which eliminates the influence of polarization in the measurement.

Figure 4.
Nonlinearity measurement setup.
The integrating sphere light source is a more ideal uniform diffuse reference light source, with excellent surface uniformity and angular uniformity, and has long-term stability. The radiance of the child integrating sphere can be induced by the radiation transfer theory of the cavity [22]:
where L is the output luminance of the integrating sphere, Φ is the total radiation flux emitted by tungsten halogen lamps. A is the total inner surface area of the integrating sphere. ρ is the reflectance of coating on the inner surface of the integrating sphere. f is the opening ratio of the integrating sphere, that is, the ratio of all opening areas to the total inner area.
Assuming that the area of the exit port of the child integrating sphere Ac is much larger than the area of other openings on the child integrating sphere, the radiation flux output generated by the child integrating sphere is:
Figure 5 shows the adjustable aperture that is installed between the child integrating sphere and the parent integrating sphere. The square aperture B structure is fixed in position, and the square aperture A is connected to the linear motor’s screw to achieve horizontal displacement with the movement of the screw. The square aperture B is fixed at the entrance of the parent integrating sphere, and the square aperture A is movable between the exit of the child integrating sphere and square aperture B. The area of the adjustable aperture determines how much radiation flux can enter the parent integrating sphere from the child integrating sphere. The adjustment factor T(d) represents the ratio of the input radiation flux of the parent integrating sphere to the output radiation flux of the child integrating sphere, which can be expressed as the ratio of the adjusted area of the adjustable aperture to its maximum area. The diagonal length D of both square apertures is 15 mm, and when the displacement of square aperture A is l, the adjustment factor T(d) of the adjustable aperture can be expressed as:
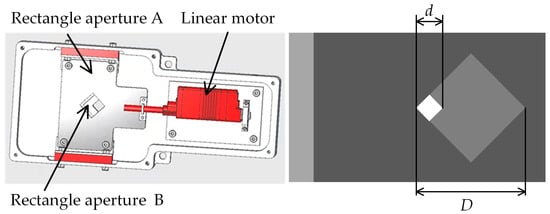
Figure 5.
Adjustable aperture.
The linear motors have a displacement resolution of 15 μm, so the adjustment factor of the adjustable aperture can cover six orders of magnitude. This method of flux adjustment maintains the color temperature of the light source constant.
The entrance and exit of the diaphragm tube have two micro-hole diaphragms, and the stray light diaphragms are installed inside. The diaphragm tube can achieve a uniform irradiance output [23]. An optical filter at the outlet of the diaphragm tube was installed to achieve wavelength selection.
The photodiode to be tested is placed at the outlet of the diaphragm tube and the photocurrent is converted into a voltage signal through a TIA, and then collected by data acquisition (Keysight-34970A).
Through the design of parameters such as the size of the integrating sphere and its opening, the reflectivity of the coating of the integrating sphere, the adjustment coefficient of the adjustable aperture, and the size of the diaphragm tube, an irradiance source with an adjustable dynamic range of seven orders of magnitude is realized. Table 1 lists the parameters of the WISS.

Table 1.
Parameters of the WISS.
4. Results
We present the measurement results at wavelengths of 430 nm (Thorlabs-Newton-NJ-USA-FB430-10), 671 nm (Semrock-Rochester-NY-USA-FF01-671/3), and 1000 nm (Thorlabs--Newton-NJ-USA-FB1000-10) as the representative points for the response spectral band of the Si photodiode.
4.1. Measurement Process
The measurement procedure is as follows:
- Turn on tungsten halogen lamp A and tungsten halogen lamp B, and start the measurement after warming up for 1800 s;
- Close shutter A and shutter B, the signal measured in the absence of light is used to calculate V0;
- Open shutter A and close shutter B. Set the TIA gain to 1012 V/A. Adjust the adjustable aperture to keep the output voltage at the 1 V range. This means that the response current of the photodetector is adjusted to the 10−12 A range;
- The output voltage is collected, and the average value is brought into Equations (2) and (5), which can be calculated to obtain IA(0).
- Open shutter B and close shutter A. Repeat step (4), IB(0) can be calculated.
- Open shutter A and open shutter B. Repeat step (4), IAB(0) can be calculated. It is noted that the gain of TIA can be adjusted in this step if the output voltage is saturated. The IA(0), IB(0), and IAB(0) obtained by completing the above steps can be brought into Equation (6) to calculate L(0).
- Proceed to the next nonlinearity ratio test. Open shutter A and close shutter B. Adjust the adjustable aperture until the output voltage is approximately equal to the average voltage in step (6). Repeat steps (4), (5), (6) to calculate L(1). And so on L(2)…L(n) can be tested and calculated.
4.2. Nonlinearity Result
Filters of 430 nm, 671 nm, and 1000 nm were mounted on the setup, respectively, and the above test steps were performed. The results of the nonlinearity measurement at three wavelengths are given in Figure 6a. The spectral responsivity of the cooled Si photodiode is measured under the μW radiant flux, and the spectral responsivity at each magnitude of radiant flux can be calculated by combining the nonlinearity test results. The spot area of the WISS is 0.785 mm2. According to Equation (1), the photocurrent measurement graph as a function of light power density can be obtained and is shown in Figure 6b.
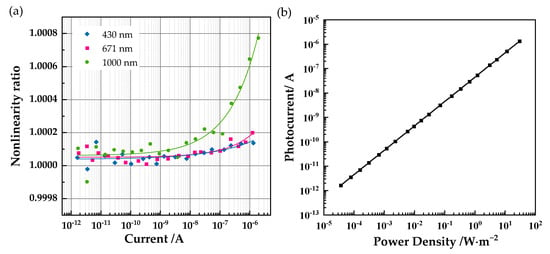
Figure 6.
Nonlinearity measurement result (a), photocurrent measurement graph as a function of light power density at 430 nm (b).
The experimental results show that the nonlinearity of the Si photodetector shows a significant positive correlation with increasing radiation flux, which is consistent with the results of many studies. When the photocurrent is less than 10−9 A, the Si photodiode shows better linearity. After the photocurrent is greater than 10−9 A, the nonlinearity shows an increasing trend as the photocurrent increases.
Experimental results show that the nonlinearity of the Si photodetector is wavelength dependent. When the current is less than 10−9 A, there is no significant difference in the measured nonlinearity at the three wavelengths. When the current is greater than 10−9 A, the nonlinearity ratio shows significant wavelength dependence as the wavelength increases. As an example, when the photocurrent is 10−6 A, the nonlinearity ratio at 671 nm compared to the nonlinearity ratio at 430 nm increases by 0.006%, which corresponds to a growth factor of 2.49 × 10⁻⁷/nm. The nonlinearity ratio at 1000 nm compared to the nonlinearity ratio at 671 nm increases by 0.057%, which corresponds to a growth factor of 1.73 × 10⁻⁵/nm. That is, the nonlinear ratio of the Si photodetector shows an increasing trend, and the growth rate is accelerated.
4.3. Nonlinearity Correction Factor
The nonlinearity correction factors at the three wavelength points are calculated by Equation (10) and plotted in Figure 7. The nonlinearity correction factor is the result of the multiplication of a series of nonlinearity ratios, and thus it shows a more pronounced trend as the radiant flux varies. The nonlinearity of the Si photodetector is clearly observed even for currents less than 10−9 A.

Figure 7.
Nonlinearity correction factor.
When the photocurrent is less than 10−9 A, the nonlinearity correction factor is not significantly different since there is no significant difference in the nonlinearity ratio at each wavelength. When the photocurrent is 10−6 A, the nonlinearity correction factor at 671 nm compared to the nonlinearity correction factor at 430 nm increases by 0.031%, which corresponds to a growth factor of 1.28 × 10⁻⁶/nm. The nonlinearity correction factor at 1000 nm compared to the nonlinearity correction factor at 671 nm increases by 0.24%, which corresponds to a growth factor of 7.43 × 10⁻⁶/nm.
5. Uncertainty Evaluation
The uncertainty of the nonlinearity measurement is mainly introduced by the drift of light sources in nonlinearity measurement time and the uncertainty of voltage measurement. The drift of the light source can be assessed by monitoring the light source output signal over a long period of time. The uncertainty of the voltage measurement can be evaluated by taking multiple sets of output voltage data from the Si photodiode at each radiant flux level.
5.1. Uncertainty Caused by the Drift of the Light Source
The drift of the light source may be caused by the drift of the supply current, the drift of the reflectivity of the inner wall of the integrating sphere, etc. It is difficult to evaluate each influencing factor separately, so we monitor the light source through a Si photodiode and evaluate the relative drift of the light source by analyzing the photocurrent. The light source is warmed for 1800 s. Then, the Si photodiode is placed at the outlet of the light source and the photocurrent is collected using an ammeter (Keithley-6517b).
The nonlinearity test time for each step is less than 200 s, so we divide the current data into groups for every 200 s, making a linear fit to the current data over 200 s to obtain a slope of a. The uncertainty caused by the drift of the light source is expressed as:
where Imean is the mean current over 200 s.
The measured photocurrent and the uncertainty caused by the drift of the light source are shown in Figure 8. The results show that the uncertainty caused by the drift of the light source is less than 0.0091% over the 200 s test time.
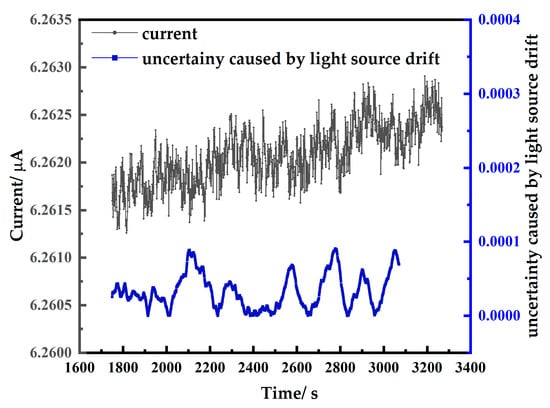
Figure 8.
Uncertainty caused by drift of the light source.
5.2. Uncertainty Caused by the Voltage Measurement
The voltage measurement uncertainty may be caused by the noise of the photodiode and TIA, the leak current from the power source of the TIA, temperature drift of the TIA, etc. In order to reduce the influence of light source drift on the evaluation of voltage measurement uncertainty, the preheating time of the light source is increased to 6 h. The Si photodiode is placed at the outlet of the light source, connecting the photodiode to a TIA, and the voltage is sampled using data acquisition. The radiation flux of the light source was adjusted so that the photocurrent of the Si photodetector is gradually superimposed from 10−9 A to 10−6 A, and the output voltage is recorded for use in uncertainty evaluation.
In the calculation of nonlinearity, the voltage value is the mean of N times the measured voltage data:
The standard uncertainty of the voltage measurement is expressed as:
The ratio of the standard uncertainty to the mean value is called the relative standard uncertainty and is expressed as:
The nonlinearity is determined by the voltage signals VA, VB, and VAB, so the standard uncertainty introduced by the uncertainty of the voltage measurement can be expressed as:
The relative standard uncertainty caused by voltage measurement is therefore:
The uncertainty of the nonlinearity is evaluated according to the propagation equation for relative standard uncertainties:
The nonlinearity correction factor for a large dynamic range is obtained by multiplying a series of nonlinearities. Therefore, the relative uncertainty of the nonlinearity correction factor is obtained by adding the relative standard uncertainty of this series of nonlinearities:
Figure 9 shows the uncertainty of the nonlinearity and the uncertainty of the nonlinearity correction factor. The nonlinearity of Si photodetector could be measured with a relative standard uncertainty ranging from 0.0092~0.023% as the photocurrent varies from 10−6 A~10−12 A level. Relative standard uncertainties for nonlinearity correction factors are 0.023~0.049%.
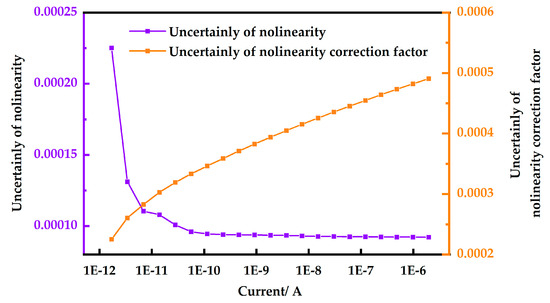
Figure 9.
Uncertainty caused by voltage measurement.
6. Discussion
The purpose of this study is to evaluate the nonlinearity of the Si photodiode of correlated photon radiometric benchmark, and a nonlinearity measurement setup (WISS) was developed to evaluate the nonlinearity. This is because the Si photodiode of the correlated photon radiometric benchmark is calibrated under the photon source and then used for solar irradiance observation. The radiant flux of the two operating modes is six orders of magnitude different, and the nonlinearity of the Si photodiode will cause measurement errors.
The WISS designed in this paper meets the dynamic range requirements of the radiation flux of the correlated photon radiometric benchmark and can be used to realize the nonlinearity test of the Si photodiode. The test results show that at the wavelengths of 430 nm, 671 nm, and 1000 nm, the nonlinearity correction factors of Si photodiode are 1.0013, 1.0016, and 1.0041, respectively, and the uncertainty of the correction factors is about 0.049%. In Figure 6a, we can observe that when the photocurrent is less than 10−9 A, the Si photodiode shows a good linearity. The measurement uncertainty of nonlinearity in this range is limited by the noise of the photodiode and its amplification circuit, so when the photocurrent is less than 10−9 A, whether its nonlinearity needs to be corrected is worth considering. Notably, the results only apply to a specific cooled Si photodiode, a specific TIA, and a specific test environment, changing any of these conditions will affect the nonlinearity test results.
The WISS adopts the structure of integrating spheres, which is suitable for photodetectors with windows. The WISS can achieve an irradiance adjustment of six orders of magnitude, so the spectral range and dynamic range needs of other types of photodetectors can be achieved by changing the light source, light source power, and filters. Semiconductor devices have been greatly developed in recent years [24,25], so we will explore new types of photodetectors as an important research direction to improve radiation transfer dynamic range and accuracy. Whether the WISS is suitable for other types of photodetectors also needs to consider the photosensitive area of the photodetector, which can also be achieved by changing the size of the diaphragm tube.
7. Conclusions
In order to achieve radiation standard transfer over a dynamic range of six orders of magnitude, nonlinearity testing is required for Si photodetectors. This paper develops a nonlinearity measurement setup based on the superposition method, specially designed for correlated photon radiometric detectors with a single photodiode chip, and in packages with a window. The setup is simple in structure, small in size, and has the advantages of low polarization error, low interference error, and low stray light effect. Radiation flux is adjusted by an adjustable aperture, which ensures constant color temperature of the light source.
The nonlinearity of the Si photodetector is measured at 430 nm, 671 nm, and 1000 nm from photocurrent of 10−12 A to 10−6 A level with relative standard uncertainty from 0.0092~0.023%. The relative standard uncertainty of the nonlinearity correction factor ranged from 0.023~0.049%. The nonlinearity measurement setup can be used to achieve high-precision low-radiation flux range nonlinearity measurements, which are shown to be of importance for quantum radiometry when large dynamic range standard transferring is required.
Further research is concerned with optimizing the temperature control circuit of the cooled photodiode to achieve an adjustable temperature function so that the temperature dependence of the nonlinearity can be studied. As the setup uses a tungsten halogen lamp with a spectral range of 350 nm to 2500 nm, the nonlinearity characteristics of the NIR detector can be further investigated.
Author Contributions
Conceptualization, X.Z. and Y.L.; formal analysis, Z.L., Y.Y., P.Z. and W.Z.; investigation, Y.L.; writing—original draft preparation, Y.L.; writing—review and editing, Z.L. and Y.L.; funding acquisition, X.Z. All authors have read and agreed to the published version of the manuscript.
Funding
This research was funded by the National Key Research and Development Program of China (No. 2022YFB3903103).
Institutional Review Board Statement
Not applicable.
Informed Consent Statement
Not applicable.
Data Availability Statement
Not applicable.
Conflicts of Interest
The authors declare no conflict of interest.
References
- Zwinkels, J.C.; Ikonen, E.; Fox, N.P.; Ulm, G.; Rastello, M.L. Photometry, radiometry and ‘the candela’: Evolution in the classical and quantum world. Metrologia 2010, 47, R15–R32. [Google Scholar] [CrossRef]
- Chunnilall, C.J.; Degiovanni, I.P.; Kück, S.; Müller, I.; Sinclair, A.G. Metrology of single-photon sources and detectors: A review. Opt. Eng. 2014, 53, 081910. [Google Scholar] [CrossRef]
- Dai, F.; Tian, Q.Q.; Huang, S.Y.; Wang, M.; Tu, C.H.; Sheng, Y.; Li, Y.N.; Wang, H.T. Photon pair generation in lithium niobate waveguide periodically poled by femtosecond laser. Chin. Opt. Lett. 2023, 21, 042701. [Google Scholar] [CrossRef]
- Li, R.S.; Liu, F.Q.; Lu, Q.Y. Quantum Light Source Based on Semiconductor Quantum Dots: A Review. Photonics 2023, 10, 639. [Google Scholar] [CrossRef]
- Lombardi, P.; Trapuzzano, M.; Colautti, M.; Margheri, G.; Degiovanni, I.P.; Lopez, M.; Kuck, S.; Toninelli, C. A Molecule-Based Single-Photon Source Applied in Quantum Radiometry. Adv. Quantum Technol. 2019, 3, 1900083. [Google Scholar] [CrossRef]
- Polyakov, S.V.; Migdall, A.L. High accuracy verification of a correlated-photon- based method for determining photoncounting detection efficiency. Opt. Express 2007, 15, 1390–1407. [Google Scholar] [CrossRef] [PubMed]
- Rodiek, B.; Lopez, M.; Hofer, H.; Porrovecchio, G.; Smid, M.; Chu, X.L.; Gotzinger, S.; Sandoghdar, V.; Lindner, S.; Becher, C.; et al. Experimental realization of an absolute single-photon source based on a single nitrogen vacancy center in a nanodiamond. Optica 2017, 4, 71–76. [Google Scholar] [CrossRef]
- Porrovecchio, G.; Smid, M.; Lopez, M.; Hofer, H.; Rodiek, B.; Kuck, S. Comparison at the sub-100 fW optical power level of calibrating a single-photon detector using a high-sensitive, low-noise silicon photodiode and the double attenuator technique. Metrologia 2016, 53, 1115–1122. [Google Scholar] [CrossRef][Green Version]
- Bae, I.-H.; Park, S.; Hong, K.-S.; Park, H.S.; Lee, H.J.; Moon, H.S.; Borbely, J.S.; Lee, D.-H. Detection efficiency measurement of single photon avalanche photodiodes by using a focused monochromatic beam tunable from 250 nm to 1000 nm. Metrologia 2019, 56, 035003. [Google Scholar] [CrossRef]
- Zheng, X.B.; Xia, M.P.; Zhai, W.C.; Hu, Y.B.; Li, J.J.; Yuan, Y.L.; Pang, W.W. SI Traceable Solar Spectral Irradiance Measurement Based on a Quantum Benchmark: A Prototype Design. Remote Sens. 2020, 12, 1454. [Google Scholar] [CrossRef]
- Zwinkels, J.C.; Gignac, D.S. Automated high precision variable aperture for spectrophotometer linearity testing. Appl. Opt. 1991, 30, 1678–1687. [Google Scholar] [CrossRef] [PubMed]
- Bennett, H.E. Accurate method for determining photometric linearity. Appl. Opt. 1966, 5, 1265–1270. [Google Scholar] [CrossRef]
- Kunz, H. Representation of the Temperature Scale above 1337.58 K with Photoelectric Direct Current Pyrometers. Metrologia 1969, 5, 88–102. [Google Scholar] [CrossRef]
- Talone, M.; Zibordi, G. Non-linear response of a class of hyper-spectral radiometers. Metrologia 2018, 55, 747–758. [Google Scholar] [CrossRef]
- Sanders, C.L. A Photocell Linearity Tester. Appl. Opt. 1962, 1, 207–211. [Google Scholar] [CrossRef]
- Boivin, L.P. Automated Absolute and Relative Spectral Linearity Measurements on Photovoltaic Detectors. Metrologia 1993, 30, 355–360. [Google Scholar] [CrossRef]
- Haapalinna, A.; Kübarsepp, T.; Kärhä, P.; Ikonen, E. Measurement of the absolute linearity of photodetectors with a diode laser. Meas. Sci. Technol. 1999, 10, 1075–1078. [Google Scholar] [CrossRef]
- Shin, D.J.; Park, S.; Jeong, K.L.; Park, S.N.; Lee, D.H. High-accuracy measurement of linearity of optical detectors based on flux addition of LEDs in an integrating sphere. Metrologia 2014, 51, 25–32. [Google Scholar] [CrossRef]
- Song, X.; Dong, W.; Yuan, Z.; Lu, X.; Li, Z.; Duanmu, Q. Investigation of the linearity of the NIM FTIR infrared spectral emissivity measurement facility by means of flux superposition method. Infrared Phys. Technol. 2020, 109, 103416. [Google Scholar] [CrossRef]
- Sanders, C.L. Accurate Measurements of and Corrections for Nonlinearities in Radiometers. J. Res. Natl. Bur. Stand. A Phys. Chem. 1972, 76A, 437–453. [Google Scholar] [CrossRef]
- Datasheet of Hamamatsu-S2592 Si photodiode. Available online: https://www.hamamatsu.com.cn/content/dam/hamamatsu-photonics/sites/documents/99_SALES_LIBRARY/ssd/s2592-03_etc_kspd1003e.pdf (accessed on 29 August 2023).
- Carr, K.F. Integrating sphere theory and applications Part I: Integrating sphere theory and design. Surf. Coat. Int. 1997, 80, 380–385. [Google Scholar] [CrossRef]
- Johnson, B.C.; Bruce, S.S.; Early, E.A.; Houston, J.M.; O’Brian, T.R.; Thompson, A.; Hooker, S.B.; Mueller, J.L. The Fourth SeaWiFS Intercalibration Round-Robin Experiment (SIRREX-4). NASA Technical Memorandum. 1996, 104566, 37. [Google Scholar]
- Talib, M.; Manzoor, S.; Sharma, P.; Tripathi, N.; Platonov, V.; Pavelyev, V.; Volkov, V.S.; Arsenin, A.V.; Syuy, A.V.; Hasan, P.M.Z.; et al. Development of high-performance broadband optical detector for cryogenic to elevated operating temperature. Mater. Sci. Semicond. Process. 2023, 158, 107364. [Google Scholar] [CrossRef]
- Xu, Z.H.; Yu, Y.G.; Arya, S.; Niaz, I.A.; Chen, Y.M.; Lei, Y.S.; Miah, M.A.; Zhou, J.Y.; Zhang, A.C.; Yan, L.J.; et al. Frequency- and Power-Dependent Photoresponse of a Perovskite Photodetector Down to the Single-Photon Level. Nano Lett. 2020, 20, 2144–2151. [Google Scholar] [CrossRef] [PubMed]
Disclaimer/Publisher’s Note: The statements, opinions and data contained in all publications are solely those of the individual author(s) and contributor(s) and not of MDPI and/or the editor(s). MDPI and/or the editor(s) disclaim responsibility for any injury to people or property resulting from any ideas, methods, instructions or products referred to in the content. |
© 2023 by the authors. Licensee MDPI, Basel, Switzerland. This article is an open access article distributed under the terms and conditions of the Creative Commons Attribution (CC BY) license (https://creativecommons.org/licenses/by/4.0/).