Detection of CO2 and CH4 Concentrations on a Beijing Urban Road Using Vehicle-Mounted Tunable Diode Laser Absorption Spectroscopy

 , ,
, ,
Abstract
:1. Introduction
2. Principles and Analysis of Measurement
2.1. Basic Principles and Concepts
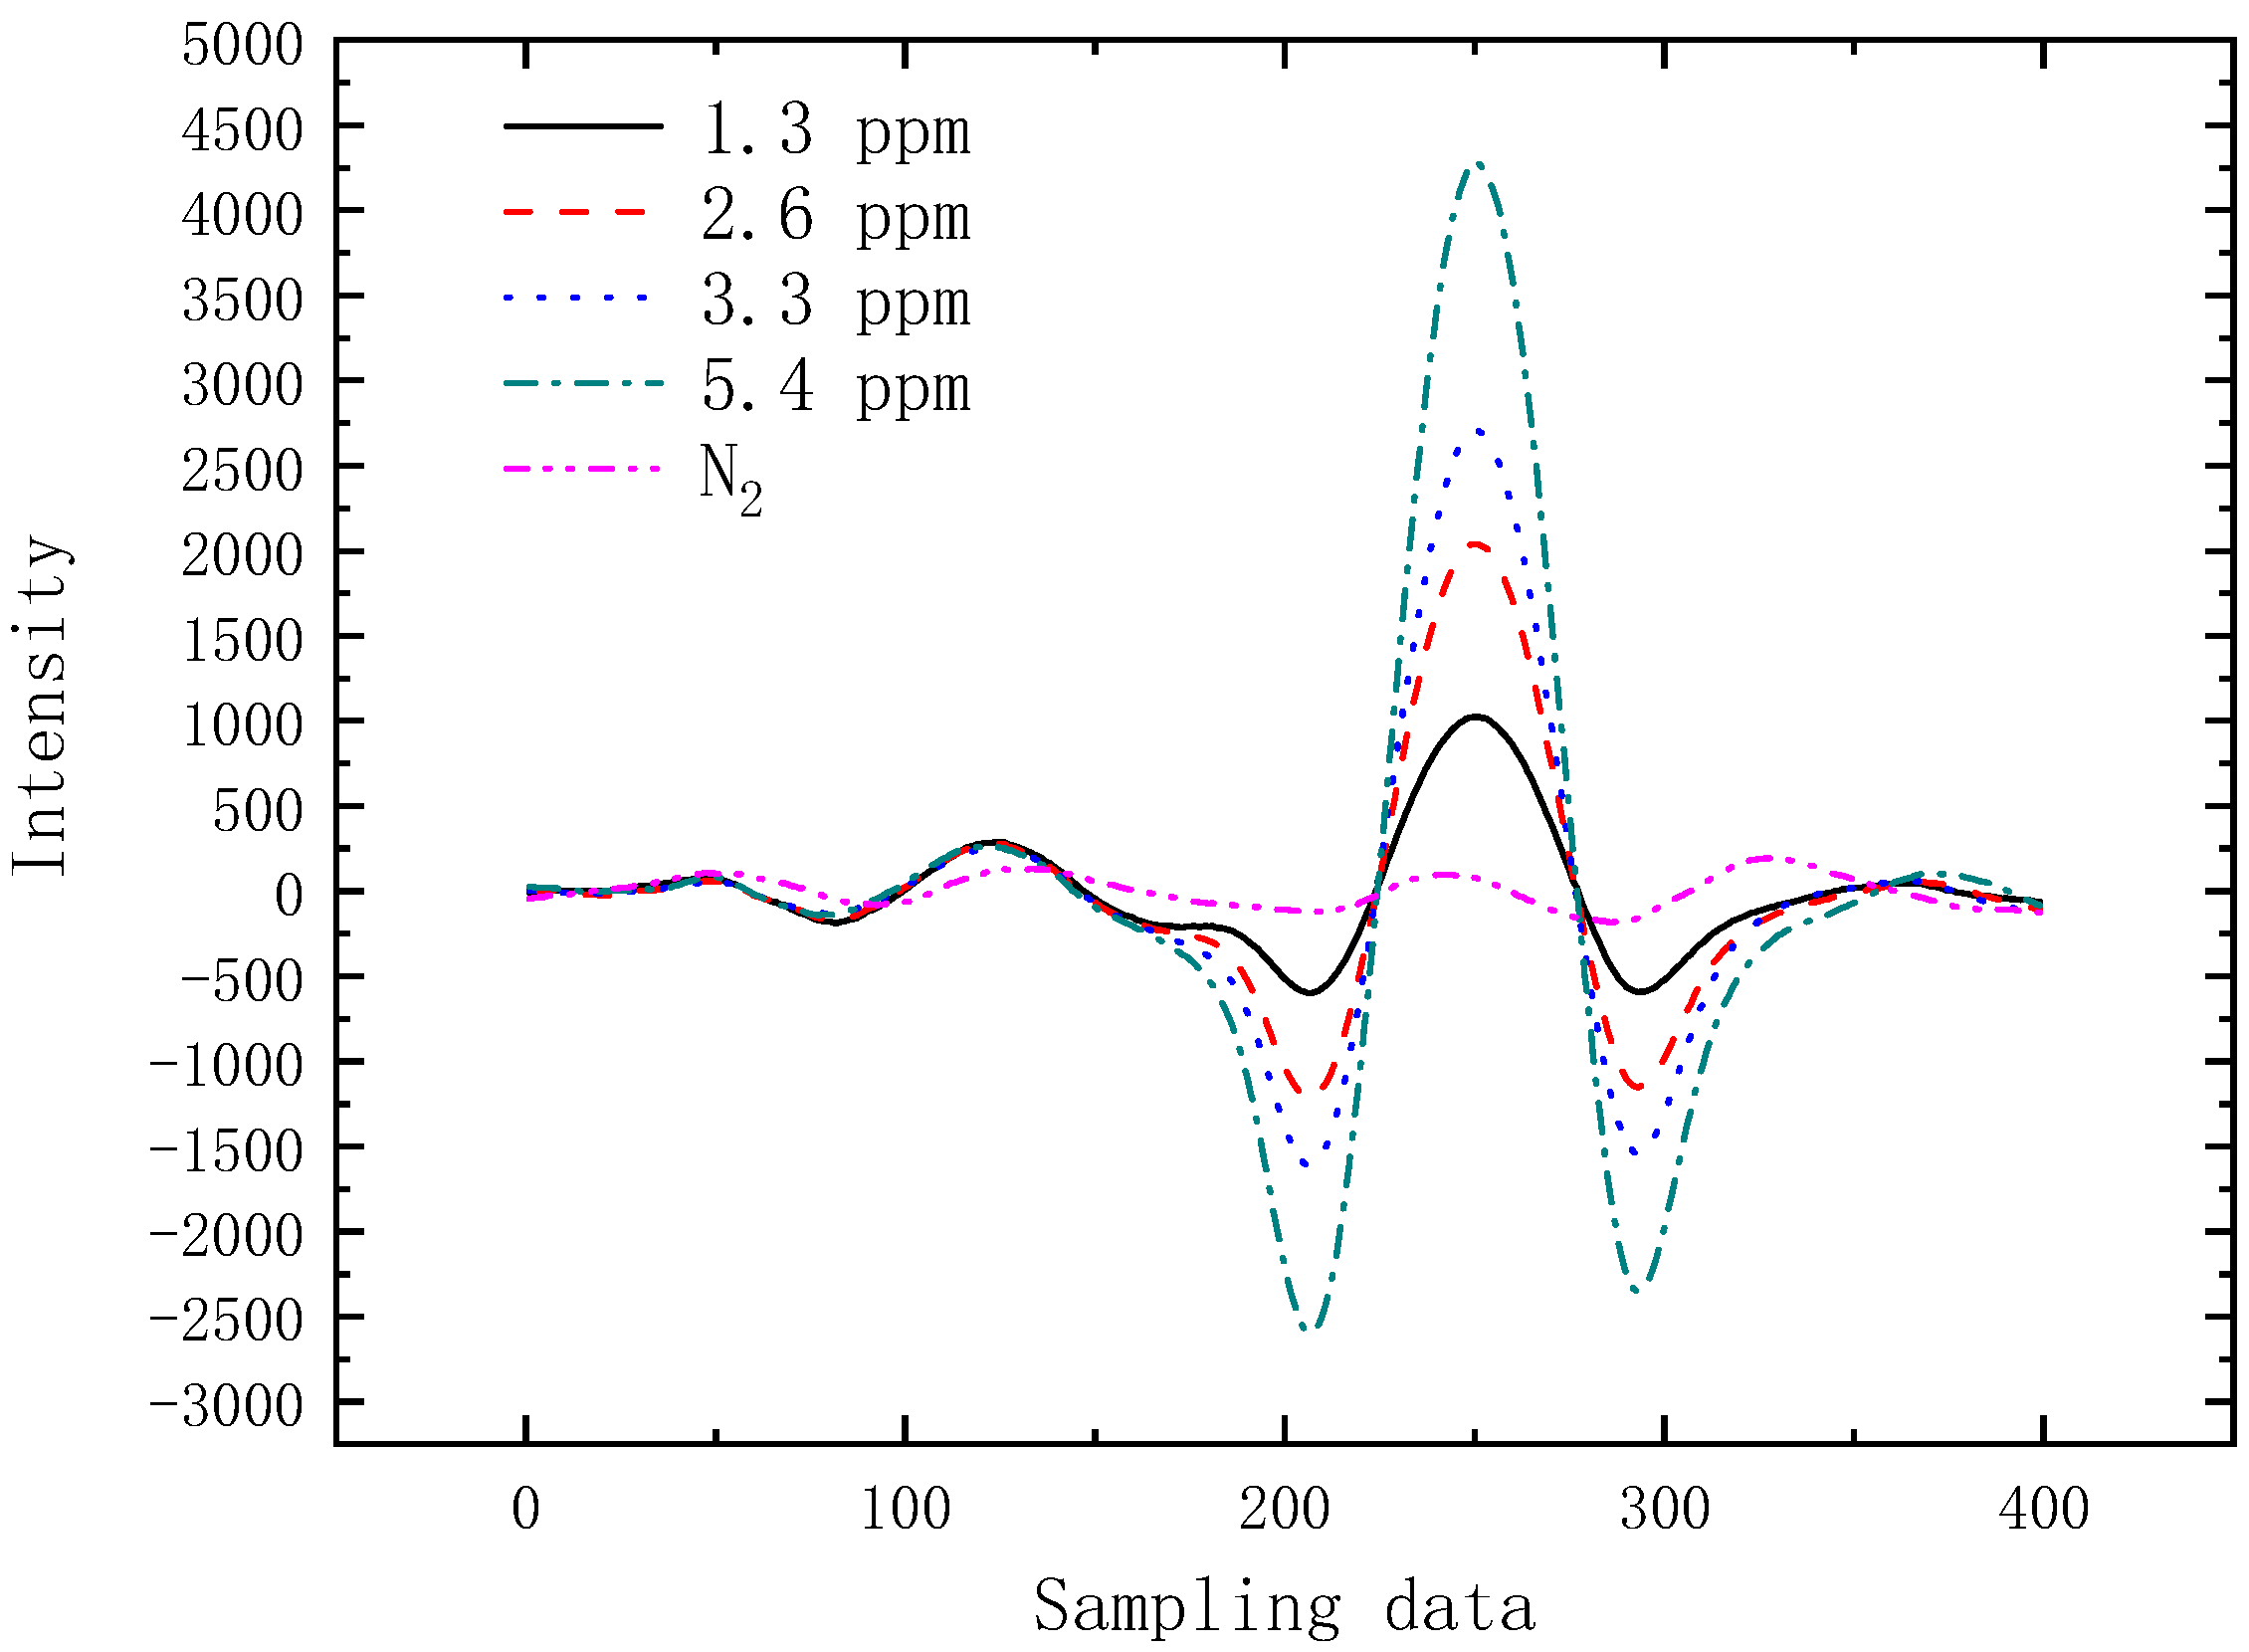
2.2. Principle of Derivative Absorption Spectroscopy Technique
3. Experimental Device and Spectral Processing
3.1. Hardware Section
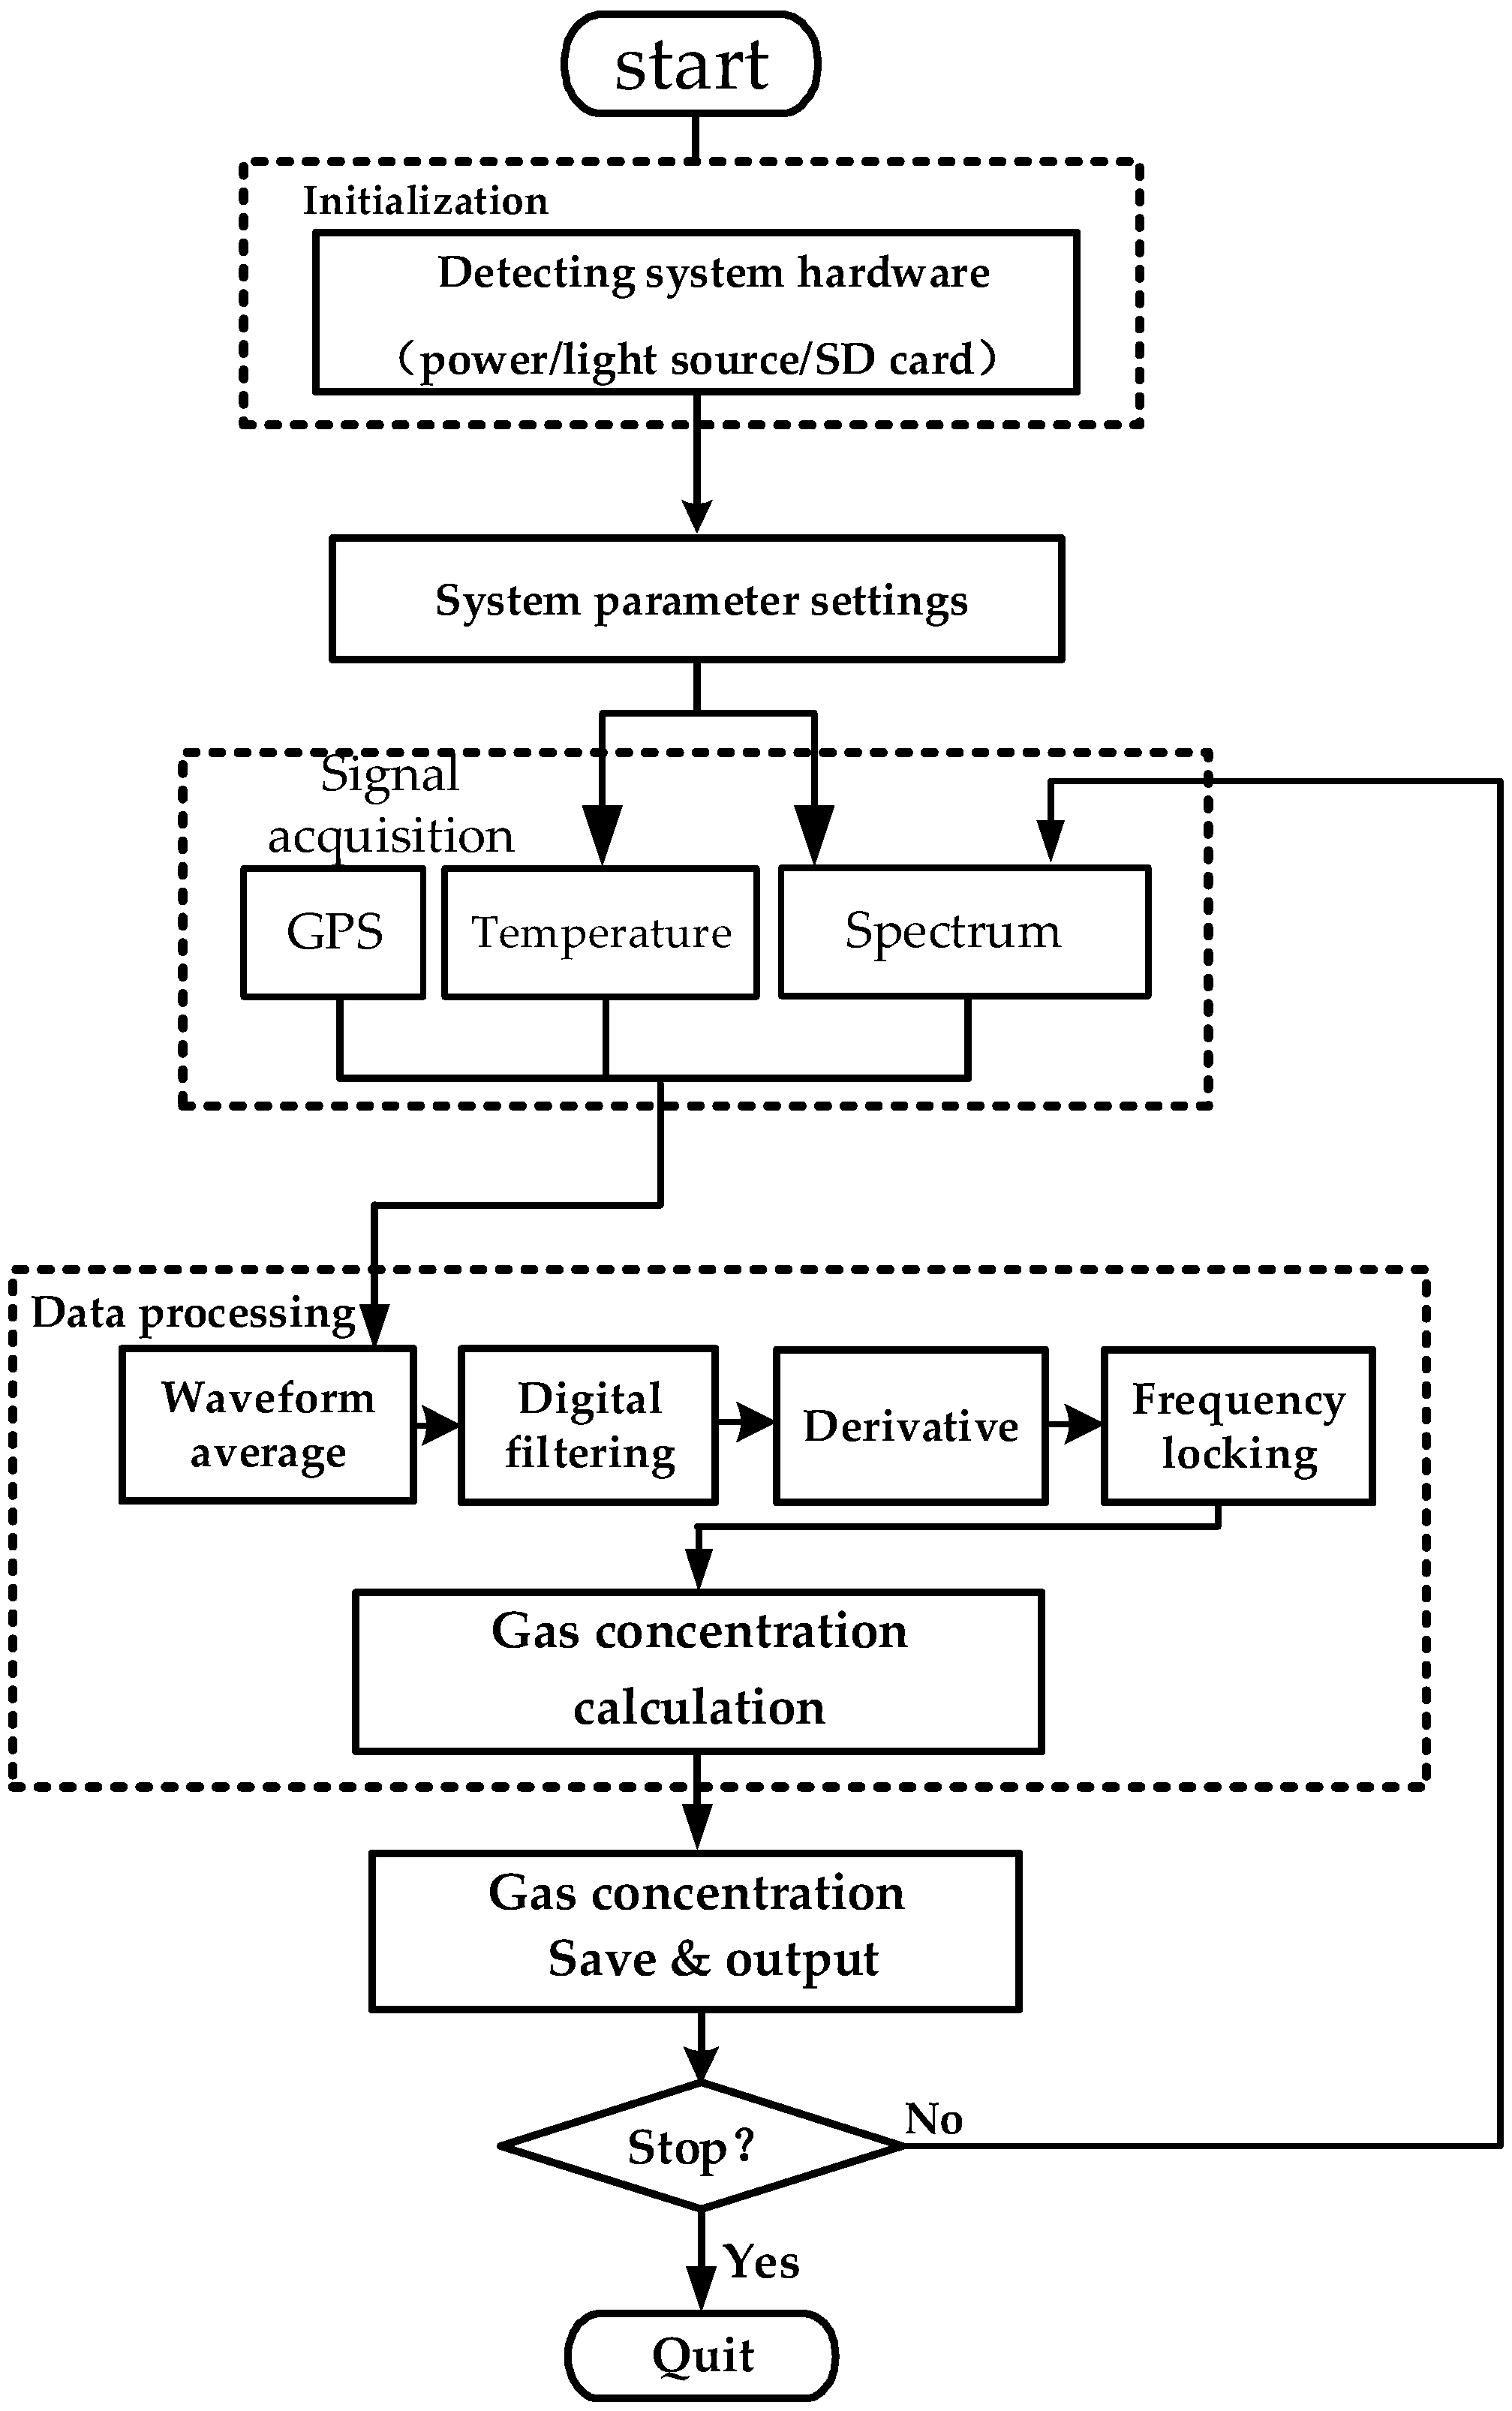
3.2. Software Section
4. Results and Discussion
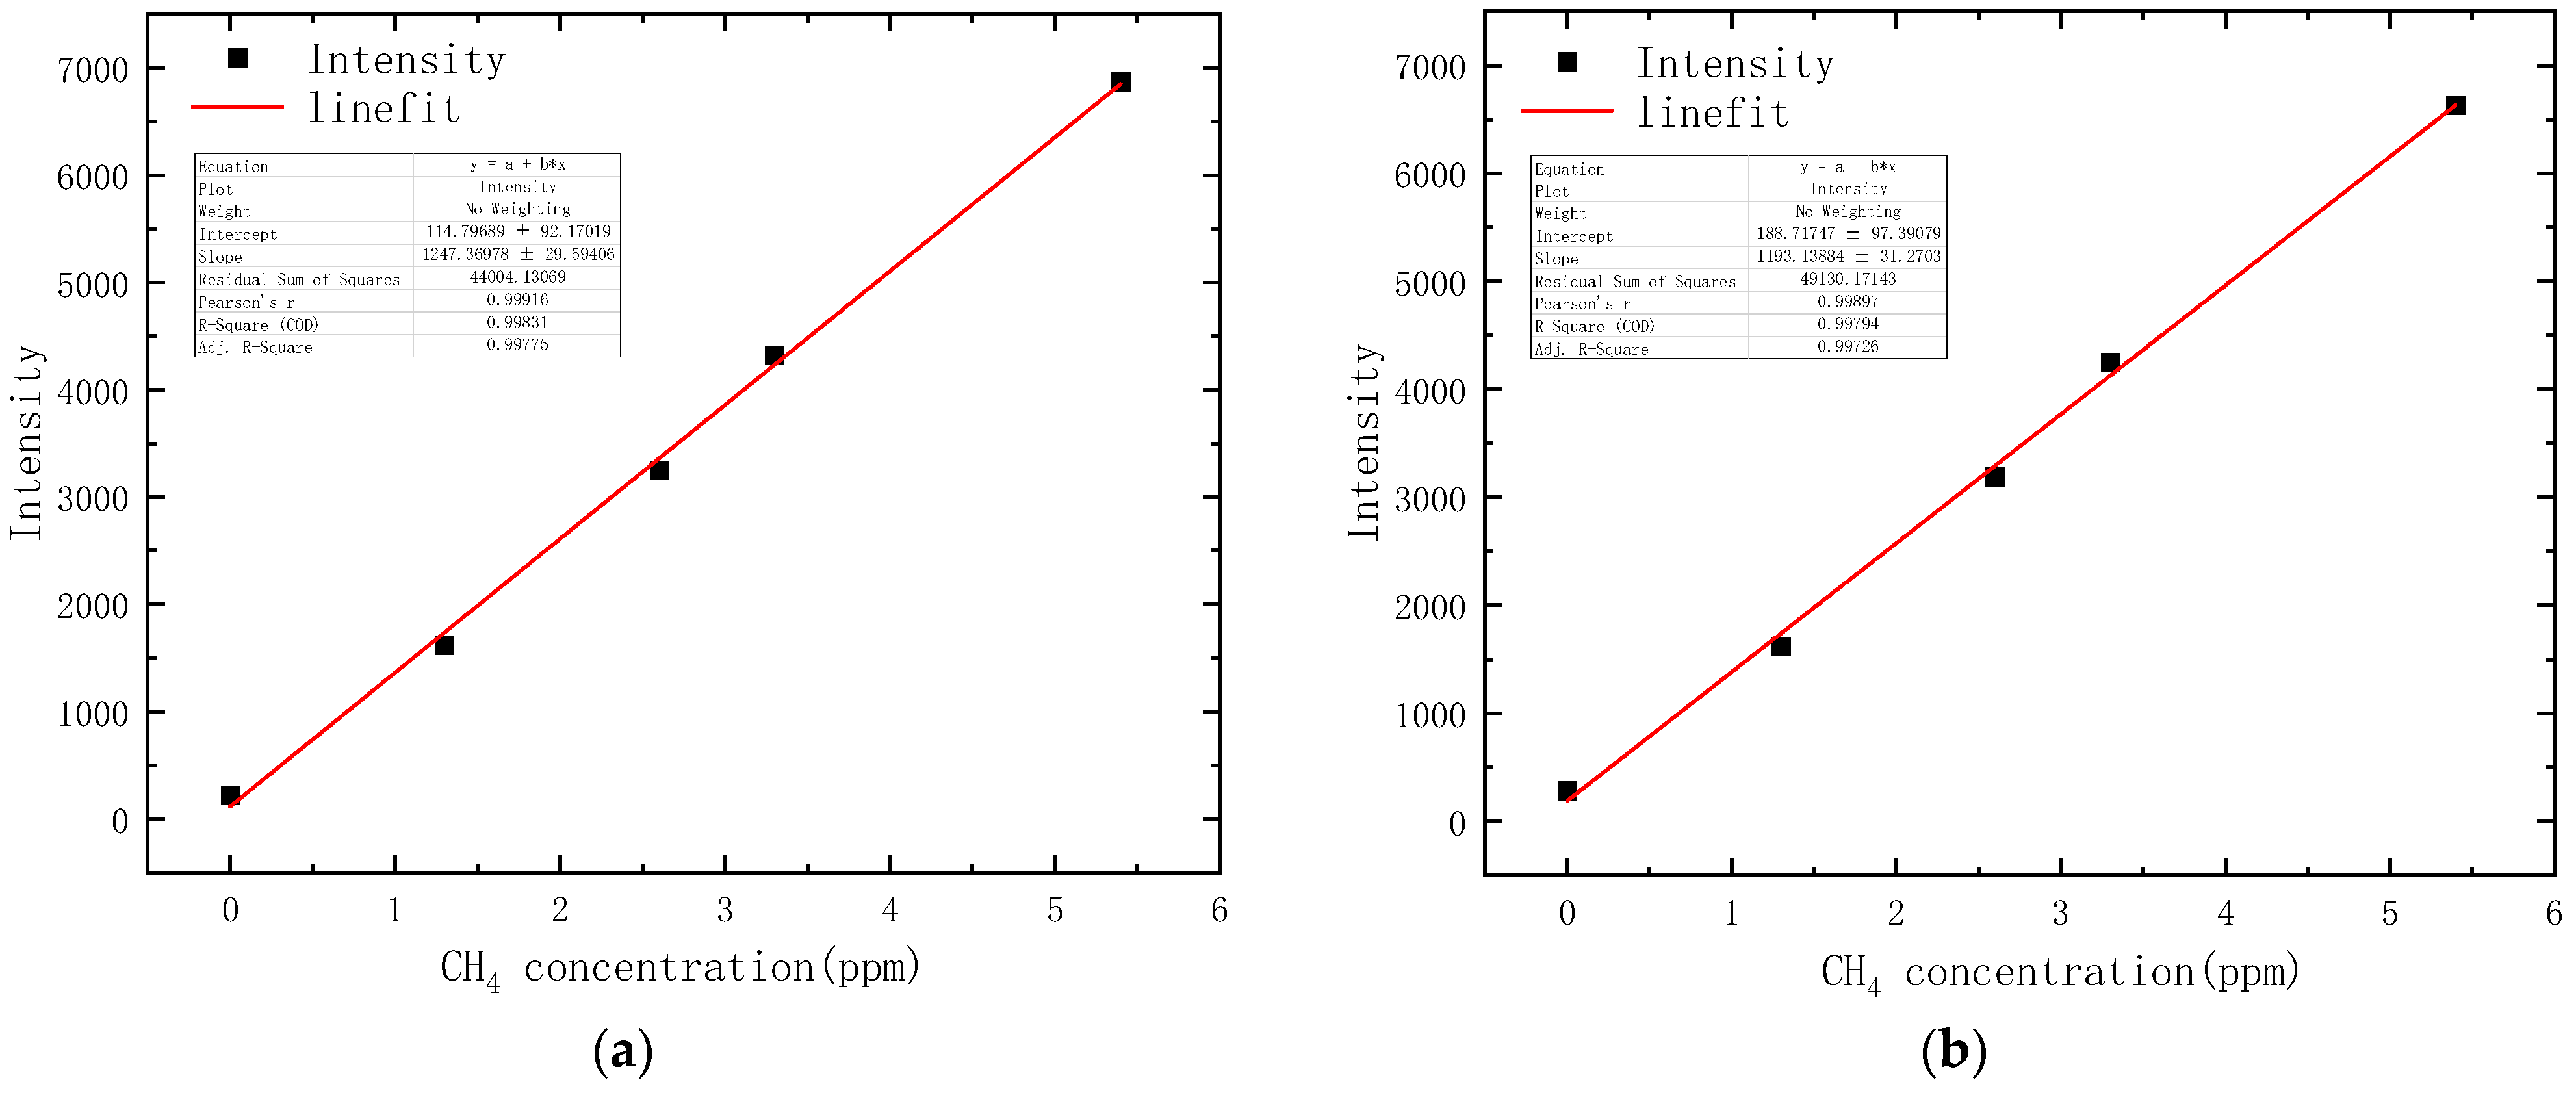
4.1. System Calibration
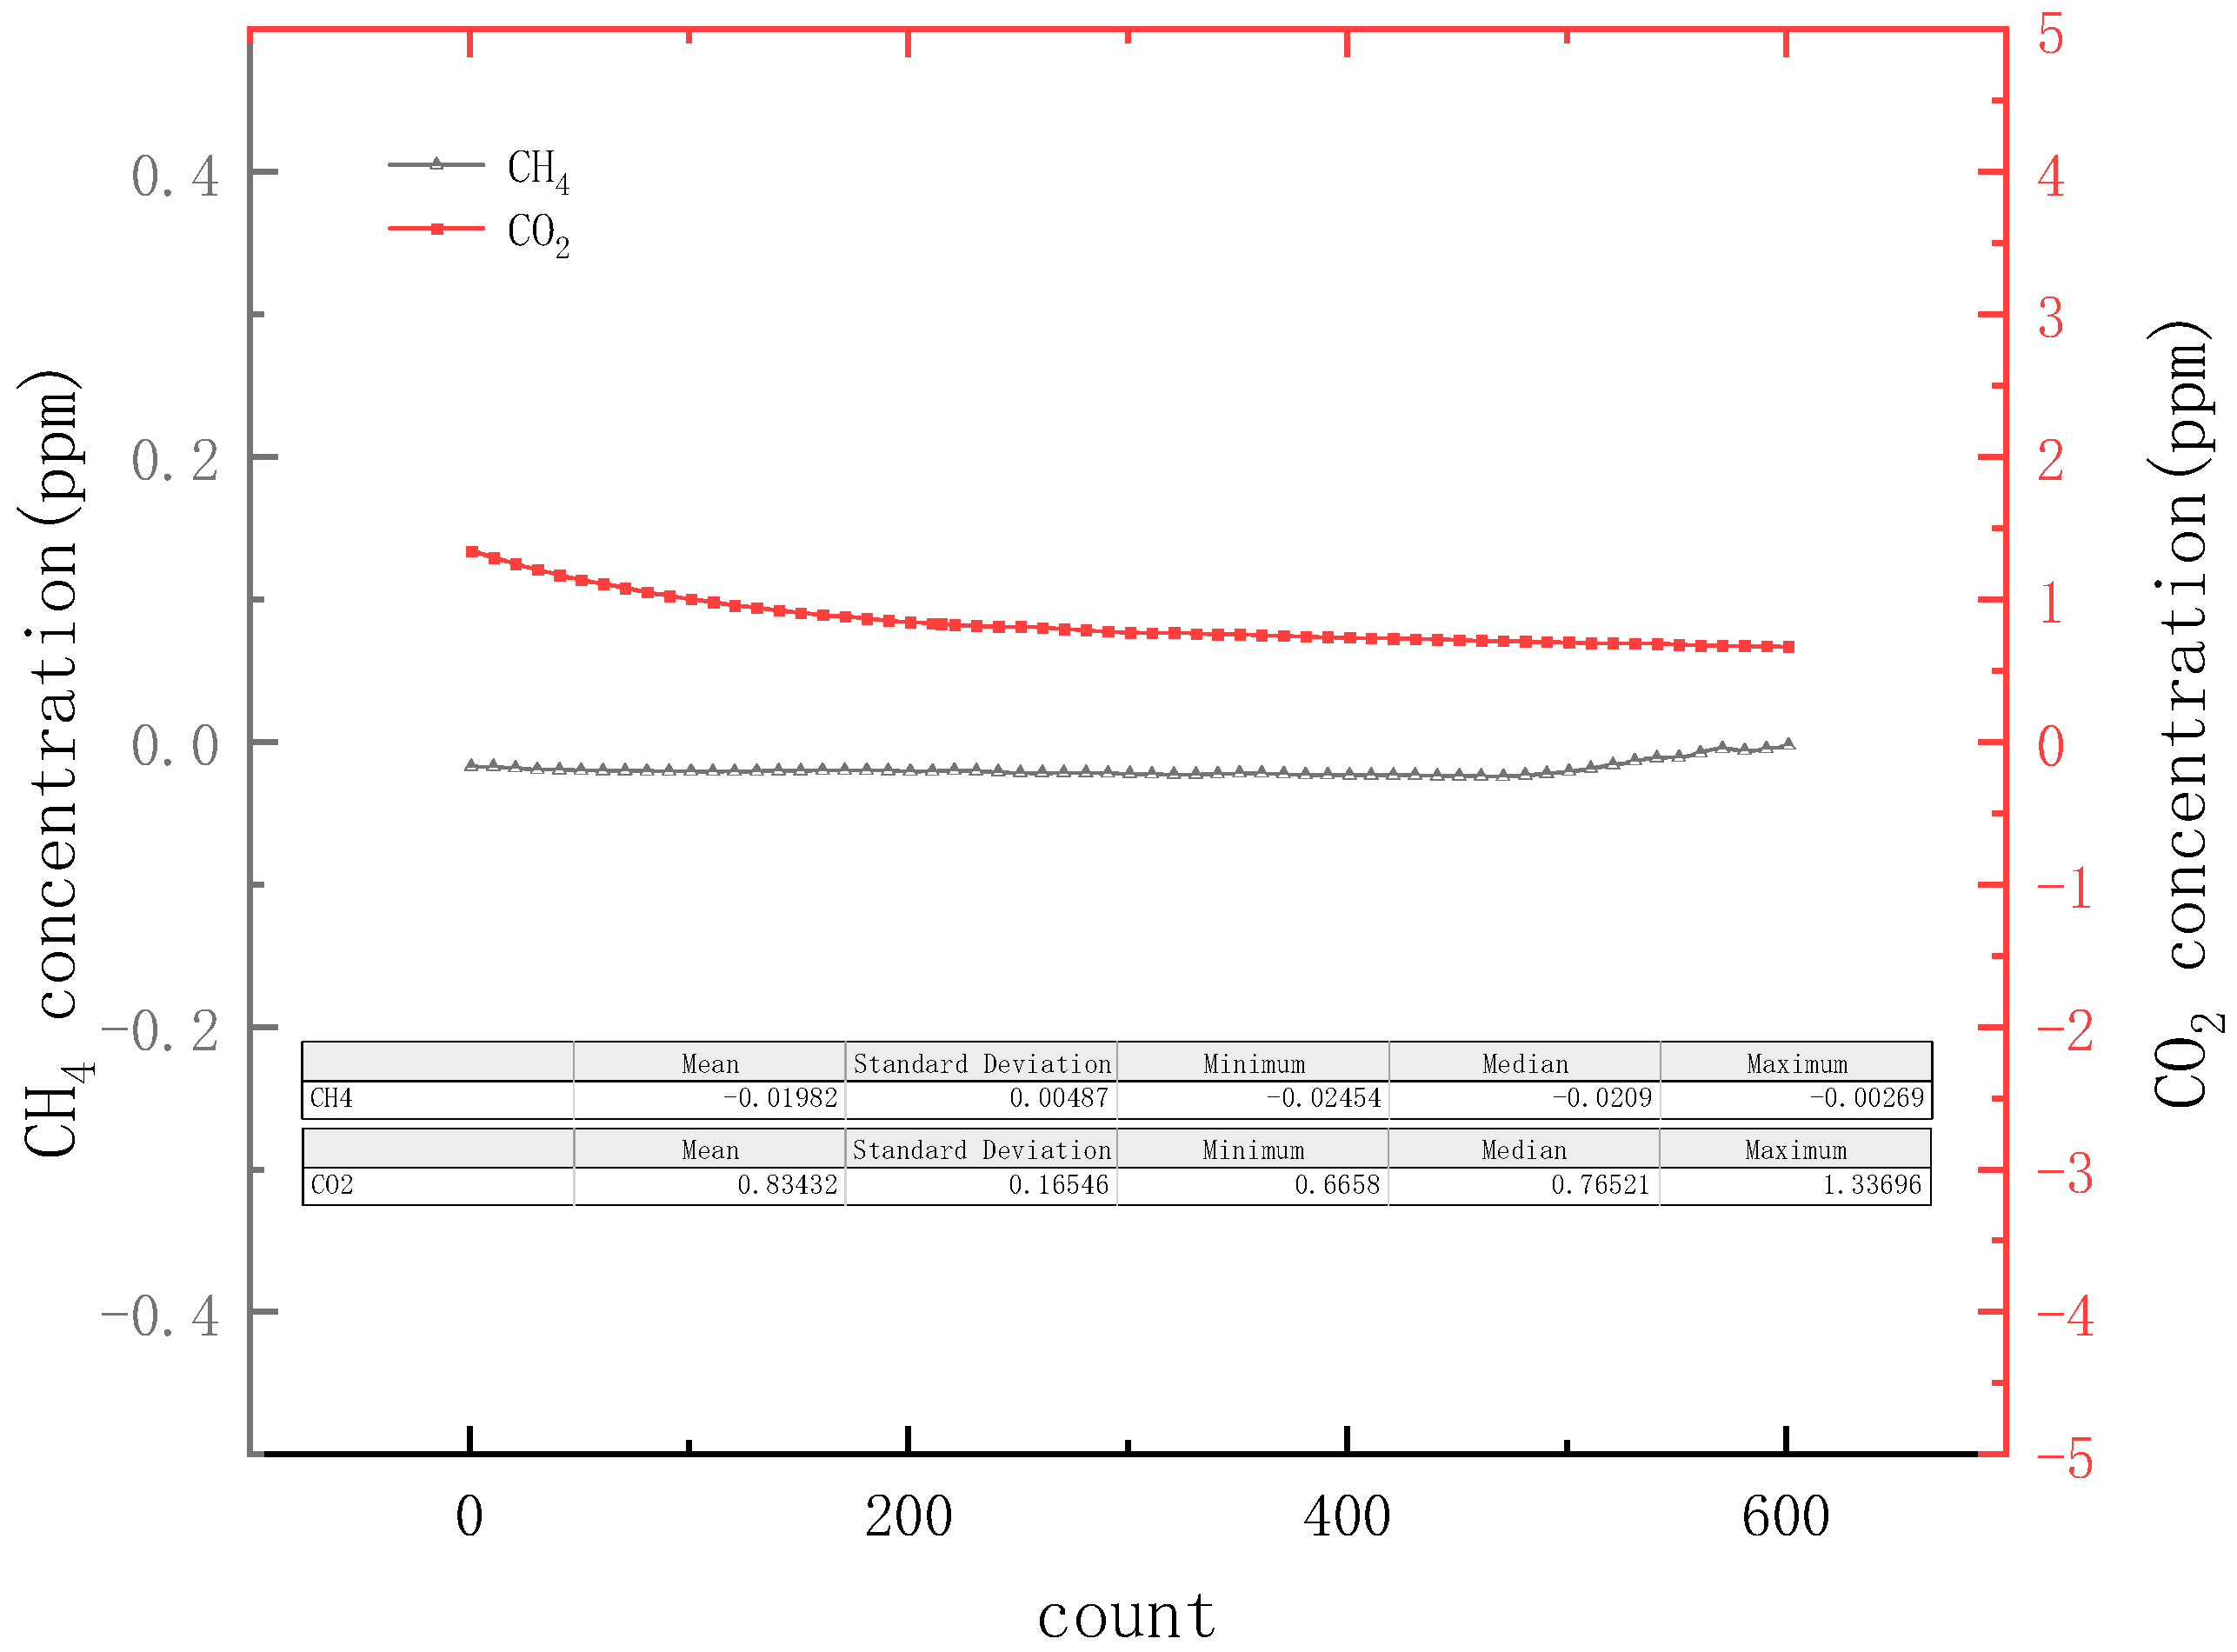
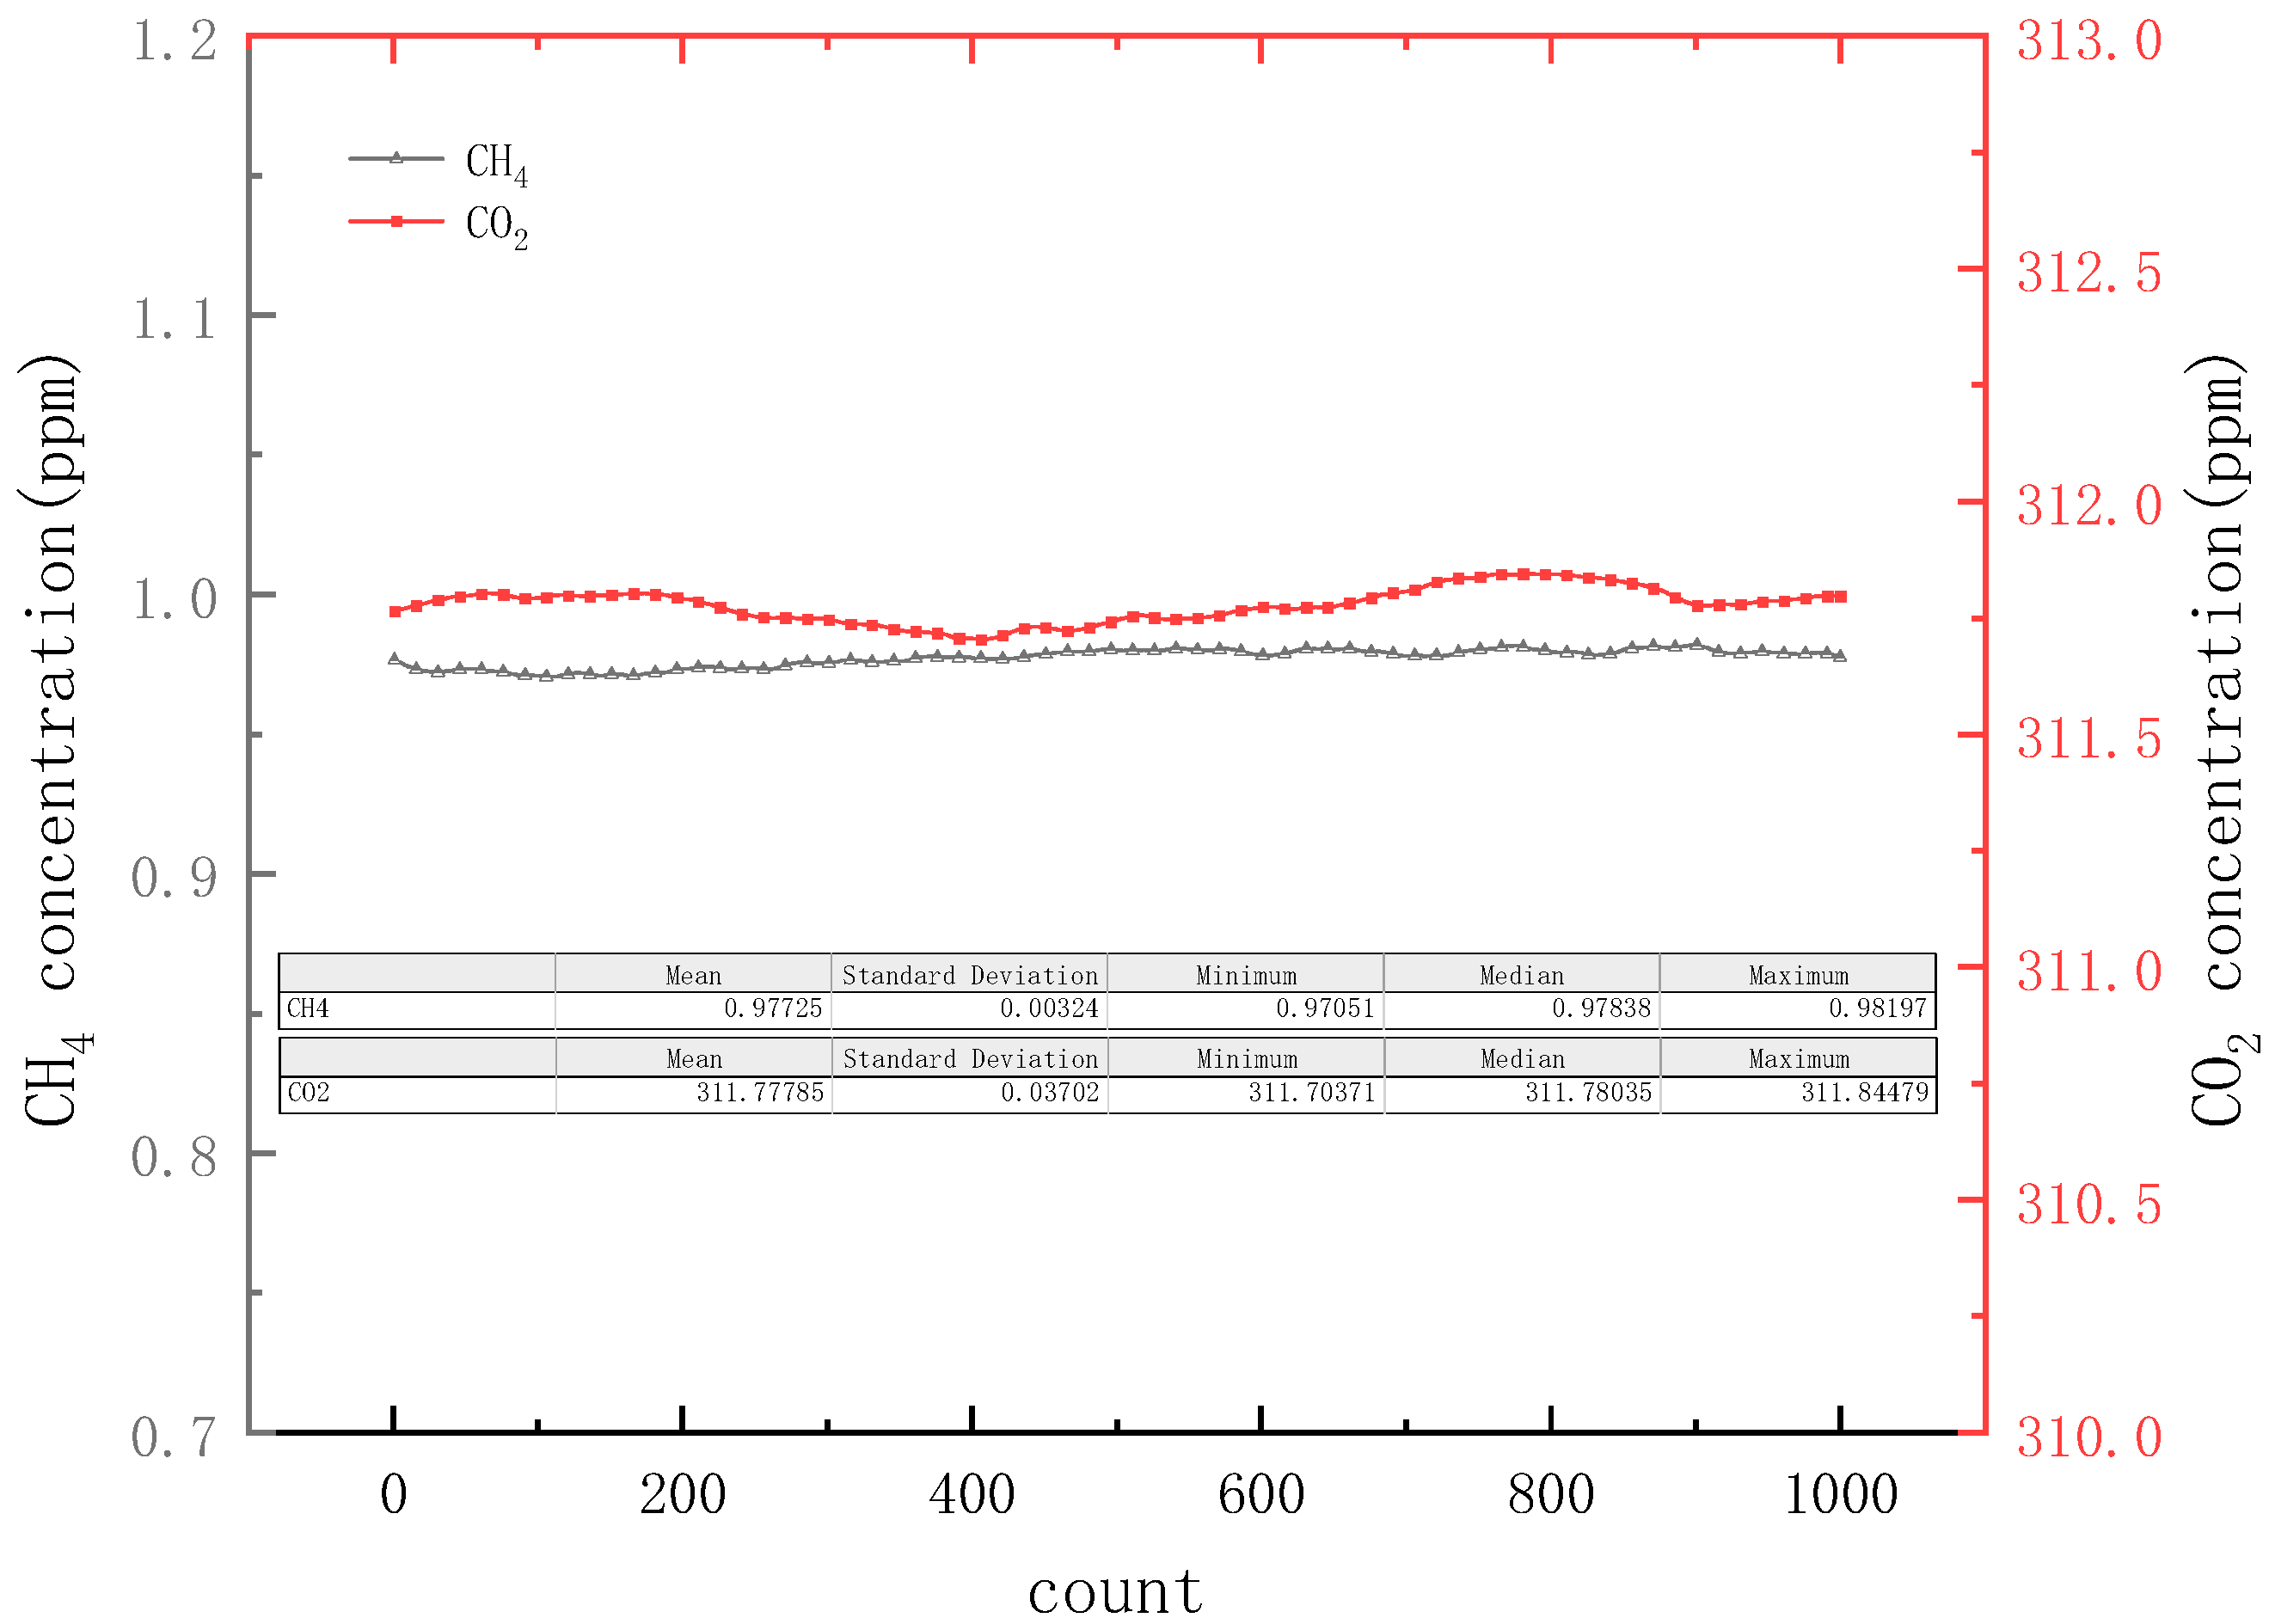
4.2. System Performance
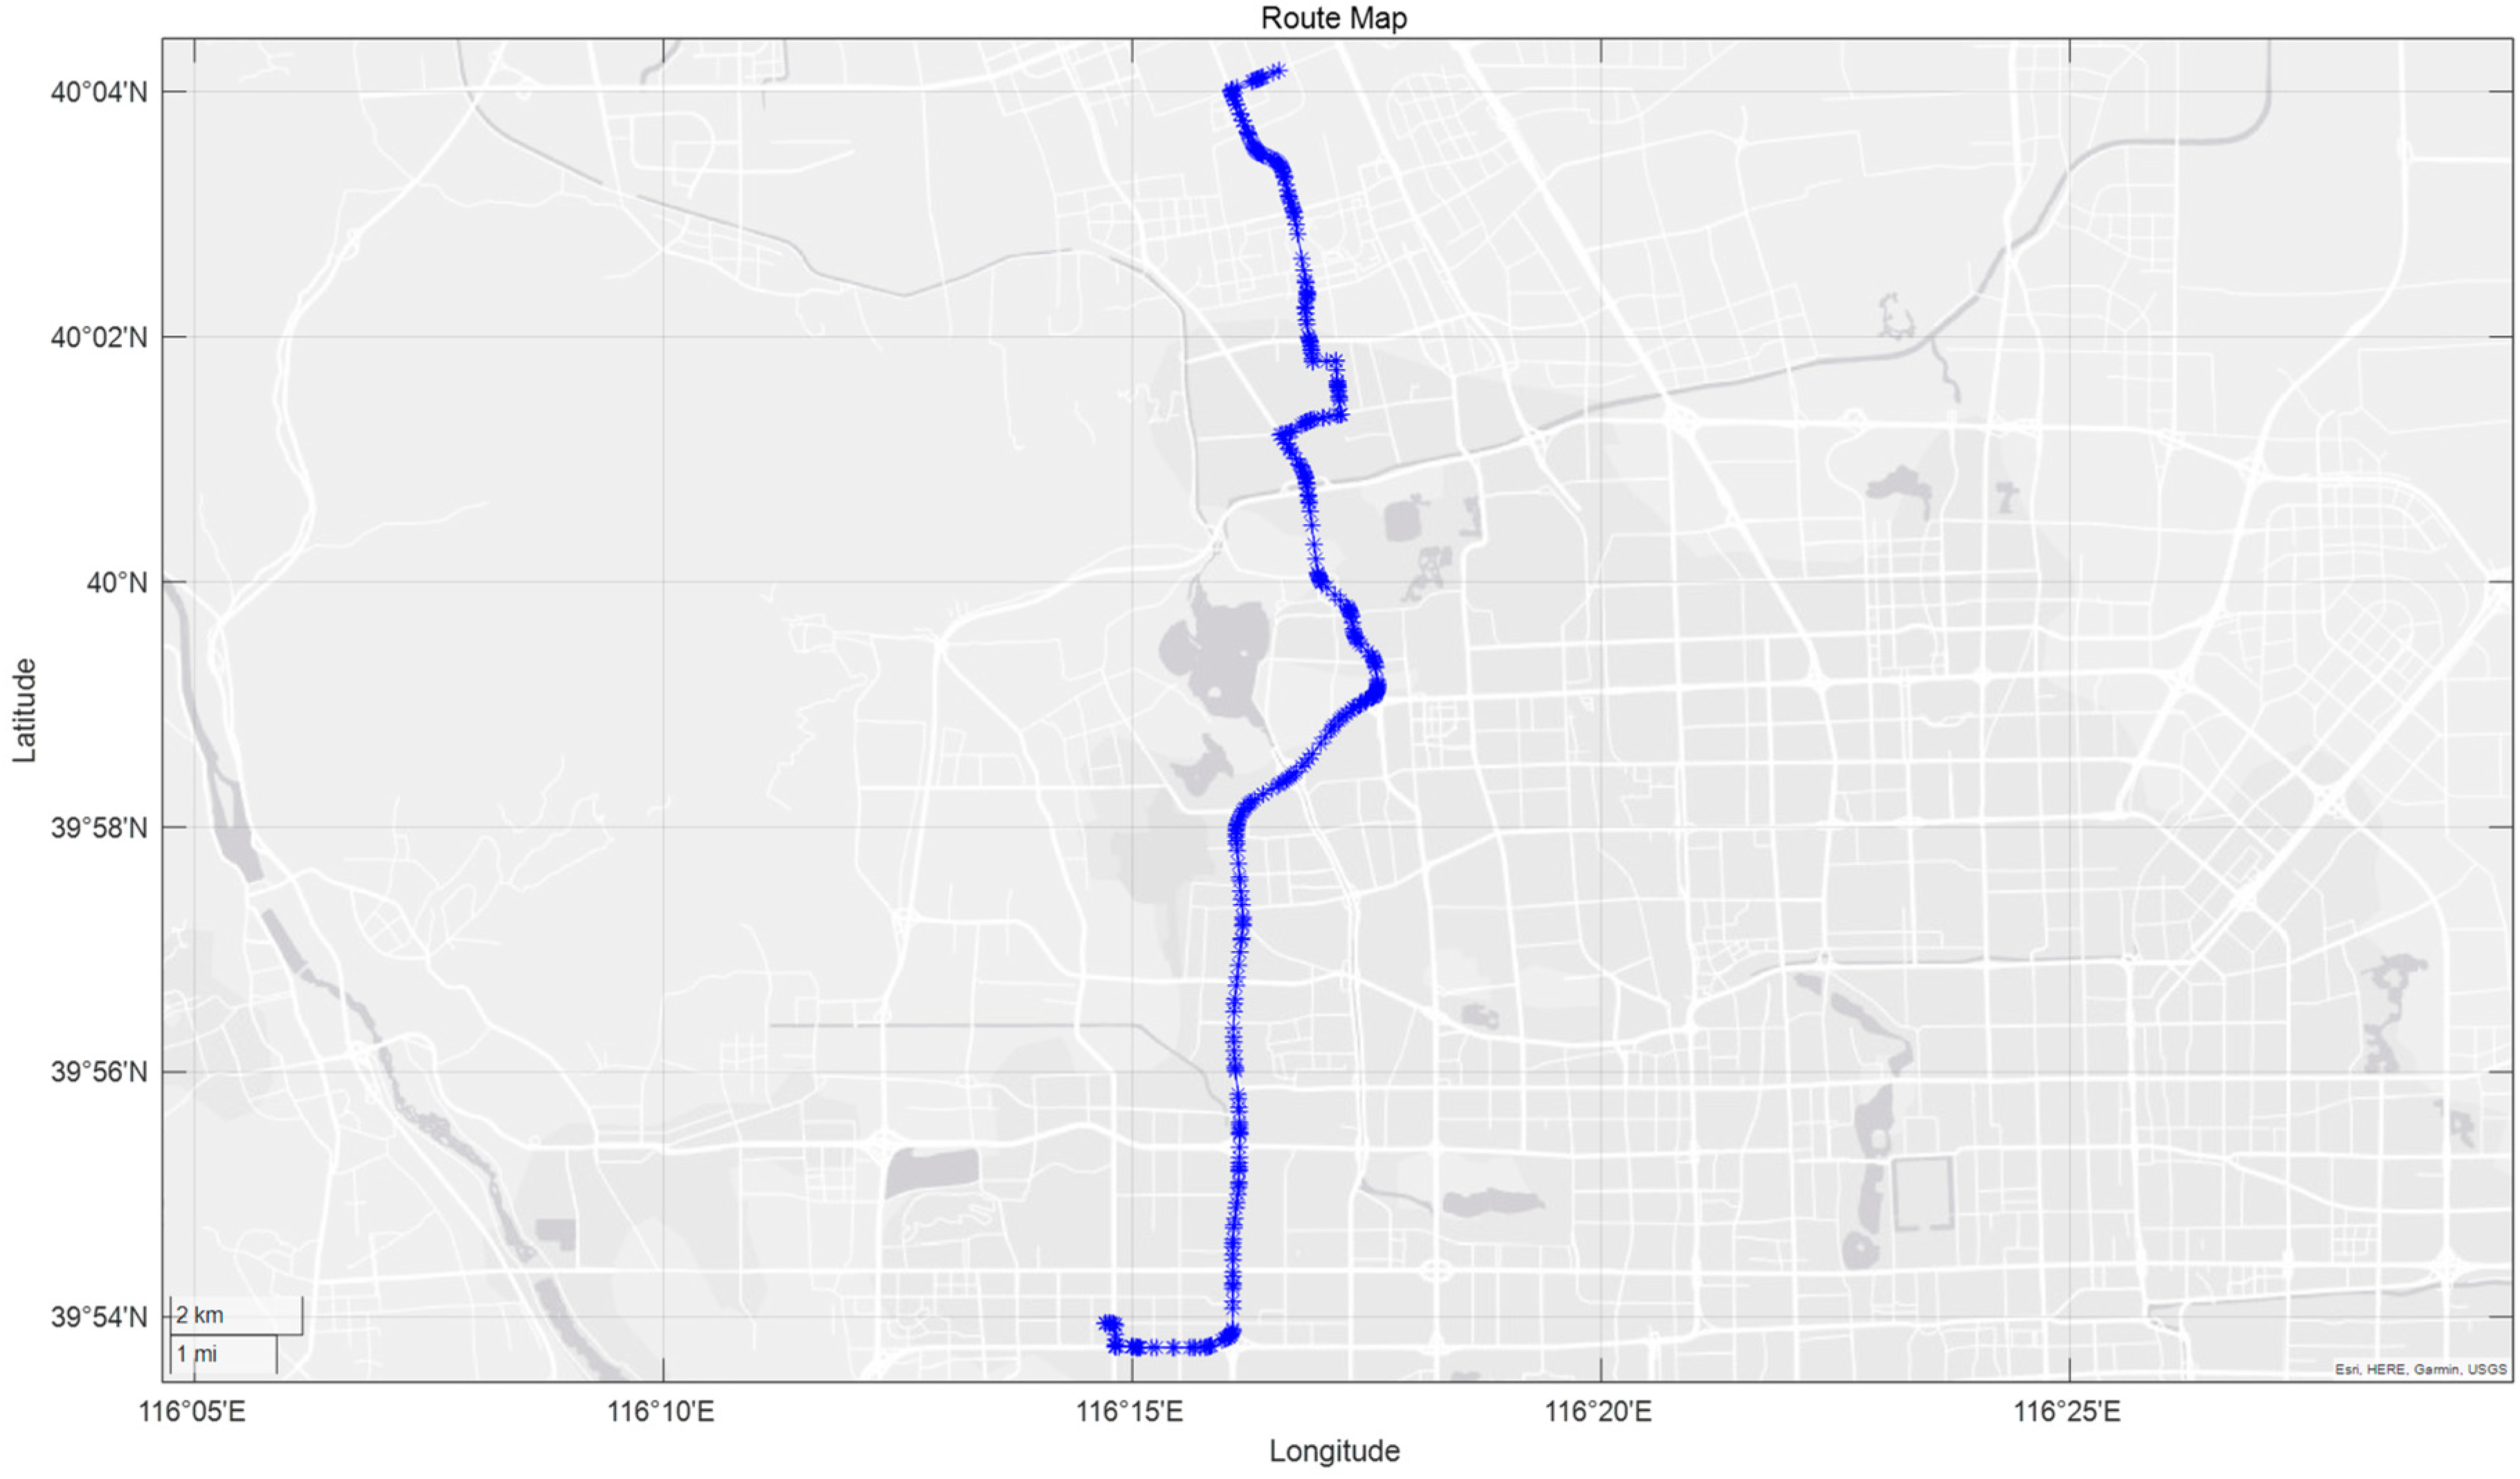
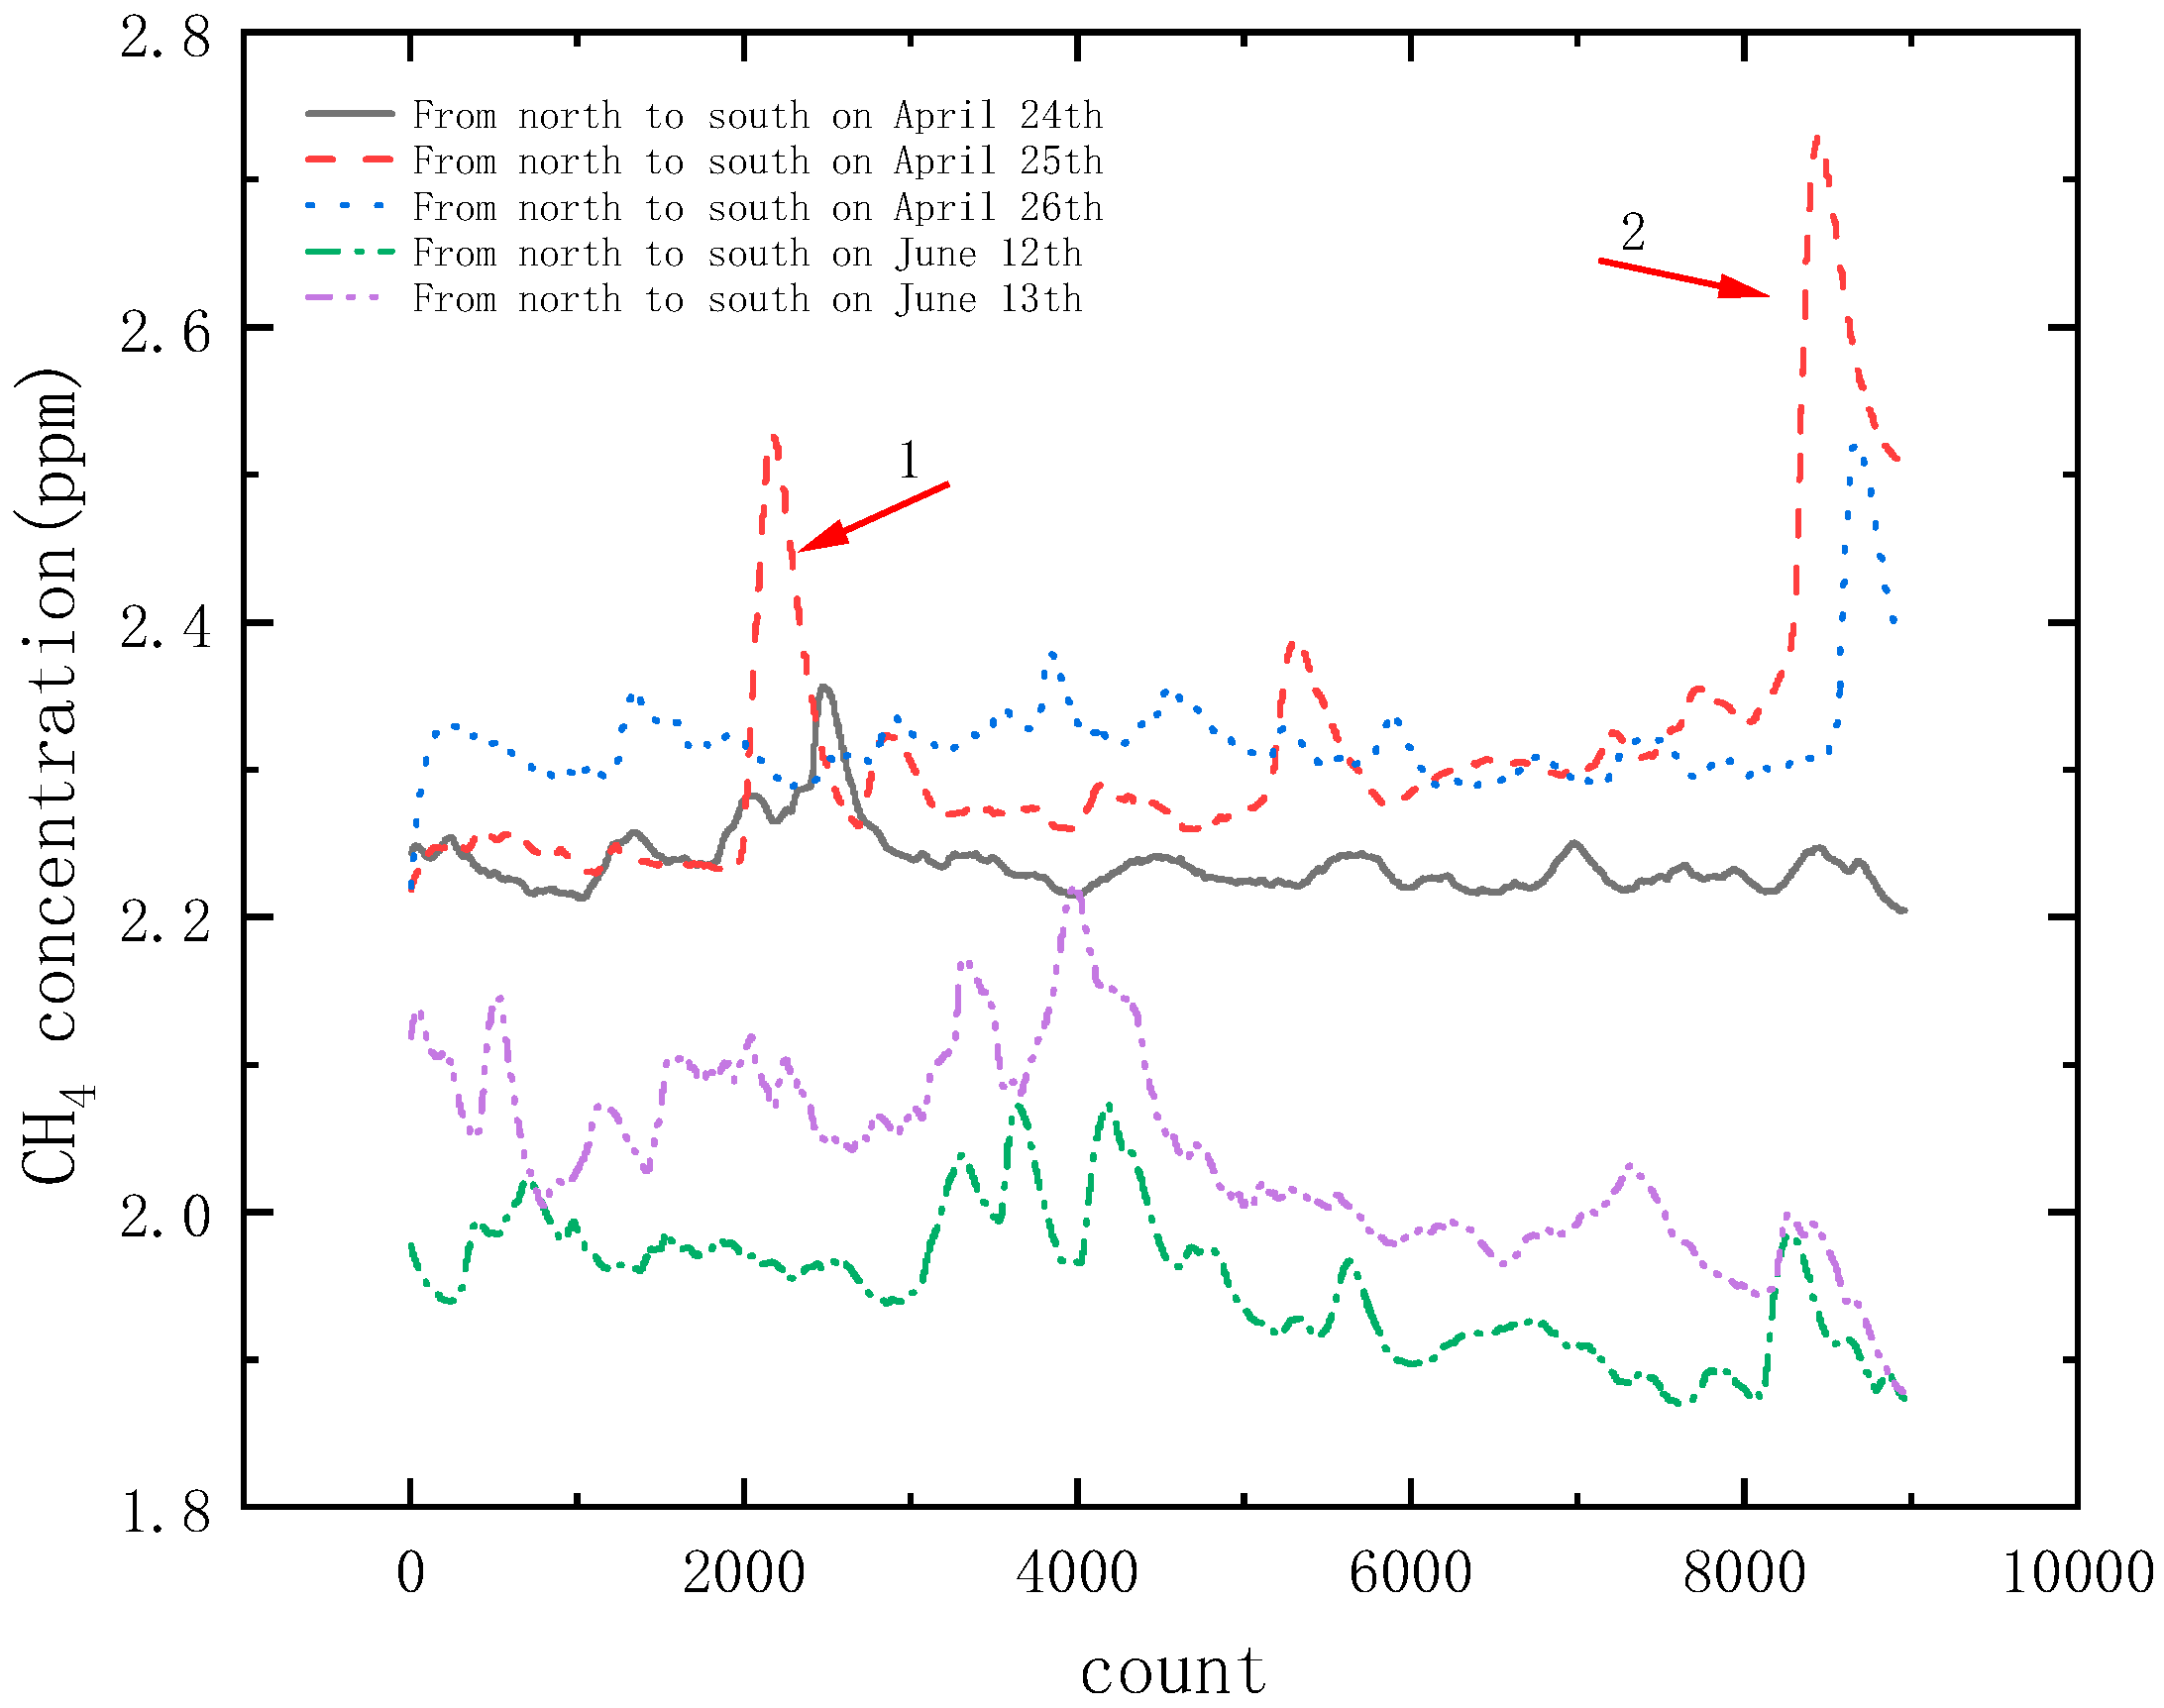
4.3. Road Measurement Results
5. Conclusions
Author Contributions
Funding
Institutional Review Board Statement
Informed Consent Statement
Data Availability Statement
Conflicts of Interest
References
- Hansen, J.; Ruedy, R.; Sato, M.; Lo, K. Global surface temperature change. Rev. Geophys. 2010, 48. [Google Scholar] [CrossRef]
- Solomon, S. IPCC (2007): Climate change the physical science basis. In Proceedings of the AGU Fall Meeting Abstracts; Cambridge University Press: Cambridge, UK, 2007. [Google Scholar]
- Wunch, D.; Toon, G.C.; Blavier, J.-F.L.; Washenfelder, R.A.; Notholt, J.; Connor, B.J.; Griffith, D.W.; Sherlock, V.; Wennberg, P.O. The total carbon column observing network. Philos. Trans. R. Soc. A Math. Phys. Eng. Sci. 2011, 369, 2087–2112. [Google Scholar] [CrossRef] [PubMed]
- Global Monitoring Laboratory. Available online: https://gml.noaa.gov/ccgg/trends/global.html (accessed on 4 April 2023).
- Wei, C.; Wang, M.; Fu, Q.; Dai, C.; Huang, R.; Bao, Q. Temporal characteristics of greenhouse gases (CO2 and CH4) in the megacity Shanghai, China: Association with air pollutants and meteorological conditions. Atmos. Res. 2020, 235, 104759. [Google Scholar] [CrossRef]
- Reum, F.; Gerbig, C.; Lavric, J.V.; Rella, C.W.; Göckede, M. Correcting atmospheric CO2 and CH4 mole fractions obtained with Picarro analyzers for sensitivity of cavity pressure to water vapor. Atmos. Meas. Tech. 2019, 12, 1013–1027. [Google Scholar] [CrossRef]
- Cheng, H.; Wang, M.; Wen, Y.; Wang, G. Background concentration of atmospheric CO2, CH4 and N2O at Mt.Waliguan and Xinglong in China. J. Appl. Meteorol. Sci. 2003, 14, 402–409. [Google Scholar]
- Macatangay, R.; Warneke, T.; Gerbig, C.; Körner, S.; Ahmadov, R.; Heimann, M.; Notholt, J. A framework for comparing remotely sensed and in-situ CO2 concentrations. Atmos. Chem. Phys. 2008, 8, 2555–2568. [Google Scholar] [CrossRef]
- Hartmann, J.-M.; Tran, H.; Toon, G. Influence of line mixing on the retrievals of atmospheric CO2 from spectra in the 1.6 and 2.1 μm regions. Atmos. Chem. Phys. 2009, 9, 7303–7312. [Google Scholar] [CrossRef]
- Zhang, X.; Hu, N.; Xiao, W.; Liu, S.; Zhang, X.; Zhang, S. Analysis on atmospheric carbon dioxide and methane concentrations by using mobile vehicle-mounted observations in urban routes. Environ. Sci. Technol. 2020, 43, 83–89. [Google Scholar]
- Zhang, M.; He, D.; Gu, T.; Sun, T.; Lin, X.; Huang, X.; He, L. Characteristics of greenhouse gas emissions from road traffic sources in Shenzhen. China Environ. Sci. 2022, 42, 1518–1525. [Google Scholar]
- Li, R.N.; Wang, J.; Liu, Y.Z.; Chen, L.L.; Zhang, M.; Cao, C.; Qi, B.; Hu, N.; Xiao, W. Spatial representativeness of urban observation sites and hotspot identification based on CO2/CH4 vehicle-carried mobile observations. China Environ. Sci. 2023, 43, 2106–2118. [Google Scholar]
- Zhao, B.; Yu, L.; Wang, C.; Shuai, C.; Zhu, J.; Qu, S.; Taiebat, M.; Xu, M. Urban air pollution mapping using fleet vehicles as mobile monitors and machine learning. Environ. Sci. Technol. 2021, 55, 5579–5588. [Google Scholar] [CrossRef]
- Siozos, P.; Psyllakis, G.; Velegrakis, M. Remote Operation of an Open-Path, Laser-Based Instrument for Atmospheric CO2 and CH4 Monitoring. Photonics 2023, 10, 386. [Google Scholar] [CrossRef]
- Liu, Y.; Liu, Y.; Zhao, Y.; Wu, W.; Yao, L.; Liu, Z. Development of the carbon dioxide laser detection system for grain storage based on TDLAS. Trans. Chin. Soc. Agric. Eng. (Trans. CSAE) 2022, 38, 250–256. [Google Scholar] [CrossRef]
- Du, B.-L.; Li, M.; Guo, J.J. The Experimental Research on In-Situ Detection for Dissolved CO, in Seawater Based on Tunable Diode Laser Absorption Spectroscopy. Spectrosc. Spectr. Anal. 2022, 42, 1264–1269. [Google Scholar]
- Wang, B.; Dai, T.; Cheng, L.; Zhang, R.; Yu, Y.; Lian, H. Design of methane and carbon dioxide detection system based on VCSEL laser. Laser J. 2022, 43, 15–19. [Google Scholar] [CrossRef]
- Zhang, L. Investigations on Measurement of Low Concentration Andmulti-Component Gas and Reconstruction of 2D Temperature and Concentration Distribution Using Laser Absorption Spectroscopy; Zhejiang University: Hangzhou, China, 2017. [Google Scholar]
- Xu, Z.; Liu, W.; Kan, R.; Zhang, Y.; Liu, J.; Zhang, S.; Shu, X.; Geng, H.; He, Y.; Tang, Y. Study on the Arithmetic of Absorbance Inversion Based on Tunable Diode-Laser Absorption Spectroscopy. Spectrosc. Spectr. Anal. 2010, 30, 2201. [Google Scholar]
- Chen, J.; Liu, J.; He, Y.; Xu, Z.; Li, H.; Yao, L.; Yuan, S.; Ruan, J.; He, J.; Kan, R. Temperature Measurement of CO2 by Use of a Distributed-Feedback Diode Laser Sensor Near 2.0 μm. Chin. J. Lasers 2012, 39, 1108004. [Google Scholar] [CrossRef]
- Fan, F.; Song, Z. Measurement of CO2 Concentration with Tunable Diode Laser Absorption Spectroscopy near 2 μm. Chin. J. Lasers 2012, 39, 0215002. [Google Scholar]
- He, J.; Kan, R.; Xu, Z.; Duan, L.; Wang, X. Derivative Spectrum and Concentration Inversion Algorithm of Tunable Diode Laser Absorption Spectroscopy Oxygen Measurement. Acta Opt. Sin. 2014, 34, 0430003. [Google Scholar]
- Chen, B.; He, G.; Zuo, W.; Wen, J. Long Path Gas Chamber with Stable Packaging Structure. Patent NO. CN201610036719. X, 9 June 2023. [Google Scholar]
- János, I.; Tamás, L.; Allan, M.U. Compendium of Analytical Nomenclature: Definitive Rules 1997; Blackwell Science: Oxford, UK, 1998. [Google Scholar]


| Gas | Date | Period | Mean Value (ppm) | Standard Deviation (ppm) | Minimum Value (ppm) | Median (ppm) | Maximum Value (ppm) |
|---|---|---|---|---|---|---|---|
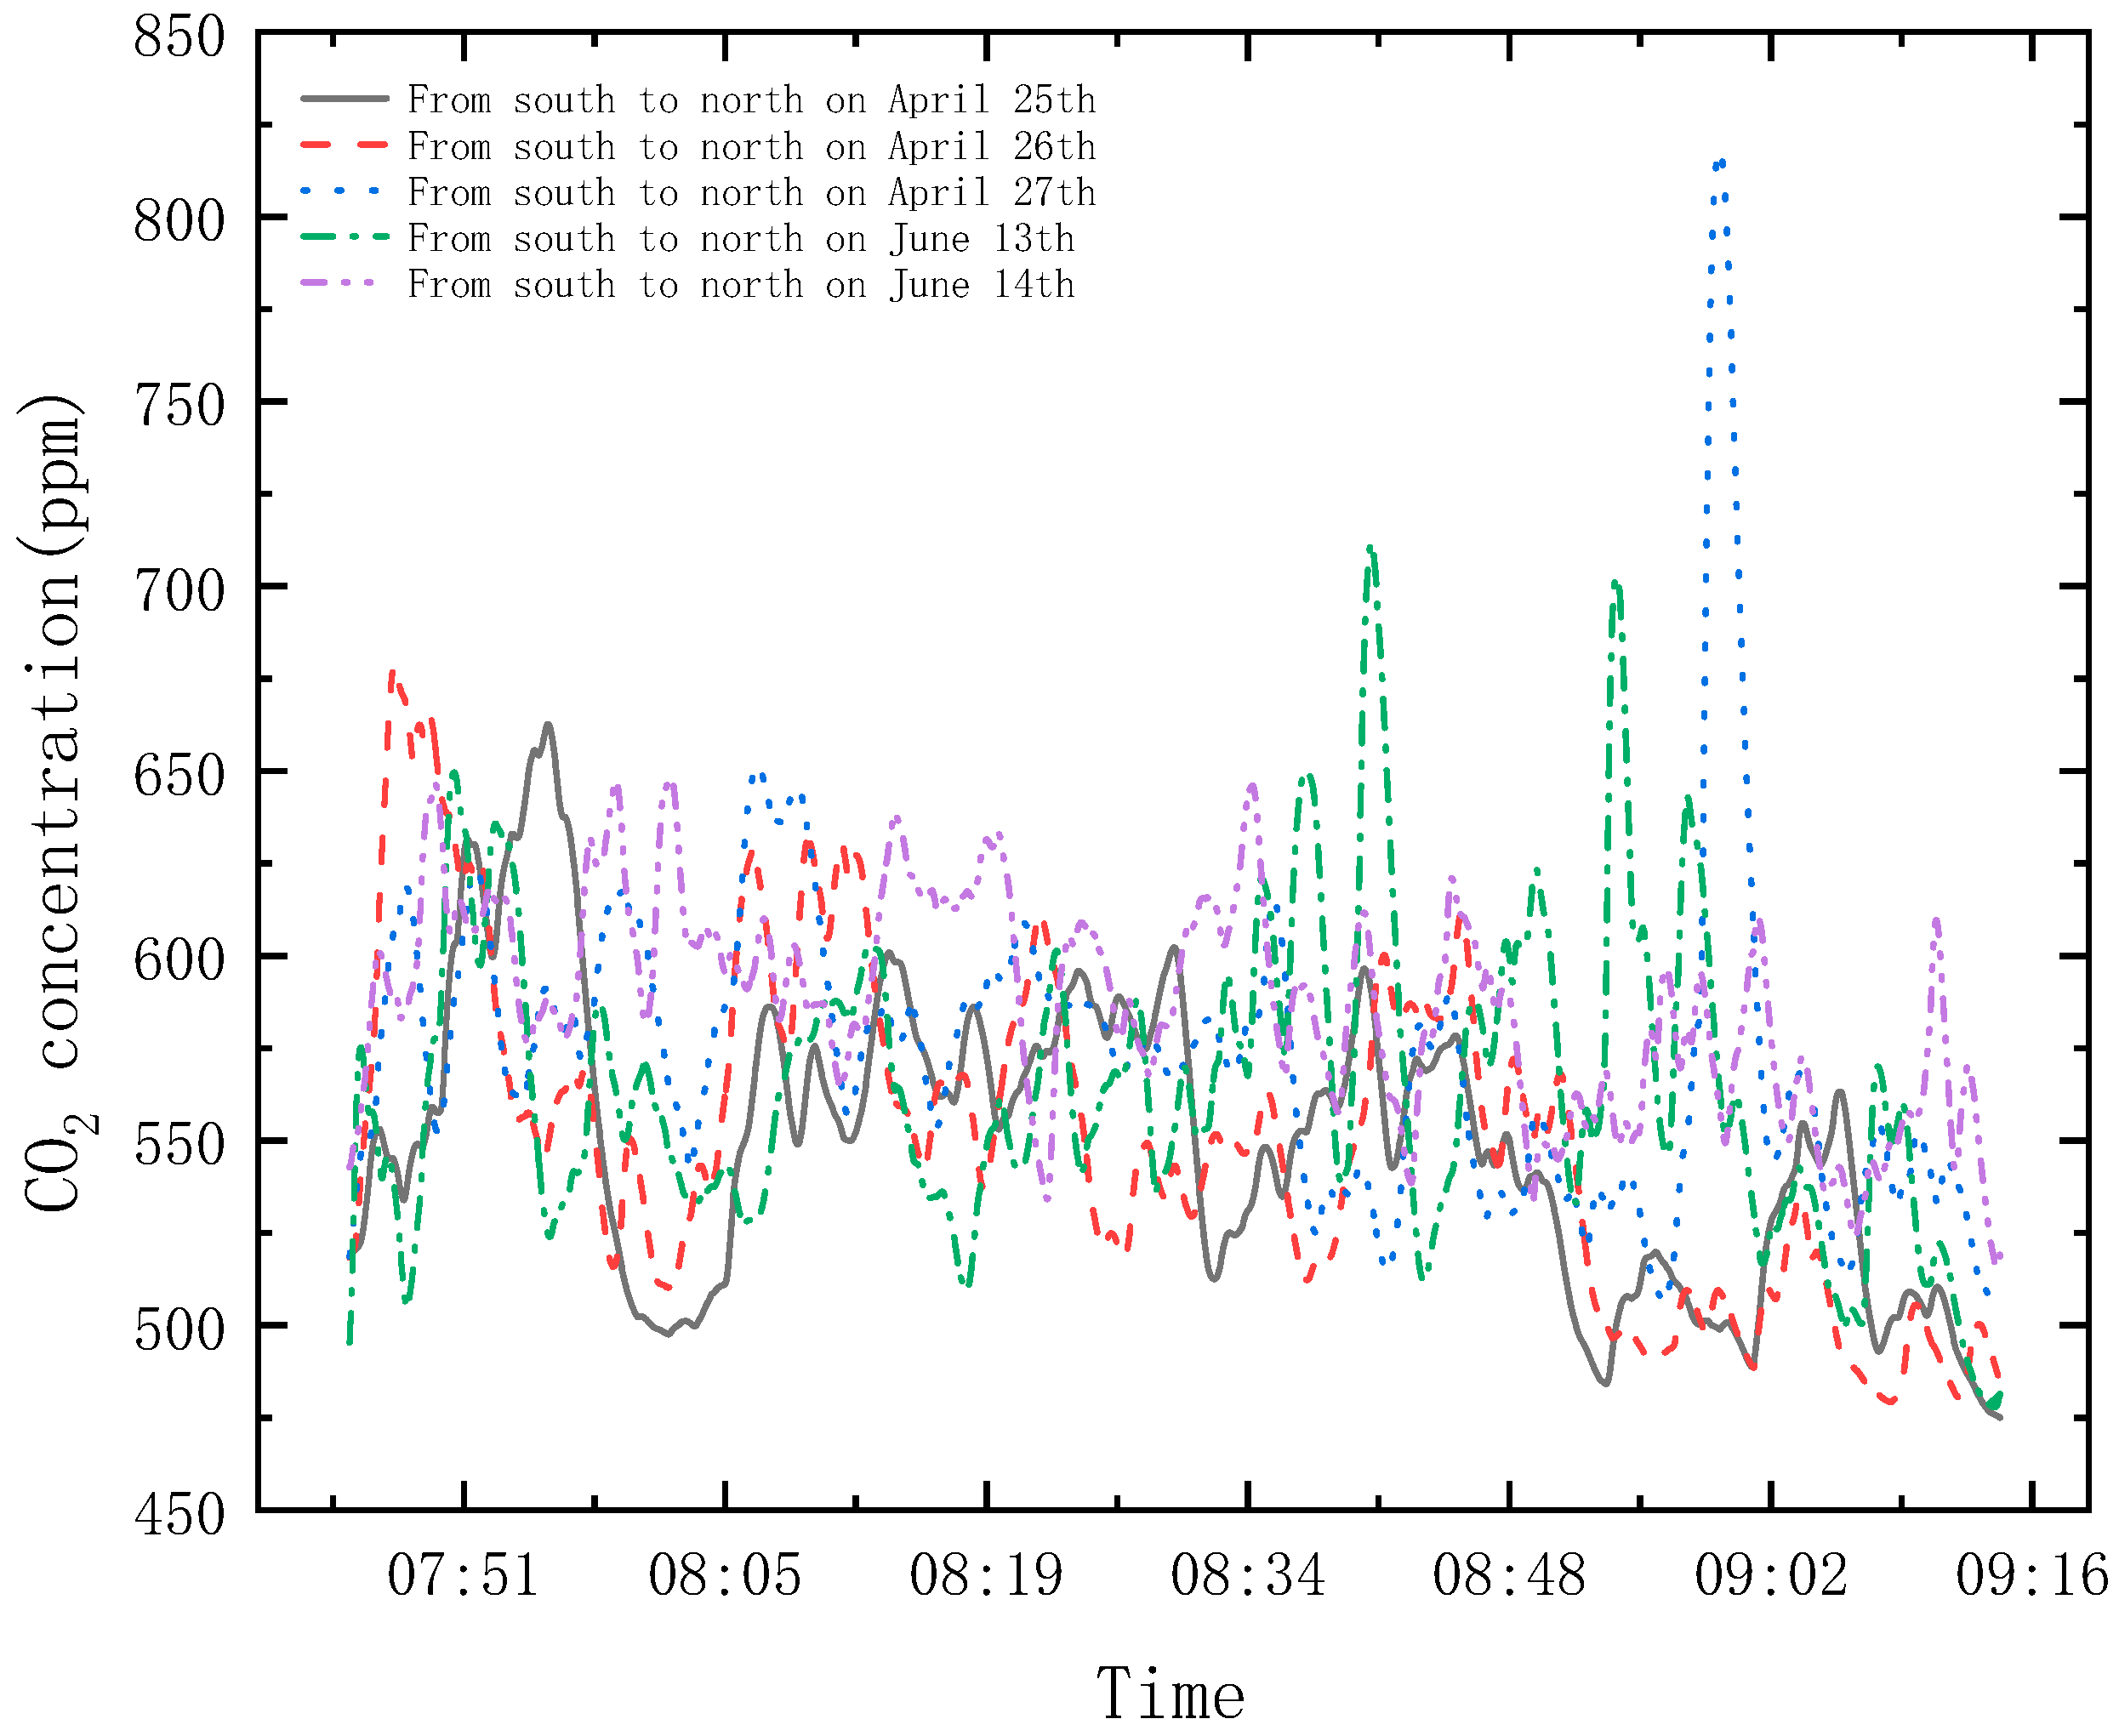
| CO2 | 25 April 2023 | 7:55–9:12 | 549.6 | 39.6 | 475.1 | 550.2 | 662.7 |
| 26 April 2023 | 7:56–9:13 | 551.5 | 44.9 | 479.2 | 549.0 | 678.0 | |
| 27 April 2023 | 7:59–9:17 | 573.4 | 43.9 | 504.7 | 572.3 | 818.5 | |
| 13 June 2023 | 7:45–9:11 | 564.8 | 40.8 | 477.8 | 558.6 | 711.5 | |
| 14 June 2023 | 7:45–9:15 | 587.0 | 27.9 | 515.8 | 587.8 | 648.2 | |
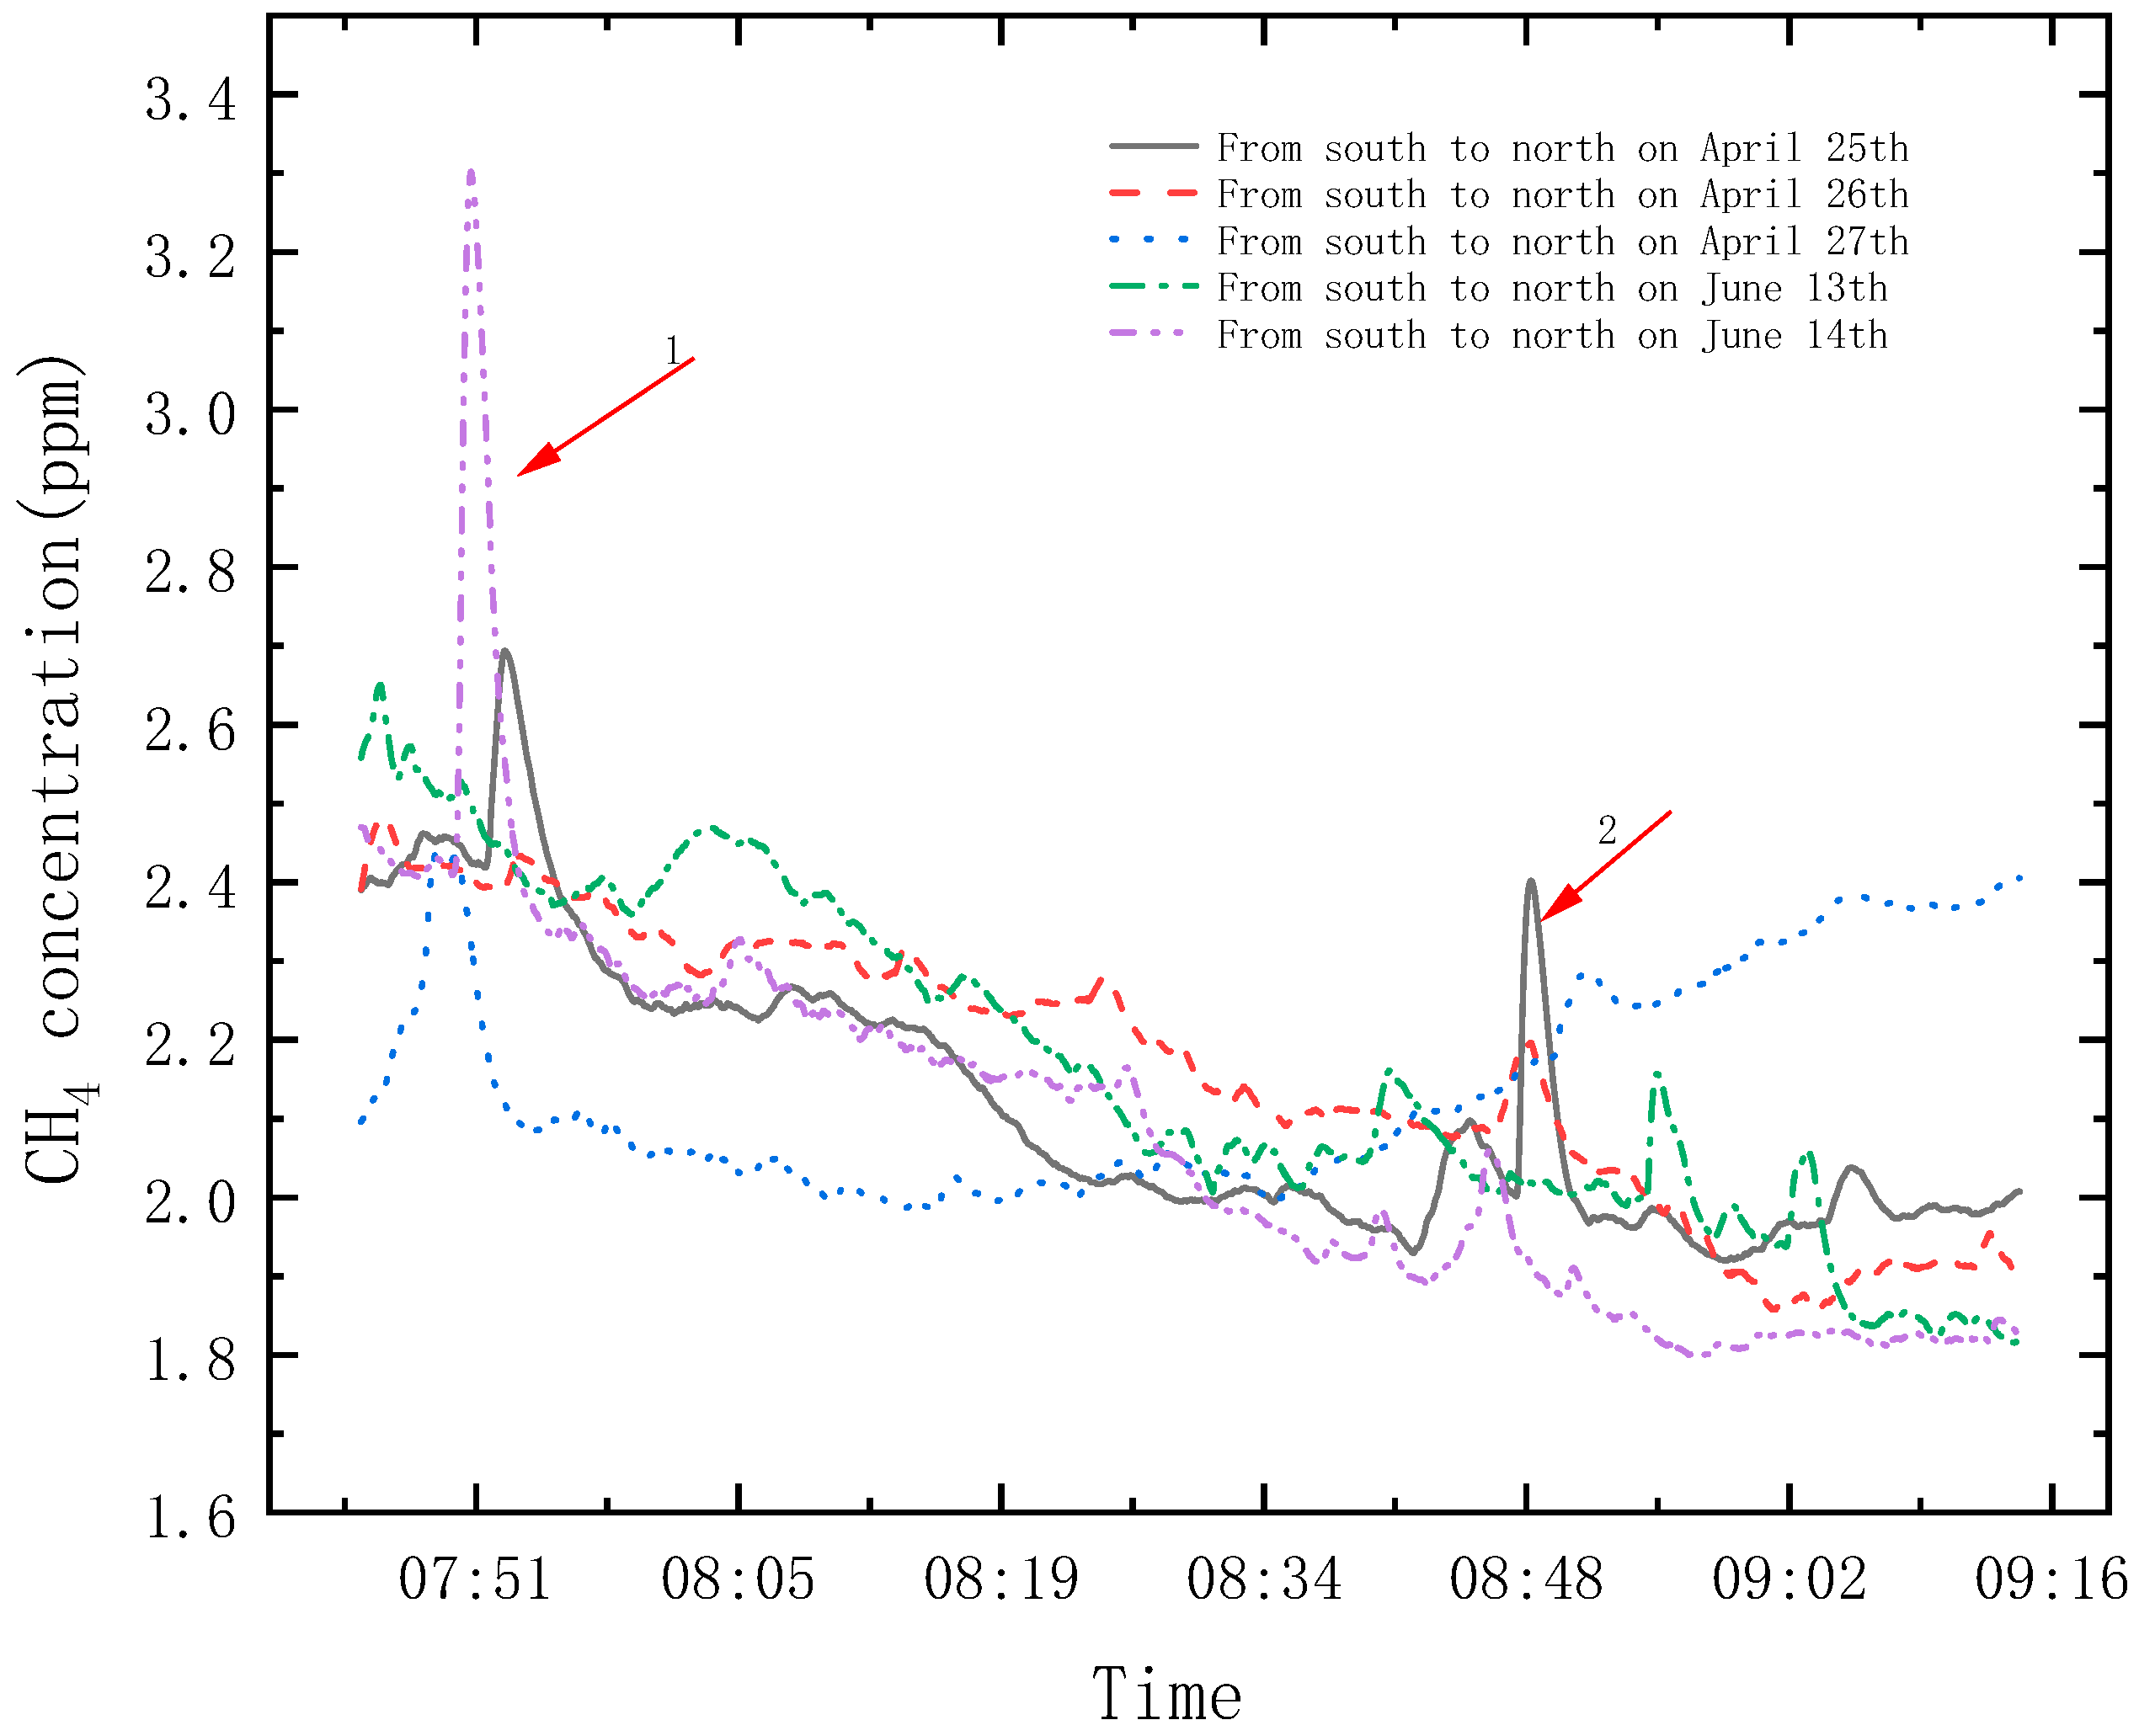
| CH4 | 25 April 2023 | 7:55–9:12 | 2.124 | 0.175 | 1.920 | 2.032 | 2.694 |
| 26 April 2023 | 7:56–9:13 | 2.167 | 0.175 | 1.859 | 2.188 | 2.481 | |
| 27 April 2023 | 7:59–9:17 | 2.144 | 0.137 | 1.986 | 2.092 | 2.440 | |
| 13 June 2023 | 7:45–9:11 | 2.168 | 0.216 | 1.815 | 2.099 | 2.651 | |
| 14 June 2023 | 7:45–9:15 | 2.085 | 0.252 | 1.801 | 2.049 | 3.302 |
| Gas | Date | Period | Mean Value (ppm) | Standard Deviation (ppm) | Minimum Value (ppm) | Median (ppm) | Maximum Value (ppm) |
|---|---|---|---|---|---|---|---|
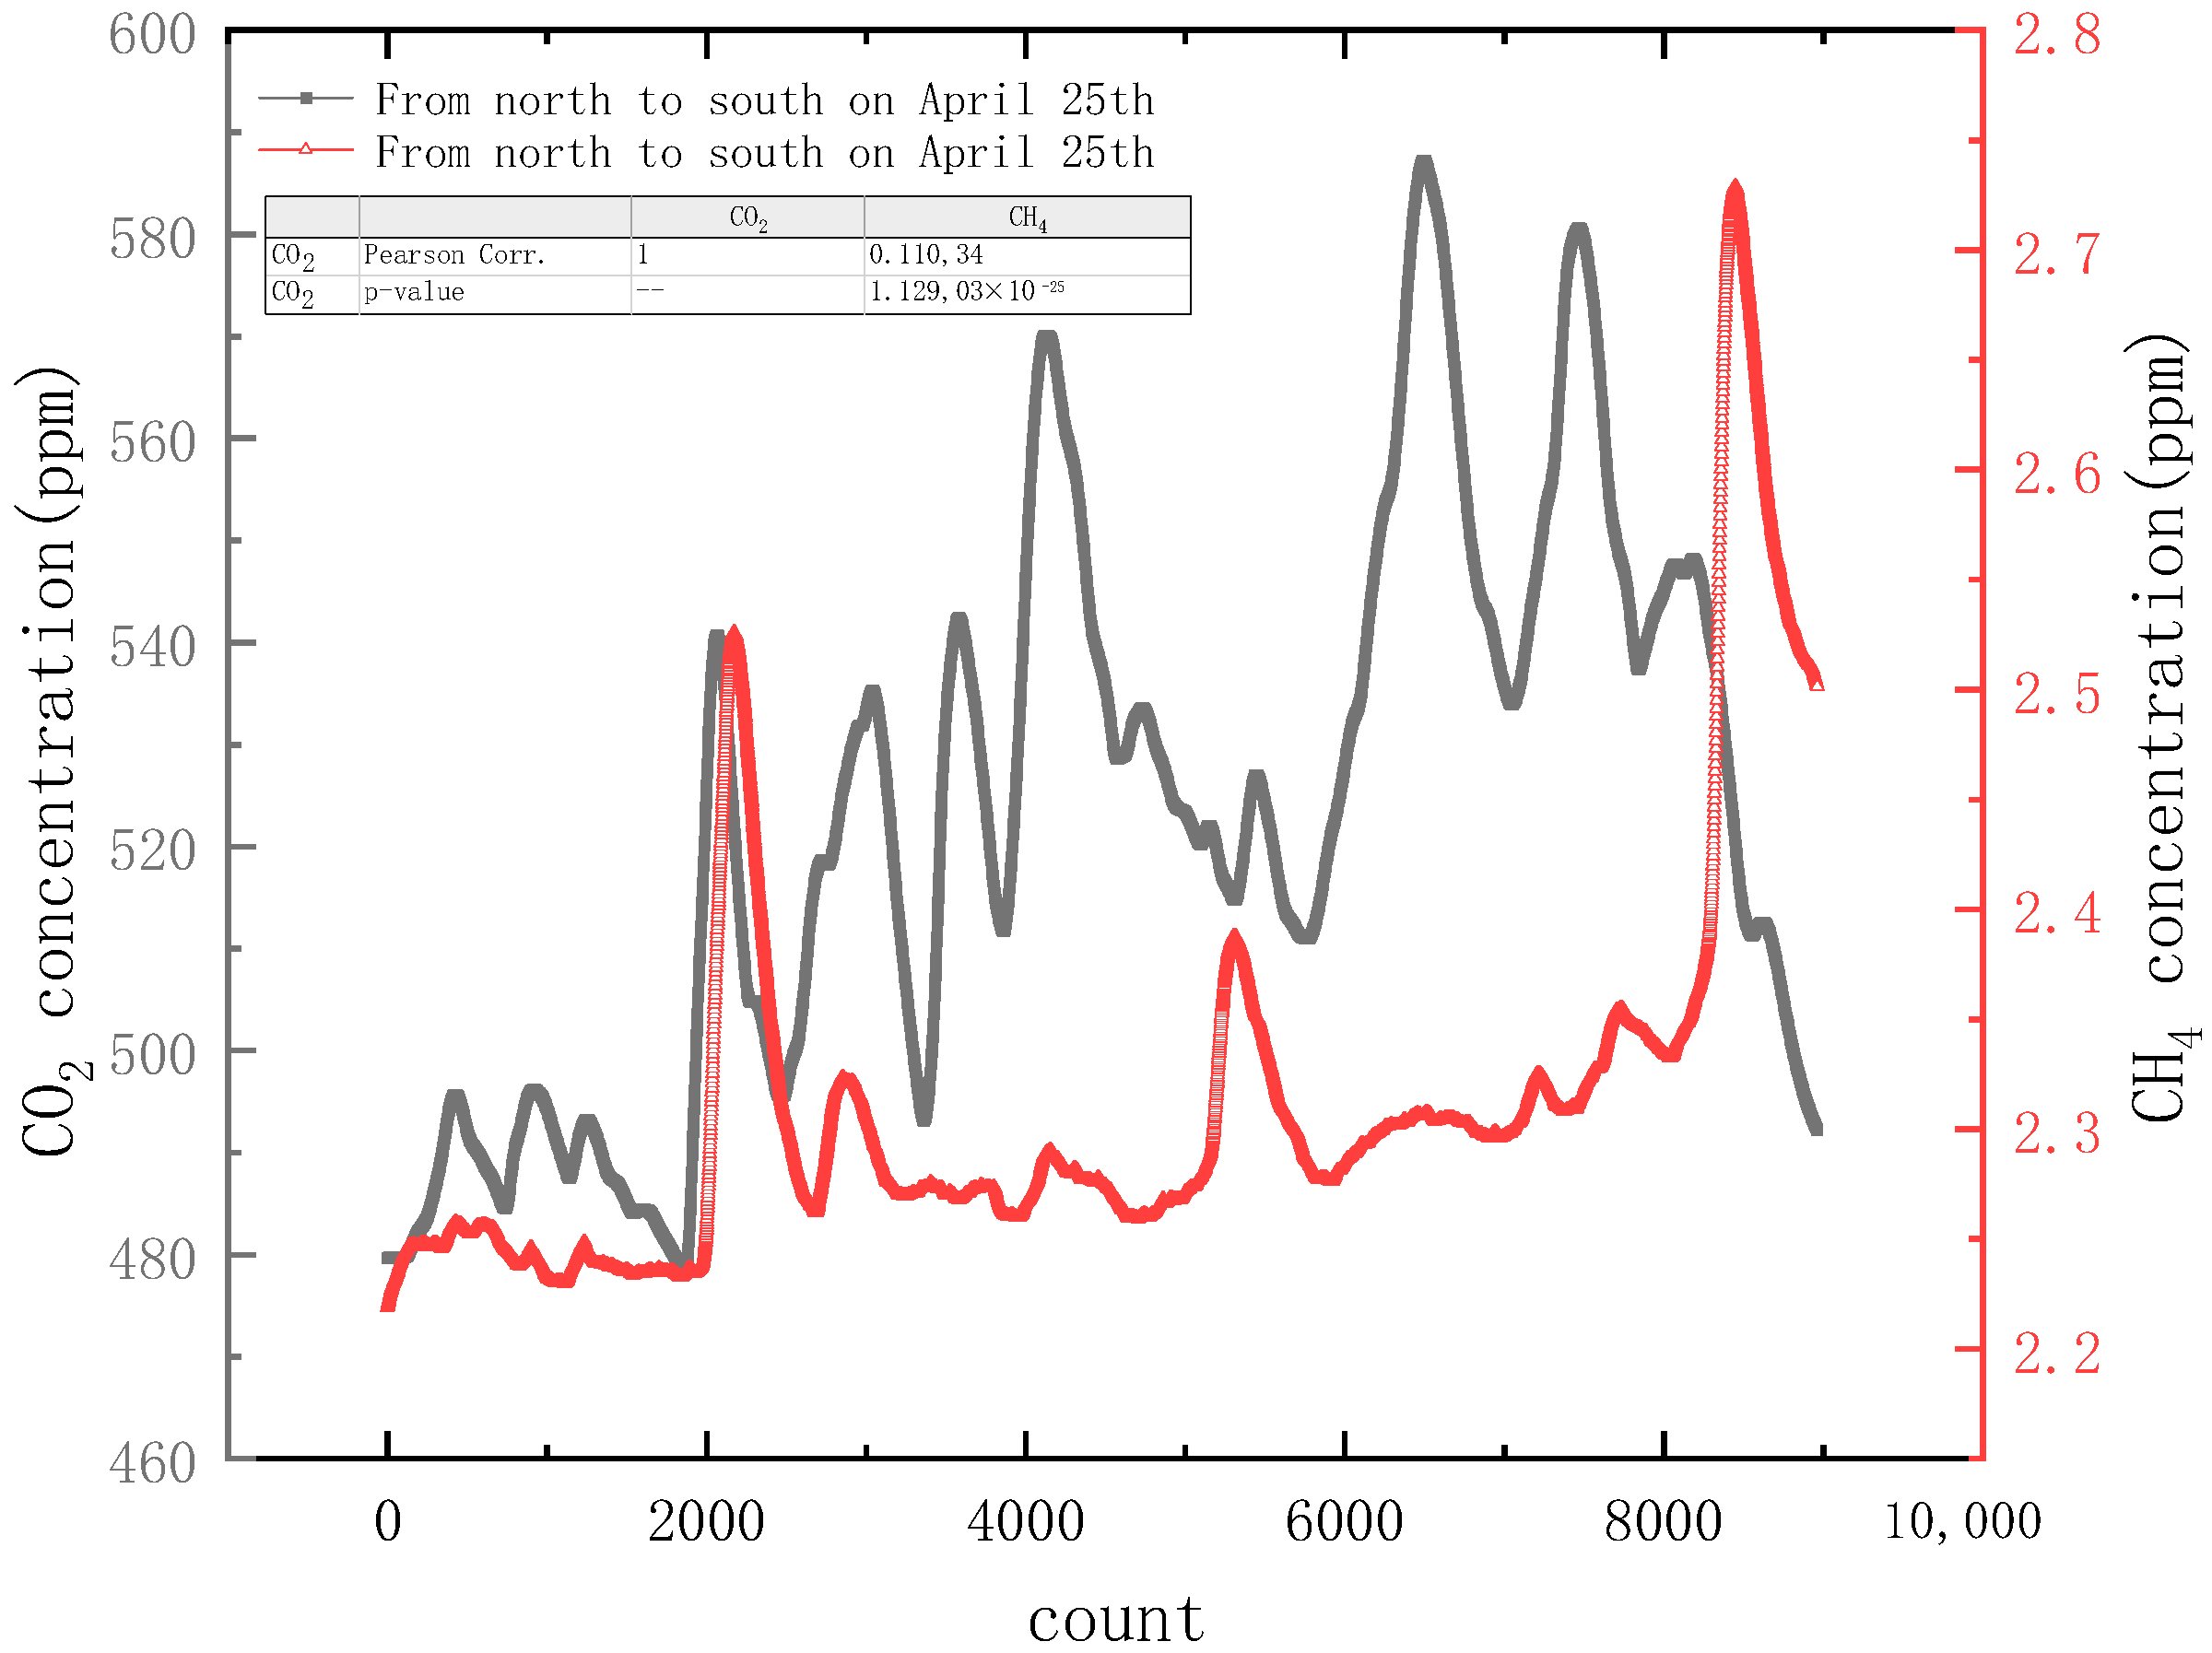
| CO2 | 24 April 2023 | 19:00–20:01 | 504.6 | 29.9 | 454.1 | 504.5 | 581.4 |
| 25 April 2023 | 20:38–21:19 | 522.3 | 27.4 | 478.5 | 521.9 | 587.3 | |
| 26 April 2023 | 21:20–22:14 | 517.6 | 31.6 | 471.6 | 514.3 | 587.4 | |
| 12 June 2023 | 20:03–20:58 | 534.5 | 37.4 | 469.8 | 532.8 | 614.8 | |
| 13 June 2023 | 19:13–20:01 | 533.8 | 32.4 | 482.5 | 527.2 | 648.8 | |
| CH4 | 24 April 2023 | 19:00–20:01 | 2.237 | 0.022 | 2.204 | 2.232 | 2.356 |
| 25 April 2023 | 20:38–21:19 | 2.314 | 0.095 | 2.219 | 2.287 | 2.729 | |
| 26 April 2023 | 21:20–22:14 | 2.320 | 0.035 | 2.221 | 2.314 | 2.520 | |
| 12 June 2023 | 20:03–20:58 | 1.951 | 0.046 | 1.870 | 1.956 | 2.073 | |
| 13 June 2023 | 19:13–20:01 | 2.040 | 0.066 | 1.877 | 2.031 | 2.223 |
Disclaimer/Publisher’s Note: The statements, opinions and data contained in all publications are solely those of the individual author(s) and contributor(s) and not of MDPI and/or the editor(s). MDPI and/or the editor(s) disclaim responsibility for any injury to people or property resulting from any ideas, methods, instructions or products referred to in the content. |
© 2023 by the authors. Licensee MDPI, Basel, Switzerland. This article is an open access article distributed under the terms and conditions of the Creative Commons Attribution (CC BY) license (https://creativecommons.org/licenses/by/4.0/).
Share and Cite
Chen, J.; Cui, P.; Zhou, C.; Yu, X.; Wu, H.; Jia, L.; Zhou, M.; Zhang, H.; Teng, G.; Cheng, S.; et al. Detection of CO2 and CH4 Concentrations on a Beijing Urban Road Using Vehicle-Mounted Tunable Diode Laser Absorption Spectroscopy. Photonics 2023, 10, 938. https://doi.org/10.3390/photonics10080938
Chen J, Cui P, Zhou C, Yu X, Wu H, Jia L, Zhou M, Zhang H, Teng G, Cheng S, et al. Detection of CO2 and CH4 Concentrations on a Beijing Urban Road Using Vehicle-Mounted Tunable Diode Laser Absorption Spectroscopy. Photonics. 2023; 10(8):938. https://doi.org/10.3390/photonics10080938
Chicago/Turabian StyleChen, Jiuying, Pengxiang Cui, Chuncheng Zhou, Xiaoya Yu, Haohao Wu, Liangquan Jia, Mei Zhou, Huijing Zhang, Geer Teng, Sai Cheng, and et al. 2023. "Detection of CO2 and CH4 Concentrations on a Beijing Urban Road Using Vehicle-Mounted Tunable Diode Laser Absorption Spectroscopy" Photonics 10, no. 8: 938. https://doi.org/10.3390/photonics10080938
APA StyleChen, J., Cui, P., Zhou, C., Yu, X., Wu, H., Jia, L., Zhou, M., Zhang, H., Teng, G., Cheng, S., Chen, L., & Qiu, Y. (2023). Detection of CO2 and CH4 Concentrations on a Beijing Urban Road Using Vehicle-Mounted Tunable Diode Laser Absorption Spectroscopy. Photonics, 10(8), 938. https://doi.org/10.3390/photonics10080938