Stability of the Photoluminescent Response on Hydroxyapatite/Multi-Walled Carbon Nanotube Composites

 ,
,  ,
,  , and
, and
Abstract
1. Introduction
2. Materials and Methods
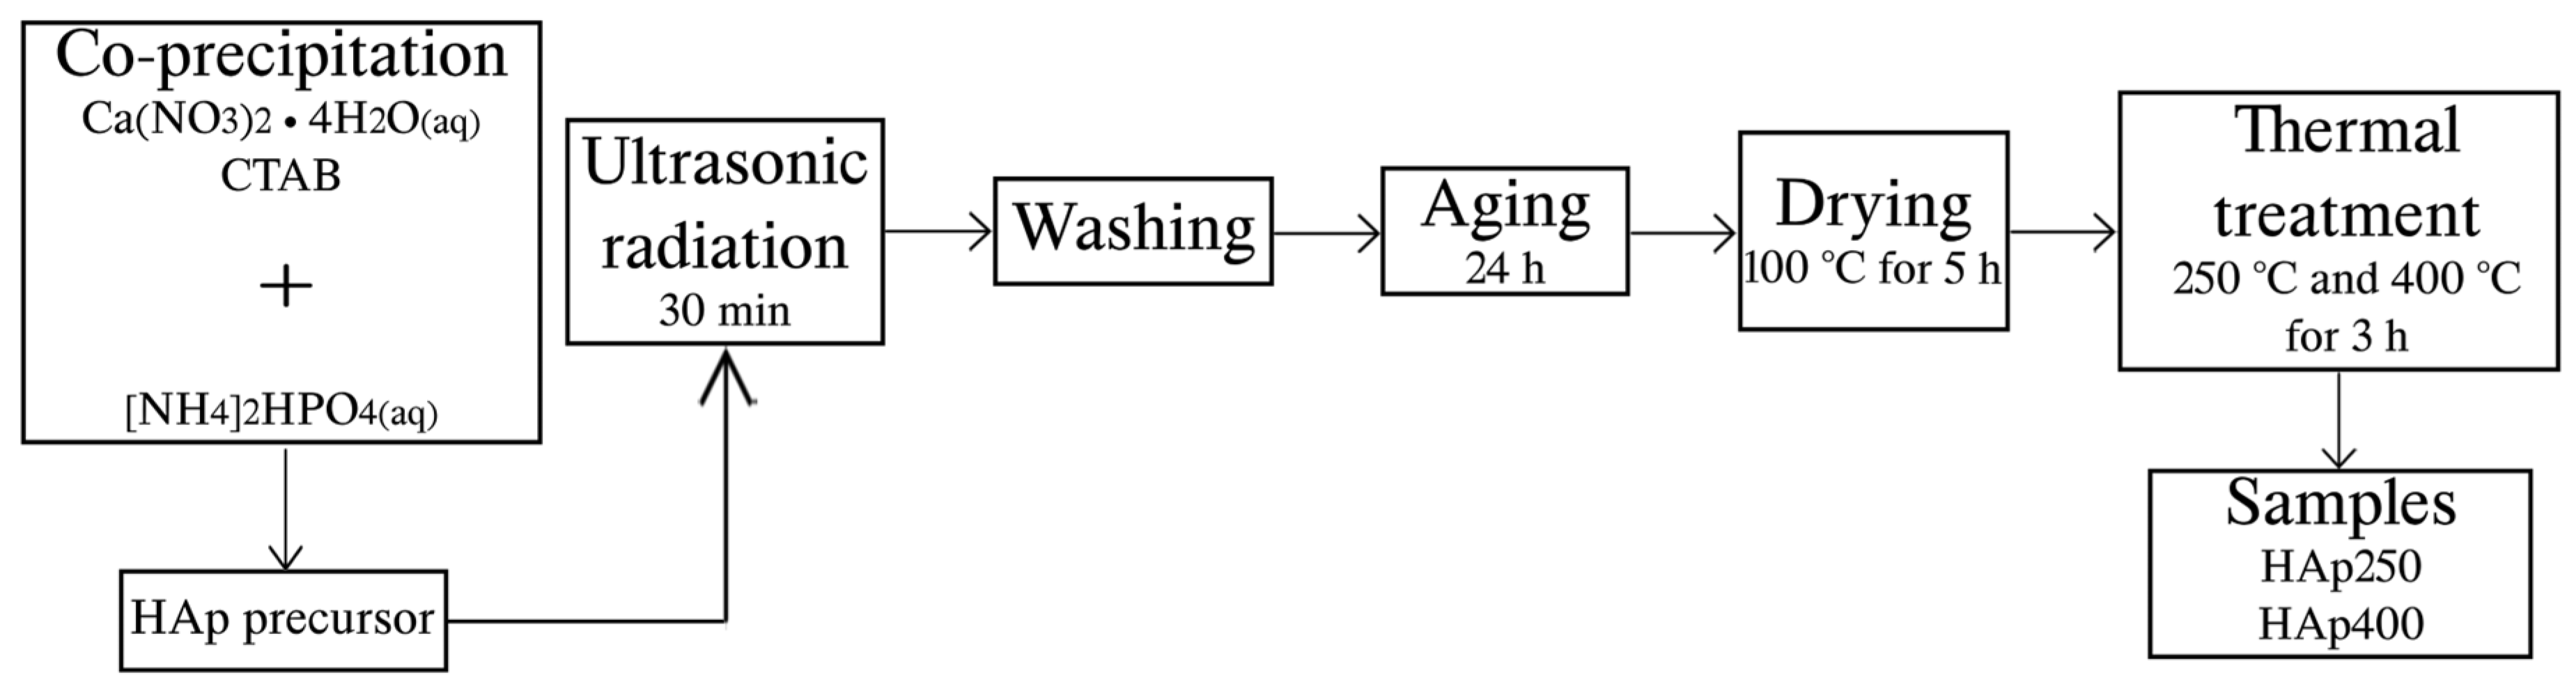
2.1. Hydroxyapatite Synthesis
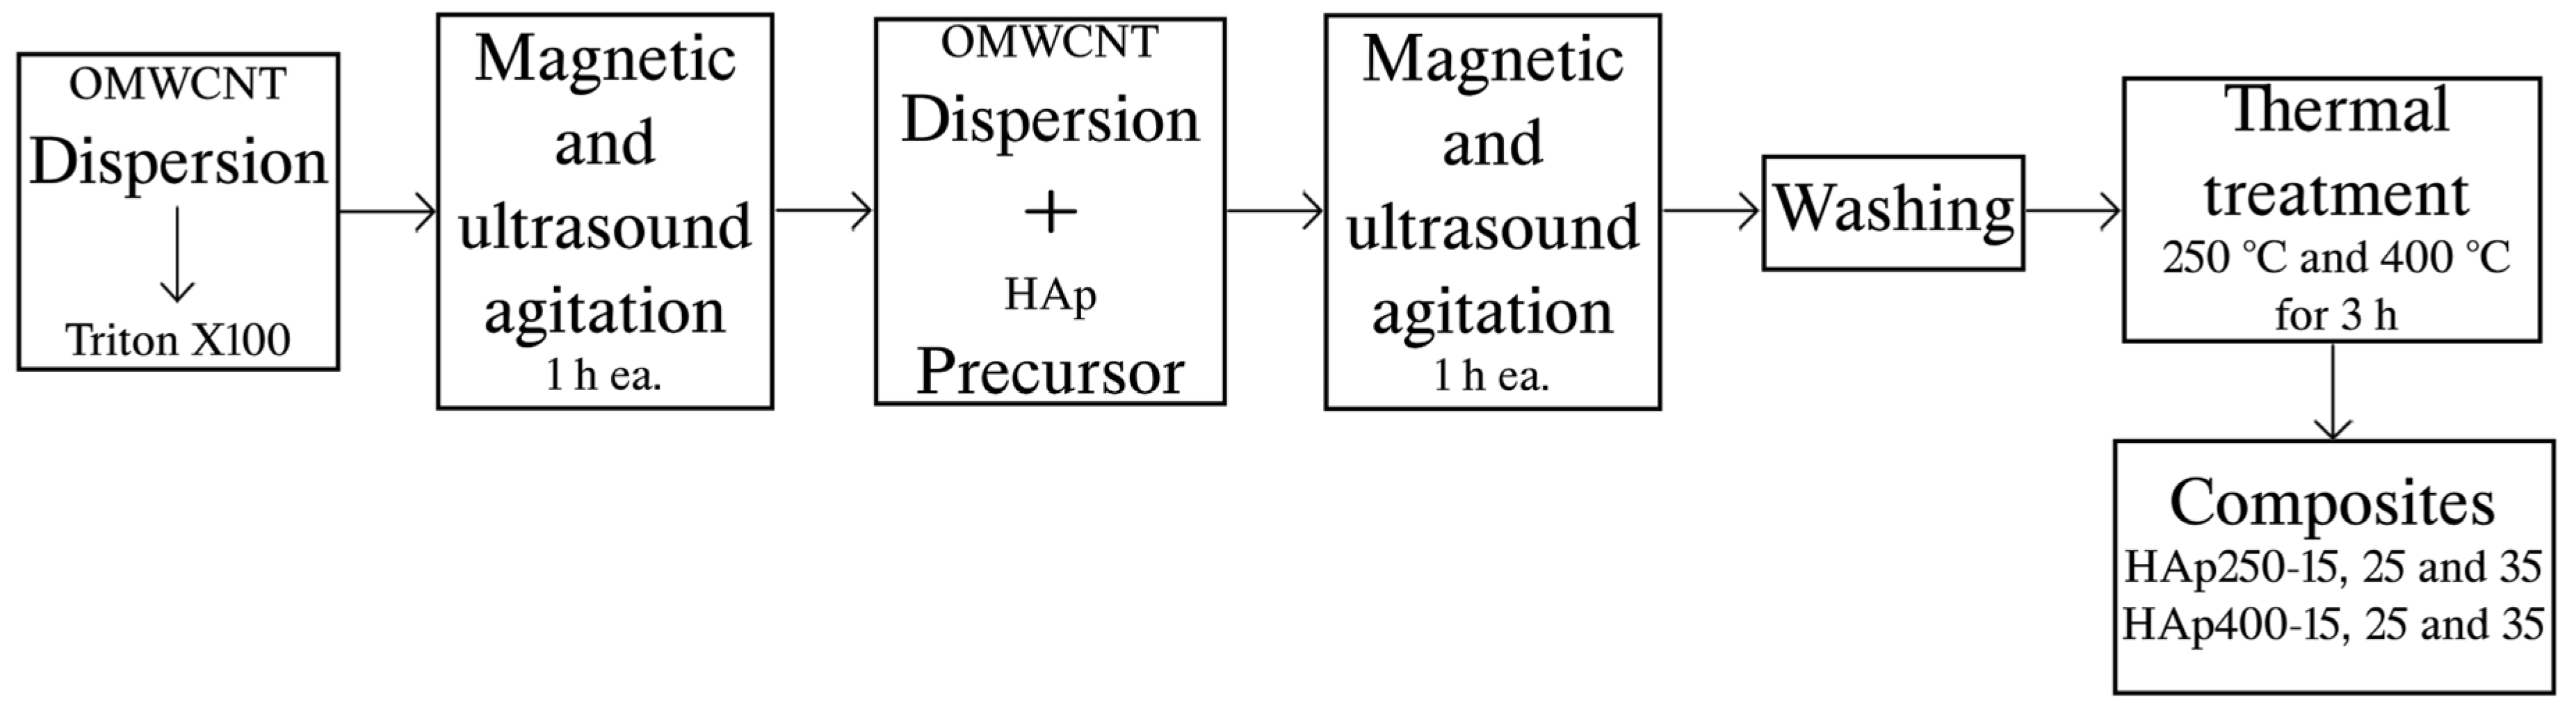
2.2. Hydroxyapatite/OMWCNT Composites Preparation
2.3. Characterization
3. Results and Discussion
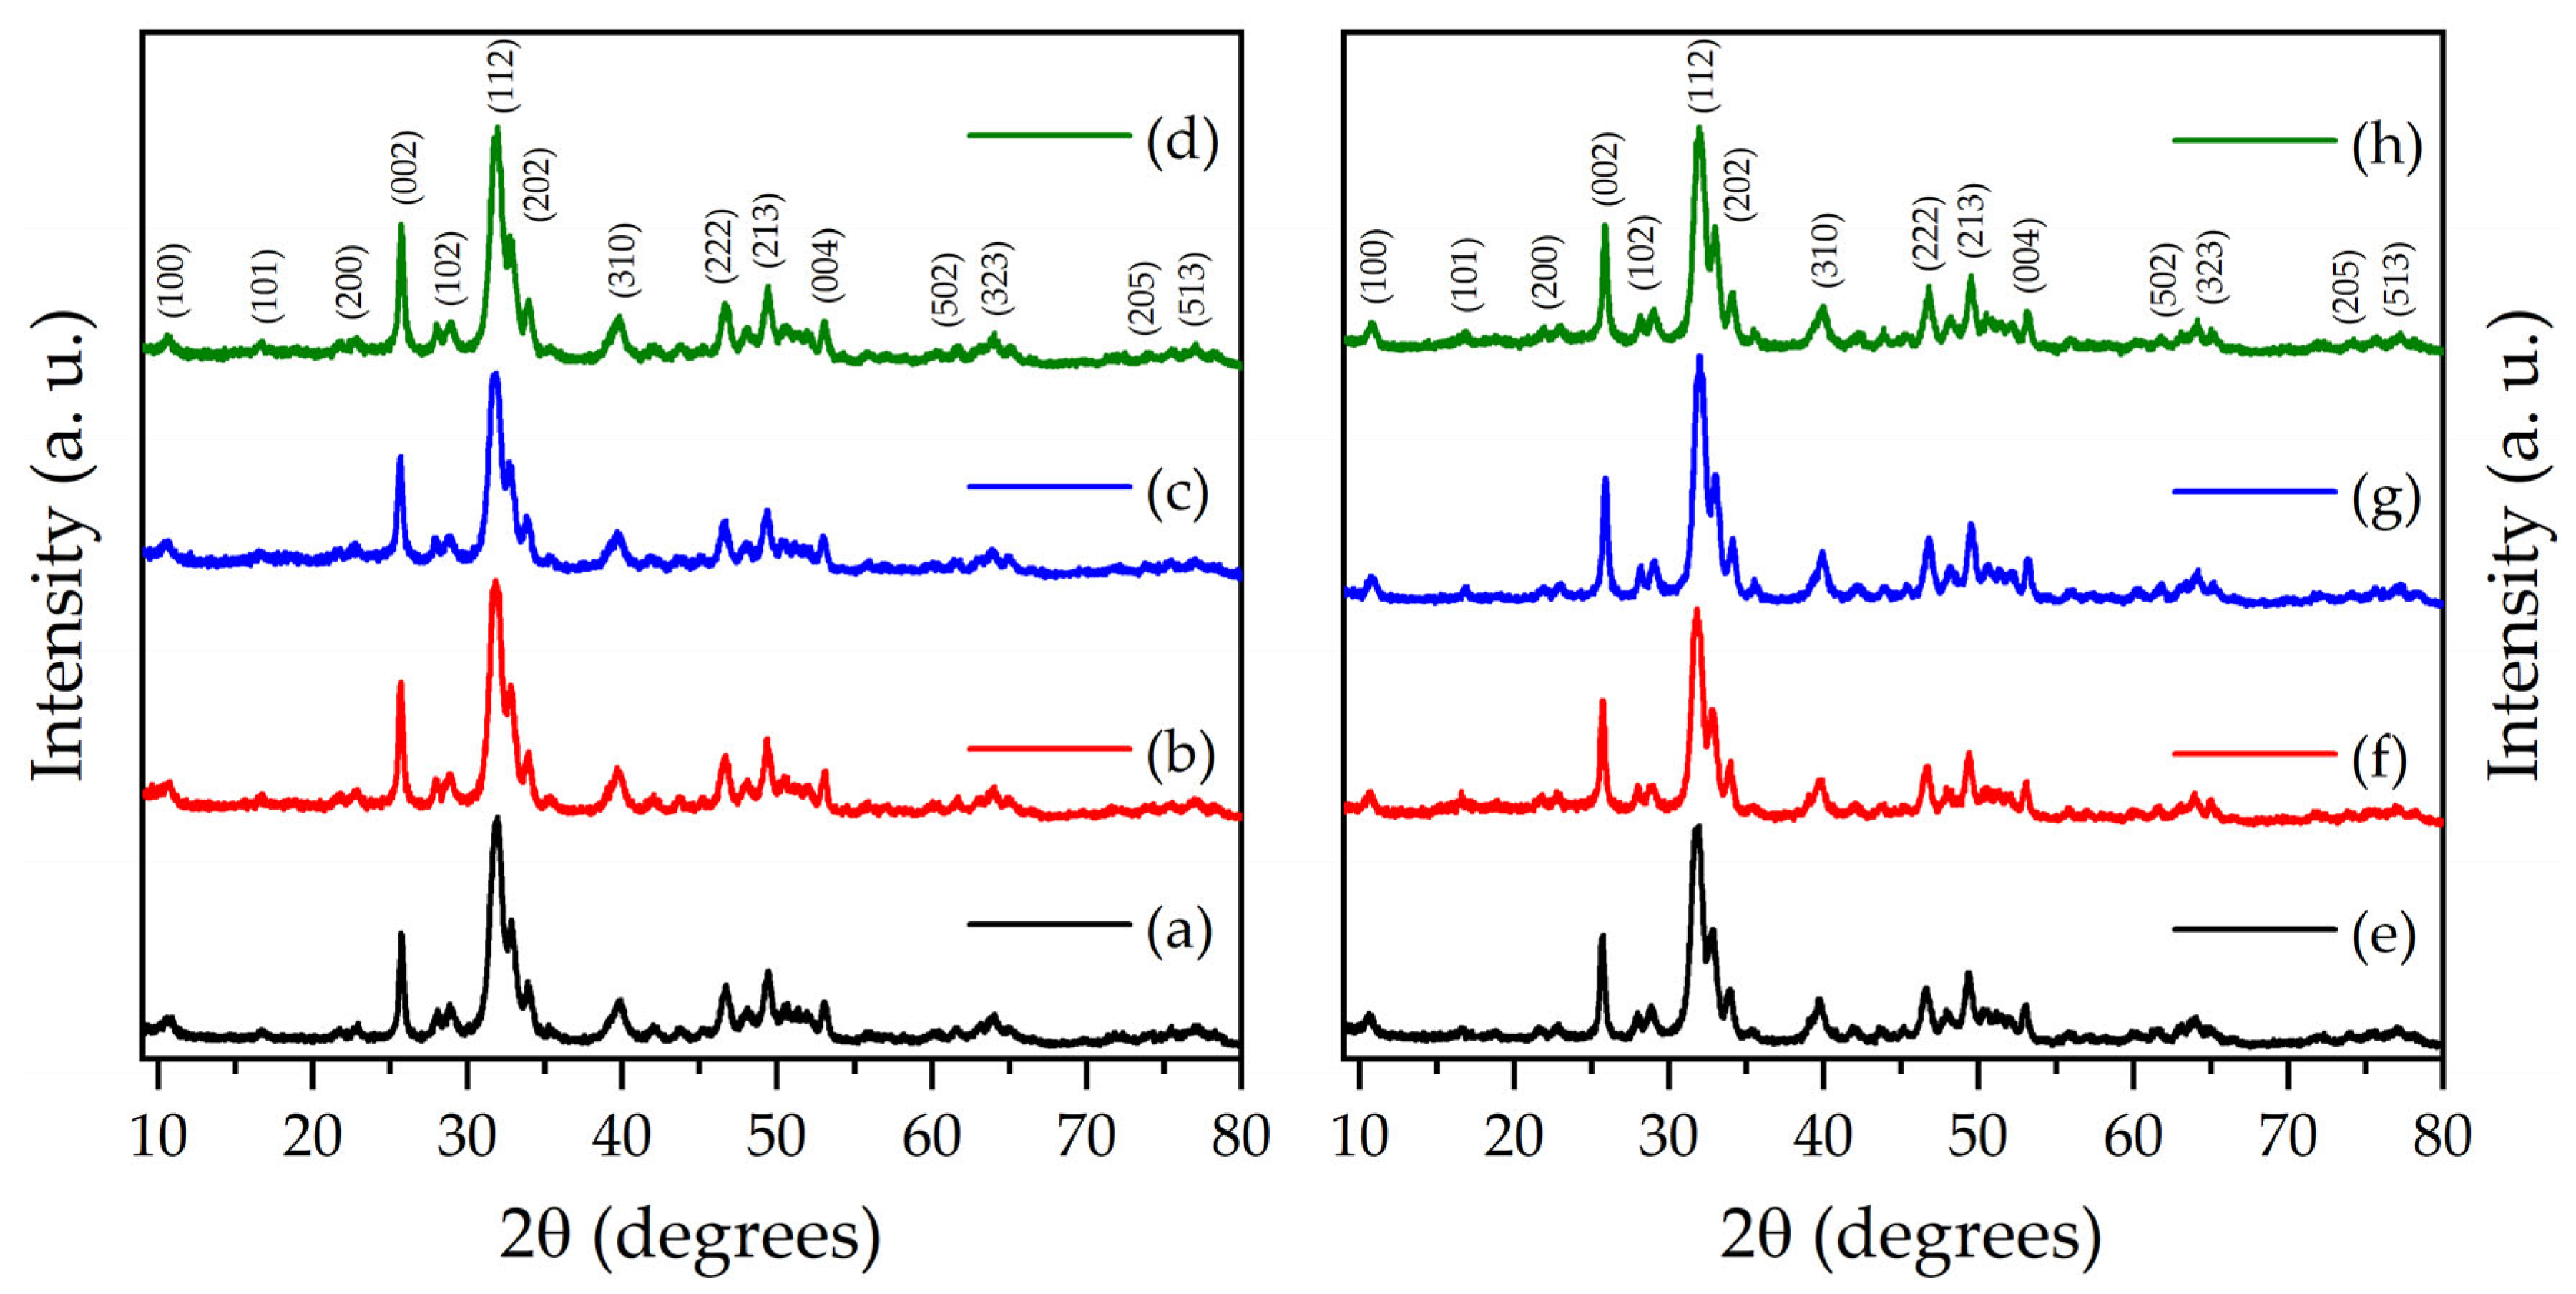
3.1. X-ray Diffraction
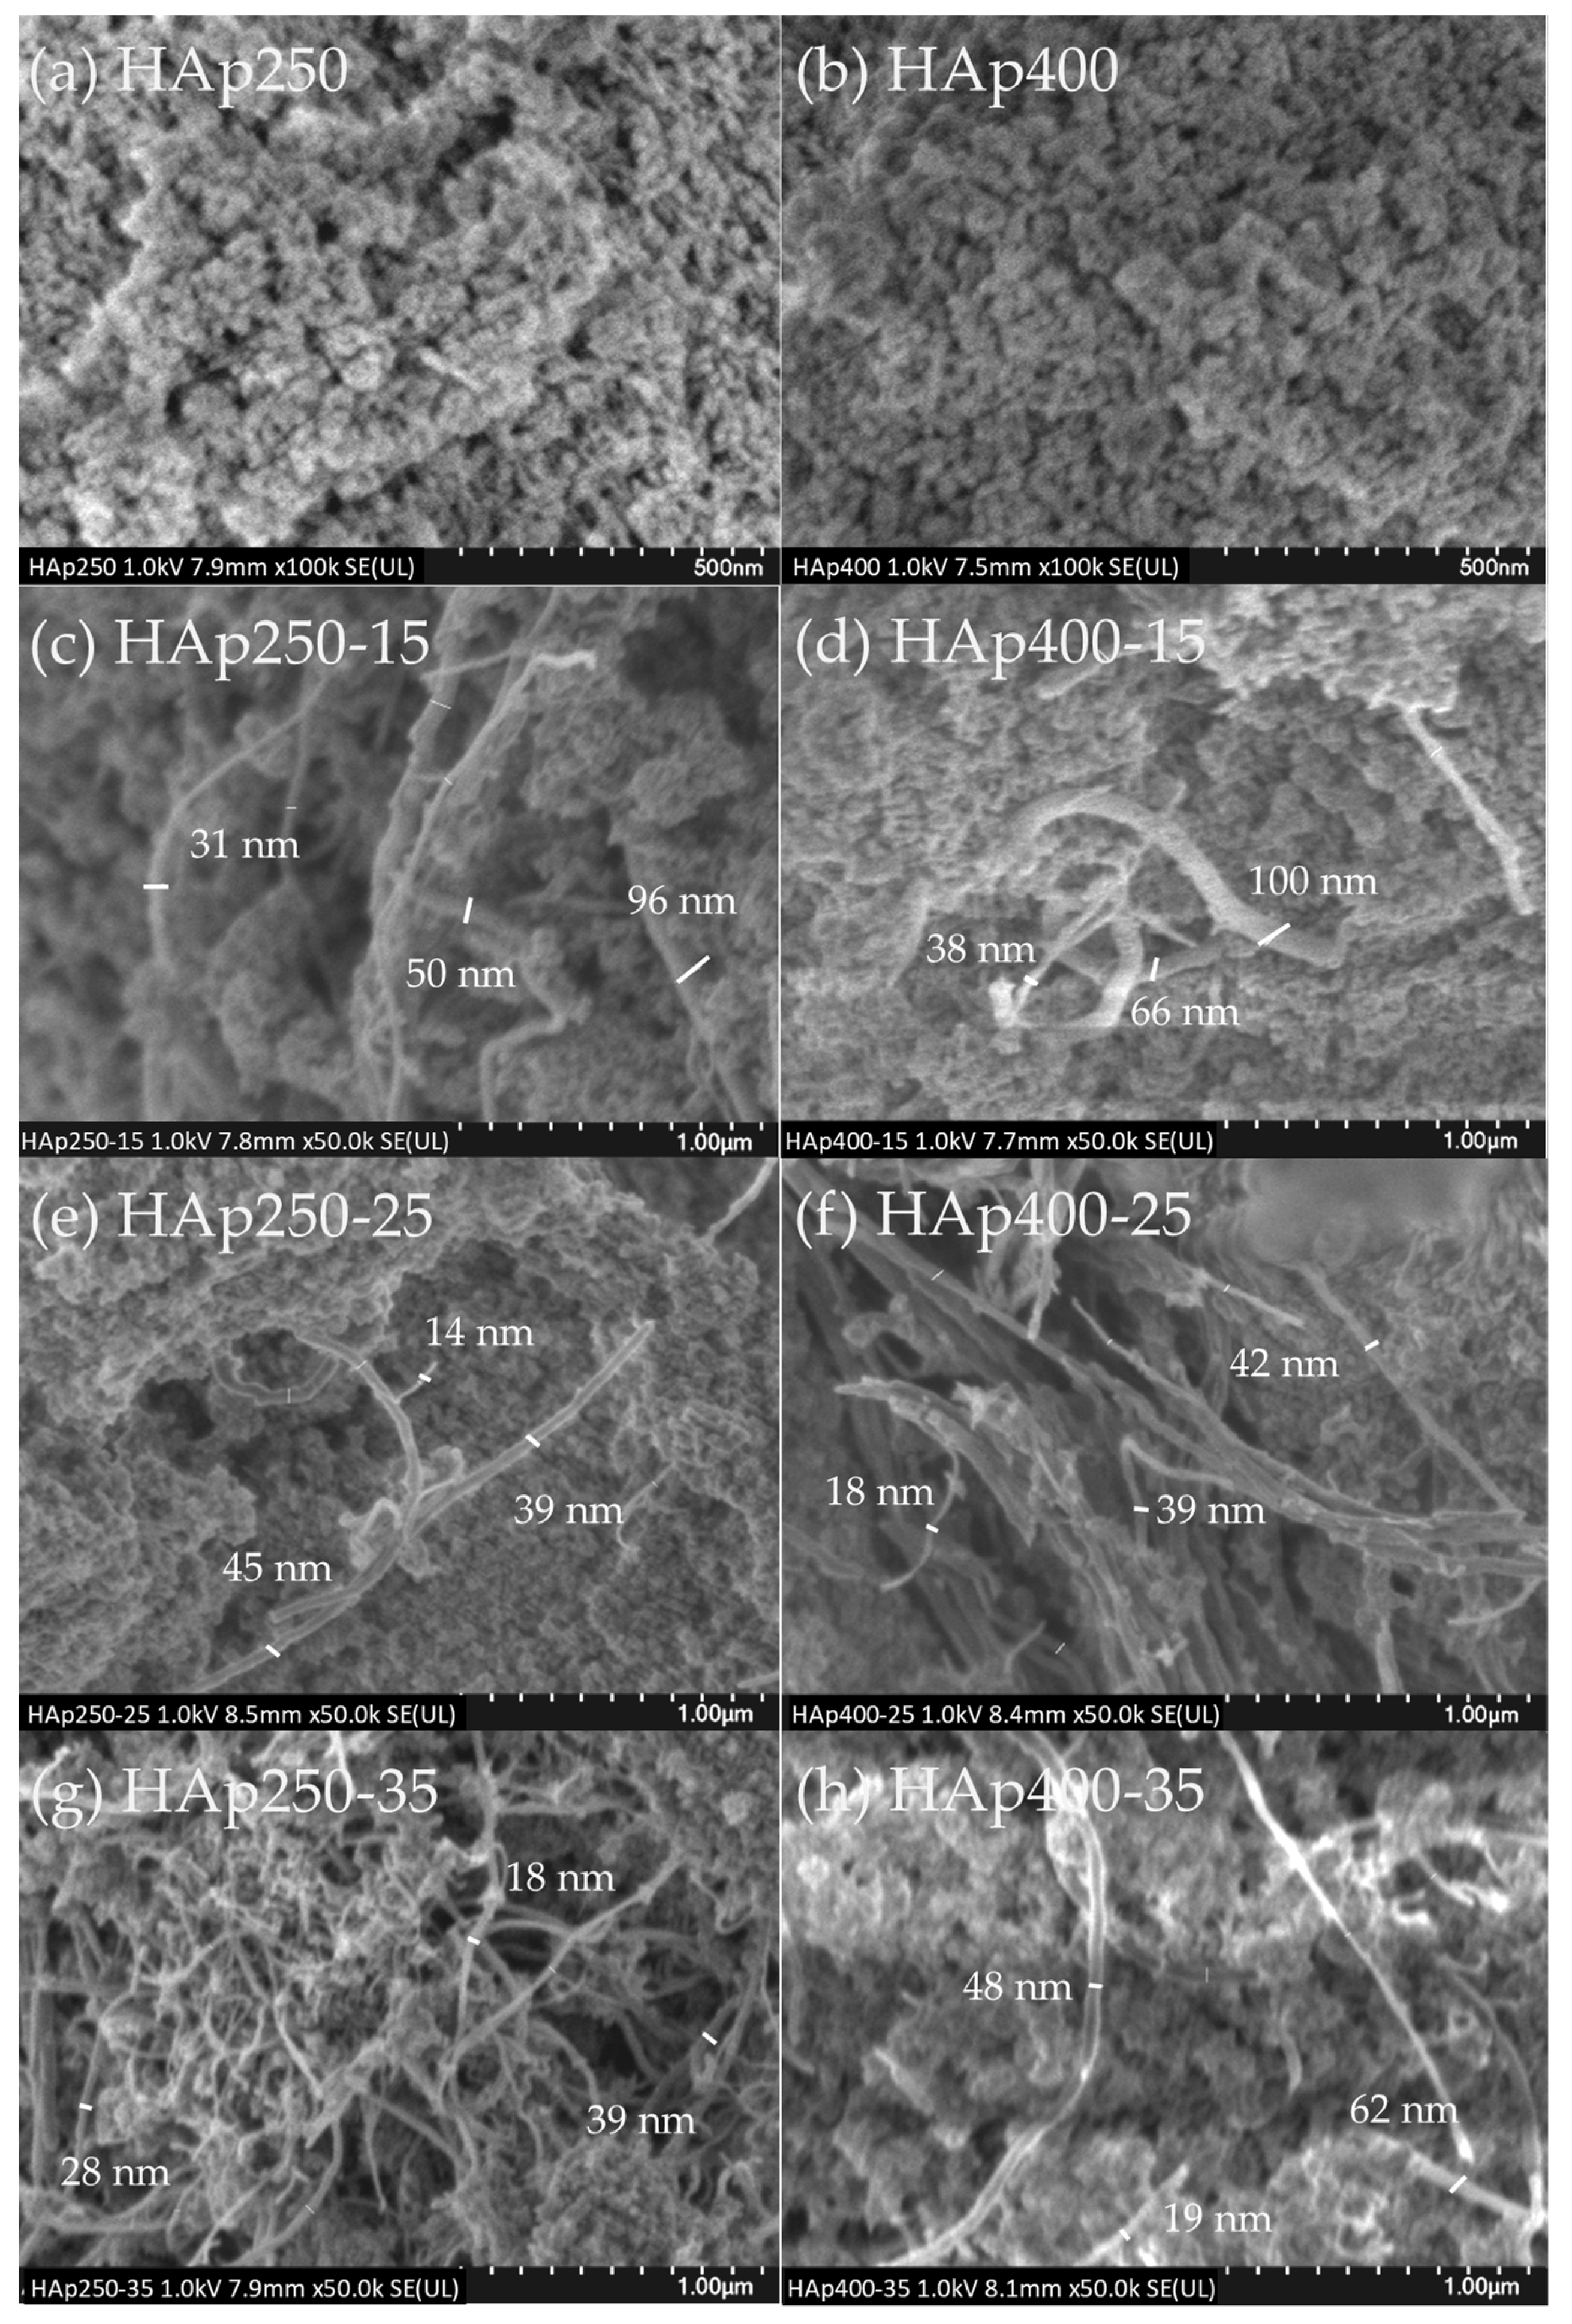
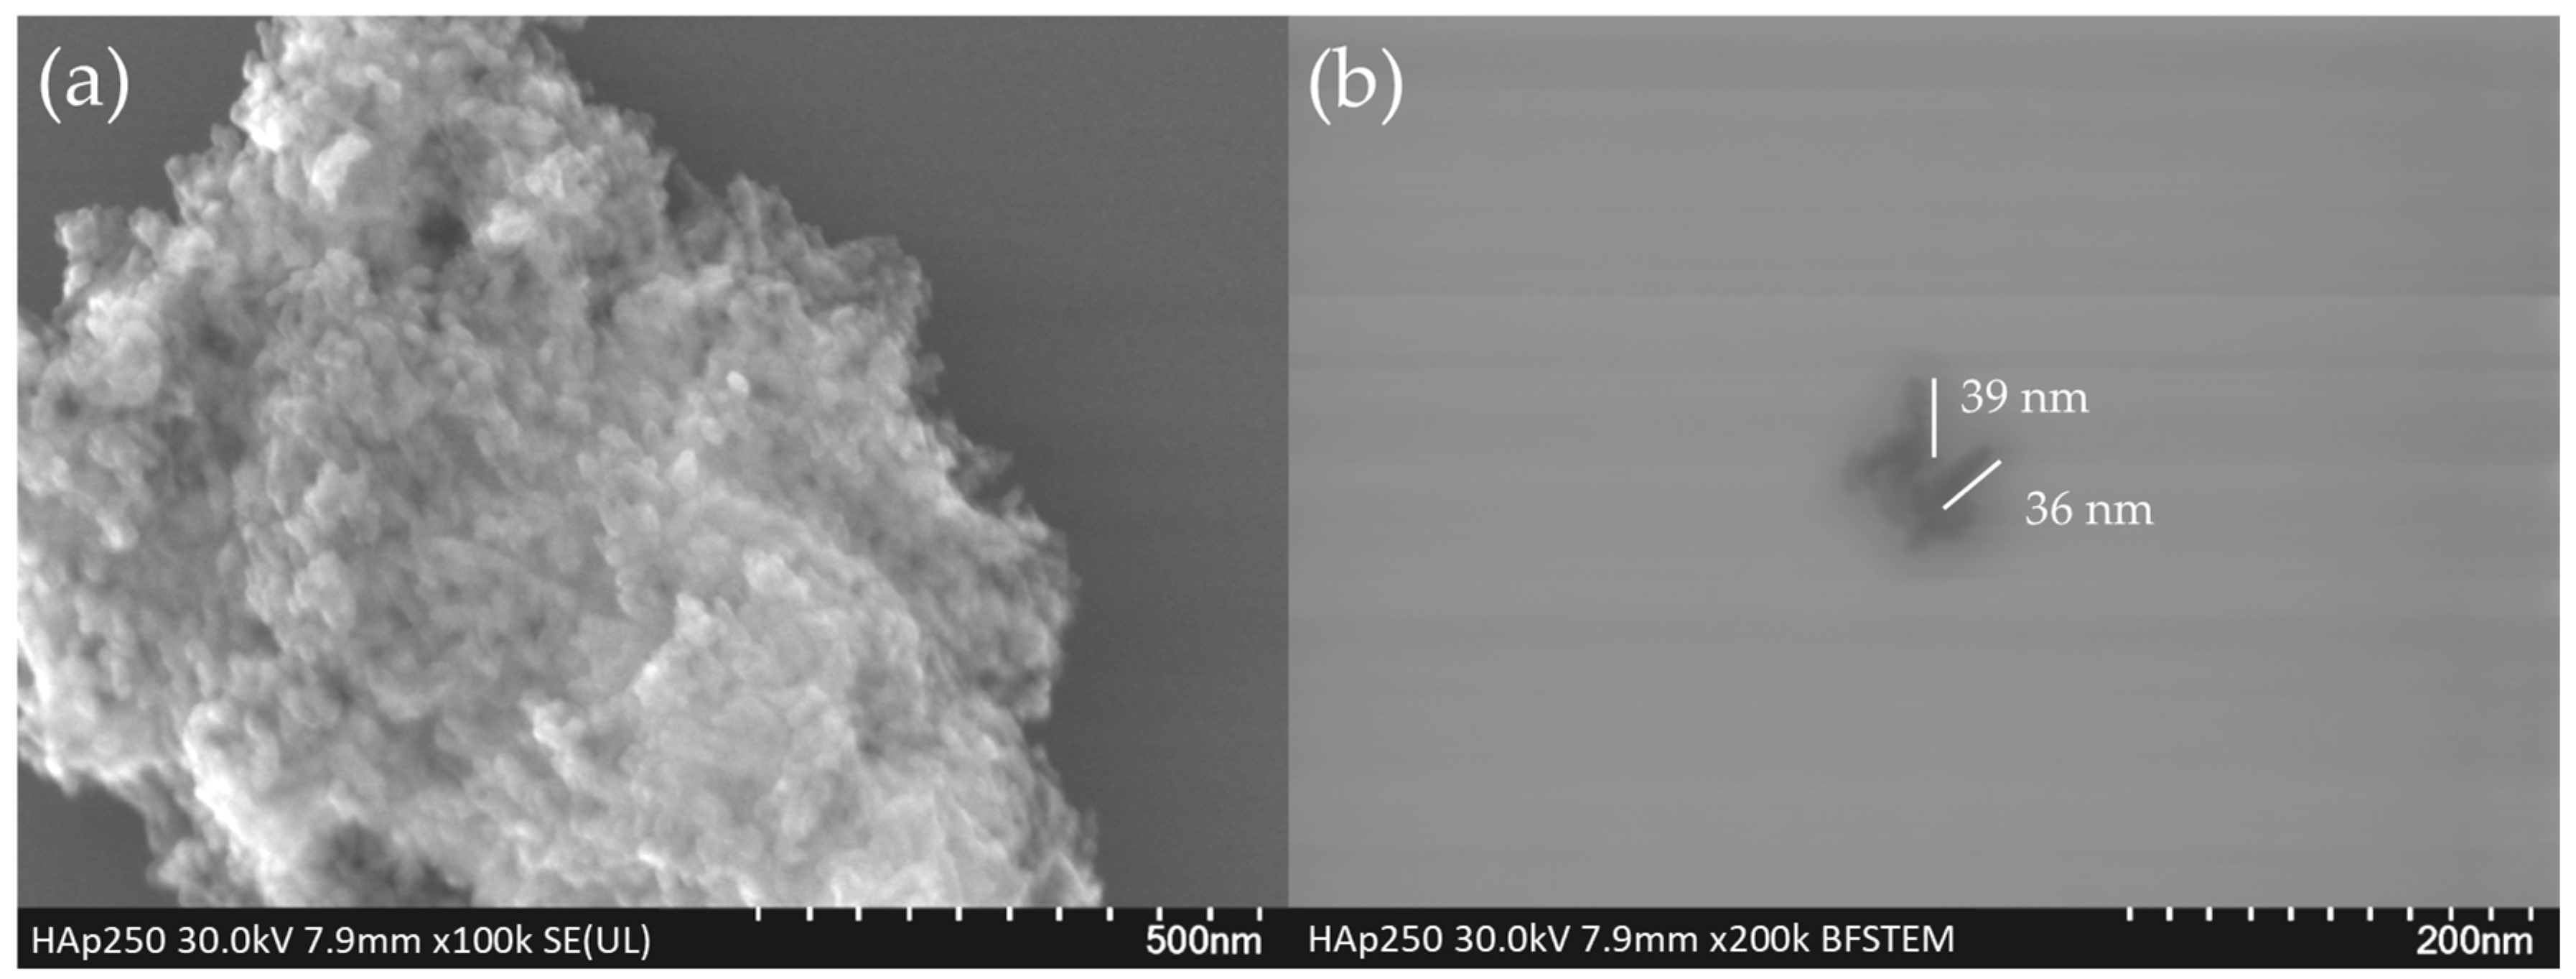
3.2. SEM Analysis
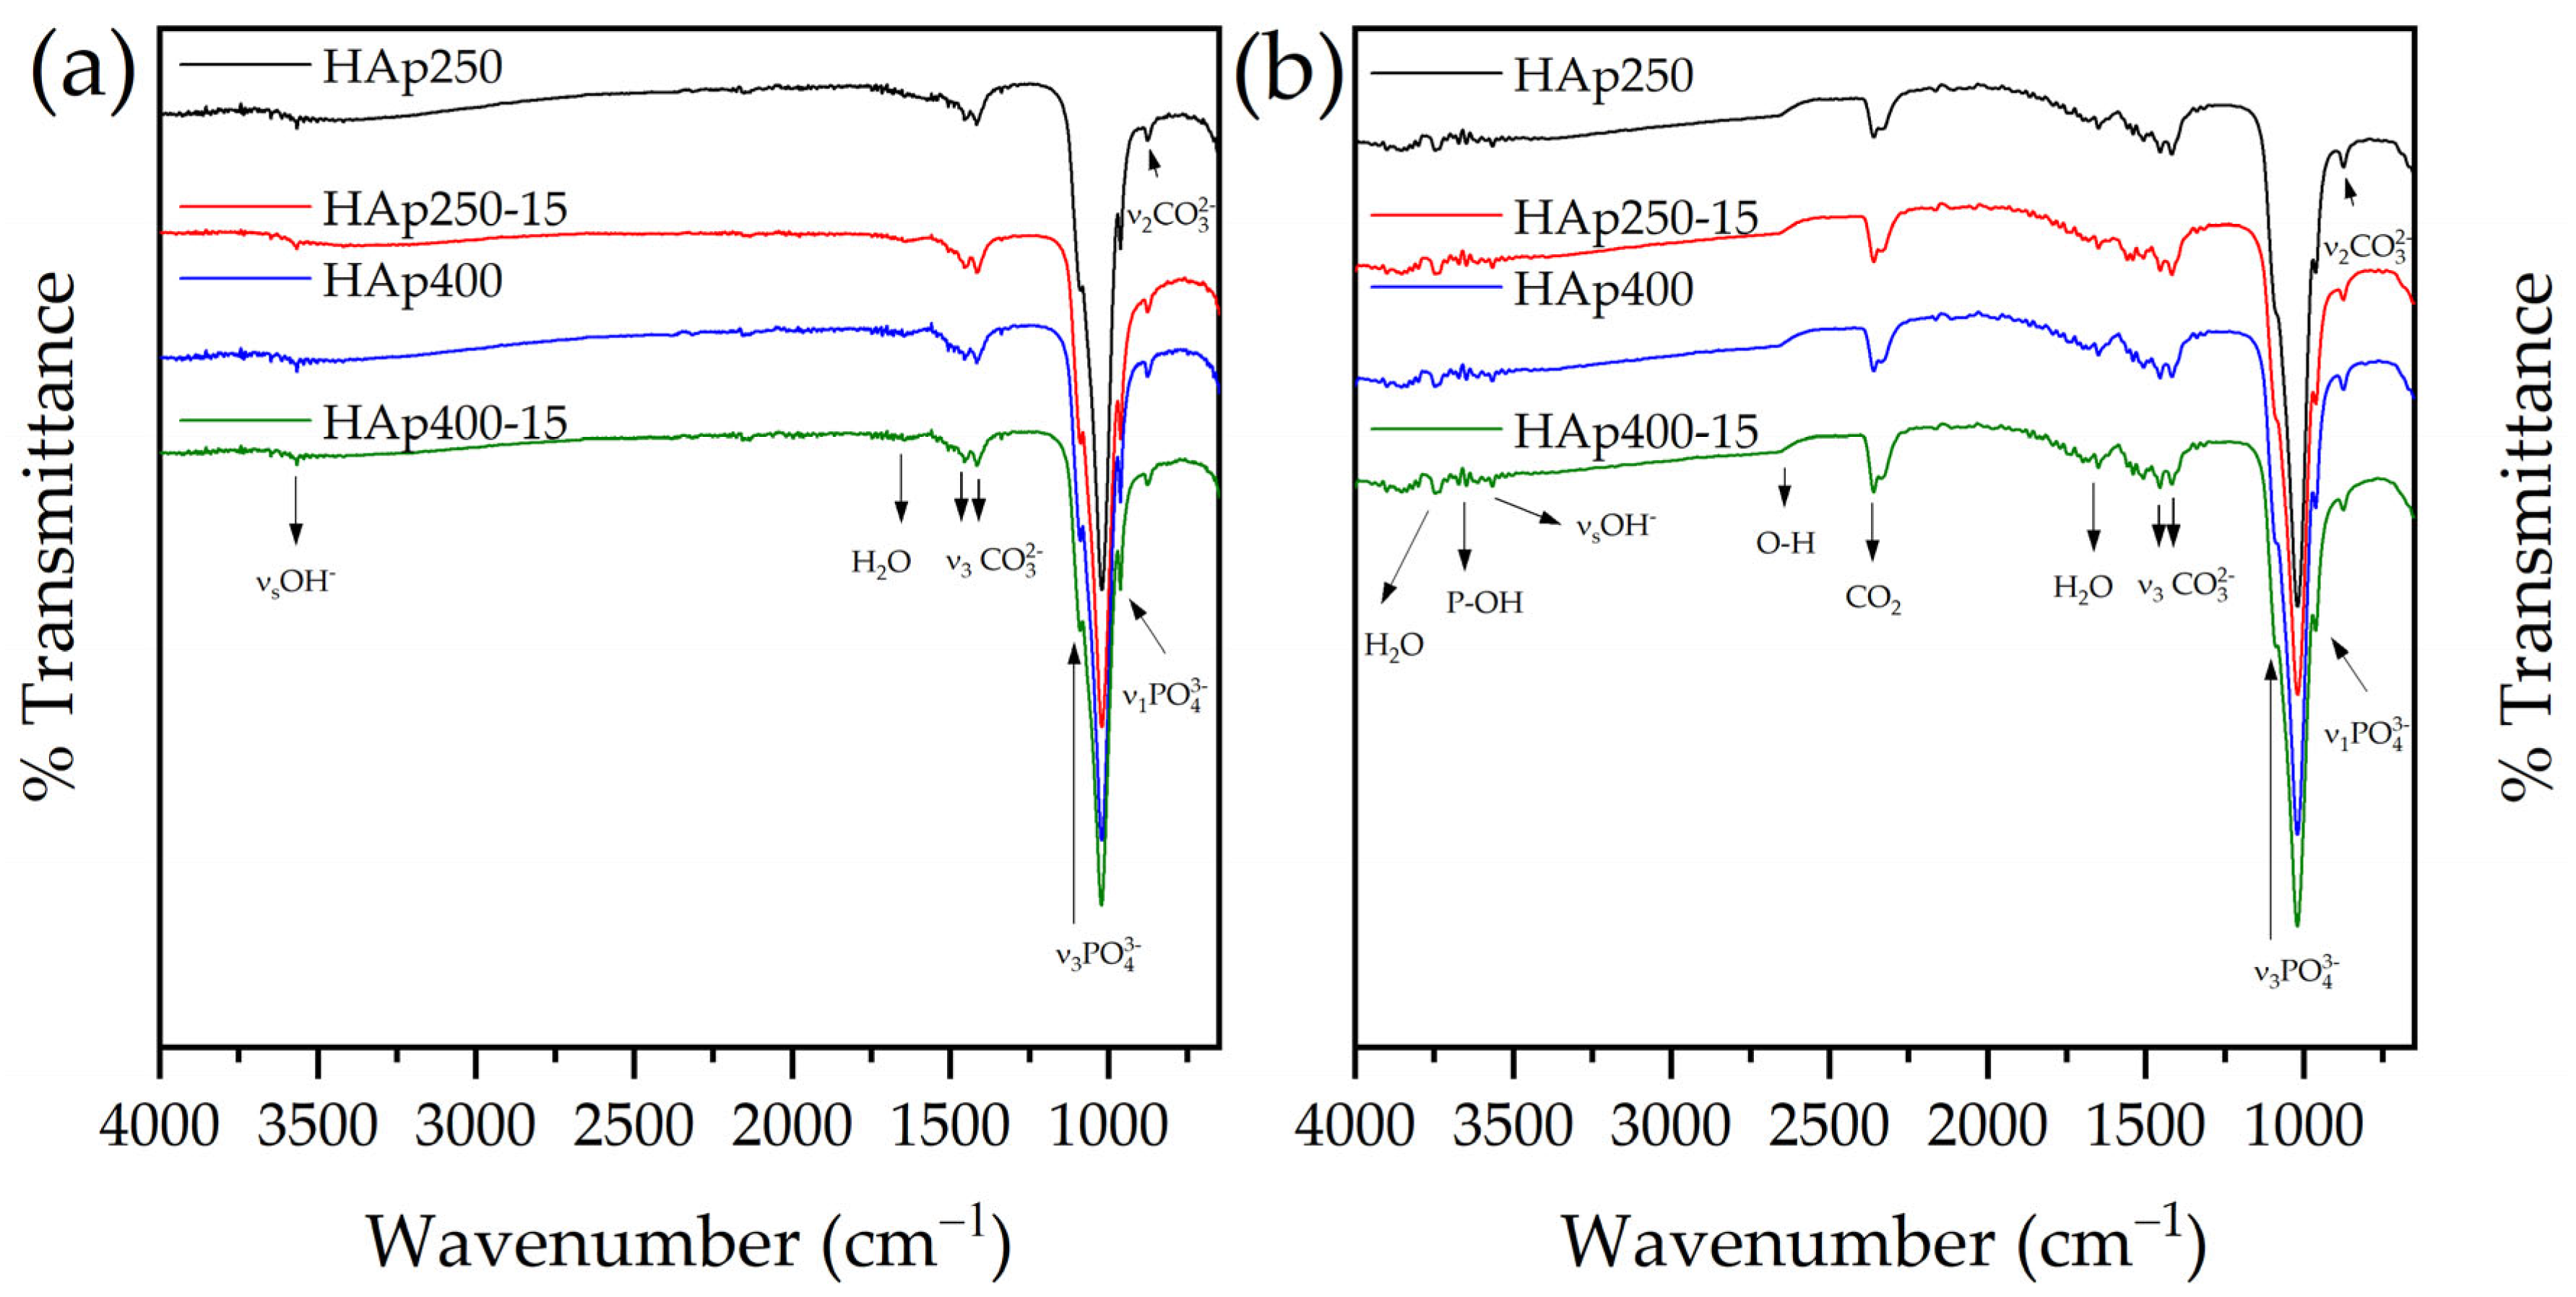
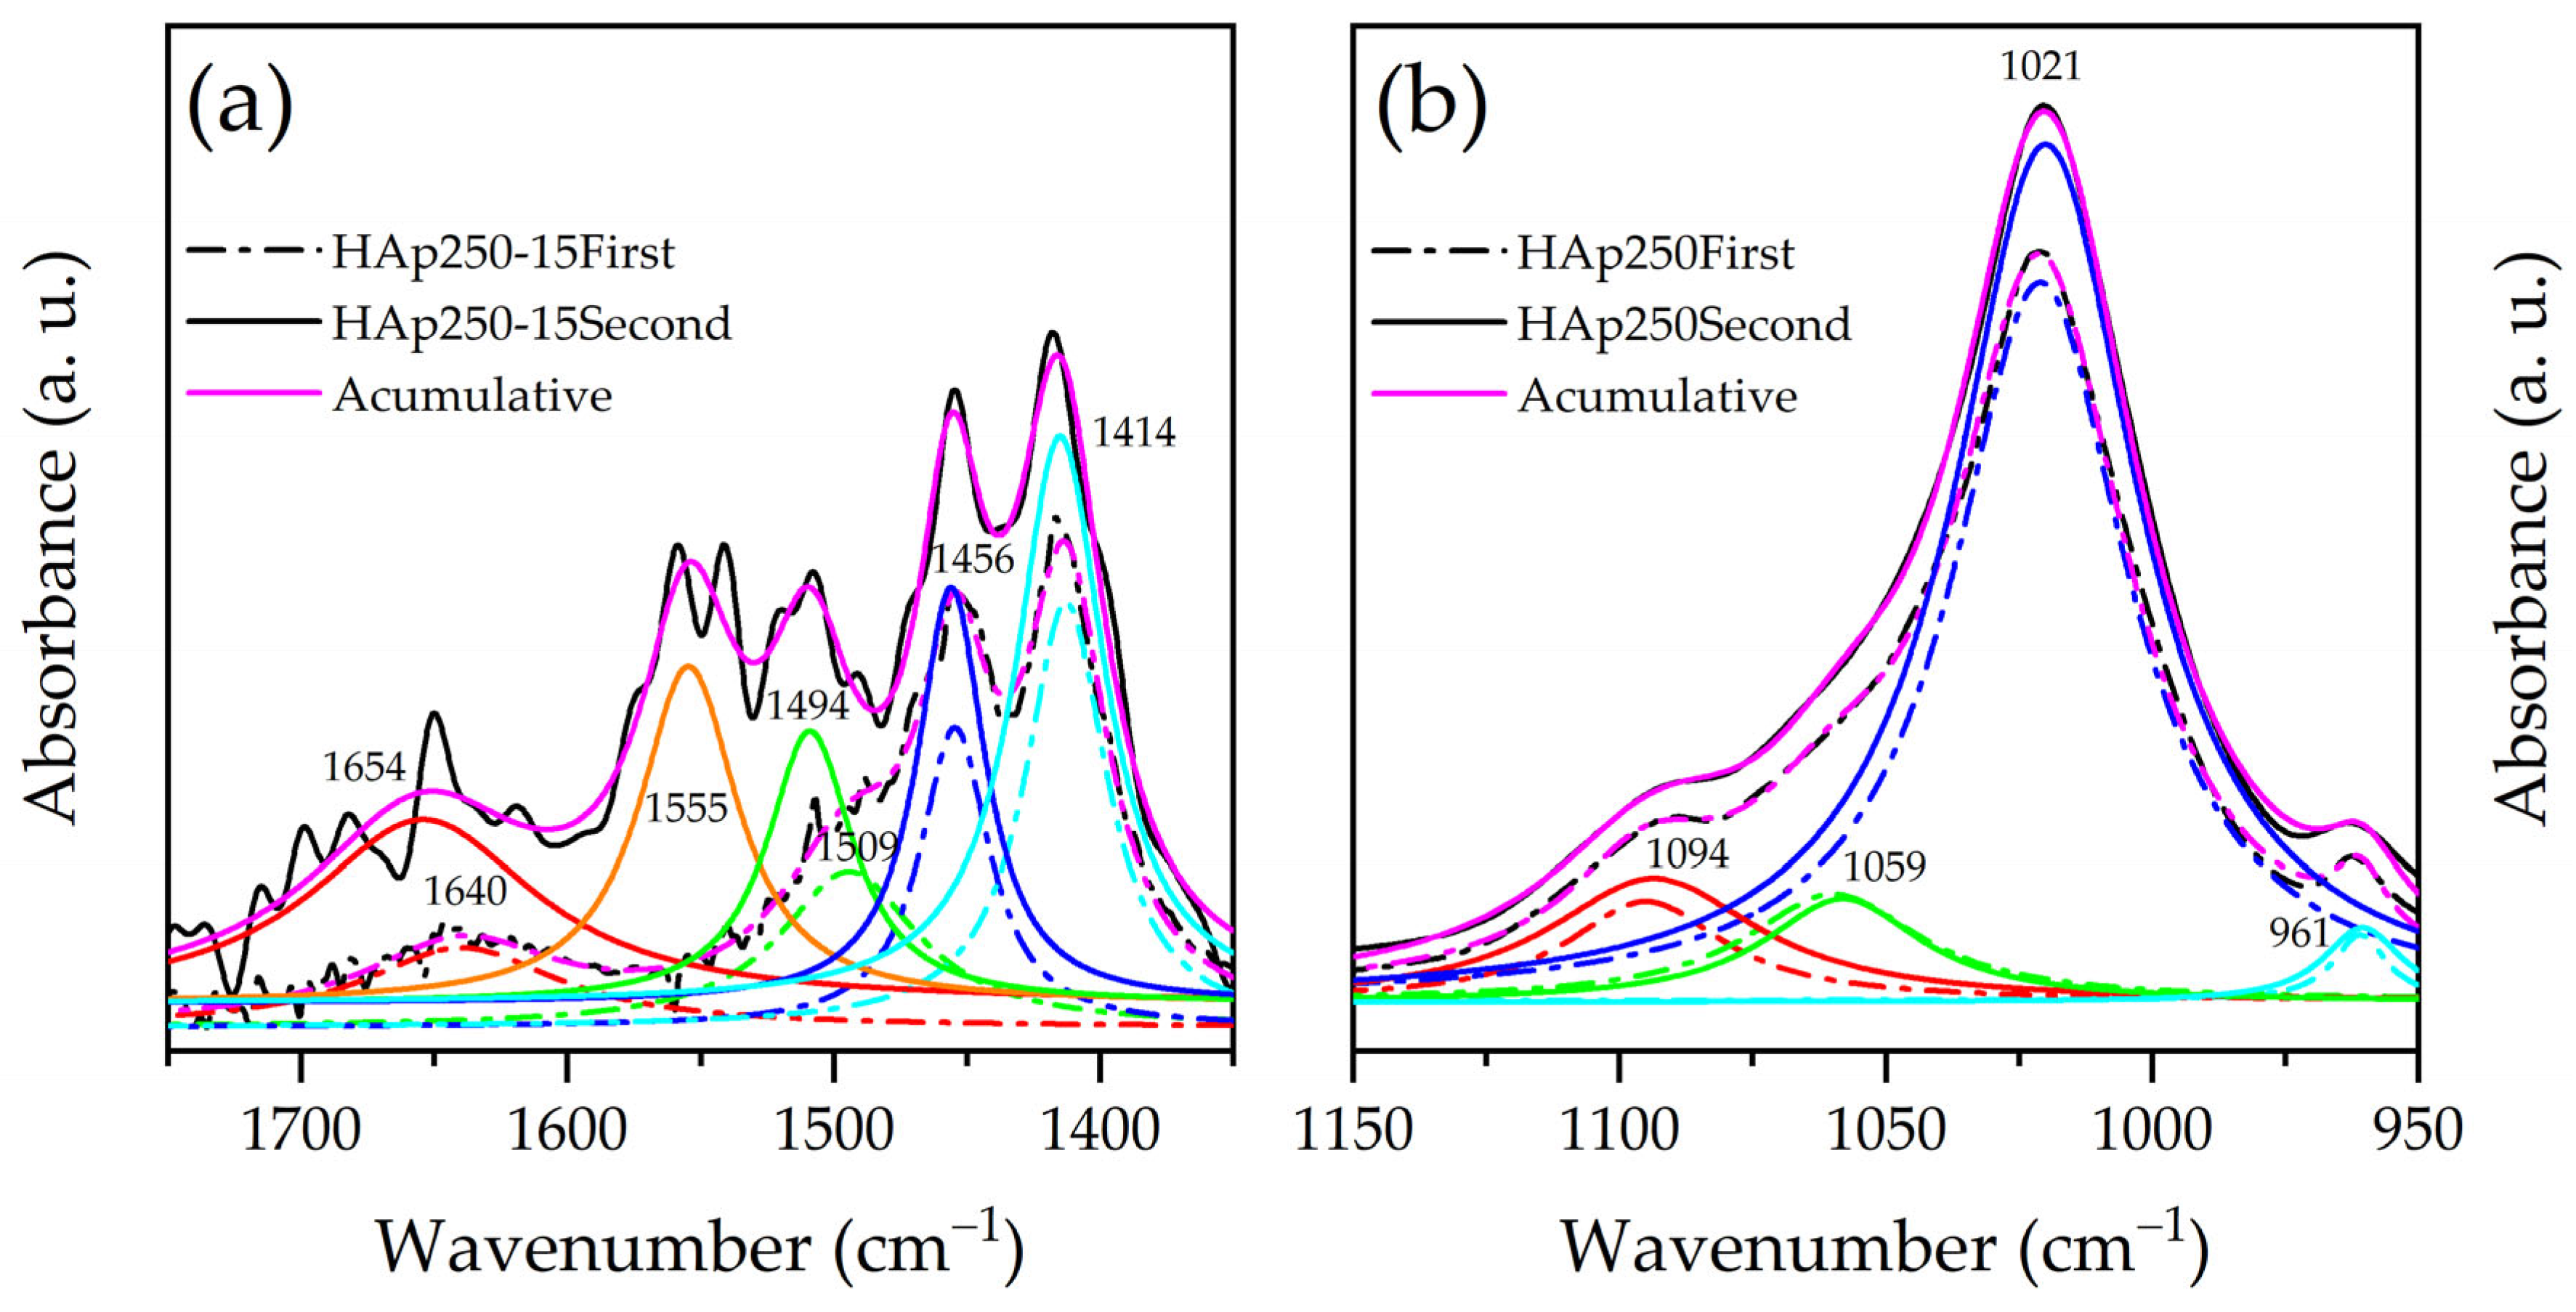
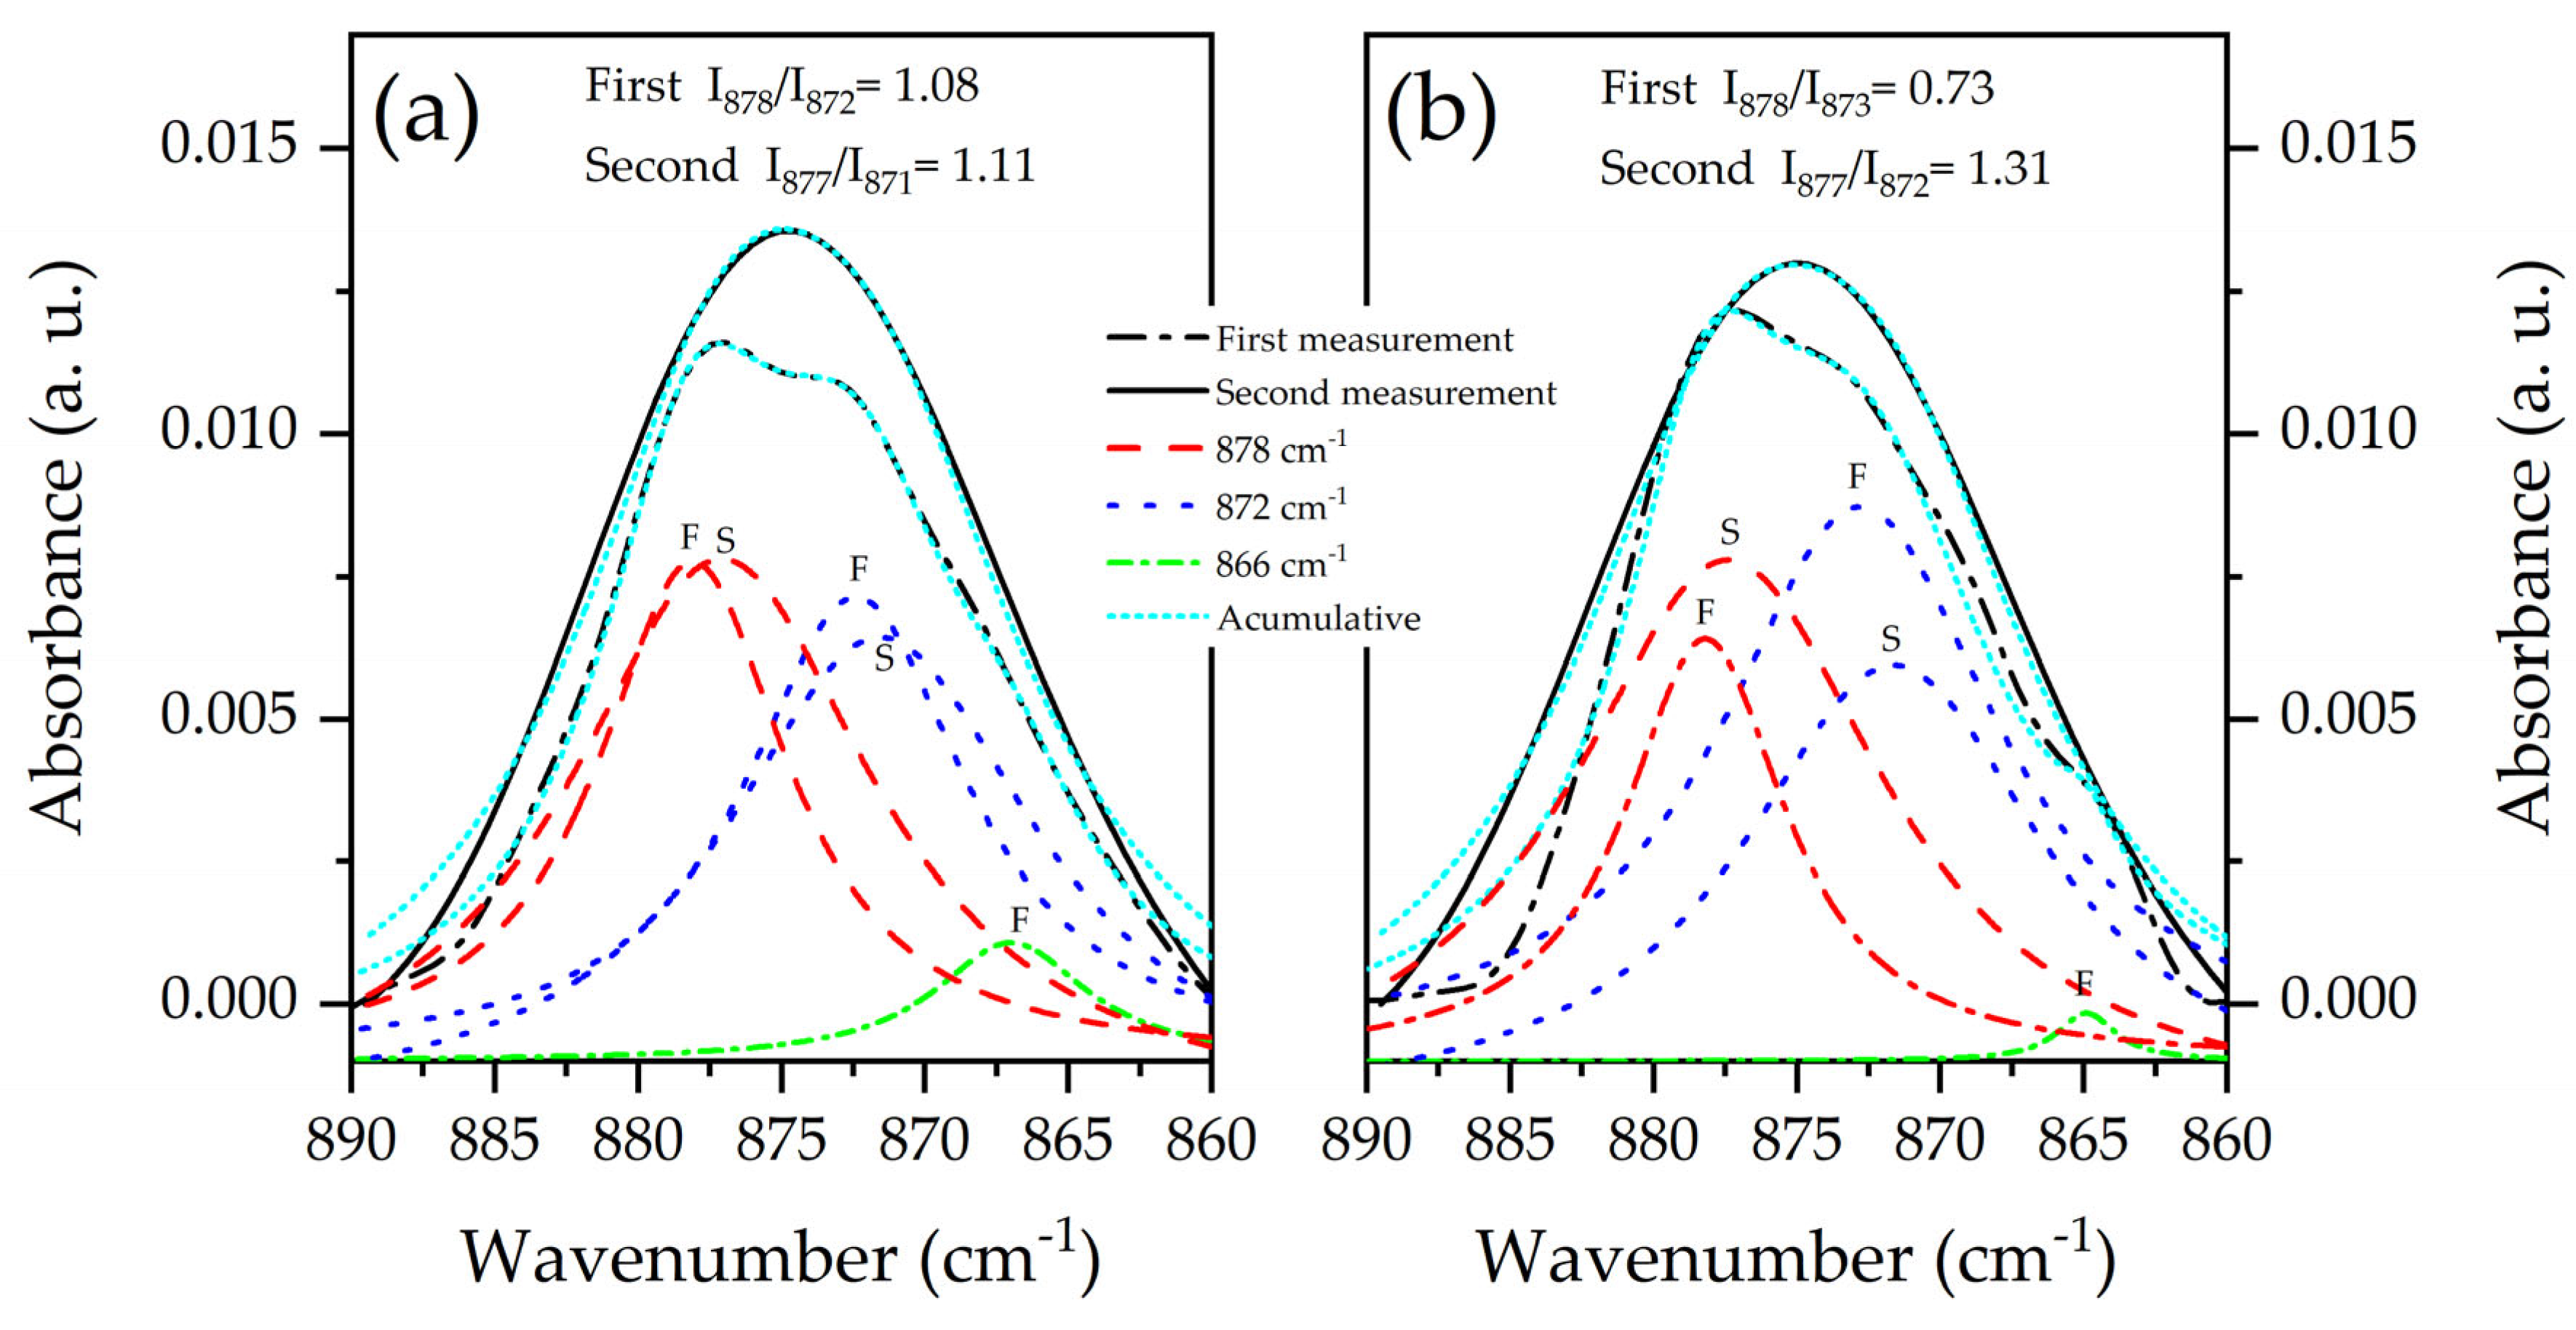
3.3. FTIR Analysis
3.4. Photoluminescence Analysis
4. Conclusions
Author Contributions
Funding
Institutional Review Board Statement
Informed Consent Statement
Data Availability Statement
Acknowledgments
Conflicts of Interest
References
- Castillo-Paz, A.M.; Correa-Piña, B.A.; Martinez-Hernandez, H.D.; Gomez-Vazquez, O.M.; Cañon-Davila, D.F.; Zubieta-Otero, L.F.; Londoño-Restrepo, S.M.; Perez-Torrero, E.; Rodriguez-Garcia, M.E. Influence of the changes in the bone mineral density on the guided bone regeneration using bioinspired grafts: A systematic review and meta-analysis. Biomed. Mater. Devices 2022, 1–17. [Google Scholar] [CrossRef]
- Ahymah Joshy, M.I.; Elayaraja, K.; Suganthi, R.V.; Chandra Veerla, S.; Kalkura, S.N. In vitro sustained release of amoxicillin from lanthanum hydroxyapatite nano rods. Curr. Appl. Phys. 2011, 11, 1100–1106. [Google Scholar] [CrossRef]
- Suganthi, R.V.; Elayaraja, K.; Joshy, M.I.A.; Chandra, V.S.; Girija, E.K.; Kalkura, S.N. Fibrous growth of strontium substituted hydroxyapatite and its drug release. Mater. Sci. Eng. C 2011, 31, 593–599. [Google Scholar] [CrossRef]
- Kolanthai, E.; Ganesan, K.; Epple, M.; Kalkura, S.N. Synthesis of nanosized hydroxyapatite/agarose powders for bone filler and drug delivery application. Mater. Today Commun. 2016, 8, 31–40. [Google Scholar] [CrossRef]
- Kolanthai, E.; Abinaya Sindu, P.; Thanigai Arul, K.; Sarath Chandra, V.; Manikandan, E.; Narayana Kalkura, S. Agarose encapsulated mesoporous carbonated hydroxyapatite nanocomposites powder for drug delivery. J. Photochem. Photobiol. B Biol. 2017, 166, 220–231. [Google Scholar] [CrossRef] [PubMed]
- Hench, L.L. Bioceramics: From concept to clinic. J. Am. Ceram. Soc. 1991, 74, 1487–1510. [Google Scholar] [CrossRef]
- Constanda, S.; Stan, M.S.; Ciobanu, C.S.; Motelica-Heino, M.; Guégan, R.; Lafdi, K.; Dinischiotu, A.; Predoi, D. Carbon nanotubes-hydroxyapatite nanocomposites for an improved osteoblast cell response. J. Nanomater. 2016, 2016, 3941501. [Google Scholar] [CrossRef]
- Chen, M.-H.; Yoshioka, T.; Ikoma, T.; Hanagata, N.; Lin, F.-H.; Tanaka, J. Photoluminescence and doping mechanism of theranostic Eu3+/Fe3+ dual-doped hydroxyapatite nanoparticles. Sci. Technol. Adv. Mater. 2014, 15, 055005. [Google Scholar] [CrossRef]
- Mahabole, M.; Bahir, M.; Khairnar, R. Mn blended hydroxyapatite nanoceramic: Bioactivity, dielectric and luminescence studies. J. Biomimetics Biomater. Tissue Eng. 2013, 18, 43–59. [Google Scholar] [CrossRef]
- Neacsu, I.A.; Stoica, A.E.; Vasile, B.S.; Andronescu, E. Luminescent hydroxyapatite doped with rare earth elements for biomedical applications. Nanomaterials 2019, 9, 239. [Google Scholar] [CrossRef]
- Paterlini, V.; Bettinelli, M.; Rizzi, R.; El Khouri, A.; Rossi, M.; Della Ventura, G.; Capitelli, F. Characterization and luminescence of Eu3+- and Gd3+-doped hydroxyapatite Ca10(PO4)6(OH)2. Crystals 2020, 10, 806. [Google Scholar] [CrossRef]
- Smith, A.M.; Duan, H.; Mohs, A.M.; Nie, S. Bioconjugated quantum dots for in vivo molecular and cellular imaging. Adv. Drug Deliv. Rev. 2008, 60, 1226–1240. [Google Scholar] [CrossRef] [PubMed]
- Tite, T.; Popa, A.-C.; Balescu, L.; Bogdan, I.; Pasuk, I.; Ferreira, J.; Stan, G. Cationic Substitutions in Hydroxyapatite: Current Status of the Derived Biofunctional Effects and Their In Vitro Interrogation Methods. Materials 2018, 11, 2081. [Google Scholar] [CrossRef] [PubMed]
- Mao, L.-C.; Zhang, X.-Y.; Wei, Y. Recent advances and progress for the fabrication and surface modification of AIE-active organic-inorganic luminescent composites. Chin. J. Polym. Sci. 2019, 37, 340–351. [Google Scholar] [CrossRef]
- Zakharova, O.V.; Gusev, A.A.; Abourahma, J.; Vorobeva, N.S.; Sokolov, D.V.; Muratov, D.S.; Kuznetsov, D.V.; Sinitskii, A. Nanotoxicity of ZrS3 Probed in a Bioluminescence Test on E. coli Bacteria: The Effect of Evolving H2S. Nanomaterials 2020, 10, 1401. [Google Scholar] [CrossRef]
- Yang, P.; Yang, P.; Teng, X.; Lin, J.; Huang, L. A novel luminescent mesoporous silica/apatite composite for controlled drug release. J. Mater. Chem. 2011, 21, 5505–5510. [Google Scholar] [CrossRef]
- Chen, F.; Huang, P.; Zhu, Y.-J.; Wu, J.; Zhang, C.-L.; Cui, D.-X. The photoluminescence, drug delivery and imaging properties of multifunctional Eu3+/Gd3+ dual-doped hydroxyapatite nanorods. Biomaterials 2011, 32, 9031–9039. [Google Scholar] [CrossRef]
- Avouris, P.; Chen, J. Nanotube electronics and optoelectronics. Mater. Today 2006, 9, 46–54. [Google Scholar] [CrossRef]
- Wang, W.; Zhu, Y.; Watari, F.; Liao, S.; Yokoyama, A.; Omori, M.; Ai, H.; Cui, F. Carbon nanotubes/hydroxyapatite nanocomposites fabricated by spark plasma sintering for bonegraft applications. Appl. Surf. Sci. 2012, 262, 194–199. [Google Scholar] [CrossRef]
- Riggs, J.E.; Guo, Z.; Carroll, D.L.; Sun, Y.-P. Strong luminescence of solubilized carbon nanotubes. J. Am. Chem. Soc. 2000, 122, 5879–5880. [Google Scholar] [CrossRef]
- O’Connell, M.J. Band gap fluorescence from individual single-walled carbon nanotubes. Science 2002, 297, 593–596. [Google Scholar] [CrossRef] [PubMed]
- Zhang, X.; Zhang, J.; Ma, W.; Liao, S.; Zhang, X.; Wang, Z.; Yu, L.; Lian, S. From Nonluminescence to Bright Blue Emission: Boron-Induced Highly Efficient Ce3+-Doped Hydroxyapatite Phosphor. Inorg. Chem. 2019, 58, 13481–13491. [Google Scholar] [CrossRef] [PubMed]
- Blasse, G.; Grabmaier, B.C. Luminescent Materials, 1st ed.; Springer: Berlin/Heidelberg, Germany, 1994; ISBN 978-3-540-58019-5. [Google Scholar]
- Machado, T.R.; Sczancoski, J.C.; Beltrán-Mir, H.; Nogueira, I.C.; Li, M.S.; Andrés, J.; Cordoncillo, E.; Longo, E. A novel approach to obtain highly intense self-activated photoluminescence emissions in hydroxyapatite nanoparticles. J. Solid State Chem. 2016, 249, 64–69. [Google Scholar] [CrossRef]
- Li, J.; Hu, L.; Wang, L.; Zhou, Y.; Grüner, G.; Marks, T.J. Organic Light-Emitting Diodes Having Carbon Nanotube Anodes. Nano Lett. 2006, 6, 2472–2477. [Google Scholar] [CrossRef] [PubMed]
- Fournet, P.; Coleman, J.N.; Lahr, B.; Drury, A.; Blau, W.J.; O’Brien, D.F.; Hörhold, H.-H. Enhanced brightness in organic light-emitting diodes using a carbon nanotube composite as an electron-transport layer. J. Appl. Phys. 2001, 90, 969–975. [Google Scholar] [CrossRef]
- Figueroa-Rosales, E.X.; Martínez-Juárez, J.; García-Díaz, E.; Hernández-Cruz, D.; Sabinas-Hernández, S.A.; Robles-Águila, M.J. Photoluminescent properties of hydroxyapatite and hydroxyapatite/multi-walled carbon nanotube composites. Crystals 2021, 11, 832. [Google Scholar] [CrossRef]
- Castle, A.B.; Gracia-Espino, E.; Nieto-Delgado, C.; Terrones, H.; Terrones, M.; Hussain, S. Hydroxyl-functionalized and N-doped multiwalled carbon nanotubes decorated with silver nanoparticles preserve cellular function. ACS Nano 2011, 5, 2458–2466. [Google Scholar] [CrossRef]
- Rabiei, M.; Palevicius, A.; Monshi, A.; Nasiri, S.; Vilkauskas, A.; Janusas, G. Comparing Methods for Calculating Nano Crystal Size of Natural Hydroxyapatite Using X-ray Diffraction. Nanomaterials 2020, 10, 1627. [Google Scholar] [CrossRef]
- Arul Xavier Stango, S.; Vijayalakshmi, U. Synthesis and characterization of hydroxyapatite/carboxylic acid functionalized MWCNTS composites and its triple layer coatings for biomedical applications. Ceram. Int. 2019, 45, 69–81. [Google Scholar] [CrossRef]
- Gates-Rector, S.; Blanton, T. The Powder Diffraction File: A quality materials characterization database. Powder Diffr. 2019, 34, 352–360. [Google Scholar] [CrossRef]
- Vani, R.; Girija, E.K.; Elayaraja, K.; Prakash Parthiban, S.; Kesavamoorthy, R.; Narayana Kalkura, S. Hydrothermal synthesis of porous triphasic hydroxyapatite/(α and β) tricalcium phosphate. J. Mater. Sci. Mater. Med. 2009, 20, 43–48. [Google Scholar] [CrossRef] [PubMed]
- Londoño-Restrepo, S.M.; Jeronimo-Cruz, R.; Millán-Malo, B.M.; Rivera-Muñoz, E.M.; Rodriguez-García, M.E. Effect of the nano crystal size on the X-ray diffraction patterns of biogenic hydroxyapatite from human, bovine, and porcine bones. Sci. Rep. 2019, 9, 5915. [Google Scholar] [CrossRef] [PubMed]
- Yan, L.; Li, Y.; Deng, Z.-X.; Zhuang, J.; Sun, X. Surfactant-assisted hydrothermal synthesis of hydroxyapatite nanorods. Int. J. Inorg. Mater. 2001, 3, 633–637. [Google Scholar] [CrossRef]
- Dos Santos Silva, D.; Villegas, A.E.C.; Bonfim, R.D.P.F.; Salim, V.M.M.; De Resende, N.S. Iron-substituted hydroxyapatite as a potential photocatalyst for selective reduction of CO2 with H2. J. CO2 Util. 2022, 63, 102102. [Google Scholar] [CrossRef]
- Bertinetti, L.; Drouet, C.; Combes, C.; Rey, C.; Tampieri, A.; Coluccia, S.; Martra, G. Surface Characteristics of Nanocrystalline Apatites: Effect of Mg Surface Enrichment on Morphology, Surface Hydration Species, and Cationic Environments. Langmuir 2009, 25, 5647–5654. [Google Scholar] [CrossRef]
- Hua Cheng, Z.; Yasukawa, A.; Kandori, K.; Ishikawa, T. FTIR study on incorporation of CO2 into calcium hydroxyapatite. J. Chem. Soc. Faraday Trans. 1998, 94, 1501–1505. [Google Scholar] [CrossRef]
- Marković, S.; Veselinović, L.; Lukić, M.J.; Karanović, L.; Bračko, I.; Ignjatović, N.; Uskoković, D. Synthetical bone-like and biological hydroxyapatites: A comparative study of crystal structure and morphology. Biomed. Mater. 2011, 6, 045005. [Google Scholar] [CrossRef]
- Markovic, M.; Fowler, B.O.; Tung, M.S. Preparation and comprehensive characterization of a calcium hydroxyapatite reference material. J. Res. Natl. Inst. Stand. Technol. 2004, 109, 553–568. [Google Scholar] [CrossRef]
- Zhang, C.; Yang, J.; Quan, Z.; Yang, P.; Li, C.; Hou, Z.; Lin, J. Hydroxyapatite Nano- and Microcrystals with Multiform Morphologies: Controllable Synthesis and Luminescence Properties. Cryst. Growth Des. 2009, 9, 2725–2733. [Google Scholar] [CrossRef]
- Bystrov, V.S.; Piccirillo, C.; Tobaldi, D.M.; Castro, P.M.L.; Coutinho, J.; Kopyl, S.; Pullar, R.C. Oxygen vacancies, the optical band gap (Eg) and photocatalysis of hydroxyapatite: Comparing modelling with measured data. Appl. Catal. B Environ. 2016, 196, 100–107. [Google Scholar] [CrossRef]
- Huerta, V.J.; Fernández, P.; Gómez, V.; Graeve, O.A.; Herrera, M. Defect-related luminescence properties of hydroxyapatite nanobelts. Appl. Mater. Today 2020, 21, 100822. [Google Scholar] [CrossRef]
- Bystrov, V.S.; Coutinho, J.; Bystrova, A.V.; Dekhtyar, Y.D.; Pullar, R.C.; Poronin, A.; Palcevskis, E.; Dindune, A.; Alkan, B.; Durucan, C.; et al. Computational study of hydroxyapatite structures, properties and defects. J. Phys. D. Appl. Phys. 2015, 48, 195302. [Google Scholar] [CrossRef]
- Bystrova, A.V.; Dekhtyar, Y.D.; Popov, A.I.; Bystrov, V.S. Modeling and synchrotron data analysis of modified hydroxyapatite structure. Math. Biol. Bioinform. 2014, 9, 171–182. [Google Scholar] [CrossRef]
- Sun, W.; Huang, Z.; Zhang, L.; Zhu, J. Luminescence from multi-walled carbon nanotubes and the Eu(III)/multi-walled carbon nanotube composite. Carbon 2003, 41, 1685–1687. [Google Scholar] [CrossRef]
- Polynskaya, Y.G.; Matsokin, N.A.; Sinitsa, A.S.; Knizhnik, A.A.; Potapkin, B.V. First-principles investigation of interaction between the atomic oxygen species and carbon nanostructures. Carbon Trends 2022, 9, 100201. [Google Scholar] [CrossRef]
- Koyama, T.; Miyata, Y.; Asaka, K.; Shinohara, H.; Saito, Y.; Nakamura, A. Ultrafast energy transfer of one-dimensional excitons between carbon nanotubes: A femtosecond time-resolved luminescence study. Phys. Chem. Chem. Phys. 2012, 14, 1070–1084. [Google Scholar] [CrossRef]


| Sample | Crystallite Size (nm) | |
|---|---|---|
| HAp250 | 41.2 | |
| HAp250-15 | 49.4 | |
| HAp250-25 | 31.1 | |
| HAp250-35 | 39.5 | |
| HAp400 | 39.2 | |
| HAp400-15 | 46.2 | |
| HAp400-25 | 31.3 | |
| HAp400-35 | 39.2 |
| Band Position (cm−1) | Assignment | Ref. | |
|---|---|---|---|
| First Measurement | Second Measurement | ||
| --- | 3740 | Adsorbed water | [36] |
| --- | 3680–3640 | P-OH vibration | [36,37] |
| 3566 | 3566 | O−H stretching | [37,38] |
| --- | 2750–2650 | O-H vibration | [36] |
| --- | 2400–2250 | CO2 free | [35] |
| 1650 ± 10 | 1660 ± 10 | Adsorbed water and unstable CO2 specie | [37,38] |
| 1454 | 1457 | CO32− replacing PO43− | [37,38] |
| 1413 | 1414 | CO32− replacing OH− | [37,38] |
| 1094 | 1094 | v3 PO43− | [37,38] |
| 1021 | 1021 | v3 PO43− | [37,38] |
| 962 | 961 | v1 PO43− | [37,38] |
| 877 | 875 | CO32− substitutions type A and B | [37,38] |
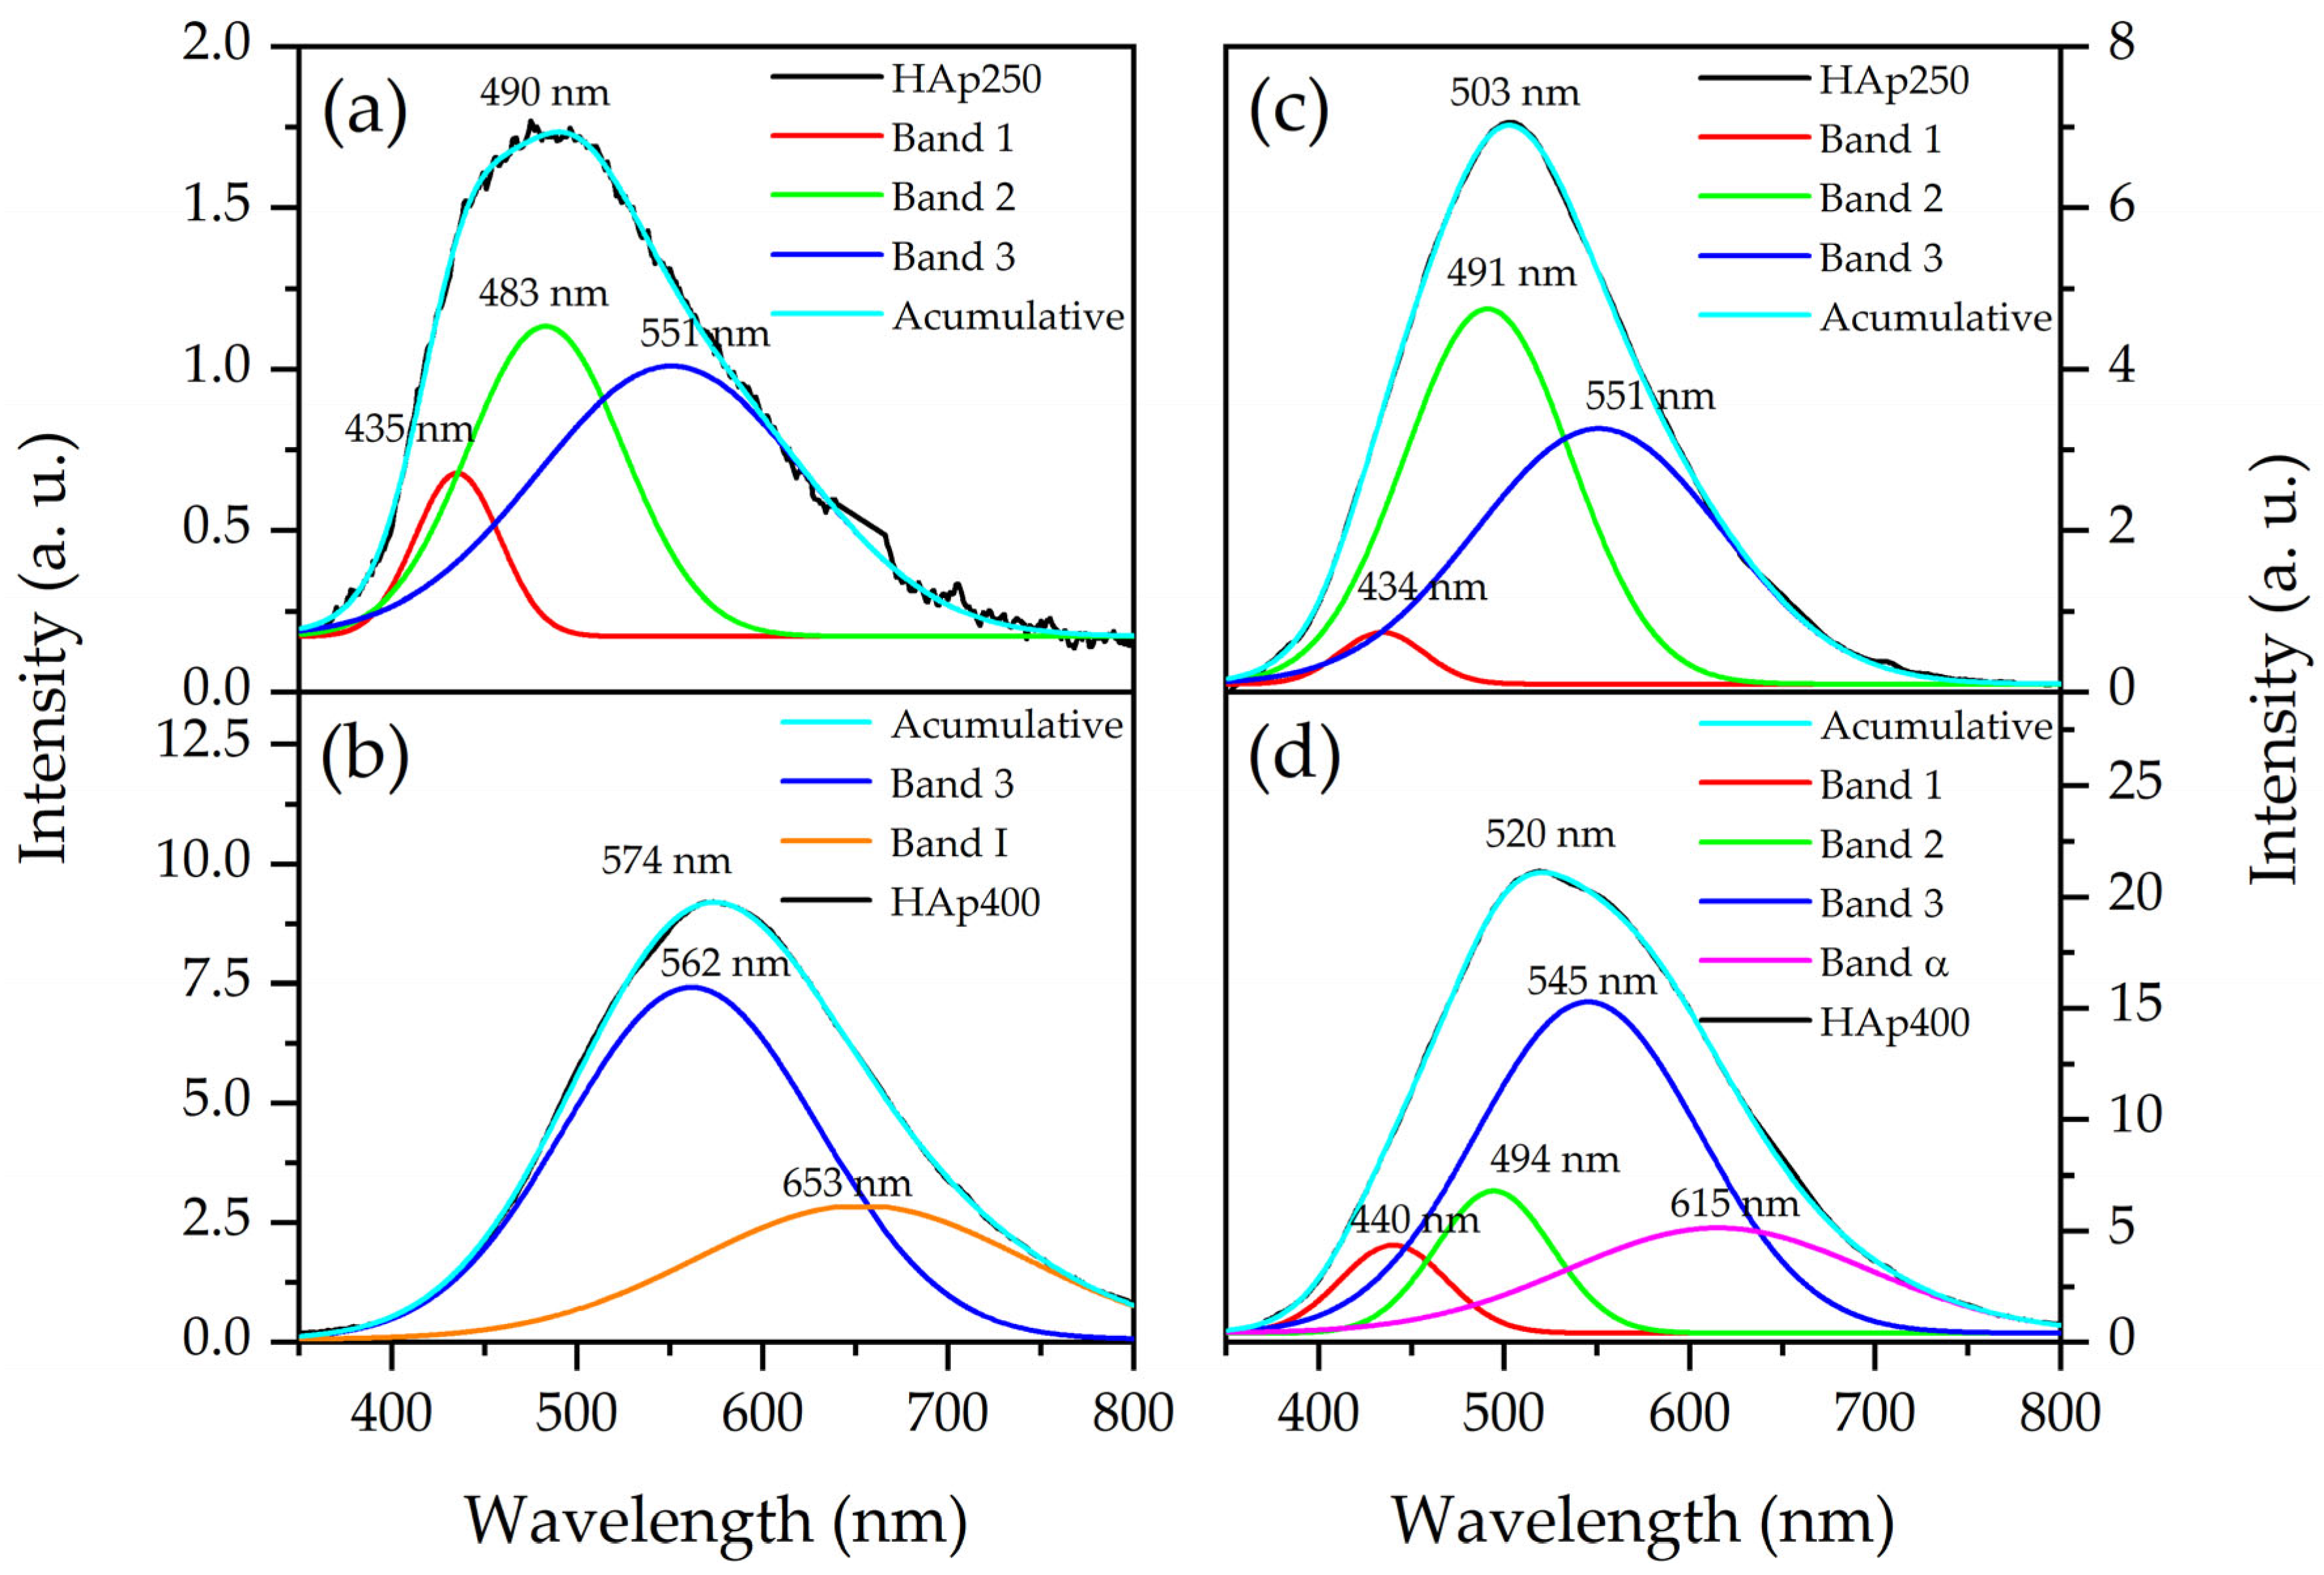
| Measure | Sample | Band | Wavelength (nm) | Associate to | Ref. |
|---|---|---|---|---|---|
| First | HAp250 | 1 | 435 | Oxygen vacancies from OH− ion and OH− ion vacancies | [41,42] |
| 2 | 483 | OH− and Ca2+ ion vacancies | [41,42] | ||
| 3 | 551 | Oxygen vacancies from PO43− ion | [41,42] | ||
| HAp400 | 3 | 562 | Oxygen vacancies from PO43− ion | [41,42] | |
| I | 653 | OH− ion vacancies | [41,42] | ||
| Second | HAp250 | 1 | 434 | Oxygen vacancies from OH− ion and OH− ion vacancies | [41,42] |
| 2 | 491 | OH− and Ca2+ ion vacancies | [41,42] | ||
| 3 | 551 | Oxygen vacancies from PO43− ion | [41,42] | ||
| HAp400 | 1 | 440 | Oxygen vacancies from OH− ion and OH− ion vacancies | [41,42] | |
| 2 | 494 | OH− and Ca2+ ion vacancies | [41,42] | ||
| 3 | 545 | Oxygen vacancies from PO43− ion | [41,42] | ||
| α | 615 | Oxygen vacancies from PO43− ion | [41,42] |
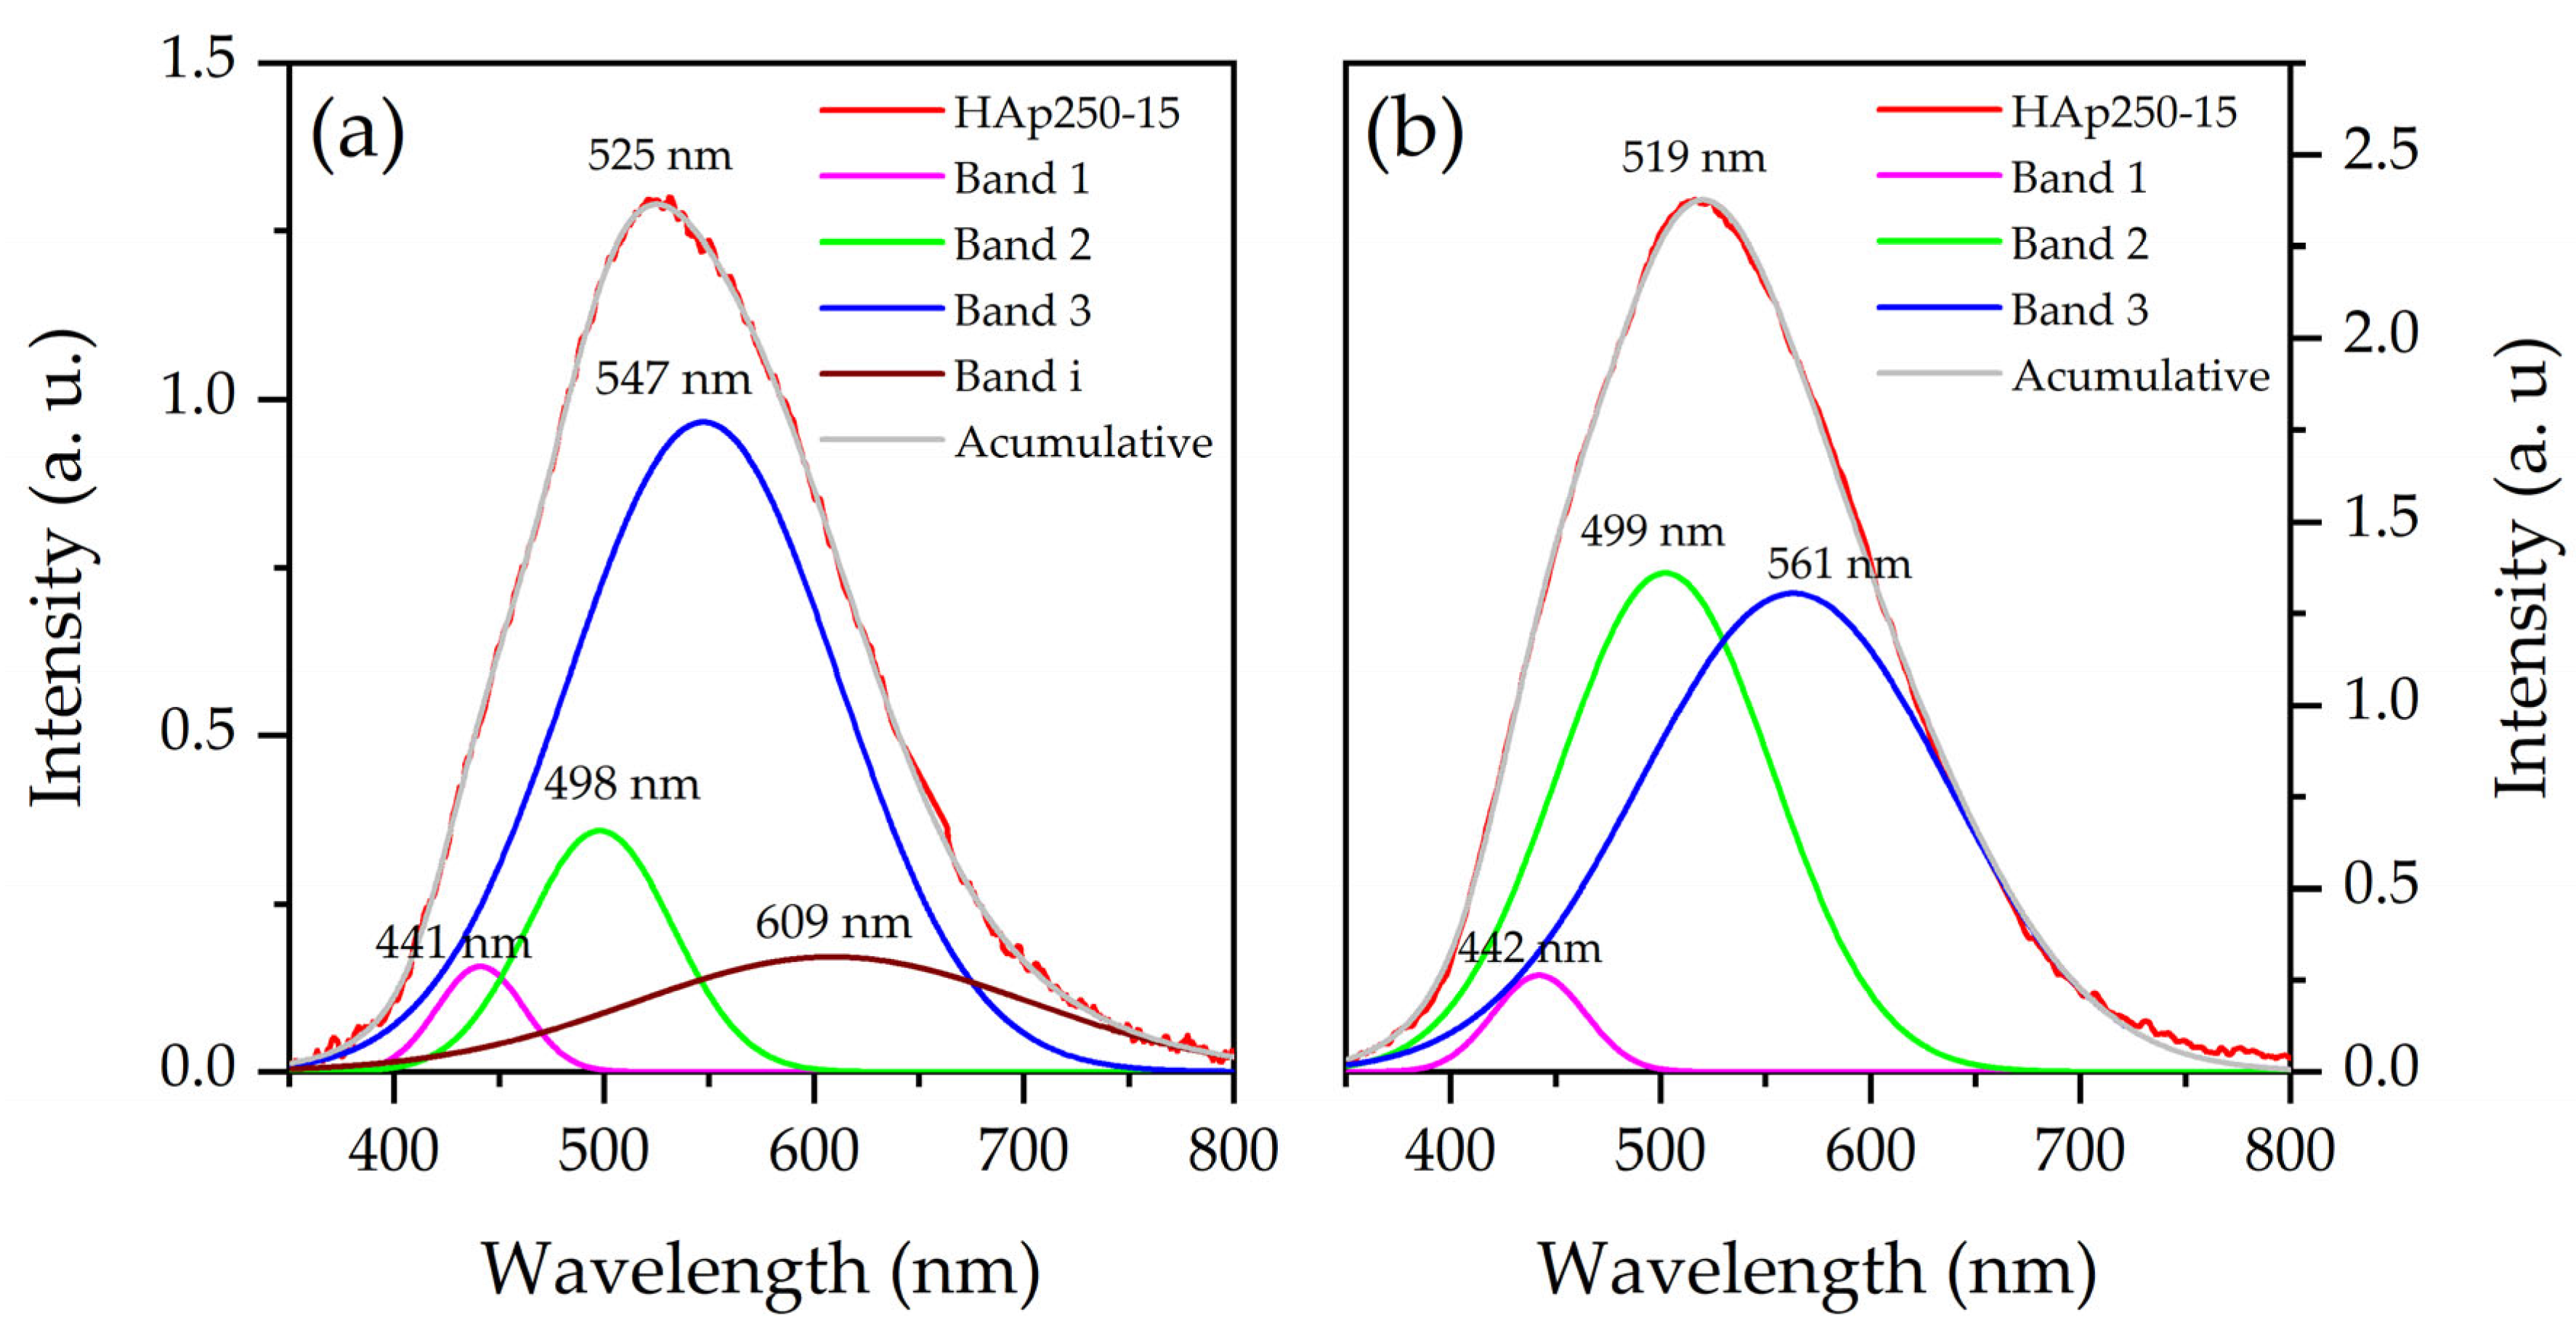
| Measure | Sample | Band | Wavelength (nm) | Associate with | Ref. |
|---|---|---|---|---|---|
| First | HAp250-15 HAp250-25 HAp250-35 | 1 | 443 ± 1 | Oxygen vacancies from OH− ion and OH− ion vacancies | [41,42] |
| 2 | 499 ± 2 | Oxygen vacancies from OH− ion and Ca2+ vacancies | [41,42] | ||
| 3 | 551 ± 4 | Oxygen vacancies from PO43− ion | [41,42] | ||
| i | 615 ± 8 | Exciton from carbon nanotubes, or OH− ion vacancies | [41,42,47] | ||
| Second | HAp250-15 HAp250-25 HAp250-35 | 1 | 442 | Oxygen vacancies from OH− ion and OH− ion vacancies | [41,42] |
| 2 | 499 | Oxygen vacancies from OH− ion and Ca2+ vacancies | [41,42] | ||
| 3 | 561 | Oxygen vacancies from PO43− ion | [41,42] |
Disclaimer/Publisher’s Note: The statements, opinions and data contained in all publications are solely those of the individual author(s) and contributor(s) and not of MDPI and/or the editor(s). MDPI and/or the editor(s) disclaim responsibility for any injury to people or property resulting from any ideas, methods, instructions or products referred to in the content. |
© 2023 by the authors. Licensee MDPI, Basel, Switzerland. This article is an open access article distributed under the terms and conditions of the Creative Commons Attribution (CC BY) license (https://creativecommons.org/licenses/by/4.0/).
Share and Cite
Figueroa-Rosales, E.X.; Hernández-Cruz, D.; Robles-Águila, M.J.; Rodriguez-Garcia, M.E.; Martínez-Juárez, J. Stability of the Photoluminescent Response on Hydroxyapatite/Multi-Walled Carbon Nanotube Composites. Photonics 2023, 10, 919. https://doi.org/10.3390/photonics10080919
Figueroa-Rosales EX, Hernández-Cruz D, Robles-Águila MJ, Rodriguez-Garcia ME, Martínez-Juárez J. Stability of the Photoluminescent Response on Hydroxyapatite/Multi-Walled Carbon Nanotube Composites. Photonics. 2023; 10(8):919. https://doi.org/10.3390/photonics10080919
Chicago/Turabian StyleFigueroa-Rosales, Edna X., Daniel Hernández-Cruz, María J. Robles-Águila, Mario E. Rodriguez-Garcia, and Javier Martínez-Juárez. 2023. "Stability of the Photoluminescent Response on Hydroxyapatite/Multi-Walled Carbon Nanotube Composites" Photonics 10, no. 8: 919. https://doi.org/10.3390/photonics10080919
APA StyleFigueroa-Rosales, E. X., Hernández-Cruz, D., Robles-Águila, M. J., Rodriguez-Garcia, M. E., & Martínez-Juárez, J. (2023). Stability of the Photoluminescent Response on Hydroxyapatite/Multi-Walled Carbon Nanotube Composites. Photonics, 10(8), 919. https://doi.org/10.3390/photonics10080919