Article

A Visible Light 3D Positioning System for Underground Mines Based on Convolutional Neural Network Combining Inception Module and Attention Mechanism

1
College of Information Engineering, Inner Mongolia University of Science and Technology, Baotou 014010, China
2
Engineering Training Center (Innovation and Entrepreneurship Education College), Inner Mongolia University of Science and Technology, Baotou 014010, China
*
Author to whom correspondence should be addressed.
Photonics 2023, 10(8), 918; https://doi.org/10.3390/photonics10080918
Submission received: 6 July 2023 / Revised: 31 July 2023 / Accepted: 7 August 2023 / Published: 9 August 2023
(This article belongs to the Special Issue Advances in Visible Light Communication)

Abstract

:
To improve the accuracy of personnel positioning in underground coal mines, in this paper, we propose a convolutional neural network (CNN) three-dimensional (3D) visible light positioning (VLP) system based on the Inception-v2 module and efficient channel attention mechanism. The system consists of two LEDs and four photodetectors (PDs), with the four PDs on the miner’s helmet. Considering the height fluctuation of PD and the impact of wall reflection on the received light power, we adopt the Inception module to perform a multi-scale extraction of the features of the received light power, thus solving the limitation of the single-scale convolution kernel on the positioning accuracy. In order to focus on the information that is more critical to positioning among the numerous input features, giving different features of the optical power data corresponding weights, we use an efficient channel attention mechanism to make the positioning model more accurate. The simulation results show that the average positioning error of the system was 1.63 cm in the space of 6 m × 3 m × 3.6 m when both the line-of-sight (LOS) and non-line-of-sight (NLOS) links were considered, with 90% of the localization errors within 4.55 cm. During the experimental stage, the average positioning error was 11.12 cm, with 90% of the positioning errors within 28.75 cm. These show that the system could achieve centimeter-level positioning accuracy and meet the requirements for underground personnel positioning in coal mines.

1. Introduction

With the continuous complexity of the coal mine working environment and the improvement of safety requirements, the research on underground positioning technology in coal mines has become an important field for coal mine safety management and production efficiency improvement. During underground operations, inaccurate personnel positioning can lead to the mislocation or misjudgment of a miner’s position, thereby increasing the risk of accidents. For example, suppose the positioning system misjudges a miner’s location. In that case, it may cause the worker to mistakenly enter a hazardous area or approach dangerous equipment, increasing the likelihood of experiencing accidents and incidents. Moreover, accurate personnel localization is critical for the emergency rescue of a coal fire, landslides, or other accidents. Inaccurate positioning can impede rescuers from quickly and accurately locating trapped personnel, resulting in a delayed emergency response time and intensifying the difficulty and risk of rescue efforts. Accurate personnel location can help to monitor and manage miners’ working status and duration. Ensuring the precise positioning of underground coal mine personnel can improve the management of their entry and exit, thereby reducing the safety risk and management difficulty in coal mines. Therefore, realizing the accurate positioning of underground personnel in coal mines is essential to ensure the safe production and efficient operation of coal mines. Various positioning methods have been proposed to address the underground personnel positioning challenge, including Wi-Fi positioning, Bluetooth positioning, radio frequency identification (RFID), ultra-wideband (UWB) positioning, and others [1,2,3,4]. Wi-Fi positioning technology has disadvantages such as complex hotspot acquisition and high power consumption; Bluetooth positioning technology usually relies on Bluetooth hotspots deployed in space, which requires precise arrangement and adjustment and increases the complexity of system deployment and maintenance; RFID technology was first applied to personnel positioning under the mines, but it has disadvantages such as a small transmission range and low positioning accuracy; and UWB technology has a higher positioning accuracy, but due to the broadband characteristics of UWB, it may produce interference with other wireless signals, affecting the positioning accuracy and reliability. Moreover, realizing high-precision UWB positioning requires specialized hardware equipment, which increases the cost and deployment difficulties. Compared with these wireless technologies, visible light communication (VLC) utilizes the visible light spectrum for data transmission and communication and has advantages, including unrestricted operation within the wireless spectrum, a high bandwidth capacity, strong anti-interference capabilities, and enhanced security. Moreover, the prevalence of lighting devices within underground coal mine environments facilitates the deployment of visible light positioning (VLP). By leveraging existing lighting infrastructure, VLP presents a forward-looking solution to the challenge of locating personnel in underground coal mines.
According to the different receivers, VLP is usually divided into an imaging type [5] and a non-imaging type [6]. Imaging-based VLP employs a camera or image sensor to capture visible light signals, utilizing image processing and computer vision technology to determine the device’s position. The device’s location is determined by analyzing the captured image’s features, textures, or markers. However, this approach necessitates complex hardware, thus increasing the system’s overall complexity and cost. On the other hand, non-imaging VLP does not rely on image data directly but utilizes parameters that are extracted from the received visible light signal for localization. This method primarily relies on signal measurement and processing techniques, such as Time of Arrival (TOA), Time Difference of Arrival (TDOA), Angle of Arrival (AOA), and received signal strength (RSS) [7,8,9,10]. Among these techniques, the fingerprint localization method based on received signal strength has garnered extensive research attention due to its utilization of simple hardware equipment and its high localization accuracy.
Machine learning and deep learning technologies have been widely used in the mining industry, bringing many advantages to coal mine production and management. Jo et al. [11] proposed an IoT technology prediction system for air quality pollutants in underground mines. The system collects real-time air quality data using various sensors deployed in underground mines and employs machine learning algorithms to analyze and predict the data. Wang et al. [12] summarized the advantages and challenges of applying machine learning and deep learning to classify microseismic events in mines, which provides reliable technical support for mine safety and geologic disaster prevention. Li et al. [13] proposed a hierarchical deep learning framework based on images used for coal and gangue detection. This framework employs deep learning algorithms and utilizes a hierarchical structure to solve the problem of coal and gangue differentiation in coal mines. These studies indicate that introducing machine learning and deep learning technology provides more intelligent and automated coal mine production and management solutions, thus effectively improving efficiency, safety, and sustainability. Therefore, combining deep learning and visible light positioning technology is feasible to accurately position people who are underground in coal mines. More and more researchers are also applying deep learning to visible light localization. By selecting suitable deep learning models and optimizing them for specific positioning tasks, researchers can improve the models’ learning and generalization abilities, thereby enhancing the positioning accuracy and opening up new possibilities.
Chen et al. [14] proposed a long short-term memory fully connected network (LSTM-FCN)-based localization algorithm for implementing a VLP system with a single LED and multiple photodetectors (PDs). Lin et al. [15] proposed a model replication technique utilizing a position cell model to generate additional position samples and augment the diversity of the training data. Wei et al. [16] developed a method employing a metaheuristic algorithm to optimize the initial weights and thresholds of the extreme learning machine (ELM), thereby improving localization accuracy. However, the use of an optimization-seeking algorithm adds complexity to the model. Zhang et al. [17] presented a 3D indoor visible light positioning system based on an artificial neural network with a hybrid phase difference of arrival (PDOA) and RSS approach, enhancing the system stability in light signal intensity variations and reducing the impact of modeling inaccuracies. However, the effect of reflection was not considered. Presently, most visible light positioning studies focus solely on 2D localization [18,19,20]. However, a reliable 3D localization method is crucial for locating people underground in mines. This is because the heights of the miners vary according to the job’s requirements, and height fluctuations can impact the positioning accuracy. Conventional 3D positioning methods typically require at least three LEDs for positioning [21,22]. These LEDs emit signals and communicate with a receiver to determine the target’s location. However, this method has several limitations. First, multiple LEDs need to be installed, increasing the complexity and cost of the system. Second, since the signals emitted by the LEDs are reflected on surfaces such as the walls in the mine, the traditional method ignores the effect of such reflections on the localization results. This can lead to an increase in localization errors, especially in complex underground mine environments. In addition, the PD’s tilt and the PD height’s fluctuation can also impact the positioning accuracy, which are factors that are often not adequately considered in conventional methods. Some existing 3D visible light positioning systems employ hybrid algorithms [23,24,25], increasing the system complexity. To address these challenges and enhance the accuracy and simplicity of underground mine localization, this paper proposes a convolutional neural network (CNN) 3D visible light positioning system based on the Inception-v2 module [26] and efficient channel attention (ECA) module [27]. In this study, two LEDs were utilized as emitters and four PDs were used as receivers, and the effects of the wall reflections and PDs’ tilts on localization were considered. Conventional convolutional neural networks often rely on stacking deeper convolutional layers to improve performance, which increases the model’s parameter count and the risk of overfitting. This paper employs the Inception module, enabling parallel operations of multiple convolutional and pooling layers with varying sizes. This approach yields multiple feature representations of the input and reduces the computational complexity. Additionally, the ECA module assigns weights to different channel features, extracting the most critical features and ultimately enhancing the localization accuracy.
Its simplicity and ease of implementation characterize the proposed algorithmic model in this paper. Simulation experiments have validated its efficacy in localizing personnel in underground mines. The rest of this paper is organized as follows: Section 2 elucidates the components of the visible light positioning model. Section 3 expounds the structure and principles of Inception-ECANet. 
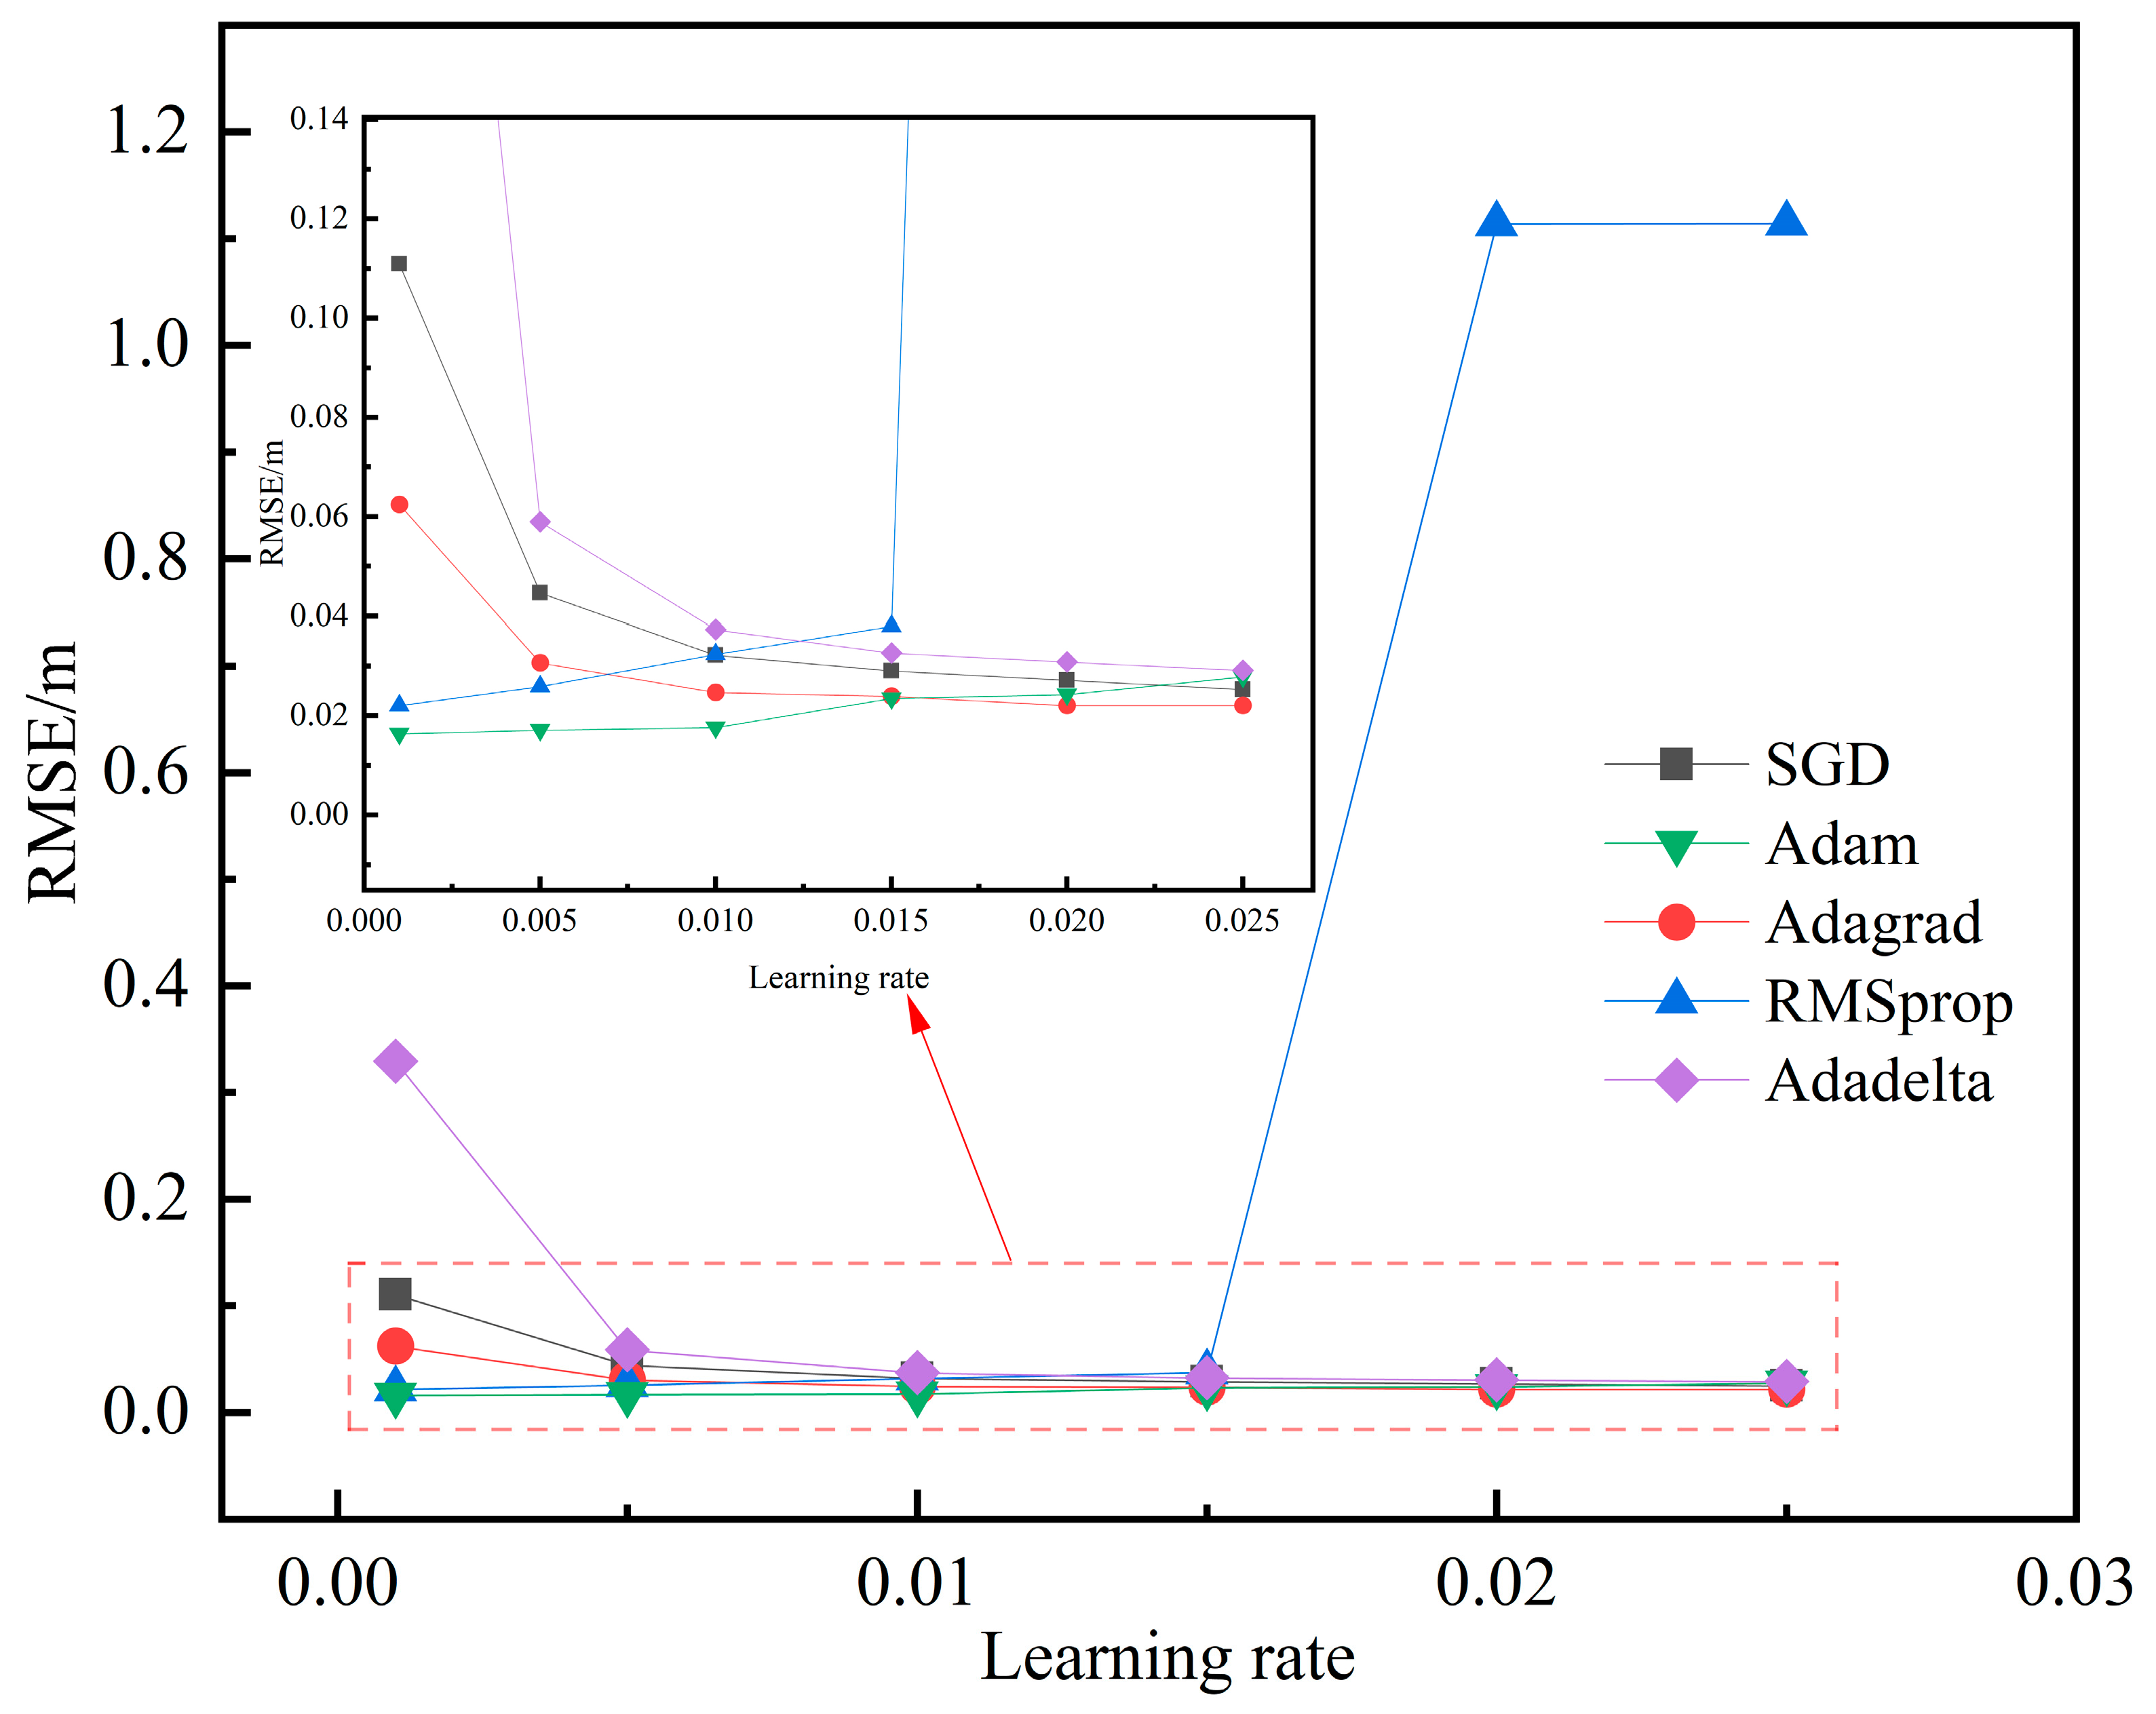
Section 4 explores the network parameters that influence localization. Section 5 presents the simulation and experimental results. Lastly, Section 6 provides a conclusion to the study.

2. Visible Light Positioning Model

2.1. System Model

The visible light positioning system and receiver model designed in this study are shown in Figure 1. In a space of 6 m × 3 m × 3.6 m, two LEDs are placed at the tunnel’s ceiling. These LEDs serve as both a source of illumination and a means to transmit positioning signals. Within the positioning space, the LEDs emit signals of identical frequency. The PDs on the miner’s helmet acts as a receiver to receive positioning signals. The receiver is designed as a symmetric multi-PD model to adapt to various positioning scenarios effectively. The central PD 0 is positioned at the receiver’s midpoint, while the three inclined PD i i = 1 , 2 , 3 are symmetrically arranged around PD 0 . The positional relationship between the horizontal PD 0 x P , y P , z P and the tilted PD i x P i , y P i , z P i is [28]
x P i = x P + l cos θ cos α i y P i = y P + l cos θ cos α i z P i = z P + l sin θ ,
where l is the length of the line segment from PD 0 to PD i , which is parallel to the inclined plane; θ is the elevation angle of PD i ; and α i is the angle between the projection of the line connecting PD 0 and PD i in the xoy plane and the positive direction of the x-axis.

2.2. Channel Model

Indoor visible light communication systems can be categorized into line-of-sight (LOS) propagation and non-line-of-sight (NLOS) propagation. For the LOS link model, the signal propagates directly from the source to the receiver without interference from obstacles. Assuming that the LED light source radiation adheres to the Lambert distribution, the channel gain of the LOS link model is
H LOS ( 0 ) = A r ( m + 1 ) 2 π d 2 cos m ( ϕ ) T s ( ψ ) g ( ψ ) cos ( ψ ) , 0 ψ ψ c 0 , else ,
where A r is the light detection area of the PD receiver; d is the linear distance between the LED lamp and the PD receiver; ϕ is the LED lamp emission angle; T s ψ is the transmittance of the light filter; g ψ is the optical concentrator gain; ψ c is the field of view of the receiver; and m is the number of Lambert emission levels, which correlates with the LED’s half power angle ϕ 1 / 2 , and the relationship is
m = ln 2 ln ( cos ϕ 1 / 2 ) ,
The gain of the optical concentrator can be expressed as
g ( ψ ) = n 2 sin 2 ψ c , 0 ψ ψ c 0             , ψ > ψ c ,
where n is the refractive index of the optical concentrator. The received power of the receiver can be expressed as
P r = P t × H LOS ( 0 ) ,
where P t is the emitted power of the LED. Most of the investigated positioning methods assume that the PD is positioned horizontally and that the LED lamp’s emission and incidence angles are equal. However, during the actual positioning process, the receiver may experience tilting due to the miner’s body movement. Consequently, the emission angle ϕ of the LED lamp and the incidence angle ψ of the tilted PD undergo changes and can be expressed as follows:
ϕ = cos 1 h d ,
ψ = cos 1 v tilt n tilt v tilt n tilt ,
where h is the vertical distance from the LED to the plane where the PD above the miner’s head is located, v tilt is the vector from the LED to the PD, and n tilt is the normal vector of the inclined plane. Let the coordinates of the LED be x txd , y txd , z txd , and let the coordinates of the PD be x rxd , y rxd , z rxd ; then, the direction vector is v tilt = ( x txd x rxd , y txd y rxd , z txd z rxd ) . If the normal vector of the horizontal PD when it is vertically up is n = 0 , 0 , 1 , then according to the geometric relationship, the normal vector of the tilted PD is n tilt = cos ( α t ) sin ( θ t ) , sin ( α t ) sin ( θ t ) , cos ( θ t ) , where α t is the azimuth of the PD and θ t is the tilt angle of the PD.
In indoor localization scenarios, it is crucial to consider both the LOS links and the influence of the wall reflections. However, for the NLOS links, reflections beyond the first order have a minimal impact on the visible light positioning. As a result, this paper focuses solely on evaluating the impact of the primary reflection. To accomplish this, we divide the surface of each wall into q microelements, each with an area denoted as Δ A . The channel gain of the NLOS link can be expressed as [29]
H NLOS ( 1 ) = m + 1 2 π 2 i = 1 q A r ρ Δ A cos m ( ϕ i ) cos ( α i ) cos ( β i ) cos ( ψ i ) d T i 2 d R i 2 , 0 ψ i ψ c 0   , else ,
where q is the total number of reflective elements; p is the reflection coefficient; Δ A is the area of reflective elements; d T i is the distance from the LED to the i-th reflective element; d R i is the distance from the i-th reflective element to the receiver; ϕ i is the emission angle of the i-th reflection; α i and β i are the horizontal angle between the i-th reflective point and the LED line and the horizontal angle between the i-th reflective point and the receiver line, respectively; and ψ i is the angle of incidence of the i-th reflection. In indoor visible light positioning, the received power P r of the PD can be expressed as follows when considering the light transmission through the LOS link and NLOS link:
P r = P t H LOS 0 + H NLOS 0 .

3. Inception-ECANet Model

3.1. Convolutional Neural Network

Inspired by biological vision systems, convolutional neural networks combine multi-layer convolution and pooling operations with a full connection layer to extract the features and classify the input data. The convolutional layer filters the input through convolutional operations and extracts the local features of the input data. The pooling layers are used to downsample the data, reducing the parameter count while maintaining spatial invariance. The fully connected layer maps the high-level features to different output classes. In this study, the optical power data under investigation is one-dimensional. When applied to one-dimensional data, CNNs extract local and global features from the input sequence, capturing the pattern and association information. However, one-dimensional CNNs also possess limitations. The fixed perceptual field sizes of 1D convolutional operations prevent dynamic adjustment according to the sequence length, resulting in constraints when handling long-term dependencies and contextual information. Longer sequence inputs may necessitate larger convolutional kernels and deeper networks to capture more comprehensive feature representations. This parameter-sharing property of 1D convolutional layers increases the model’s parameter count. To address these challenges, this paper introduces the Inception structure and combines it with the ECA mechanism, thereby enhancing the representation capability of the improved model.

3.2. Inception Structure

The structure of Inception-v2 is shown in Figure 2. Unlike the traditional sequential connection of convolutional and pooling layers, the Inception-v2 module employs a distinct approach [26]. It simultaneously conducts convolution and pooling operations of varying sizes, such as 1 × 1, 3 × 3, and 5 × 5, enabling the network model to capture both global information (through 3 × 3 convolution) and local information (through 1 × 1 convolution). By utilizing parallel convolutional layers, the Inception-v2 module performs feature extraction on the input data, operating on the convolutional kernels of different scales and combining their outputs. This approach facilitates the extraction of information regarding the received optical power at multiple scales in the time domain, addressing the limitation of localization accuracy imposed by single-scale convolution kernels.

3.3. ECA Mechanism

After the Inception module processed the input data, the positioning model obtained some optical power information with different characteristic dimensions. In order to further obtain more and higher-dimensional feature information and give more weight to the more important features, attention mechanisms need to be used. The attention mechanism is a common technique in deep learning that enhances the model’s focus on the input and extracts crucial feature information. This mechanism emulates the attention mechanism that is observed in the human visual system, enabling the model to automatically select and weigh the relevant parts of the input. This study utilizes the ECA mechanism, shown in Figure 3, to extract the important weights for each channel in the input feature map by adaptively weighting the channel dimensions [27]. Incorporating this mechanism aids in reinforcing the representation of essential features and improving the model’s attention toward key features, thereby enhancing its overall performance. With the ECA mechanism, it is possible to comprehensively capture the optical power features from the input and utilize them more effectively, facilitating more accurate learning and inference by the model.
The ECA module, an ultra-lightweight attention module, significantly enhances the performance of deep neural networks without increasing the model complexity. One of its key advantages over the traditional SENet [30] module lies in its improved local cross-channel interaction strategy. The ECA module achieves moderate cross-channel interaction by directly establishing connections between the channels and weights, reducing the model complexity while preserving performance. Despite introducing only a small number of parameters, the ECA module yields substantial performance improvements. Additionally, the ECA module employs an adaptive method to determine the size of the one-dimensional convolutional kernel. Specifically, it utilizes a fast 1D convolution of size K to facilitate local cross-channel interactions, with K representing the coverage of such interactions. To avoid a manual adjustment of K, the ECA module utilizes an adaptive approach to set its size proportionally to the channel dimension, generating attention weights as outlined in Algorithm 1.
Algorithm 1. The ECA module generates attention-weighting processes.
Input: feature map x of dimension H × W × C,
1 Define t = int(abs((log(C,2) + b)/gamma)), (b = 1, gamma = 2)
2 Set the size of the adaptive convolution kernel k,
   k = t if t % 2 else t + 1
3 Global average pooling of the input feature map x,
   y = tf.keras.layers.GlobalAveragePooling1D(x)
4 A 1-dimensional convolution operation with a convolution kernel of size k is performed on the output y,
   Conv = tf.keras.layers.Conv1D(1,kernel size = k, padding= ‘same’)
5 Sigmoid activation function is used to map the weights between (0,1),
   y = tf.sigmoid(y)
6 Weighting the attention weights to the original input to obtain the final output,
   y = Multiply()([x, y])
Output: 1×W×C channel weighted feature y.

3.4. Inception-ECANet Network Framework

We propose a novel combined model called the Inception-ECANet for visible light 3D positioning. The overall architecture of the model is shown in Figure 4. The model takes one-dimensional optical power data as the input and processes them through a convolutional layer with a large convolutional kernel. This layer effectively extracts valuable information from the original optical power data. After the initial convolutional block processing, the model obtains information across different feature dimensions. To further capture the multi-scale and comprehensive features, the Inception structure is incorporated, combined with the ECA mechanism, which allows for the appropriate weighting of the different channel features. Subsequently, a maximum pooling layer is added to reduce the computational burden and parameter count, and to eliminate redundant information, thereby enhancing the model’s computational efficiency and generalization capability. A flattening layer is introduced after the pooling layer to establish connectivity with the neurons in the fully connected layer. Finally, the output layer produces three coordinate values as the model’s output.

4. Positioning Process

4.1. Building a Fingerprint Database

The miner will move randomly during work, and the height of the PD above the miner’s head varies. In this study, we set the maximum height of the PD to 1.8 m. Two LEDs are chosen as the radiation light sources, positioned at different locations above the miner’s head. The coordinates of the LEDs are denoted as L1 (2, 1.5, and 3.6) and L2 (4, 1.5, and 3.6), respectively. To achieve the accurate positioning of the miner, the positioning process is divided into an offline phase and an online phase. In the offline phase, the positioning space of 6 m × 3 m × 1.8 m is divided into smaller spaces of 0.2 m × 0.2 m × 0.2 m. For each small space, the center point of the top square area is selected as the reference point, and four PDs are used at each reference point to receive the signal emitted by the LED light source. A fingerprint database is constructed by recording each reference point’s optical power values and their corresponding location coordinates. The fingerprint data of the i-th sampling point, denoted as R i , can be expressed as
R i = P i j , P i j , P i j , P i j , x i , y i , z i
where P i j is the optical power received by the j-th PD at the i-th reference point, and x i , y i , z i are the 3D location coordinates of the i-th reference point. Thus, the complete fingerprint database can be expressed as R db = R 1 , R 2 , R 3   ,   , R N T , and N is the number of reference points.
During the online localization phase, the received optical power values from the PD are utilized to predict the real-time position coordinates of the miners. To evaluate the effectiveness of the localization system, the localization space was further partitioned into smaller units measuring 0.25 m × 0.25 m × 0.25 m. The data collected from these reference points served as the testing set. Through the testing set evaluation, we could objectively assess the performance and accuracy of the positioning system.

4.2. Inception-ECANet Parameter Selection

During the design of the Inception-ECANet model, numerous key parameters require optimization, such as the number of convolutional layers, the size and quantity of convolutional kernels, the learning rate, the choice of the optimizer, the number of iterations, the batch size, and the selection of activation functions. These parameters significantly affect the overall accuracy and computational efficiency of the network. As a result, selecting the appropriate parameter configuration meticulously is vital for constructing the localization model. The following sections will compare and analyze various hyperparameter values to identify the optimal parameter combination.
The choice of the batch size significantly affects the accuracy of the localization model. In this study, the compared batch sizes were 16, 32, 64, 128, and 256, and the results are shown in Table 1. From Table 1, one can see that using a larger batch size enables a better utilization of parallel computing, resulting in faster training. However, this may lead to instability in the parameter updates and increase the likelihood of the model converging to local optima. On the other hand, selecting a smaller batch size introduces more noise during training, as each parameter update is based on a smaller number of samples. This leads to slower training and requires more iterations to achieve the same performance level. Considering the available computational resources and training effects, we chose a batch size of 128 to train the model in this study.
The number of convolutional kernels in the Inception module significantly influences the model’s complexity and representational power. Choosing a smaller number of convolutional kernels results in a more simple and abstract feature representation. On the other hand, a larger number of convolutional kernels enhances the model’s ability to transform features, leading to a richer and more complex representation. However, excessive convolutional kernels can lead to model overfitting and slower training. Therefore, when designing the Inception module, a trade-off must be made between the localization accuracy and the model complexity when choosing the number of convolutional kernels. Based on this consideration and after repeated experimental comparisons, the model parameters used in this paper were chosen as shown in Table 2.
During model training, the input data consist of optical power data from various heights. To ensure training stability and improve the convergence speed, it is essential to normalize the original input data. The mean–variance normalization expression is as follows:
R r = R r μ σ ,
where R r is the normalized data, R r is the received optical power, and μ and σ are the mean and standard deviation of the sample data.
Several optimization algorithms, including stochastic gradient descent (SGD), Adagrad, RMSprop, Adam, and Adadelta, were compared by adjusting the learning rate to determine the most suitable one for the localization model. The impact of the different optimization algorithms on the root mean square error of the localization model at various learning rates is shown in Figure 5. Notably, the Adam optimization algorithm achieved the smallest root mean square error at a learning rate of 0.001. Therefore, we selected the Adam algorithm with a learning rate of 0.001 to train Inception-ECANet, which can improve the convergence speed and performance of the model, making it better suited for localization tasks.
To assess the performance of the Inception-ECANet model and improve the prediction accuracy, we incorporated a loss function as a learning criterion to guide the training process. The loss function plays a vital role in training and evaluating the localization model. For prediction problems, the mean square error (MSE) is a widely employed loss function. Reducing the mean square error facilitates the performance optimization of the positioning model, leading to an enhanced prediction accuracy. Its mathematical expression is
E MSE = 1 N i = 1 N x ^ i x i 2 + y ^ i y i 2 + z ^ i z i 2 ,
where N is the number of reference points, x ^ i , y ^ i , z ^ i are the predicted position coordinates of the i-th reference point of the positioning model, and x i , y i , z i are the real position coordinates of the first reference point.
Once the localization model is trained, it is essential to assess whether the model meets the localization accuracy requirements. To achieve this, the validation set is used to perform localization predictions on the trained model. The magnitude of the localization error is then analyzed using the root mean square error (RMSE), which offers a comprehensive measure of the prediction error by calculating the square root of the average error between the predicted and actual values. The mathematical expression of the RMSE is
E RMSE = 1 N i = 1 N x ^ i x i 2 + y ^ i y i 2 + z ^ i z i 2 .

5. Simulation and Experimental Analysis

5.1. Simulation Analysis

To assess the performance of the proposed Inception-ECANet localization method, we conducted modeling and simulation using the Python3.9 compiler. The Inception-ECANet was implemented in TensorFlow 2.10 and trained on an NVIDIA RTX 4090. During the training process, we utilized the mean square error as the loss function and employed the Adam optimization algorithm with an initial learning rate of 0.001. The model was trained for 1400 epochs, using a batch size of 128. For the localization space, measuring 6 m × 3 m × 1.8 m, we uniformly divided it into smaller spaces with side lengths of 0.2 m. Each small space’s center point in the top square area was selected as a reference point. The received optical power value and the position coordinates of these reference points were used as the training set data to train the Inception-ECANet model, thus establishing a prediction model for the visible light positioning method in mines. Subsequently, the localization space was further divided into small spaces with a side length of 0.25 m. The received optical power values and the coordinates from these points were utilized as the testing set data to evaluate the performance of the trained localization model. The simulation parameters are shown in Table 3.
The training and validation sets are selected to train and test the localization model, and the predicted 3D localization distribution of the model obtained is shown in Figure 6. In order to visually represent the localization error, the localization error distribution of the PD located at different heights is shown in Figure 7.
From Figure 6 and Figure 7, it is evident that the proposed positioning model exhibits exceptional performance in 3D space. With an average positioning error of only 1.63 cm and a maximum positioning error of 14.71 cm, the model achieves centimeter-level accuracy, meeting the precise requirements of mine positioning. Additionally, it was observed that the positioning model exhibits larger errors in the edge and corner regions. These errors can be attributed to the longer path that light must travel to reach these areas and the greater angular deviation from the photodetector. When the light enters the photodetector at a steeper angle, it fails to be fully captured, resulting in the attenuation of the light intensity and an increase in the localization error.
To investigate the impact of different submodules in Inception-ECANet on the localization accuracy, we conducted experiments, and the comparison results of the localization errors after incorporating various submodules are presented in Table 4.
As seen in Table 4, adding two submodules significantly enhances the localization accuracy of the positioning model. Regarding the individual submodules, the CNN + Inception-v2 module demonstrates a higher accuracy than the CNN + ECA module, indicating the superior effectiveness of the Inception-v2 module in improving the localization accuracy. The Inception-v2 module’s advantage lies in its utilization of a multi-scale convolutional kernel, which enables the extraction of more detailed and informative features. In contrast, the attention mechanism employs a single convolutional kernel, resulting in limited improvements in the localization accuracy. Furthermore, the combination of these two submodules shows more significant improvements in the localization accuracy compared to each submodule alone. Upon incorporating the Inception-v2 module and the ECA module, the average localization error is reduced by 27.35%, and the maximum localization error is reduced by 42.43%. These outcomes signify that the fusion of the Inception-v2 module and the ECA module enhances the network’s feature extraction capability, thereby improving the localization accuracy of the model.

5.2. Experimental Analysis

The proposed positioning model in this paper demonstrates favorable performance in the personnel positioning within underground coal mines under simulated conditions. However, it is essential to acknowledge the disparities between the actual application environment and the simulation conditions. To further validate the effectiveness of the proposed positioning model, we constructed a simulated experimental scenario with dimensions of 6 m × 3 m × 3.6 m, as shown in Figure 8. During the experiment, two LEDs with a 15 W emitting power served as the emitters. LED1 was positioned at coordinates (2, 1.5, and 3.6), while LED2 was located at (4, 1.5, and 3.6). The experimental space was enclosed with a black cloth to simulate real-world conditions, and four S1133 silicon photodiodes were utilized as the receiving terminals.
We used a stand to position the PD at various height positions to acquire data, simulating the receiver’s height variation during the miner’s work. During experiments, we uniformly divided the length and width of the positioning space with 0.2 m spacing and selected four typical heights (0 m, 0.6 m, 1.2 m, and 1.8 m) to collect data at the divided reference points. The collected data were then used as the training set to train the model. To validate the accuracy of the localization model, we further divided the localization space at a spacing of 0.25 m and used the collected data as the validation set. To reduce the impact of LED light fluctuations on the results, we performed ten acquisitions of optical power data at each reference point and used the average value as the input for the localization model.
After testing, the positioning model exhibited an average positioning error of 11.12 cm in 3D space, with a maximum positioning error of 59.54 cm. Furthermore, 90% of the positioning error fell within 28.75 cm. The cumulative distribution of the positioning error is shown in Figure 9.
To investigate the impact of height on the positioning accuracy, we compared the positioning errors at various heights, as detailed in Table 5. The results in Table 5 show that the receiver height significantly influences the positioning errors. This effect can be attributed to the increased light deficit area between the two light sources as the height increases, resulting in a more significant variability of optical power values across the receiving plane. This variability has implications for the regularity and similarity of received data, subsequently affecting the data fitting during network training and the accuracy of the predicted results on the validation set, thus leading to an increase in the localization error.
The proposed algorithm in this study was compared with several other localization methods, namely the Backpropagation Neural Network (BPNN), Recurrent Neural Network (RNN), long short-term memory network (LSTM), and CNN. The localization errors of these localization methods are shown in Table 6. The results clearly demonstrate that the algorithm proposed in this paper significantly enhances the localization accuracy. In comparison to the BPNN, the proposed algorithm reduced the average localization error by 33.35% and reduced the maximum localization error by 32.55%. Similarly, when compared with the RNN, the average localization error was reduced by 48.19%, and the maximum localization error decreased by 58.13%. In contrast, in comparison to the LSTM, the average localization error was reduced by 49.56%, and the maximum localization error decreased by 56.56%. Moreover, compared with the CNN, the proposed algorithm achieved a reduction of 13.96% in the average localization error and a reduction of 27.70% in the maximum localization error.
To provide a more intuitive demonstration of the localization effect, a comparison of the cumulative distribution of localization errors among the five algorithms is shown in Figure 10. It can be observed that 90% of the localization errors of the proposed localization method are less than 28.75 cm. In contrast, for the other four localization methods (BPNN, RNN, LSTM, and CNN), 90% of their localization errors are below 44.28 cm, 58.53 cm, 61.13 cm, and 34.28 cm, respectively. This comparison highlights that the proposed Inception-ECANet localization method exhibits significantly lower localization errors overall.

6. Conclusions

We proposed a convolutional neural network visible light 3D localization system for localizing underground coal mine personnel by combining the Inception-v2 and ECA modules. The system employed two LEDs as transmitting base stations and four PDs mounted on miners’ helmets as receivers. The optical power data acquired from the receivers are used to train the Inception-ECANet model, enabling a precise prediction of the position coordinates. The simulation results demonstrate that within a 6 m × 3 m × 3.6 m space, the Inception-ECANet localization method achieves an average error of 1.63cm and a maximum error of 14.71 cm, with 90% of the localization errors below 4.55 cm. An experimental validation further confirmed the effectiveness of the proposed method, achieving an average error of 11.12 cm and a maximum error of 59.54 cm within the same-sized localization space. It was worth noting that compared to four other positioning methods (BPNN, RNN, LSTM, and CNN), the proposed positioning method in this paper demonstrates outstanding performance. The research results show that when using this method, 90% of the positioning errors are within 28.75 cm, which is far superior to the other four positioning methods. Compared to the BPNN, the algorithm reduced the average positioning error by 33.35%. Similarly, compared to the RNN, the average positioning error was reduced by 48.19%. Compared to the LSTM, the average positioning error was reduced by 49.56%. Furthermore, the proposed algorithm reduced the average positioning error by 13.96% compared to the CNN. Through a comprehensive comparative analysis, it can be seen that the positioning method proposed in this paper exhibits lower positioning errors, which further validates the superiority and practicality of the proposed positioning algorithm in underground personnel positioning in coal mines.

Author Contributions

F.W., conceptualization, resources, supervision, and writing—review and editing. B.D., formal analysis, methodology, software, validation, data curation, and writing—original draft preparation. L.Q. and X.H., resources and project administration. All authors have read and agreed to the published version of the manuscript.

Funding

This research was funded by the National Natural Science Foundation of China (62161041), the Natural Science Foundation of Inner Mongolia (2022MS06012), the Inner Mongolia Key Technology Tackling Project (2021GG0104), and the Basic Research Funds for Universities directly under the Inner Mongolia Autonomous Region (2023XKJX010).

Institutional Review Board Statement

Not applicable.

Informed Consent Statement

Not applicable.

Data Availability Statement

Not applicable.

Conflicts of Interest

The authors declare no conflict of interest.

References

  1. Xue, J.; Zhang, J.; Gao, Z.; Xiao, W. Enhanced WiFi CSI Fingerprints for Device-Free Localization With Deep Learning Representations. IEEE Sens. J. 2023, 23, 2750–2759. [Google Scholar] [CrossRef]
  2. Kumari, S.; Siwach, V.; Singh, Y.; Barak, D.; Jain, R.; Rani, S. A Machine Learning Centered Approach for Uncovering Excavators’ Last Known Location Using Bluetooth and Underground WSN. Wirel. Commun. Mob. Comput. 2022, 2022, 9160031. [Google Scholar] [CrossRef]
  3. Cavur, M.; Demir, E. RSSI-based hybrid algorithm for real-time tracking in underground mining by using RFID technology. Phys. Commun. 2022, 55, 101863. [Google Scholar] [CrossRef]
  4. Yuan, X.; Bi, Y.; Hao, M.; Ji, Q.; Liu, Z.; Bao, J. Research on Location Estimation for Coal Tunnel Vehicle Based on Ultra-Wide Band Equipment. Energies 2022, 15, 8524. [Google Scholar] [CrossRef]
  5. Huynh, P.; Yoo, M. VLC-Based Positioning System for an Indoor Environment Using an Image Sensor and an Accelerometer Sensor. Sensors 2016, 16, 783. [Google Scholar] [CrossRef] [Green Version]
  6. Steendam, H.; Wang, T.Q.; Armstrong, J. Theoretical Lower Bound for Indoor Visible Light Positioning Using Received Signal Strength Measurements and an Aperture-Based Receiver. J. Light. Technol. 2017, 35, 309–319. [Google Scholar] [CrossRef] [Green Version]
  7. Zhao, H.X.; Wang, J.T. A Novel Three-Dimensional Algorithm Based on Practical Indoor Visible Light Positioning. IEEE Photonics J. 2019, 11, 6101308. [Google Scholar] [CrossRef]
  8. Du, P.; Zhang, S.; Chen, C.; Alphones, A.; Zhong, W.-D. Demonstration of a Low-Complexity Indoor Visible Light Positioning System Using an Enhanced TDOA Scheme. IEEE Photonics J. 2018, 10, 7905110. [Google Scholar] [CrossRef]
  9. De-La-Llana-Calvo, Á.; Lázaro-Galilea, J.; Gardel-Vicente, A.; Rodríguez-Navarro, D.; Bravo-Muñoz, I. Indoor positioning system based on LED lighting and PSD sensor. In Proceedings of the 2019 International Conference on Indoor Positioning and Indoor Navigation (IPIN), Pisa, Italy, 30 September–3 October 2019; pp. 1–8. [Google Scholar]
  10. Li, H.; Wang, J.; Zhang, X.; Wu, R. Indoor visible light positioning combined with ellipse-based ACO-OFDM. IET Commun. 2018, 12, 2181–2187. [Google Scholar] [CrossRef]
  11. Jo, B.; Khan, R.M.A. An Internet of Things System for Underground Mine Air Quality Pollutant Prediction Based on Azure Machine Learning. Sensors 2018, 18, 930. [Google Scholar] [CrossRef] [PubMed] [Green Version]
  12. Jinqiang, W.; Basnet, P.; Mahtab, S. Review of machine learning and deep learning application in mine microseismic event classification. Min. Miner. Depos. 2021, 15, 19–26. [Google Scholar] [CrossRef]
  13. Li, D.; Zhang, Z.; Xu, Z.; Xu, L.; Meng, G.; Li, Z.; Chen, S. An Image-Based Hierarchical Deep Learning Framework for Coal and Gangue Detection. IEEE Access 2019, 7, 184686–184699. [Google Scholar] [CrossRef]
  14. Chen, H.; Han, W.; Wang, J.; Lu, H.; Chen, D.; Jin, J.; Feng, L. High accuracy indoor visible light positioning using a long short term memory-fully connected network based algorithm. Opt. Express 2021, 29, 41109–41120. [Google Scholar] [CrossRef]
  15. Lin, D.-C.; Chow, C.-W.; Peng, C.-W.; Hung, T.-Y.; Chang, Y.-H.; Song, S.-H.; Lin, Y.-S.; Liu, Y.; Lin, K.-H. Positioning Unit Cell Model Duplication With Residual Concatenation Neural Network (RCNN) and Transfer Learning for Visible Light Positioning (VLP). J. Light. Technol. 2021, 39, 6366–6372. [Google Scholar] [CrossRef]
  16. Wei, F.; Wu, Y.; Xu, S.; Wang, X. Accurate visible light positioning technique using extreme learning machine and meta-heuristic algorithm. Opt. Commun. 2023, 532, 129245. [Google Scholar] [CrossRef]
  17. Zhang, S.; Du, P.; Chen, C.; Zhong, W.-D.; Alphones, A. Robust 3D Indoor VLP System Based on ANN Using Hybrid RSS/PDOA. IEEE Access 2019, 7, 47769–47780. [Google Scholar] [CrossRef]
  18. Song, S.H.; Lin, D.C.; Liu, Y.; Chow, C.W.; Chang, Y.H.; Lin, K.H.; Wang, Y.C.; Chen, Y.Y. Employing DIALux to relieve machine-learning training data collection when designing indoor positioning systems. Opt. Express 2021, 29, 16887–16892. [Google Scholar] [CrossRef]
  19. Liu, R.; Liang, Z.; Yang, K.; Li, W. Machine Learning Based Visible Light Indoor Positioning With Single-LED and Single Rotatable Photo Detector. IEEE Photonics J. 2022, 14, 7322511. [Google Scholar] [CrossRef]
  20. Bakar, A.H.A.; Glass, T.; Tee, H.Y.; Alam, F.; Legg, M. Accurate Visible Light Positioning Using Multiple-Photodiode Receiver and Machine Learning. IEEE Trans. Instrum. Meas. 2021, 70, 7500812. [Google Scholar] [CrossRef]
  21. Shao, S.; Khreishah, A.; Khalil, I. Enabling Real-Time Indoor Tracking of IoT Devices Through Visible Light Retroreflection. IEEE Trans. Mob. Comput. 2020, 19, 836–851. [Google Scholar] [CrossRef]
  22. Sato, T.; Shimada, S.; Murakami, H.; Watanabe, H.; Hashizume, H.; Sugimoto, M. ALiSA: A Visible-Light Positioning System Using the Ambient Light Sensor Assembly in a Smartphone. IEEE Sens. J. 2022, 22, 4989–5000. [Google Scholar] [CrossRef]
  23. Guan, W.; Huang, L.; Hussain, B.; Yue, C.P. Robust Robotic Localization Using Visible Light Positioning and Inertial Fusion. IEEE Sens. J. 2022, 22, 4882–4892. [Google Scholar] [CrossRef]
  24. Chaochuan, J.; Ting, Y.; Chuanjiang, W.; Mengli, S. High-Accuracy 3D Indoor Visible Light Positioning Method Based on the Improved Adaptive Cuckoo Search Algorithm. Arab. J. Sci. Eng. 2021, 47, 2479–2498. [Google Scholar] [CrossRef]
  25. Hsu, L.S.; Chow, C.W.; Liu, Y.; Yeh, C.H. 3D Visible Light-Based Indoor Positioning System Using Two-Stage Neural Network (TSNN) and Received Intensity Selective Enhancement (RISE) to Alleviate Light Non-Overlap Zones. Sensors 2022, 22, 8817. [Google Scholar] [CrossRef] [PubMed]
  26. Szegedy, C.; Vanhoucke, V.; Ioffe, S.; Shlens, J.; Wojna, Z. Rethinking the Inception Architecture for Computer Vision. In Proceedings of the 2016 IEEE Conference on Computer Vision and Pattern Recognition (CVPR), Las Vegas, NV, USA, 27–30 June 2016; IEEE: Piscataway, NJ, USA, 2016; pp. 2818–2826. [Google Scholar] [CrossRef] [Green Version]
  27. Wang, Q.; Wu, B.; Zhu, P.; Li, P.; Zuo, W.; Hu, Q. ECA-Net: Efficient Channel Attention for Deep Convolutional Neural Networks. In Proceedings of the 2020 IEEE/CVF Conference on Computer Vision and Pattern Recognition (CVPR), Seattle, WA, USA, 13–19 June 2020; pp. 11531–11539. [Google Scholar]
  28. Wang, K.; Liu, Y.; Hong, Z. RSS-based visible light positioning based on channel state information. Opt. Express 2022, 30, 5683–5699. [Google Scholar] [CrossRef] [PubMed]
  29. Yang, W.; Qin, L.; Hu, X.; Zhao, D. Indoor Visible-Light 3D Positioning System Based on GRU Neural Network. Photonics 2023, 10, 633. [Google Scholar] [CrossRef]
  30. Hu, J.; Shen, L.; Sun, G. Squeeze-and-Excitation Networks. In Proceedings of the 2018 IEEE/CVF Conference on Computer Vision and Pattern Recognition, Salt Lake City, UT, USA, 18–23 June 2018; pp. 7132–7141. [Google Scholar]
Figure 1. (a) Visible light positioning system model and (b) receiver model.
Photonics 10 00918 g001
Figure 2. Inception-v2 architecture.
Photonics 10 00918 g002
Figure 3. Efficient channel attention module.
Photonics 10 00918 g003
Figure 4. Inception-ECANet network architecture.
Photonics 10 00918 g004
Figure 5. The influence of various optimization algorithms on positioning performance at different learning rates.
Photonics 10 00918 g005
Figure 6. The model’s predictions of the 3D positioning distribution.
Photonics 10 00918 g006
Figure 7. Positioning error distribution of receiving plane at different heights. (a) Height = 0 m; (b) height = 0.25 m; (c) height = 0.5 m; (d) height = 0.75 m; (e) height = 1.0 m; (f) height = 1.25 m; (g) height = 1.5 m; (h) height = 1.75 m.
Photonics 10 00918 g007aPhotonics 10 00918 g007b
Figure 8. Simulation experiment scene.
Photonics 10 00918 g008
Figure 9. Cumulative distribution of positioning errors.
Photonics 10 00918 g009
Figure 10. Cumulative distribution of positioning errors for different neural network localization methods.
Photonics 10 00918 g010
Table 1. The influence of batch size on the accuracy of the model.
Batch SizeAverage Error/mMaximum Error/mTraining Time/s
160.018490.260801548.75
320.017450.22399920.64
640.017160.23451474.68
1280.016340.14717271.76
2560.017630.19478187.77
Table 2. Model parameters.
Layer Name(Convolution Kernel) SizeNumber of Convolution Kernels(Convolution Kernel) Step Size
Convolutional layer3 × 11281 × 1
Inception moduleConvolutional layer1 × 1161×1
Convolutional layer1 × 1/3 × 116/641×1
Convolutional layer1 × 1/3 × 1/3 × 116/32/641×1
Pooling layer3 × 1/1 × 1161×1
Attention module5 × 111 × 1
Inception moduleConvolutional layer1 × 1321×1
Convolutional layer1 × 1/3 × 116/481×1
Convolutional layer1 × 1/3 × 1/3 × 116/32/481×1
Pooling layer3 × 1/1 × 1321×1
Attention module5 × 111 × 1
Pooling layer2 × 12 × 1
Fully connected layer3
Table 3. Simulation parameters.
ParameterValue
Room   size / m × m × m 6 × 3 × 3.6
Height   of   positioning   space / m 0–1.8
Position   of   LED / m (2, 1.5, 3.6); (4, 1.5, 3.6)
Power   of   each   LED   bulb   P t / W 15
Field   of   view   ψ c / ° 90
Half   power   angles   of   LED   ϕ 1 / 2 / ° 70
Tilt   angle   of   PD   θ / ° 30
Azimuth   of   PDs   α 1 , α 2 , α 3 / ° 0,90,180
Effective   area   of   PD   A r / m 2 0.0001
Gain   of   optical   filter   T s ψ 1
Reflection coefficient ρ 0.7
Reflection   surface   element   area     Δ   A / m 2 0.01
Distance   from   PD 0   to   PD i   l / m 0.05
Refractive index of optical concentrator n1.5
Table 4. Comparison result of positioning error after adding different submodules.
Positioning AlgorithmAverage Error/mMaximum Error/mTraining Time/s
CNN0.022490.25562218.01
CNN + ECA0.018250.20091228.40
CNN + Inception-v20.017240.18514275.36
CNN + Inceptionv2 + ECA0.016340.14717295.42
Table 5. Three-dimensional positioning errors at different heights.
Height/mAverage Error/mMaximum Error/mMinimum Error/m
00.087290.479300.01303
0.60.119020.571270.01223
1.20.123690.568210.00649
1.80.111290.595360.01730
Table 6. Positioning errors of different neural network localization methods.
Positioning AlgorithmAverage Error/mMaximum Error/m
BPNN0.166840.88266
RNN0.214621.42188
LSTM0.220461.37061
CNN0.129240.82350
Inception-ECANet0.111200.59536
Disclaimer/Publisher’s Note: The statements, opinions and data contained in all publications are solely those of the individual author(s) and contributor(s) and not of MDPI and/or the editor(s). MDPI and/or the editor(s) disclaim responsibility for any injury to people or property resulting from any ideas, methods, instructions or products referred to in the content.

