Abstract
Optical biosensors based on grating-coupled surface plasmon resonance (GCSPR) technology are an important research topic in the field of bio-photonics. This paper presents a high-performance and high-sensitivity nanostructured bimetallic GCSPR sensor based on two-dimensional materials. When designing the sensor, the sensitivity, full width at half peak (FWHM) and dip strength of the absorption peak (DS) were considered comprehensively, and the comprehensive evaluation parameter FOM+ is defined by making improvements on the basis of figure of merit (FOM). The performance of the sensor can be judged more comprehensively. The performance of the sensor was further improved by optimizing the structure of the sensor. An ultra-thin gold layer was added on the surface of the silver-based GCSPR sensor, which solves the problem of the easy oxidation of silver metal. We tried to coat graphene oxide two-dimensional nanomaterials on the surface of the bimetallic sensor, and the sensitivity and FOM+ of the sensor reached 350 deg/RIU and 473.23, respectively. This is a great improvement compared with the GCSPR sensor in a previous study, and it can be improved at least 74.7%. This sensor can measure a variety of biological molecules and biological cells with high sensitivity and performance by detecting the change in the refractive index of the solution to be measured.
1. Introduction
Surface plasmon polaritons (SPPs) are special electromagnetic waves that propagate at the interface of a metal and a dielectric. SPPs are a coupling mode generated by the interaction of photons with free electrons on a metal surface [1,2]. When the momentum of the incident light matches the momentum of the SPPs at the metal-dielectric interface, the energy of the photon is converted into SPPs, resulting in an excited surface wave. Electromagnetic waves are present on a metal surface, and when the frequency of the electromagnetic wave matches the frequency of the surface-dissociated excitations, the surface plasmon resonance (SPR) is excited [3,4,5]. In the field of biosensors, surface plasmon resonance (SPR) technology has been widely used in environmental protection, medical diagnosis, food safety and other fields because of its characteristics of no labeling and real-time detection, and it has made great progress in recent years [6,7,8,9]. Because the sensitivity of prismatic sensors is generally higher than that of grating sensors, they have been widely used in practice [10,11]. Most prismatic SPR sensors use the attenuated total reflection (ATR) method to excite surface plasma waves [12,13,14]. However, the volume of prismatic SPR sensors is relatively large, which requires more accurate angle control and is not convenient for integration. Cullen et al. first proposed the use of a diffraction-grating-based system for SPR sensing. Since then, grating-type SPR sensors have been studied as an alternative to prism types [4,15,16]. Nowadays, grating has been widely used in many fields such as optics and optoelectronics due to its unique function and excellent performance, and it has become an indispensable and important functional device in modern instruments and meters [17,18,19]. Most researchers have improved the sensitivity of the grating-type SPR sensor by optimizing the absorption peak generated by the positive diffraction order, but it still cannot exceed that of the prism-type sensor [20,21]. According to relevant research in recent years, the sensitivity of a negative diffraction order is greater than that of a positive diffraction order, and a higher negative diffraction order can obtain greater sensitivity at a larger resonance angle [22]. In order to improve the sensitivity of the GCSPR sensor, we optimized the high-order negative diffraction order and realized the steep inclination of the absorption peak.
By transforming the interaction between biomolecules into optical signals, SPR biosensors can realize the function of real-time target monitoring [23,24,25]. Since the first documented surface plasmon phenomenon in 1902, SPR has developed into a mature technology in the field of biosensors [2,26,27,28]. With the development of nano-manufacturing technology, the metal structure used to excite SPR has attracted more and more attention. Because the propagation constant of surface plasma waves is always greater than that of light waves in free space, the structure of SPR sensors can generally be based on prism coupling or grating coupling. Periodic nanostructures can stimulate SPR by providing additional wave vectors to compensate for the gap between the free space wave vector of light and the wave vector of surface plasmon polaritons [29,30]. Moreover, compared with some complex nanostructures, the fabrication of periodic metal gratings with simple profiles is simpler. For example, Nazem et al. reported on rectangular grating based on a Ag-MgF2 structure, which reduced the manufacturing cost and obtained a sensitivity of 85.61°/RIU [31]. Zheng et al. proposed a grating structure with a metal and multilayer composite, which greatly improved the sensitivity to 700 nm/RIU by using a negative diffraction order to excite SPR [32]. In order to detect gases harmful to human health, Sadeghi et al. designed a graphene–gold grating with a simple structure and obtained a sensitivity of 1180 nm/RIU by analyzing the extinction spectrum [33]. Bijalwan et al. proposed a bimetallic structure, which significantly improved the figure of merit (FOM) to 97.46 [34]. Therefore, it is necessary to study the design of grating-coupled surface plasmon resonance (GCSPR) sensors in conjunction with practical needs. Moreover, Yanqiu and Yeung et al. have experimentally demonstrated the feasibility of grating sensors for measuring biomolecules [35,36].
2. Theoretical Analysis
Surface plasmon polaritons are electromagnetic fields in transverse magnetic field (TM) mode, which propagate along the interface between metal and medium [37]. The wave vector of a surface plasma wave can be expressed as:
where is the free space wave vector of the light wave, is the dielectric constant of the metal, and is the refractive index of the medium. In the grating-based SPR configuration, the light wave has a certain incidence angle θ on the periodically modulated surface of a rectangular metal grating.
On the metal grating, the incident light wave is partially reflected on the grating surface and partially split into a series of diffracted waves, which either disappear or propagate back into the medium. The component of the wave vector of the M-th diffraction wave parallel to the interface changes in the following way:
where m is an integer, and Λ represents the period of the grating. Because SPW is an evanescent electromagnetic wave, its propagation constant is always greater than that of light in the dielectric material. The excitation of surface plasma waves is based on the diffraction of light waves on the grating. Therefore, the momentum conservation of a light wave excited by diffraction grating can be expressed as [38]:
where is the resonance angle, the symbol ‘+’ represents diffracted waves with m > 0, and the symbol ‘−’ represents diffracted waves with m < 0.
The effective excitation of surface plasmonic excitations usually requires . Thus, the resonance angle equation can be written in the following form:
It can be seen that when the incident wavelength is fixed, the sensitivity of the sensor at angular modulation can be obtained as follows:
S is an important parameter to evaluate the sensor performance, and S is defined as the ratio of the offset of the resonance angle to the change in the refractive index of the medium. The ‘±’ sign in this equation corresponds to the case of positive and negative diffraction levels, respectively. This equation shows that the sensitivity is a function of the resonance angle, and the sensitivity is much higher when m < 0 than when m > 0.
In general, the performance of angle-modulated SPR sensors depends on both sensitivity and full half-peak width [39]. Firstly, for a given change in the refractive index of the analyte, the shift in the resonance angle should be as large as possible; secondly, the full width of the half peak of the SPR inclination should be as small as possible in order to reduce the error of the resonance angle [40]. Figure of merit (FOM) is an indicator that allows for a comprehensive evaluation of sensor performance. It can be expressed as FOM = S/FWHM. In practical experiments, spectral noise also affects the performance of the sensor. Therefore, the parameter of absorption peak dip strength (DS) is included in this study for a more comprehensive discussion of the sensor performance. DS will also be influenced by external conditions [41]. When the reflection peak is shallow, external noise has a significant impact on the accurate determination of the peak. Therefore, the depth of the reflection peak should also be considered in the sensor evaluation. The deeper the resonance spectrum, the greater the intensity of the absorption peak inclination, the better the coupling effect and the stronger the SP wave excitation [42]. Thus, in judging the sensor performance, we combined all the above influencing parameters to obtain a new performance parameter defined as:
In the experiment, DS determines the measurement accuracy, and the larger the DS and FOM+, the better the overall performance of the sensor. In this paper, we consider the effect of each structural parameter of the grating on the sensor performance to improve the GCSPR sensor. The sensitivity, FWHM and DS are considered together to calculate the performance parameter FOM+ to obtain the actual best performance of the sensor.
3. Experimental Structure and Optimization
3.1. Structural Modeling
In many technologies, the change in the material refractive index is an important parameter for the determination and physical characterization of biological concentration [43,44,45]. Here, we use a simple setup of a GCSPR sensor, which is widely used in many studies. It is composed of a liquid object channel and a metal grating structure [6,46,47]. As shown in Figure 1a, the initial parameters of the structure are: the thickness of the grating layer d = 30 nm, the thickness of the metal layer d1=100 nm, and the thickness of the substrate d2 = 400 nm, where the grating period p = 1500 nm, and the width of the lower bottom of the trapezoidal grating w = 750 nm. f is a trapezoidal grating layer with a lower bottom duty cycle of 0.64 (f = w/p). The upper bottom width of the trapezoidal grating is t = 675 nm, at which time the trapezoidal coefficient = upper bottom width of the trapezoid/lower bottom width of the trapezoid (f1 = t/w) is 0.9. The 400 nm thick substrate was chosen to optimize the performance of the sensor under specific experimental conditions to improve the coupling efficiency between light–dielectric–metal, to increase the sensitivity of the surface plasmon resonance, as well as to reduce the effect of the substrate on the sensor signal. The refractive index of deionized water (used as the basic solution of biological molecules and biological cells) is 1.33 [48]. Therefore, at the beginning of design and optimization, the refractive index of the sensing medium is also preferred to be 1.33, and the modulated TM-polarized light is at the near-infrared wavelength λ = 860 nm incident. The initial reflection spectrum obtained by using silver metal and silicon as the substrate material for the metal layer and grating layer is shown in Figure 1b. In this paper, the reflection spectrum of the sensor is obtained by the multi-physical field finite element simulation of COMSOL software. The performance parameters of the unmarked sensor are studied, and the influence of the structural parameters on the sensor performance is analyzed. Convergence analysis is carried out by gradually improving the simulation accuracy until the simulation results are basically unchanged.
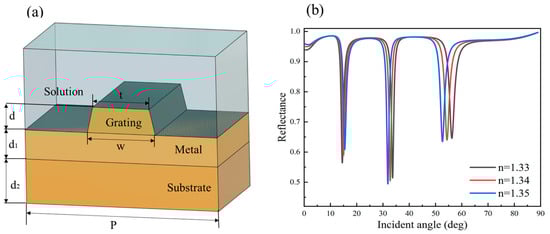
Figure 1.
(a) Schematic diagram of ladder GCSPR sensor structure. (b) Refractive index change of the object to measure reflection spectrum at .
3.2. The Effect of Grating Period on Sensor Performance
We would like to emphasize that in our study, we carefully controlled the grating period and the grating duty cycle. We performed the calculations at different grating cycles and adjusted the grating duty cycle correspondingly at each cycle so that the duty cycle is the same at different periods. While studying the grating duty ratio, we kept the grating period constant. This design ensures that we are able to analyze and differentiate the effects of the grating period and grating duty cycle on sensor performance. In addition, we investigated the change in sensor performance when the grating period was varied between 600 nm and 1200 nm in steps of 10 nm. A comprehensive analysis and a comparison of the sensor performance at each cycle were also performed. After experiments and calculations, we found that the sensitivity and FOM+ of the sensor reached their highest values at a grating period of 1100 nm. At this time, the sensitivity of the sensor is 441 deg/RIU, and FOM+ is 75.49. Compared with the initial structure, the sensitivity is increased by 145%, and FOM+ is increased by 182%. This indicates that the performance of the sensor is significantly improved at a grating period of 1100 nm, and therefore, we have chosen this period as the optimal design parameter. In Figure 2a, a distribution diagram of the magnetic field intensity is shown. In the metal layer, the magnetic field intensity increases sharply as it approaches the metal-to-object interface, and in the dielectric, the decrease in the magnetic field intensity is much slower. At the corners of the grating, the distribution of the electric and magnetic field components changes significantly due to the drastic change in geometry. This geometry results in the concentration or uneven distribution of the current in the corners, which in turn results in the distribution of the magnetic field in the corners of the trapezoidal metal diffraction grating. Therefore, the corners of a trapezoidal metal diffraction grating are areas in which the magnetic field distribution is concentrated or varies. This magnetic field distribution affects the propagation of light and interference phenomena, and thus the diffraction of light in the trapezoidal diffraction grating. Figure 2b shows the change in the absorption peak when the refractive index n of the sensing medium changes from 1.33 to 1.37 when p = 1100 nm. With the increase in the refractive index, the resonance angle of the absorption peak also starts to shift to a smaller angle, and the shift distance becomes smaller and smaller. In the subsequent study, the period p is also fixed at 1100 nm, so that the resonance angle occurs in the range of 60° to 85°.
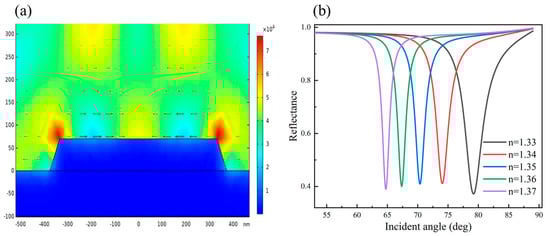
Figure 2.
(a) Local electromagnetic field intensity distribution diagram. (b) When p = 1100 nm, the refractive index of the medium changes from 1.33 to 1.37.
3.3. Effect of Grating Duty Ratio on Sensor Performance
The SPR effect formed is very sensitive to the geometric parameters, environmental conditions and incident light characteristics of the sensor. Therefore, in order to achieve the best performance of the proposed sensor, during the optimization process, the reflection curve with very small DS of the reflection spectrum is ignored, because the very low reflection value cannot be accurately detected when there are noises or other external factors in the laboratory. However, Cai mentioned in his paper that using the double-dip method (DDM) can greatly improve the sensitivity of the grating-based SPR sensor [22]. In this method, the structure and parameters of the sensor are designed to produce reflection angles of different diffraction levels, and the sensitivity is calculated using the angular difference between the reflection angles of different orders. However, the cost to improve the sensitivity is the additional uncertainty brought by the calculation of the dip angle of the two reflection spectra. We find that the sensitivity calculated by the DDM method and the error generated by FOM+ may be several times higher than that in the case of a single resonance angle. Therefore, this study chooses to discuss the performance parameters that can be achieved by a single negative diffraction order. From previous research, we know that the period determines the number of diffraction orders produced to a certain extent. When the period and diffraction order are determined, the sensitivity changes little. Therefore, with other parameters fixed, we researched the effect of the duty cycle on the performance of the sensor. We investigated the effect of the grating duty cycle on the GCSPR sensor’s sensitivity and FOM+ in steps of ∆f1 = 0.01. Figure 3 shows the change in the absorption peak when the duty cycle f1 changes from 0.63 to 0.70, and the refractive index of the medium is 1.33. The DS of the absorption peak increases with the increase in the duty cycle until the f1 is 0.68, and the full width of the absorption peak decreases with the increase in the duty cycle. This is because the structure of the grating changes as the duty cycle increases, leading to changes in the diffraction effect of light and the position of the plasma resonance. In a certain range, the diffraction and resonance effects are enhanced as the duty cycle is increased, so the intensity of the absorption peaks increases. However, when the duty cycle exceeds a certain critical value, the diffraction and resonance effects begin to diminish, resulting in a rapid decrease in the intensity of the absorption peaks. This phenomenon is due to the fact that when the duty cycle is too high, the structure of the grating becomes insufficiently compact or unsuitable for producing the desired diffraction and resonance effects. The grating structure with a duty cycle of 0.68 effectively excites the surface plasmon resonance, enabling the deepest reflectivity and a high FOM+ to be obtained.
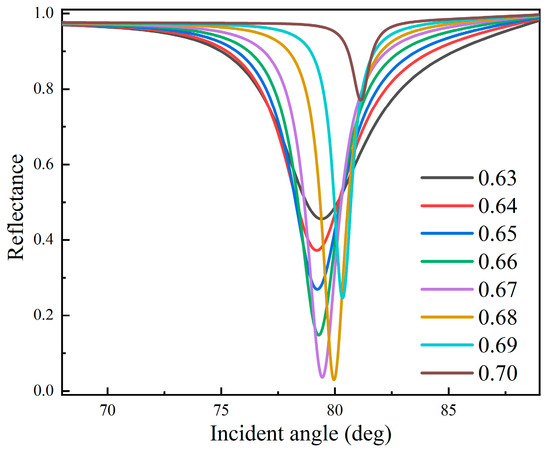
Figure 3.
Reflective spectrum when the grating duty cycle changes from 0.63 to 0.70 when n = 1.33.
The sensitivity, quality factor and FOM+ at different duty ratios are further studied and calculated when the refractive index of the medium changes from 1.33 to 1.35. As shown in Figure 4a, with the change in the grating duty cycle, the sensitivity of the sensor fluctuates around 440 deg/RIU, and the absorption peak intensity first increases and then decreases rapidly with the increase in the duty cycle.
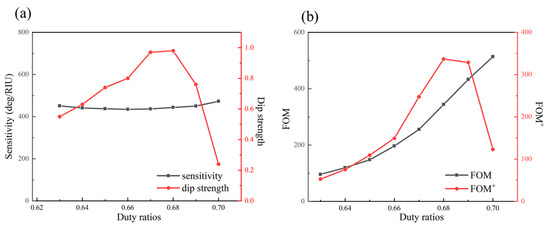
Figure 4.
(a) Contrast diagram of sensor sensitivity and DS; (b) contrast diagram of FOM and FOM+.
Since the full width at half peak decreases with the increase in duty cycle, the FOM and FOM+ variation diagram shown in Figure 4b can be calculated. The FOM in the figure increases with the increase in the duty cycle, and at f1 = 0.7, DS has been reduced to 0.24, which is easily affected by external noise in actual measurement, so we use FOM+ to evaluate the performance of the sensor. It can be seen that with the increase in the grating duty cycle, the FOM+ of the sensor reaches the peak at f1 = 0.68. At this time, the sensitivity is 443.5 deg/RIU, and the FOM+ reaches 336.92 RIU−1. Compared with the sensitivity when the grating cycle is only optimized, the sensitivity increases slightly, and the FOM+ increases by 346.3%. These factors lead to changes in the diffraction effect of light and the position of the plasma resonance. In a certain range, the diffraction and resonance effects are enhanced as the duty cycle is increased, so that the intensity of the absorption peaks increases. However, when the duty cycle exceeds a certain critical value, the diffraction and resonance effects begin to diminish, resulting in a rapid decrease in the intensity of the absorption peaks. The associated parameters change accordingly. This is because when the duty cycle is too high, the structure of the grating becomes insufficiently compact for the desired diffraction and resonance effects.
3.4. The Effect of Grating Depth on the Sensor
After determining the grating duty cycle and grating period, the effect of the grating layer thickness on the sensor performance was considered. As shown in Figure 5, when the refractive index of the object to be measured is 1.33, the reflection spectrum of the grating layer thickness varies from 50 nm to 110 nm in steps of . As the grating thickness increases, the absorption peaks of different thicknesses start to move to higher resonance angles. The intensity of the absorption peak increases, and the full width of the half peak also increases, until the thickness reaches 110 nm when the absorption peak is beyond the measurement range of the detector. The FOM+ is a comprehensive evaluation parameter that is not only related to the depth of the absorption peak. Although the deepest reflectance is obtained at 90 nm, the half-peak full width is larger at 90 nm, and the calculated FOM is smaller. After considering the effects of these parameters simultaneously, the FOM+ is calculated to be the maximum at 70 nm.
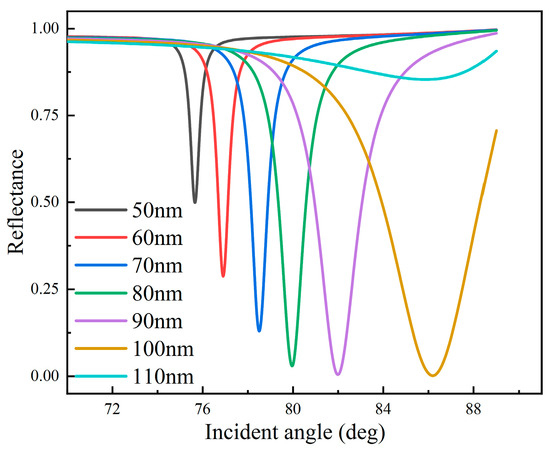
Figure 5.
Reflection spectrum under different grating layer thicknesses when n = 1.33.
The performance parameters of the sensor were then calculated for different grating thicknesses when the refractive index of the medium was changed from 1.33 to 1.35, respectively. As shown in Figure 6a, with the increase in grating thickness, the half-peak full width of the absorption peak increases, and the intensity of the absorption peak first increases with the thickness, then reaches the maximum value and then starts to decrease rapidly. The calculated sensitivity also has an increasing trend, as shown in Figure 6b, and it drops sharply at the thickness of 110 nm. The FOM+ also shows a trend of uniform increase and then decrease, and it reaches the maximum value at the thickness of 70 nm, when the sensitivity is 403 deg/RIU, and the FOM+ is 403RIU. Compared to the FOM+ after optimizing the period and duty ratio by 20%, the loss in sensitivity is negligible in comparison.
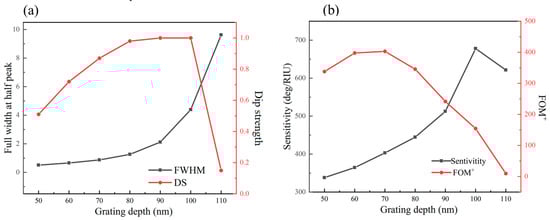
Figure 6.
Refractive index changes when : (a) contrast diagram of the full width at half peak and the absorption peak intensity under different grating layer thicknesses; (b) comparison diagram of sensitivity and FOM+ under different grating layer thicknesses.
3.5. Effect of Trapezoidal Parameters on Sensor Performance
Due to the specificity of the trapezoidal grating shape, the influence of the trapezoidal parameter of the grating needs to be considered more than that of rectangular grating. After determining the previous parameters, the angular reflection spectrum was calculated for the change in the trapezoidal parameter from 0.77 to 0.92 for a refractive index of n = 1.33. The absorption peaks in the reflection spectrum started to move to a smaller resonance angle, and the intensity of the absorption peaks tended to be larger and then smaller. Meanwhile, the full width of the half peak of the absorption peaks also decreased continuously, as shown in Figure 7.
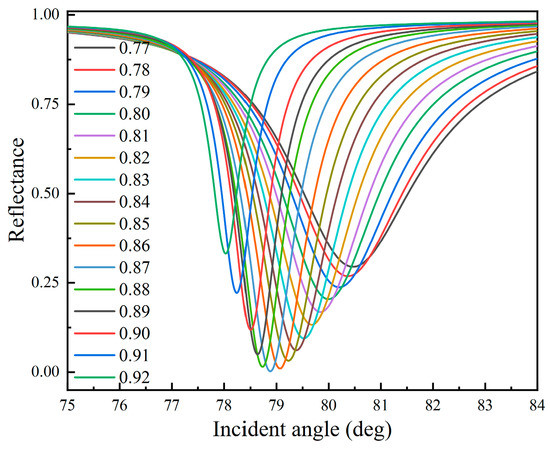
Figure 7.
Reflection spectrum under different trapezoidal coefficients from 0.77 to 0.92 when n = 1.33.
As shown in Figure 8a, it can be seen that the full width of the half peak decreases gradually from 3.13 nm to 0.71 nm during the change in the trapezoidal parameter from 0.77 to 0.92. The intensity of the absorption peak inclination first increases continuously until it reaches a maximum and then slowly starts to decrease. After calculating each performance parameter, the sensitivity and quality factor at each trapezoidal parameter were obtained along with the FOM+. As shown in Figure 8b, it can be seen that the sensitivity slowly decreases while the quality factor continuously increases, and the FOM+ starts to decrease after rising to its maximum value. Therefore, the grating trapezoid parameter was determined to be 0.89, at which point the sensitivity reached 405.5 deg/RIU, and the FOM+ was 409.8 RIU−1. Compared to the period, duty cycle and thickness of the grating after optimization, there is not much change, but the absorption peak depth has changed from 0.87 to 0.96, which is a 10% improvement.
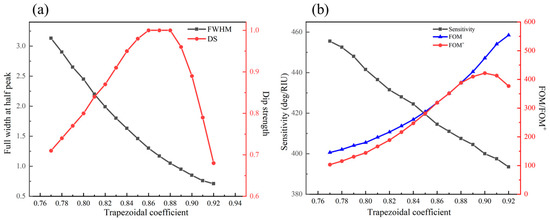
Figure 8.
Refractive index changes with different grating trapezoid parameters when An = 0.02: (a) comparison diagram of FWHM and DS; (b) comparison diagram of sensitivity, FOM and FOM+.
4. GCSPR Sensors with Surface Coating
The schematic of the surface-coated bimetallic GCSPR sensor is shown in Figure 9. The exact methods and steps for inserting two-dimensional materials into gratings may vary depending on the actual design and experimental conditions. Depending on the need, two-dimensional material layers are prepared by chemical vapor deposition, mechanical stripping or chemical synthesis. A two-dimensional material with the desired shape and size should be obtained.
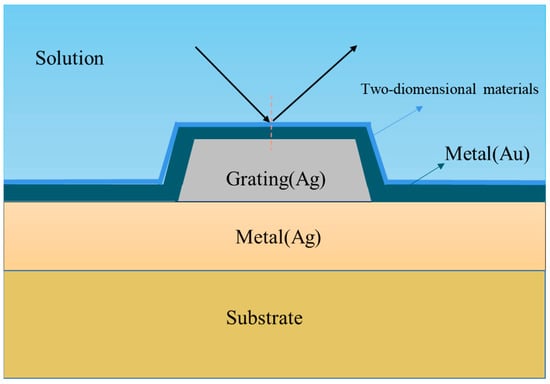
Figure 9.
Structure of bimetallic-coated trapezoidal grating.
4.1. Selection of Metal Layers
Typically, most of the active metals used in GCSPR sensors are Au, Ag or Al. Among these metals, Au exhibits higher stability, whereas Ag shows a narrower and deeper resonance curve and is relatively more susceptible to oxidation. To protect the Ag layer from oxidation, we deposited an ultra-thin Au film on the grating surface. We compared the direct lamination of different thicknesses of gold film while keeping the thickness of the Au film and silver grating at 70nm. In both cases, Au layers of 1 to 3 nm were used, and the performance parameters were calculated for different thicknesses.
From Figure 10a, it can be seen that when directly covered with a thin Au layer, with the increase in Au film thickness, the absorption peak dip angle intensity also decreases. There is a change of about 1.0 in the half-peak full width. When the total thickness of the Au film and grating is kept at 70 nm, the thickness of the silver grating decreases with the increase in the Au film. The half-peak full width of the absorption peak obtained varies around 0.9, and the inclination intensity decreases substantially at 3 nm Au film. The values of sensitivity, FOM and FOM+ were then calculated as shown in Figure 10b. The sensitivity of the six cases in the graphs all fluctuate around 400 deg/RIU. But in the three cases with gold film and grating thickness kept 70 nm, the quality factor increases with the thickness in the gold film, and the FOM+ reaches the maximum at 68 nm Ag + 2 nm Au.
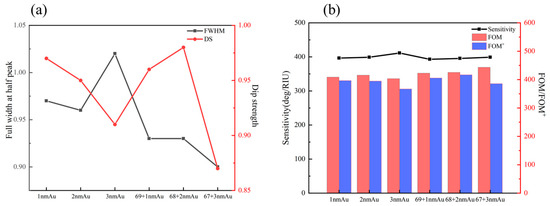
Figure 10.
(a) Comparison diagram of absorption peak DS and FWHM obtained under six conditions. (b) Sensor sensitivity, FOM and FOM+ obtained in six cases.
4.2. Selection of Two-Dimensional Material Layer
Two-dimensional materials have also received a lot of attention from the nanotechnology community over the years. Because of their large surface-to-volume ratio and conductive properties, two-dimensional materials are particularly suitable for use as light-absorbing materials. They have also been widely studied and applied because of their unique light absorption properties. Because of the excellent optical properties exhibited by two-dimensional materials, an attempt was made to coat the results of the trapezoidal bimetal grating with a two-dimensional material layer to enhance the actual testing efficiency of the sensor, as shown in Figure 11. Two commonly used two-dimensional materials, graphene and graphene oxide, were compared in the experiments, and the reflection spectra of the two materials were recorded for different numbers of layers. The performance parameters were calculated and obtained.
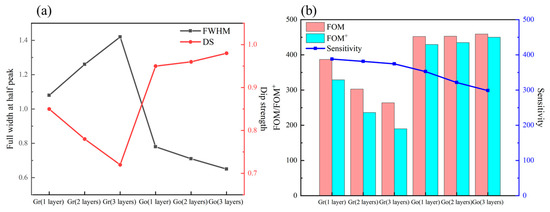
Figure 11.
The case of different two-dimensional material films when the refractive index of the medium changes from 1.33 to 1.35: (a) comparison diagram of DS and FWHM of absorption peak; (b) comparison diagram of sensor sensitivity, FOM and FOM+.
When different layers of graphene are used, the full width of the half peak of the sensor increases as the number of layers increases, and the intensity of the absorption peak dip decreases slowly. In contrast, when different layers of graphene oxide are used, the full width of the half peak decreases, and the inclination intensity increases slowly, as shown in Figure 11a. The calculated results are shown in Figure 11b. The three performance parameters of sensitivity, FOM and FOM+ decrease as the number of graphene layers increases, and the sensitivity is only 374.5 deg/RIU, with FOM+ as low as 189.8, when there are three layers of graphene. When using graphene oxide, the sensitivity slowly decreases as the number of layers increases. However, the lower full half-peak width and larger dip intensity keep the quality factor above 450, and the FOM+ fluctuates above and below 440.
A grating SPR sensor with a double-layer graphene oxide bimetallic trapezoidal structure was selected for the analysis. When the refractive index of the medium to be measured is varied from 1.33 to 1.34 in steps of = 0.001, the displacement is perfectly linear, with a correlation coefficient of 0.99908. The slope of the relationship curve between the resonance angle and the refractive index of the medium to be measured is the sensitivity, which is 350 deg/RIU, as shown in Figure 12. The results of this research were compared with the results of other different surface-plasmon-resonance-based sensors, as shown in Table 1. In the obtained results, not only are the sensitivity and FOM higher than those previously reported for SPR sensors, but also the calculated comparison FOM+ shows a significant improvement over the previously reported results.
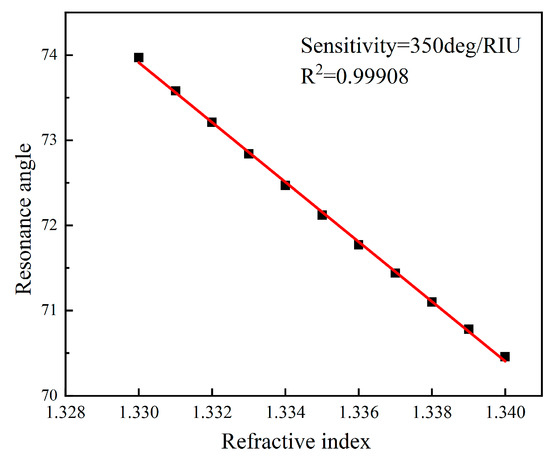
Figure 12.
Linear regression curve of resonance angle and refractive index in the whole refractive index ranges from 1.33 to 1.34 of the medium to be measured when n = 0.001.

Table 1.
Performance comparison of GCSPR sensor.
5. Conclusions
In this paper, a GCSPR sensor with a trapezoidal structure is designed. The effects of the geometric parameters on the performance of the sensor, including the trapezoidal grating period, duty ratio, grating depth and trapezoidal parameters, are investigated. The optimal value was chosen from various parameters. The trapezoidal sensor was then covered with Au film to protect the Ag metal grating and improve performance. Since the two-dimensional materials exhibit quite good optical effects, graphene and graphene oxide were selected for the study and optimized for the bimetallic sensor. Finally, the graphene oxide film was chosen as the cover layer, which presented good performance. The sensitivity obtained was 350 deg/RIU, and the FOM and FOM+ reached 492.95 and 473.23, respectively.
Author Contributions
Conceptualization, H.W. and C.T.; software, H.W. and C.T.; validation, H.W.; data curation, H.W.; writing—original draft preparation, H.W.; writing—review and editing, H.W., C.T., Z.L., X.G.; supervision, J.S. and C.L.; funding acquisition, J.S and C.L. All authors have read and agreed to the published version of the manuscript.
Funding
This research was funded by Finance Science and Technology Project of Hainan Province (ZDKJ2020009).
Institutional Review Board Statement
Not applicable.
Informed Consent Statement
Not applicable.
Data Availability Statement
Research data presented in this study are available on request from the corresponding author.
Conflicts of Interest
The authors declare no conflict of interest. The funders had no role in the design of this study; in the collection, analyses, or interpretation of data; in the writing of the manuscript; or in the decision to publish the results.
References
- Chaudhary, V.S.; Kumar, D.; Kumar, S. SPR-Assisted Photonic Crystal Fiber-Based Dual-Wavelength Single Polarizing Filter With Improved Performance. IEEE Trans. Plasma Sci. 2021, 49, 3803–3810. [Google Scholar] [CrossRef]
- Guo, X. Surface plasmon resonance based biosensor technique: A review. J. Biophotonics 2012, 5, 483–501. [Google Scholar] [CrossRef] [PubMed]
- Hu, C. Surface plasmon resonance sensor based on diffraction grating with high sensitivity and high resolution. Opt. Z. Licht Elektron. J. Light-Electronoptic 2011, 122, 1881–1884. [Google Scholar] [CrossRef]
- Jory, M.J.; Bradberry, G.W.; Cann, P.S.; Sambles, J.R. A surface-plasmon-based optical sensor using acousto-optics. Meas. Sci. Technol. 1995, 6, 1193–1200. [Google Scholar] [CrossRef]
- Kong, L.; Lv, J.; Gu, Q.; Ying, Y.; Jiang, X.; Si, G. Sensitivity-Enhanced SPR Sensor Based on Graphene and Subwavelength Silver Gratings. Nanomaterials 2020, 10, 2125. [Google Scholar] [CrossRef] [PubMed]
- Iqbal, T.; Afsheen, S. One Dimensional Plasmonic Grating: High Sensitive Biosensor. Plasmonics 2017, 12, 19–25. [Google Scholar] [CrossRef]
- Abutoama, M.; Abdulhalim, I. Self-referenced biosensor based on thin dielectric grating combined with thin metal film. Opt. Express 2015, 23, 28667–28682. [Google Scholar] [CrossRef]
- Maurya, J.B.; Prajapati, Y.K.; Singh, V.; Saini, J.P. Sensitivity enhancement of surface plasmon resonance sensor based on graphene-MoS2 hybrid structure with TiO2-SiO2 composite layer. Appl. Phys. A 2015, 121, 525–533. [Google Scholar] [CrossRef]
- Ludovic, S.; Live, O.R.B.; Masson, J.-F. Propagating surface plasmon resonance on microhole arrays. Anal. Chem. 2010, 82, 3780–3787. [Google Scholar]
- Zhang, P.; Wang, J.; Chen, G.; Shen, J.; Li, C.; Tang, T. A High-Sensitivity SPR Sensor with Bimetal/Silicon/Two-Dimensional Material Structure: A Theoretical Analysis. Photonics 2021, 8, 270. [Google Scholar] [CrossRef]
- Jin, Z.; Guan, W.; Liu, C.; Xue, T.; Wang, Q.; Zheng, W.; Cui, X. A stable and high resolution optical waveguide biosensor based on dense TiO2/Ag multilayer film. Appl. Surf. Sci. 2016, 377, 207–212. [Google Scholar] [CrossRef]
- Shalabney, A.; Abdulhalim, I. Figure-of-merit enhancement of surface plasmon resonance sensors in the spectral interrogation. Opt. Lett. 2012, 37, 1175–1177. [Google Scholar] [CrossRef]
- Verma, A.; Prakash, A.; Tripathi, R. Sensitivity enhancement of surface plasmon resonance biosensor using graphene and air gap. Opt. Commun. 2015, 357, 106–112. [Google Scholar] [CrossRef]
- Gupta, G.; Sugimoto, M.; Matsui, Y.; Kondoh, J. Use of a low refractive index prism in surface plasmon resonance biosensing. Sens. Actuators B Chem. 2008, 130, 689–695. [Google Scholar] [CrossRef]
- Cullen, D.C.; Lowe, C.R. A direct surface plasmon—Polariton immunosensor: Preliminary investigation of the non-specific adsorption of serum components to the sensor interface. Sens. Actuators B Chem. 1990, 1, 576–579. [Google Scholar] [CrossRef]
- Lawrence, C.R.; Geddes, N.J.; Furlong, D.N.; Sambles, J.R. Surface plasmon resonance studies of immunoreactions utilizing disposable diffraction gratings. Biosens. Bioelectron. 1996, 11, 389–400. [Google Scholar] [CrossRef]
- Guo, Y.; Singh, N.M.; Das, C.M.; Wei, K.; Li, K.; Coquet, P.; Yong, K.-T. Effect of ultra-shallow metallic gratings on sensitivity enhancement of Goos-Hänchen shift in SPR-based sensors. Optik 2020, 224, 165690. [Google Scholar] [CrossRef]
- Dhawan, A.; Canva, M.; Vo-Dinh, T. Narrow groove plasmonic nano-gratings for surface plasmon resonance sensing. Opt. Express 2011, 19, 787–813. [Google Scholar] [CrossRef]
- Teotia, P.K.; Kaler, R.S. Multilayer with periodic grating based high performance SPR waveguide sensor. Opt. Commun. 2017, 395, 154–158. [Google Scholar] [CrossRef]
- Hu, C.; Liu, D. High-performance Grating Coupled Surface Plasmon Resonance Sensor Based on Al-Au Bimetallic Layer. Mod. Appl. Sci. 2010, 4, 8–13. [Google Scholar] [CrossRef]
- Lin, K.; Lu, Y.; Chen, J.; Zheng, R.; Wang, P.; Ming, H. Surface plasmon resonance hydrogen sensor based on metallic grating with high sensitivity. Opt. Express 2008, 16, 18599–18604. [Google Scholar] [CrossRef] [PubMed]
- Cai, D.; Lu, Y.; Lin, K.; Wang, P.; Ming, H. Improving the sensitivity of SPR sensors based on gratings by double-dips method (DDM). Opt. Express 2008, 16, 14597–14602. [Google Scholar] [CrossRef] [PubMed]
- Paulsen, M.; Jahns, S.; Gerken, M. Intensity-based readout of resonant-waveguide grating biosensors: Systems and nanostructures. Photonics Nanostruct.-Fundam. Appl. 2017, 26, 69–79. [Google Scholar] [CrossRef]
- Fossati, S.; Hageneder, S.; Menad, S.; Maillart, E.; Dostalek, J. Multiresonant plasmonic nanostructure for ultrasensitive fluorescence biosensing. Nanophotonics 2020, 9, 3673–3685. [Google Scholar] [CrossRef]
- Patko, D.; Gyorgy, B.; Nemeth, A.; Szabó-Taylor, K.E.; Kittel, A.; Buzas, E.I.; Horvath, R. Label-free optical monitoring of surface adhesion of extracellular vesicles by grating coupled interferometry. Sens. Actuators B Chem. 2013, 188, 697–701. [Google Scholar] [CrossRef]
- Fan, S.Y.; Chiu, N.F.; Chen, C.P.; Chang, C.C.; Chen, C.Y. Simultaneous Real-Time Detection of Pregnancy-Associated Plasma Protein-A and -A2 Using a Graphene Oxide-Based Surface Plasmon Resonance Biosensor. Int. J. Nanomed. 2020, 15, 2085–2094. [Google Scholar] [CrossRef]
- Islam, M.S.; Kouzani, A.Z. Variable incidence angle subwavelegth grating SPR graphene biosensor. Annu. Int. Conf. IEEE Eng. Med. Biol. Soc. 2013, 2013, 3024–3027. [Google Scholar] [CrossRef]
- Liu, Y.; Chen, S.; Liu, Q.; Masson, J.-F.; Peng, W. Compact multi-channel surface plasmon resonance sensor for real-time multi-analyte biosensing. Opt. Express 2015, 23, 20540–20548. [Google Scholar] [CrossRef]
- Vala, M.; Baldini, F.; Dostálek, J.; Homola, J.; Lieberman, R.A.; Homola, J.; Miler, M. Diffraction grating-coupled surface plasmon resonance sensor based on spectroscopy of long-range and short-range surface plasmons. In Optical Sensing Technology and Applications; SPIE: Bellingham, WA, USA, 2007; Volume 6585, pp. 557–565. [Google Scholar]
- Alleyne, C.J.; Kirk, A.G.; McPhedran, R.C.; Nicorovici, N.-A.P.; Maystre, D. Enhanced SPR sensitivity using periodic metallic structures. Opt. Express 2007, 15, 8163–8169. [Google Scholar] [CrossRef]
- Nazem, S.; Malekmohammad, M.; Soltanolkotabi, M. Theoretical and experimental study of a surface plasmon sensor based on Ag-MgF2 grating coupler. Appl. Phys. B 2020, 126, 96. [Google Scholar] [CrossRef]
- Zheng, G.; Chen, Y.; Xu, L.; Lai, M. Optical characteristics of subwavelength metallic grating coupled porous film surface plasmon resonance sensor with high sensitivity. Optik 2013, 124, 4725–4728. [Google Scholar] [CrossRef]
- Sadeghi, Z.; Shirkani, H. High-Performance Label-Free Near-Infrared SPR Sensor for Wide Range of Gases and Biomolecules Based on Graphene-Gold Grating. Plasmonics 2019, 14, 1179–1188. [Google Scholar] [CrossRef]
- Bijalwan, A.; Rastogi, V. Sensitivity enhancement of a conventional gold grating assisted surface plasmon resonance sensor by using a bimetallic configuration. Appl. Opt. 2017, 56, 9606–9612. [Google Scholar] [CrossRef]
- Dai, Y.; Xu, H.; Wang, H.; Lu, Y.; Wang, P. Experimental demonstration of high sensitivity for silver rectangular grating-coupled surface plasmon resonance (SPR) sensing. Opt. Commun. 2018, 416, 66–70. [Google Scholar] [CrossRef]
- Yeung, W.K.; Chen, H.-Y.; Sun, J.-J.; Hsieh, T.-H.; Mousavi, M.Z.; Chen, H.-H.; Lee, K.-L.; Lin, H.; Wei, P.-K.; Cheng, J.-Y. Multiplex detection of urinary miRNA biomarkers by transmission surface plasmon resonance. Analyst 2018, 143, 4715–4722. [Google Scholar] [CrossRef]
- Homola, J. Present and future of surface plasmon resonance biosensors. Anal. Bioanal. Chem. 2003, 377, 528–539. [Google Scholar] [CrossRef]
- Homola, J.; Koudela, I.; Yee, S.S. Surface plasmon resonance sensors based on diffraction gratings and prism couplers: Sensitivity comparison. Sens. Actuators B Chem. 1999, 54, 16–24. [Google Scholar] [CrossRef]
- Long, S.; Cao, J.; Geng, S.; Xu, N.; Qian, W.; Gao, S. Optimization of plasmonic sensors based on sinusoidal and rectangular gratings. Opt. Commun. 2020, 476, 126310. [Google Scholar] [CrossRef]
- Su, W.; Zheng, G.; Li, X. Design of a highly sensitive surface plasmon resonance sensor using aluminum-based diffraction grating. Opt. Commun. 2012, 285, 4603–4607. [Google Scholar] [CrossRef]
- Nenninger, G.G.; Piliarik, M.; Homola, J. Data analysis for optical sensors based on spectroscopy of surface plasmons. Meas. Sci. Technol. 2002, 13, 2038–2046. [Google Scholar] [CrossRef]
- Liu, Z.; He, J.; He, S. Characterization and Sensing of Inert Gases with a High-Resolution SPR Sensor. Sensors 2020, 20, 3295. [Google Scholar] [CrossRef] [PubMed]
- Cunningham, B.; Lin, B.; Qiu, J.; Li, P.; Pepper, J.; Hugh, B. A plastic colorimetric resonant optical biosensor for multiparallel detection of label-free biochemical interactions. Sens. Actuators B Chem. 2002, 85, 219–226. [Google Scholar] [CrossRef]
- Pasqua, J.; Lawrence, G.; Varma, M.; Regnier, F.; Cho, W.; Nolte, D.; Zhao, M. High-Speed Interferometric Detection of Label-Free Immunoassays on the Biological Compact Disc. Clin. Chem. 2006, 52, 2135–2140. [Google Scholar] [CrossRef]
- Giannios, P.; Toutouzas, K.G.; Matiatou, M.; Stasinos, K.; Konstadoulakis, M.M.; Zografos, G.C.; Moutzouris, K. Visible to near-infrared refractive properties of freshly-excised human-liver tissues: Marking hepatic malignancies. Sci. Rep. 2016, 6, 27910. [Google Scholar] [CrossRef]
- Sun, Y.; Sun, S.; Wu, M.; Gao, S.; Cao, J. Refractive index sensing using the metal layer in DVD-R discs. RSC Adv. 2018, 8, 27423–27428. [Google Scholar] [CrossRef]
- Sadeghi, Z.; Shojaeihagh, N.; Shirkani, H. Multiple-step graphene grating optical sensors based on surface plasmons in IR range for ultra-sensing biomolecules. Mater. Sci. Eng. B 2021, 265, 114988. [Google Scholar] [CrossRef]
- Chen, L.; Li, J.; Liu, J.; Yang, H. A Ag–Au bimetallic nanograting surface plasmon resonance sensor based on a prism structure. Opt. Commun. 2020, 461, 125105. [Google Scholar] [CrossRef]
- Zhao, M.; Wang, J.; Zhang, Y.; Ge, M.; Zhang, P.; Shen, J.; Li, C. Self-referenced refractive index sensor based on double-dips method with bimetal-dielectric and double-groove grating. Opt. Express 2022, 30, 8376. [Google Scholar] [CrossRef]
Disclaimer/Publisher’s Note: The statements, opinions and data contained in all publications are solely those of the individual author(s) and contributor(s) and not of MDPI and/or the editor(s). MDPI and/or the editor(s) disclaim responsibility for any injury to people or property resulting from any ideas, methods, instructions or products referred to in the content. |
© 2023 by the authors. Licensee MDPI, Basel, Switzerland. This article is an open access article distributed under the terms and conditions of the Creative Commons Attribution (CC BY) license (https://creativecommons.org/licenses/by/4.0/).