Article

Optimized Design of Plasma Metamaterial Absorber Based on Machine Learning

1
Guangdong Provincial Key Laboratory of Nanophotonic Functional Materials and Devices, School of Information and Optoelectronic Science and Engineering, South China Normal University, Guangzhou 510006, China
2
Guangdong Education Center of Optoelectronic Information Technology, South China Normal University, Guangzhou 510006, China
*
Author to whom correspondence should be addressed.
Photonics 2023, 10(8), 874; https://doi.org/10.3390/photonics10080874
Submission received: 4 July 2023 / Revised: 22 July 2023 / Accepted: 26 July 2023 / Published: 27 July 2023

Abstract

:
Metamaterial absorbers have become a popular research direction due to their broad application prospects, such as in radar, infrared imaging, and solar cell fields. Usually, nanostructured metamaterials are associated with a large number of geometric parameters, and traditional simulation designs are time consuming. In this paper, we propose a framework for designing plasma metamaterial absorbers in both a forward prediction and inverse design composed of a primary prediction network (PPN) and an auxiliary prediction network (APN). The framework can build the relationship between the geometric parameters of metamaterials and their optical response (reflection spectra, absorption spectra) from a large number of training samples, thus solving the problem of time-consuming and case-by-case numerical simulations in traditional metamaterial design. This framework can not only improve forward prediction more accurately and efficiently but also inverse design metamaterial absorbers from a given required optical response. It was verified that it is also applicable to absorbers of different structures and materials. Our results show that it can be used in metamaterial absorbers, chiral metamaterials, metamaterial filters, and other fields.

1. Introduction

The concept of metamaterial absorbers refers to materials that can absorb specific band electromagnetic radiation and have high absorption rates that highly depend on their composition and structure [1,2]. Metamaterials are a class of materials composed of artificially designed microstructural units with specific geometries [3]. They exhibit remarkable properties, including negative refraction, super-transmission, and super-absorption, which result mainly from the unique structure and size of their constituent microstructural units. Metamaterials have larger surface areas, stronger interfacial effects, and greater degrees of freedom than traditional materials due to their much smaller size scales [4]. As a consequence, metamaterials have wide-ranging applications, spanning electromagnetic wave absorption [5,6,7], lenses [8,9,10], sensors [11], nano-optics [12,13,14], solar absorbers [15,16,17], transparent conductive films [18], and more. Numerous studies and applications of metamaterials have already been reported in various fields, particularly regarding the rapid development of metasurfaces and metalenses. Zhou et al. expanded the design space of meta-optics by designing bilayer dielectric metasurface realization [19]. The development of metasurface technology has provided the conditions for digital optical holograms. Ren et al. used orbital angular momentum holography to realize the multiplexing of up to 200 independent orbital angular momentum channels [20]. Mohammadreza et al. fabricated a superlens with a digital aperture of 0.8 using a titanium dioxide hypersurface with a high aspect ratio, achieving a high focusing efficiency [9]. This is groundbreaking for applications in both imaging and spectroscopy.
Machine learning (ML) is an expanding field that has immense potential to transform the approach we take toward tackling complex problems across various industries, such as finance [21,22], healthcare [23,24], weather [25,26], and others. The aided design of ML promotes the development of nanophotonics [27]. Ma et al. implemented forward and inverse predictions of chiral metamaterials using a two-way stacking neural network, demonstrating that deep learning can be used as a tool to accelerate the design of nanophotonic devices [28]. Meanwhile, Liu et al. found that generative adversarial networks (GAN) can effectively improve the speed of metasurface inverse design [29]. Essentially, ML entails training algorithms to detect patterns in vast datasets and use these patterns to draw predictions or decisions [30]. With the recent surge in computing power, data storage, and parallel processing, machines can now analyze huge volumes of data rapidly and accurately [31]. This enables them to resolve problems that were once considered insurmountable. For instance, Hou et al. employed the FNN model to establish a mapping relationship between the geometric parameters (d, r, θ) of the split ring and the reflection spectrum and utilized the RNN model to retrofit the metamaterial absorber units [32]. Li et al. proved that a deep neural network could process six geometric parameters accurately to predict the phase values and accomplish a direct inverse design-on-demand phase requirement for the hypersurface [33]. Gu et al. proposed an integrated learning method (XGBoost, LightGBM) to achieve forward prediction and inverse design of structural parameters and reflection spectrum, with prediction accuracies of 0.956 and 0.967, respectively [34]. In another study, Han et al. utilized a deep neural network to establish a correlation between structural parameters of irregular metamaterial perfect absorbers and absorption, thereby simplifying the design of such absorbers [35]. However, these pioneering works encountered several issues, including large errors when predicting results for regions with fluctuating wave spectra in the case of forward prediction. Meanwhile, for inverse design, the proposed algorithm’s efficacy in designing metamaterial absorbers has not been specifically tested. Additionally, it remains to be seen whether the proposed algorithm can be applied to metamaterial absorbers constructed with other materials and structures. Finally, in the pioneering studies, their models were mainly focused on neural networks, and a single performance metric was chosen.
In this work, we propose a framework for designing metamaterial absorbers based on machine learning. The framework comprises two main components: the PPN and the APN. The APN is used to optimize the performance of the PPN by refining its predictions. We used the framework to investigate the impact of geometric parameters, as well as reflection and absorption spectra, on the design of metamaterial absorbers. We use five performance metrics to validate the model’s framework (MSE, MAE, RMSE, R, R2, Error). For forward prediction, we developed a method to predict the absorption or reflectance spectrum at a single point. This approach improves prediction accuracy and avoids the issue of uniqueness, which occurs when two or more points on the spectrum have the same value. In inverse design, the absorption spectrum is better for measuring the performance of the geometric parameters of the metamaterial. The metamaterial we designed using the inverse approach achieved a maximum absorption rate of 98.5%. Compared with the reflectance spectrum, the absorption spectrum is better suited for designing plasma metamaterial absorbers. In order to verify the applicability of our proposed framework, we validate it in two metamaterial absorbers with different structures and materials.

2. Materials and Methods

2.1. FDTD Model Building

To study the prediction and design of PPN and APN in a metamaterial absorber, we model a three-layer structure of the metamaterial. The top and bottom layers are made of gold material (including two split rings and the rectangular patch), and the middle layer is made of silica material. The permittivity of gold is given by Drude model with the plasma frequency ω P = 9 × 1 0 15   s 1 and the collision frequency γ = 3.33 × 1 0 13   s 1 . The refractive index of the dielectric (SiO2) is 1.4585. The schematic diagram of the structure is shown in Figure 1.
The simulation was carried out using the finite-difference time-domain (FDTD) method with the commercial software Lumerical FDTD Solutions (Lumerical Inc., Vancouver, BC, Canada). The periodic boundary condition was applied in the x-axis and y-axis, and the z-axis boundary condition was a perfectly matched layer (PML). We are currently studying the first type of perfect metamaterial absorber, which operates at visible frequencies (1 micron to 2 microns). The absorption is calculated formula using Equation (1).
A = 1 R T
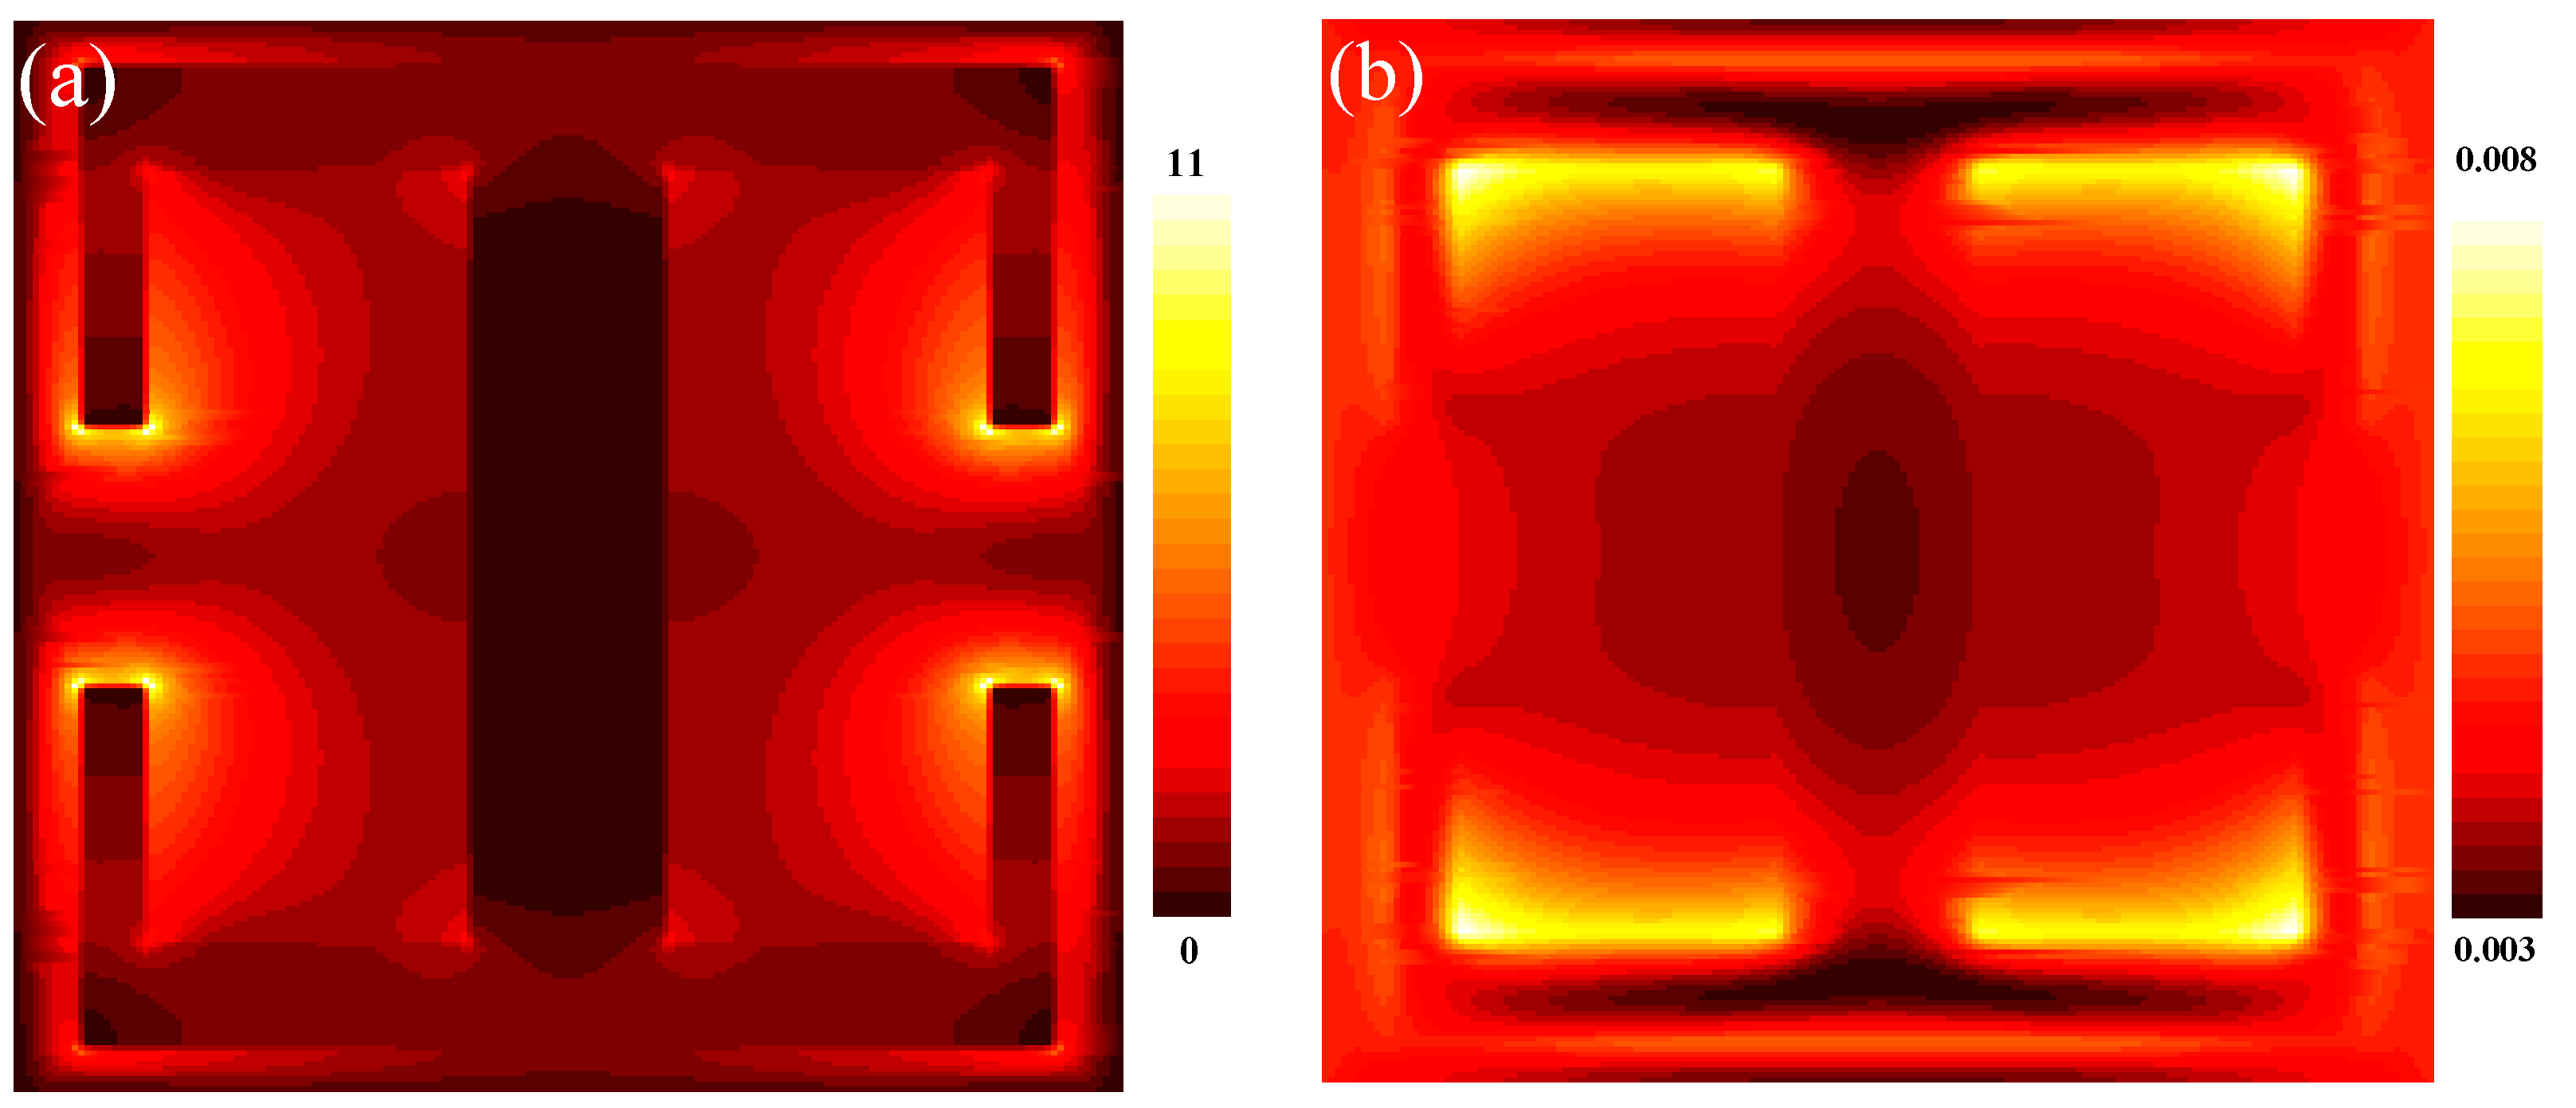
Figure 2a,b, respectively display the distribution of the electric field |E| and the magnetic field |H|. The electric field is weak, while the magnetic field is distributed in both SRRs, mainly concentrating outside the rectangular patch.

2.2. Forward Prediction and Inverse Design

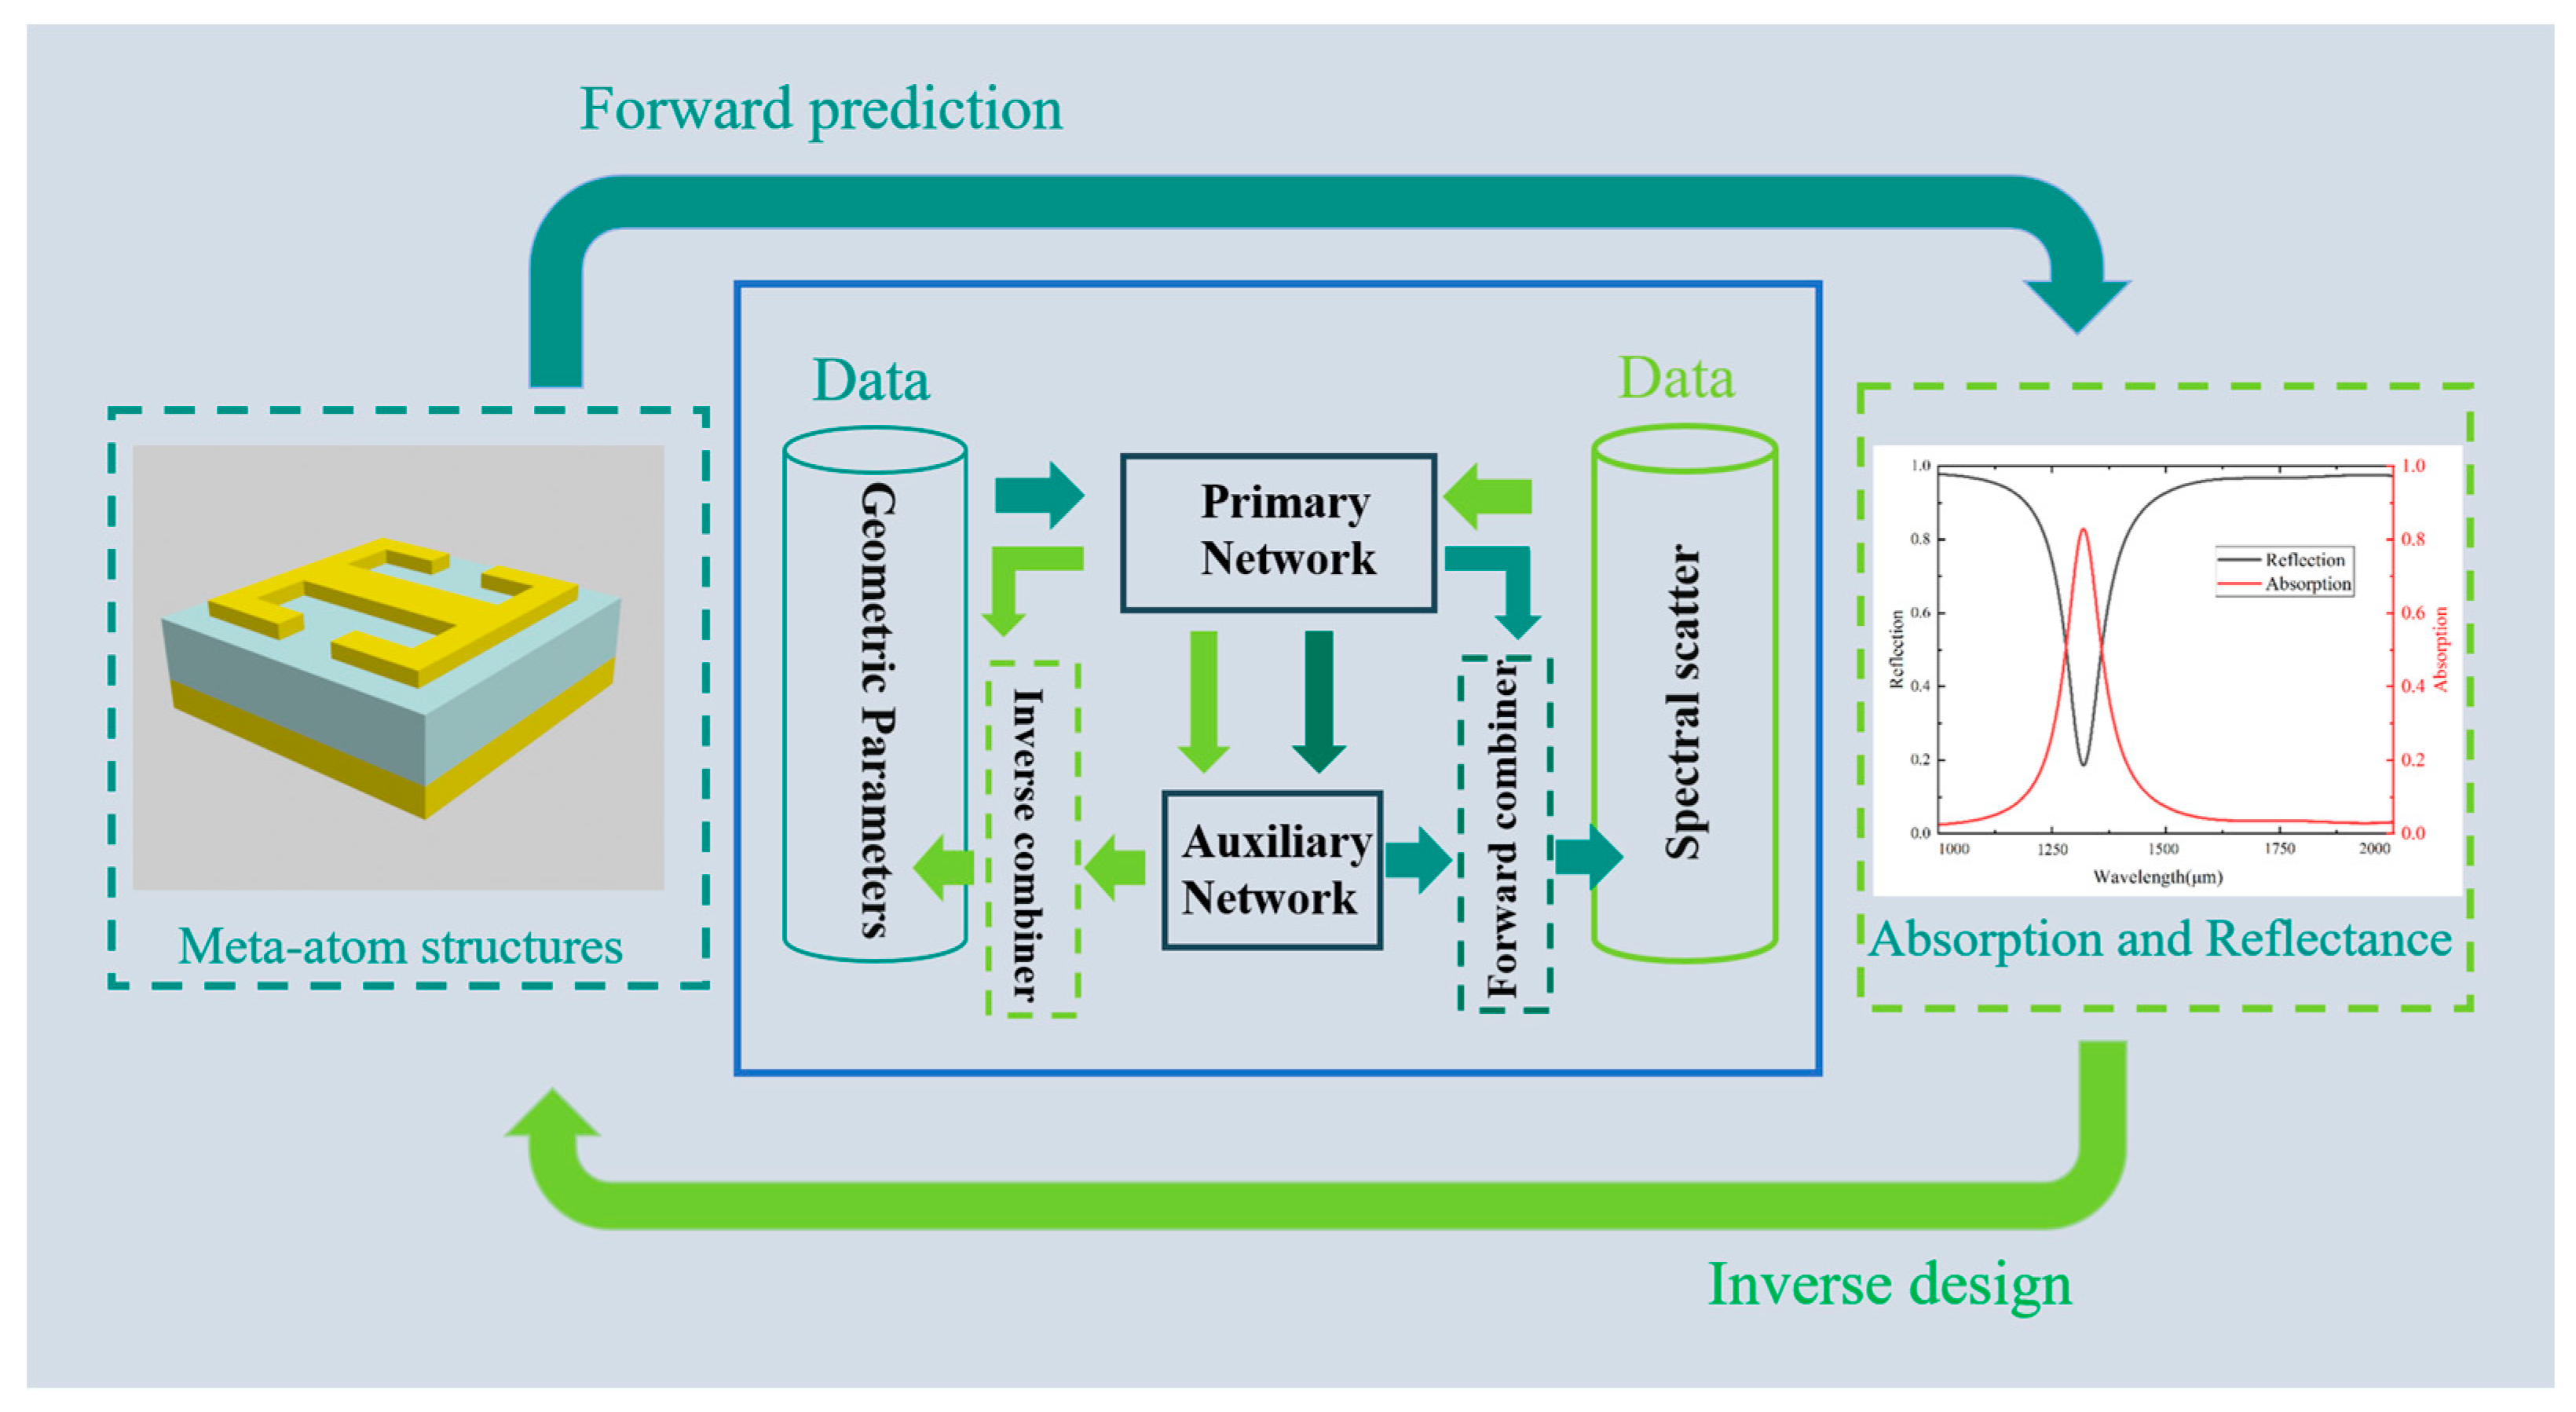
Figure 2a,b, respectively, display the distribution of the electric field |E| and the magnetic field |H|. The electric field is weak, while the magnetic field is distributed in both SRRs, mainly concentrating outside the rectangular patch. The process of designing metamaterial absorbers is depicted in Figure 3. To mitigate the issue of spikes leading to large deviations in prediction results, an auxiliary network is added to the primary network prediction. The former corrects the data with significant deviations, and the optimal results of both networks are combined for the output. The forward prediction network (FPN) (represented with a dark green arrow) takes the geometric parameters as inputs and produces absorption or reflection spectra as model outputs via the PPN and APN models. Conversely, the input and output data for the inverse design network are the reverse of the FPN. The feature values are linearly normalized, and the dataset is shuffled to prevent overfitting resulting from the dataset’s order randomness. The input data’s training set and testing set ratio for the FPN and IDN models is 9:1.

2.3. Primary Prediction Network

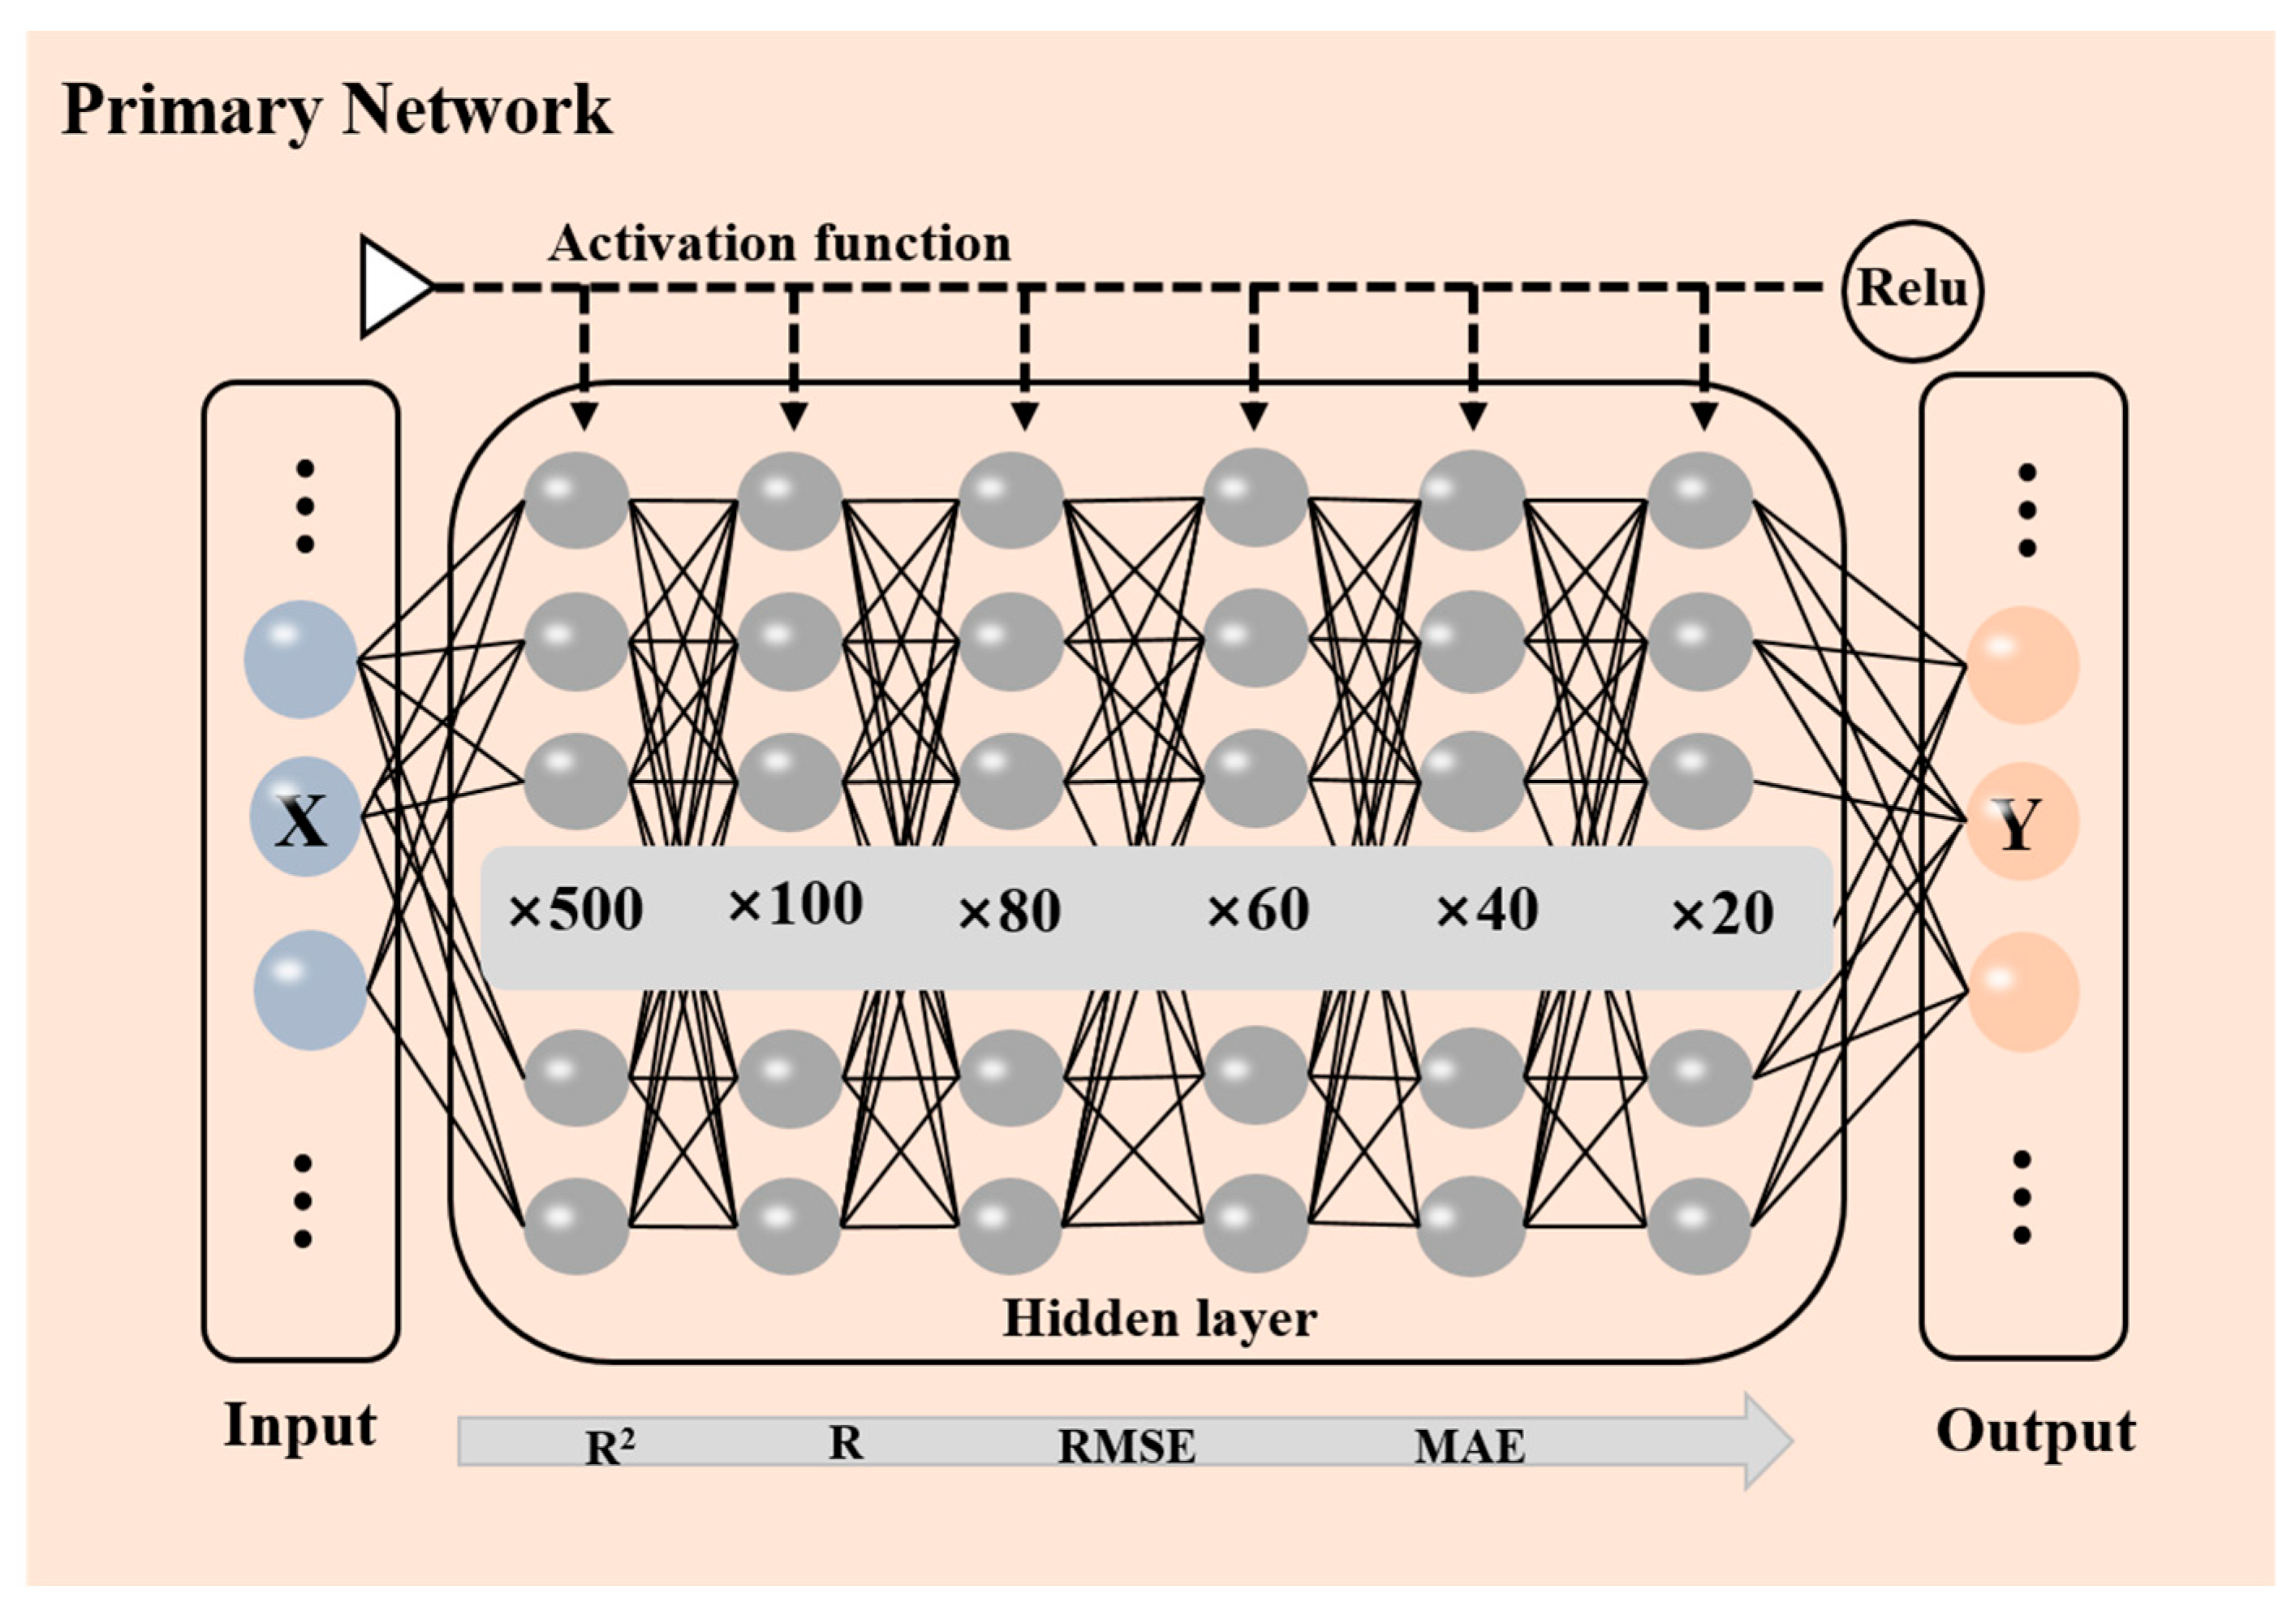
The primary prediction network diagram, as illustrated in Figure 4, is composed of an input layer, six hidden layers, and an output layer. The hidden layer comprises six layers, and each layer has 500, 100, 80, 60, 40, and 20 neurons, respectively. The activation function used in this model is the Rectified Linear Unit (Relu). The performance evaluation metrics employed to assess both the primary and auxiliary networks include the fitting coefficient (R2) [36], Pierce correlation coefficient [37], Root Mean Square Error (RMSE) [38], and Mean Absolute Error (MAE) [39].
The objective function of the primary network is calculated using Equation (2). A deep neural network is a complex neural network model that contains multiple nonlinear layers. Each neuron calculates using a nonlinear activation function and transfers weights via matrix multiplication, enabling the network to extract feature information layer by layer and achieve higher-level abstract representation for more precise and effective classification and prediction results. The primary prediction network core parameters are set, as shown in Table 1.
y w , b ( x ) = f ( i w i x i + b )

2.4. Auxiliary Prediction Network

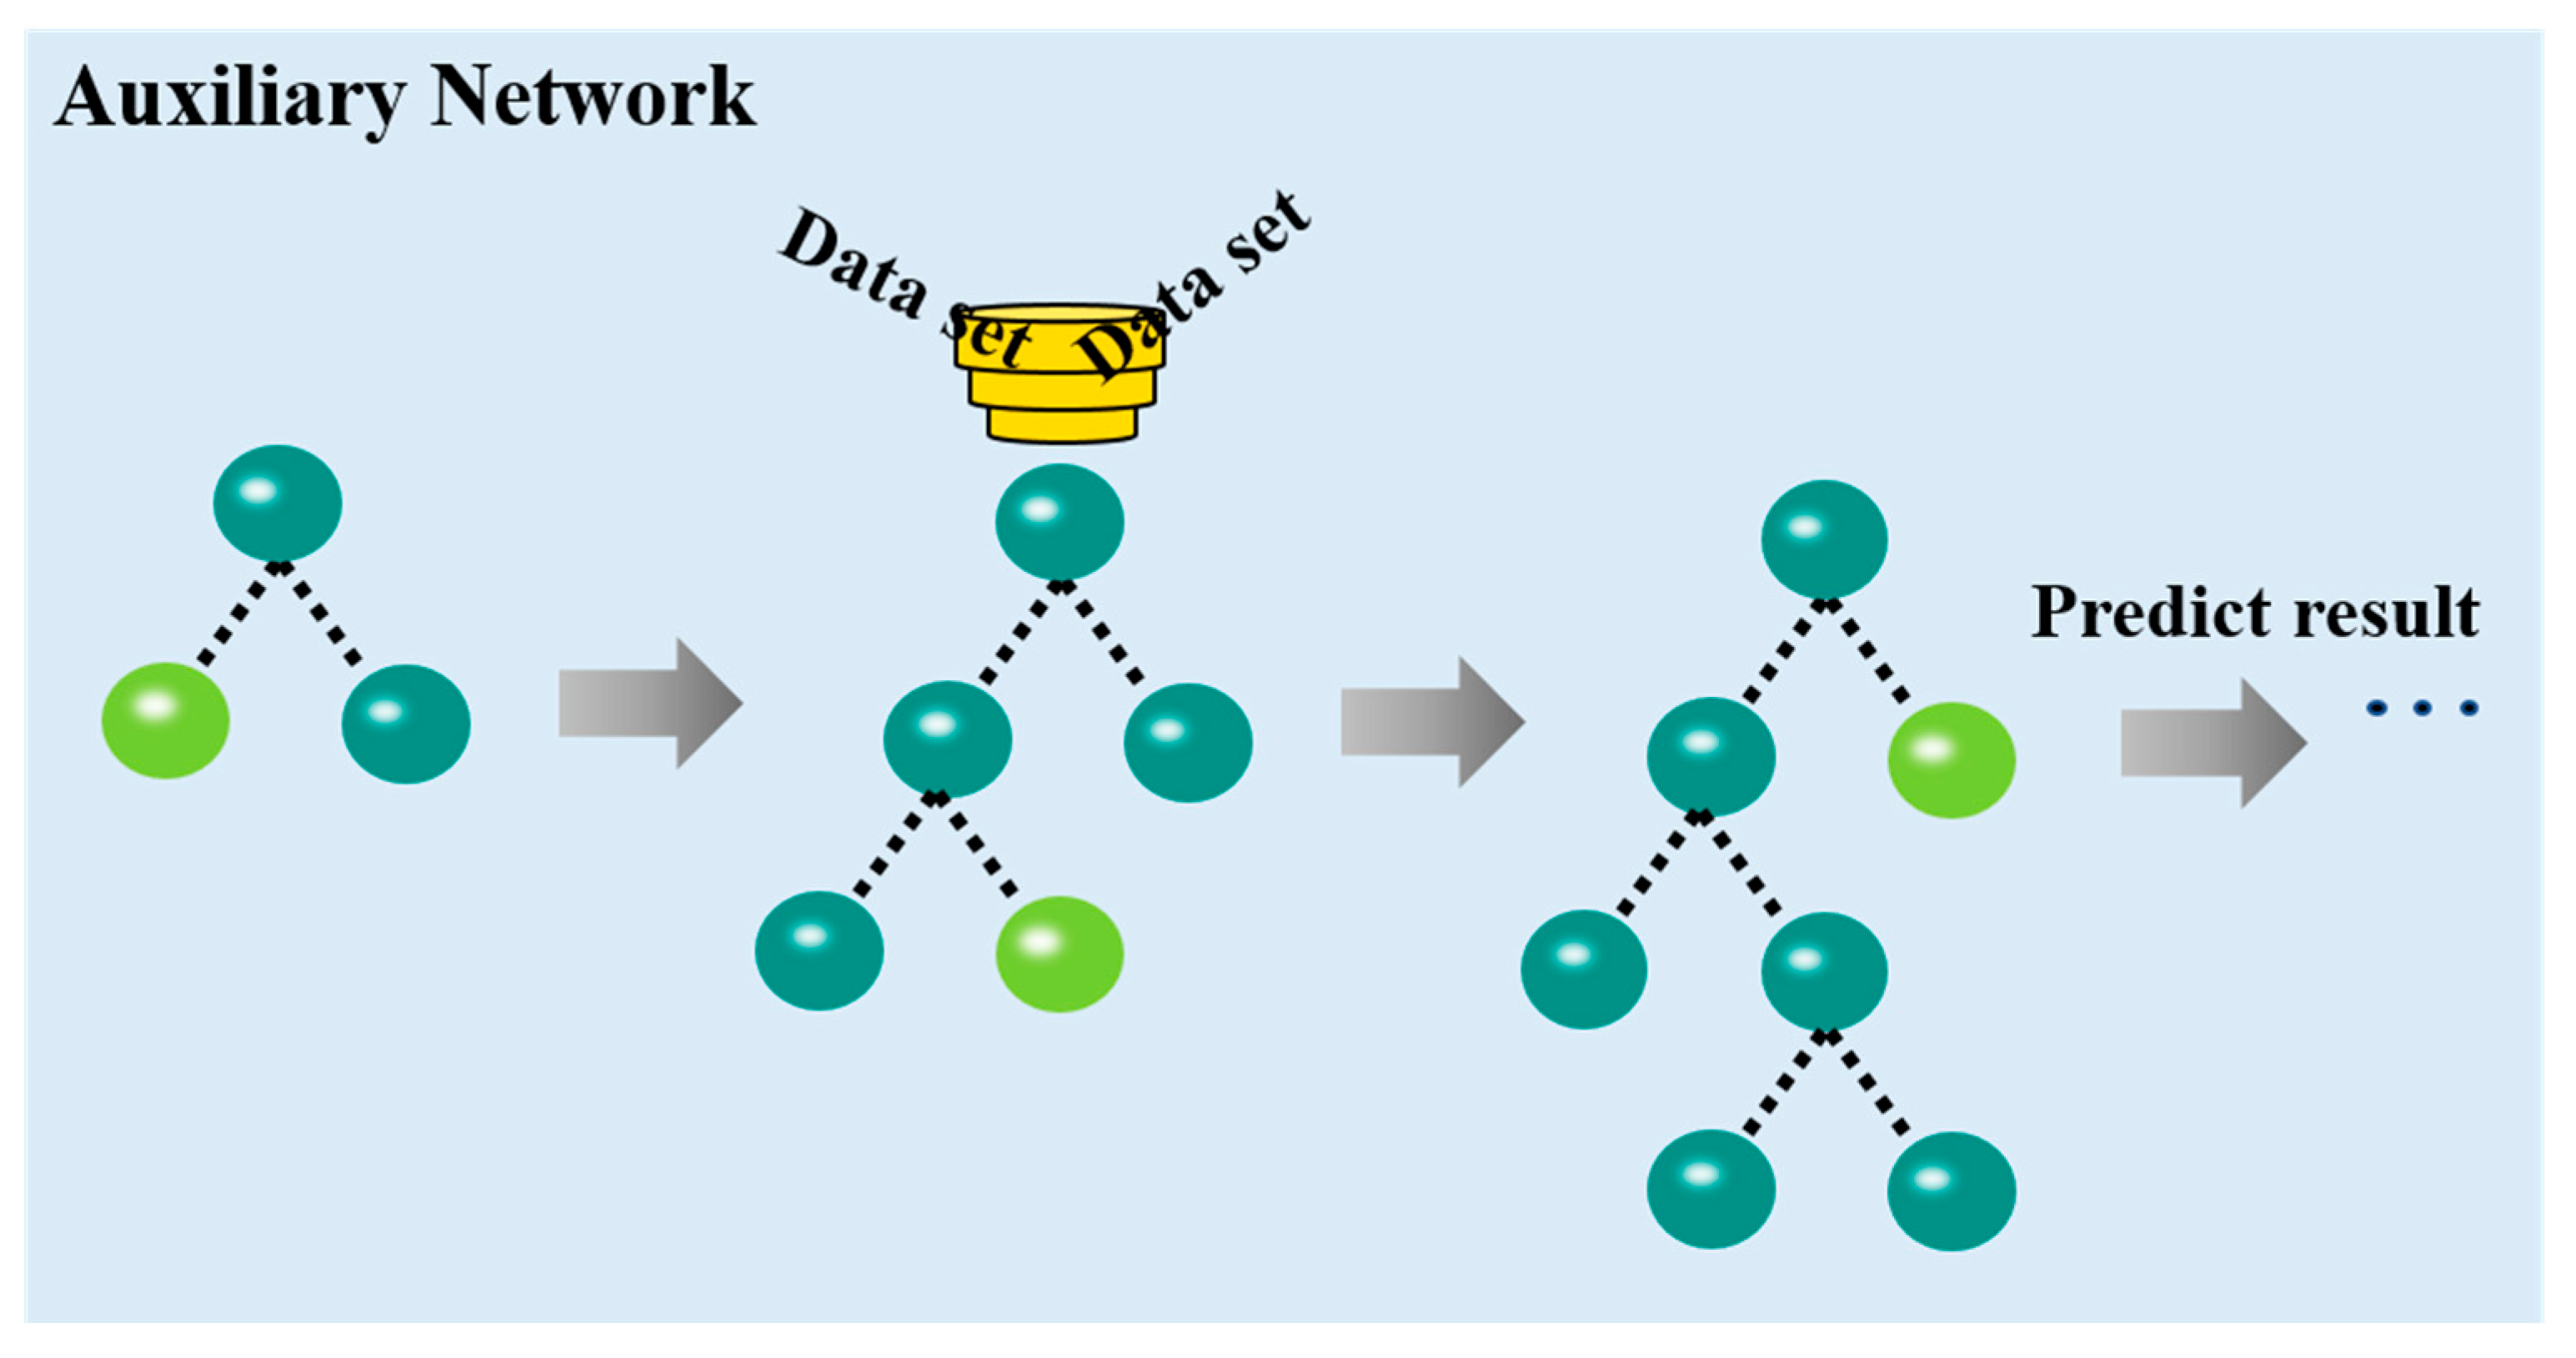
Auxiliary network belongs to the decision tree algorithm for histograms. It uses leaf-wise leaf growth strategy with depth limitation (Figure 5) [40]. It is a fast and distributed gradient-boosting framework based on the decision tree algorithm [41]. It uses a specialized histogram algorithm for efficient data splitting and storage, thus saving memory and time during the training process. It also provides feature parallel training, supports multi-threading for reading data files, and enables multi-machine distributed computing, which improves the speed and scalability of the model training. The core of it is the decision tree algorithm, which uses a gradient-based algorithm to split tree nodes during tree construction and employs GOSS and EFB technologies to further reduce gradient calculation time and improve algorithm efficiency. The auxiliary network is shown in Equation (3). The auxiliary network core parameters are set, as shown in Table 2.
F o b j ( θ ) = L ( θ ) + Ω ( θ ) = l ( y i + ϒ T + 1 2 | | w | | 2 )

3. Results and Discussion

3.1. FDTD Simulation

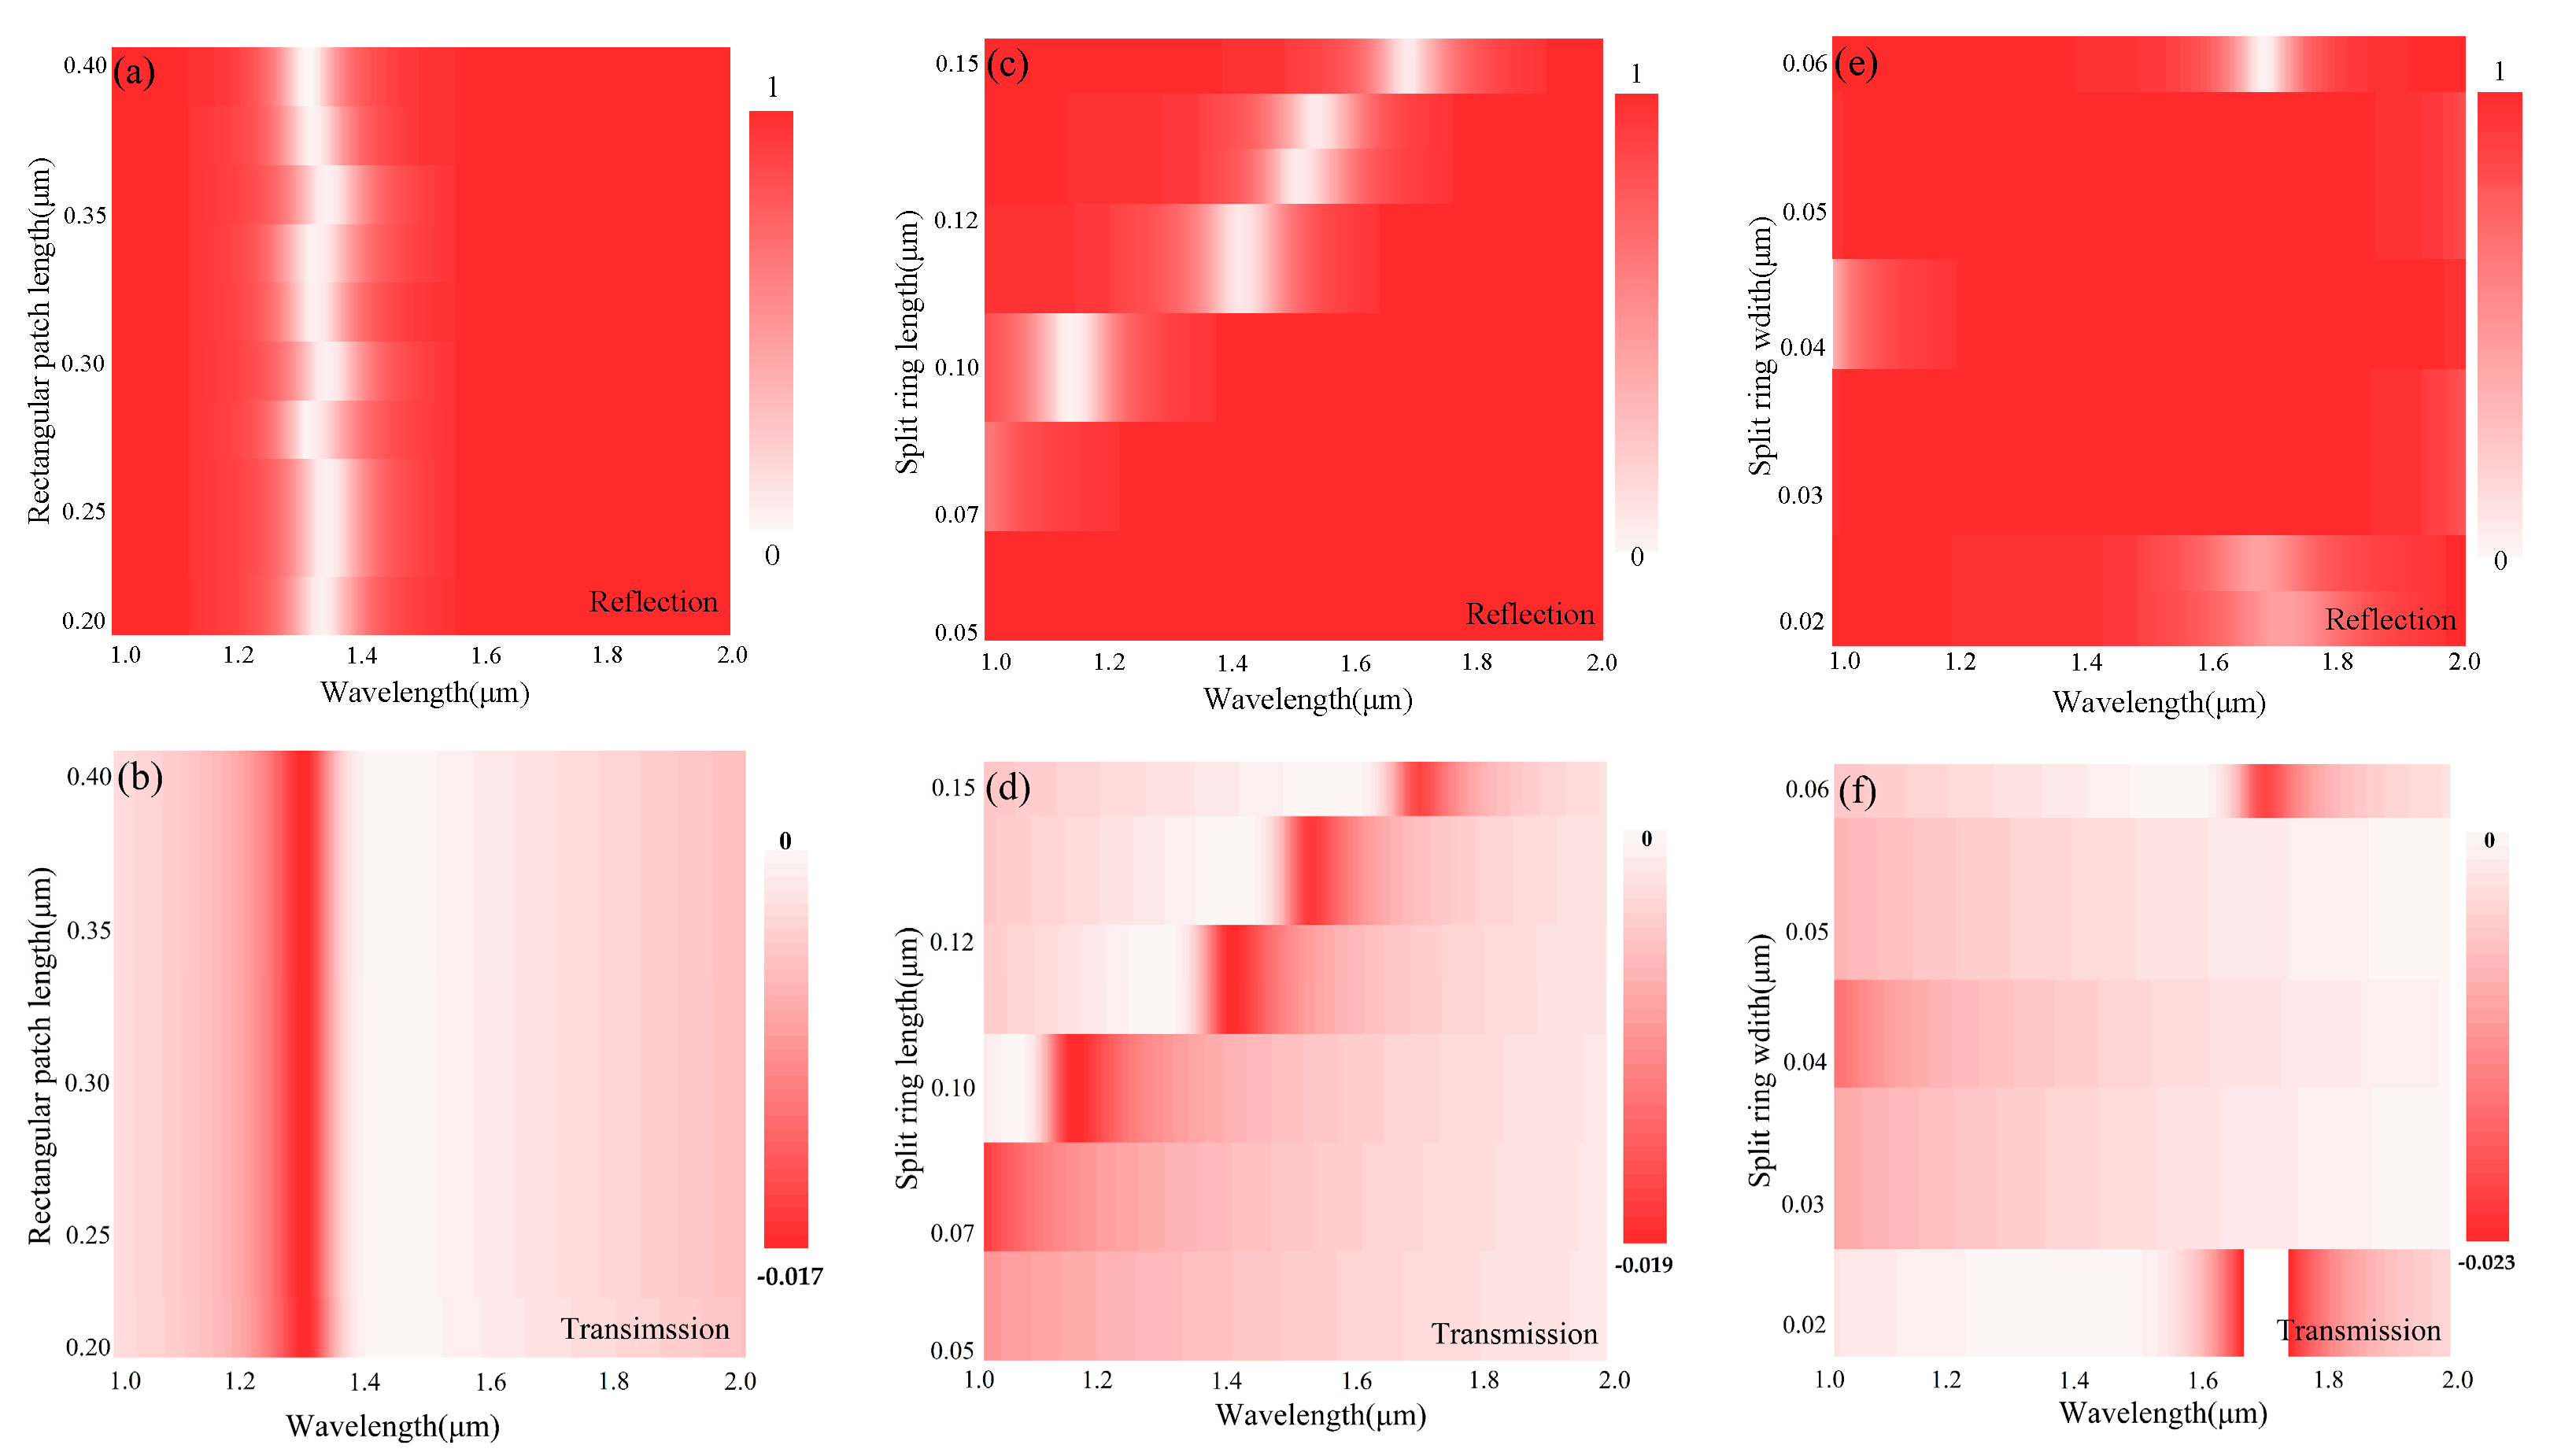
Figure 6 shows the effects of different geometric parameters on reflectance and transmittance. Figure 6a,b show the reflectance and transmittance of the length of the scanning rectangular patch at different wavelengths, and the range of the scanning patch length is 0.2–0.4 µm. Figure 6c–f are the schematic diagrams of the reflection and transmittance varying with the length and width, respectively. Geometric parameters of the rectangular patch and split-ring resonator can control the variation of transmittance and reflectance. Therefore, we utilized their corresponding geometric parameters as the research focus for metamaterial absorbers.

3.2. Forward Prediction

In the forward design, we used 10 geometric parameters as inputs to the model and the reflectance spectrum (absorption spectrum) as the predicted output. When using FDTD simulation, we sampled 400 points for the reflectance spectrum (absorption spectrum). In previous tests, fewer inputs predicted more outputs could easily cause the prediction network to struggle to accurately identify each feature, leading to increased prediction errors. And the non-uniqueness in predictions can lead to increased error. Therefore, our model adopts a one-to-many prediction method, making individual predictions for each reflectance (absorbance) point and conducting 400 rounds of cycling experiments.
Figure 7 shows the performance metrics (RMSE, MAE) of APN and PPN in predicting the reflectance and absorbance spectra. RMSE and MAE (Mean Absolute Error) are performance metrics that measure the magnitude of prediction stability. Comparing the prediction results of PPN and APN for the 400 points of absorbance and reflectance spectra, we found that the maximum values of RMSE and MAE are 2.99 × 10⁻³ and 2.09 × 10⁻³, respectively. Compared with the predicted results of the reflectance spectra, the prediction stability for the absorbance spectra is better, with smaller values of RMSE and MAE (1.47 × 10⁻⁵, 1.01 × 10⁻⁵).
The performance measurements (R, R2) of the PPN model and APN model to predict absorption and reflection spectra are shown in Figure 8. All the Pearson correlation coefficients between the input geometric parameters and the corresponding reflectance and absorption spectra exceeded 0.950, with an average of 0.999 (APN). The fitting coefficient of the absorption spectra (average R2: 0.999) was more stable compared to the predicted reflectance spectra (Table 3).
Although the absorption spectrum and reflection spectrum have the same average performance measure in predicting them, the smallest fitting coefficient in the prediction of the reflection spectrum is 0.971 (absorption spectrum Rmin2: 0.990), and the performance metrics fluctuate more. The forward prediction of the absorption spectrum shows a more stable and accurate performance.
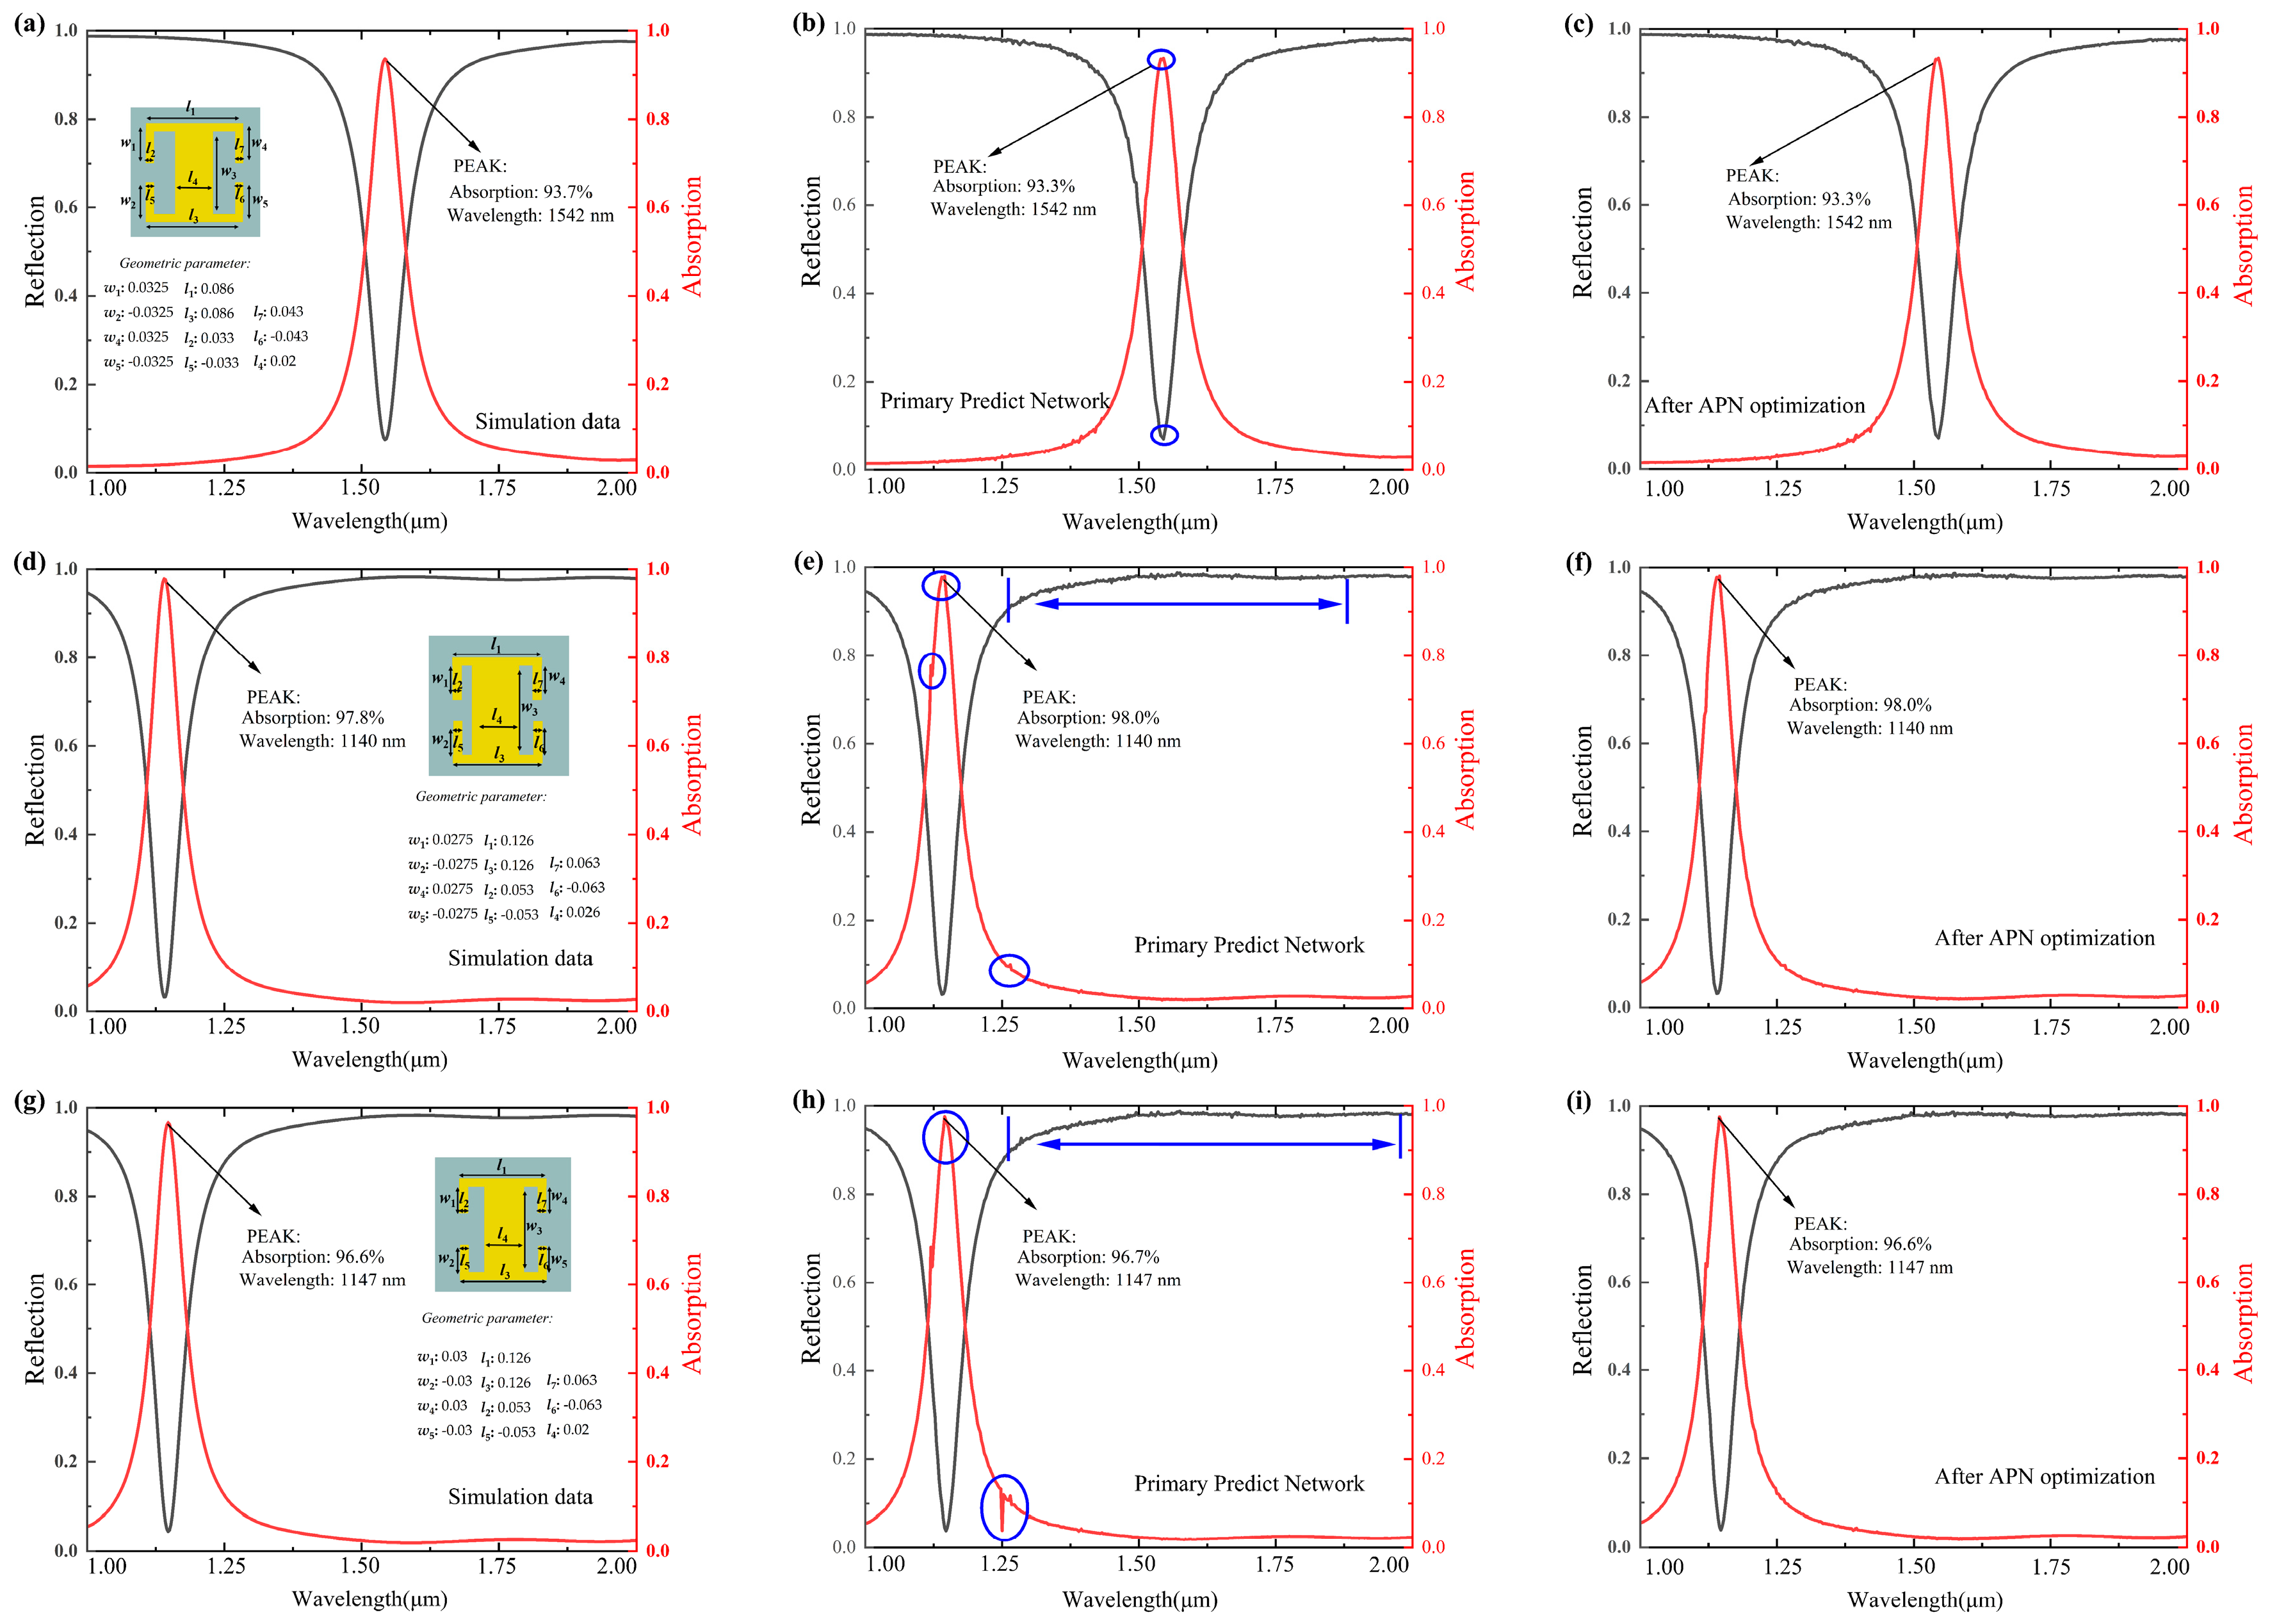
In order to verify the applicability of the model, three different geometric parameters were selected as inputs to the model, and the predicted results were compared with the FDTD simulation results. Figure 9a,d,g represent different geometric parameters input to the model test (reflection spectrum and absorption spectrum are FDTD simulation); Figure 9b,e,h are absorption spectrum and reflection spectrum predicted by PPN model; Figure 9c,f,i are the results predicted and optimized by APN for PPN model. Figure 9a shows the input geometric parameters of 0.0325, −0.0325, 0.0325, −0.0325, 0.086, 0.086, 0.033, −0.033, 0.043, and −0.043. Figure 9b shows the predicted results of PPN; we can see that the absorption peak is predicted to be 93.3%, and the data of FDTD simulation are 93.7%. After the APN optimization, the absorption peak is 93.6%. The absorption peak of the FDTD simulation with geometric parameters in Figure 9d is 97.8%, and the PPN and APN predictions are 98.0%, with an error of 0.002. In Figure 9g, the PPN shows fluctuations in the absorption peak with the prediction at 1.25 µm, and after the APN optimization, the absorption peak is consistent with the FDTD model simulation.
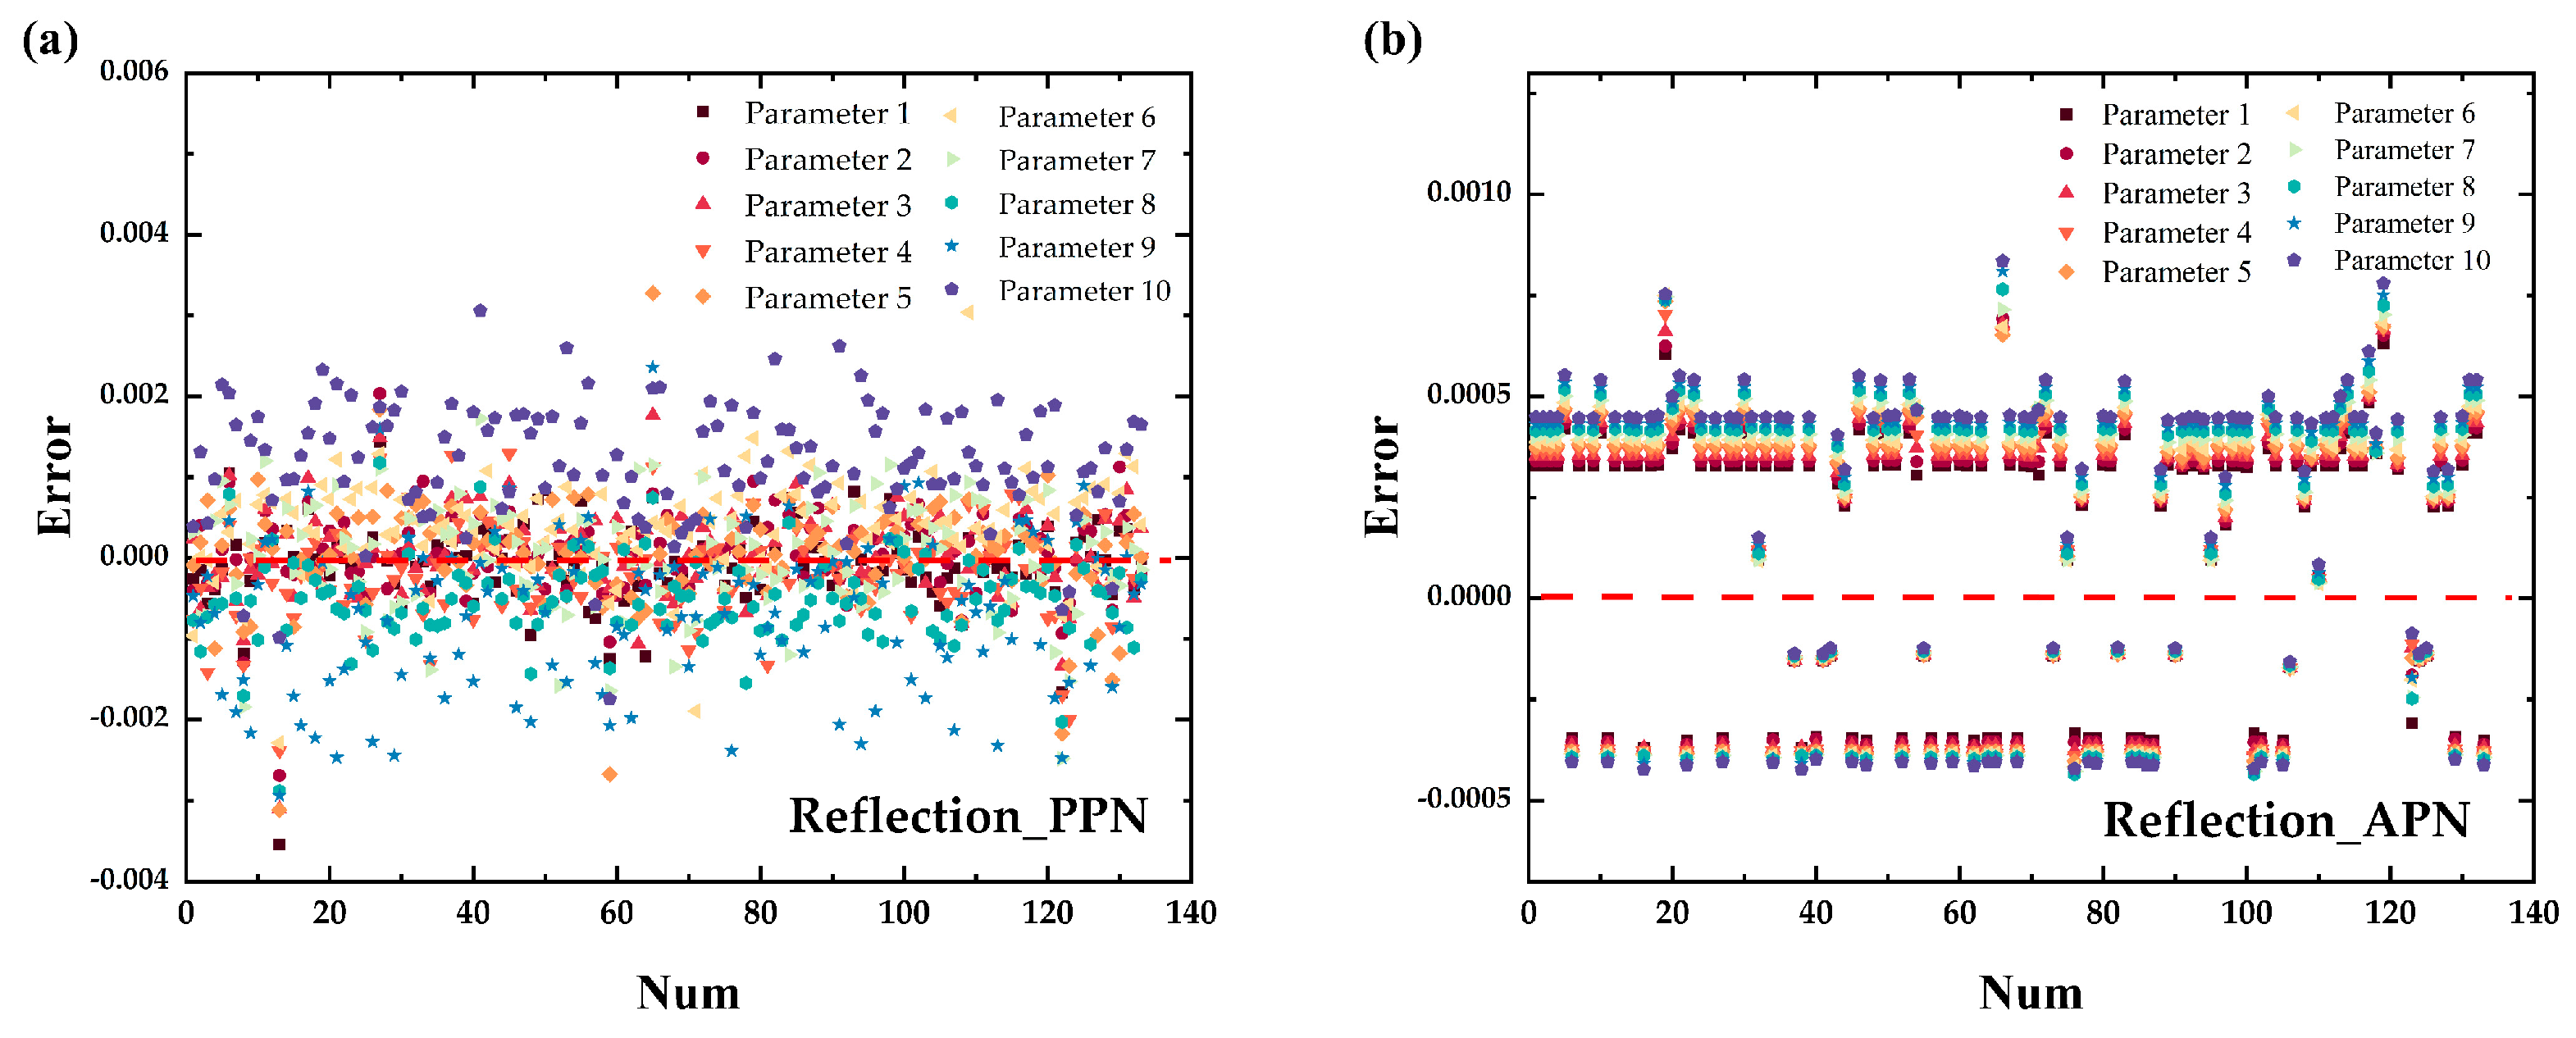
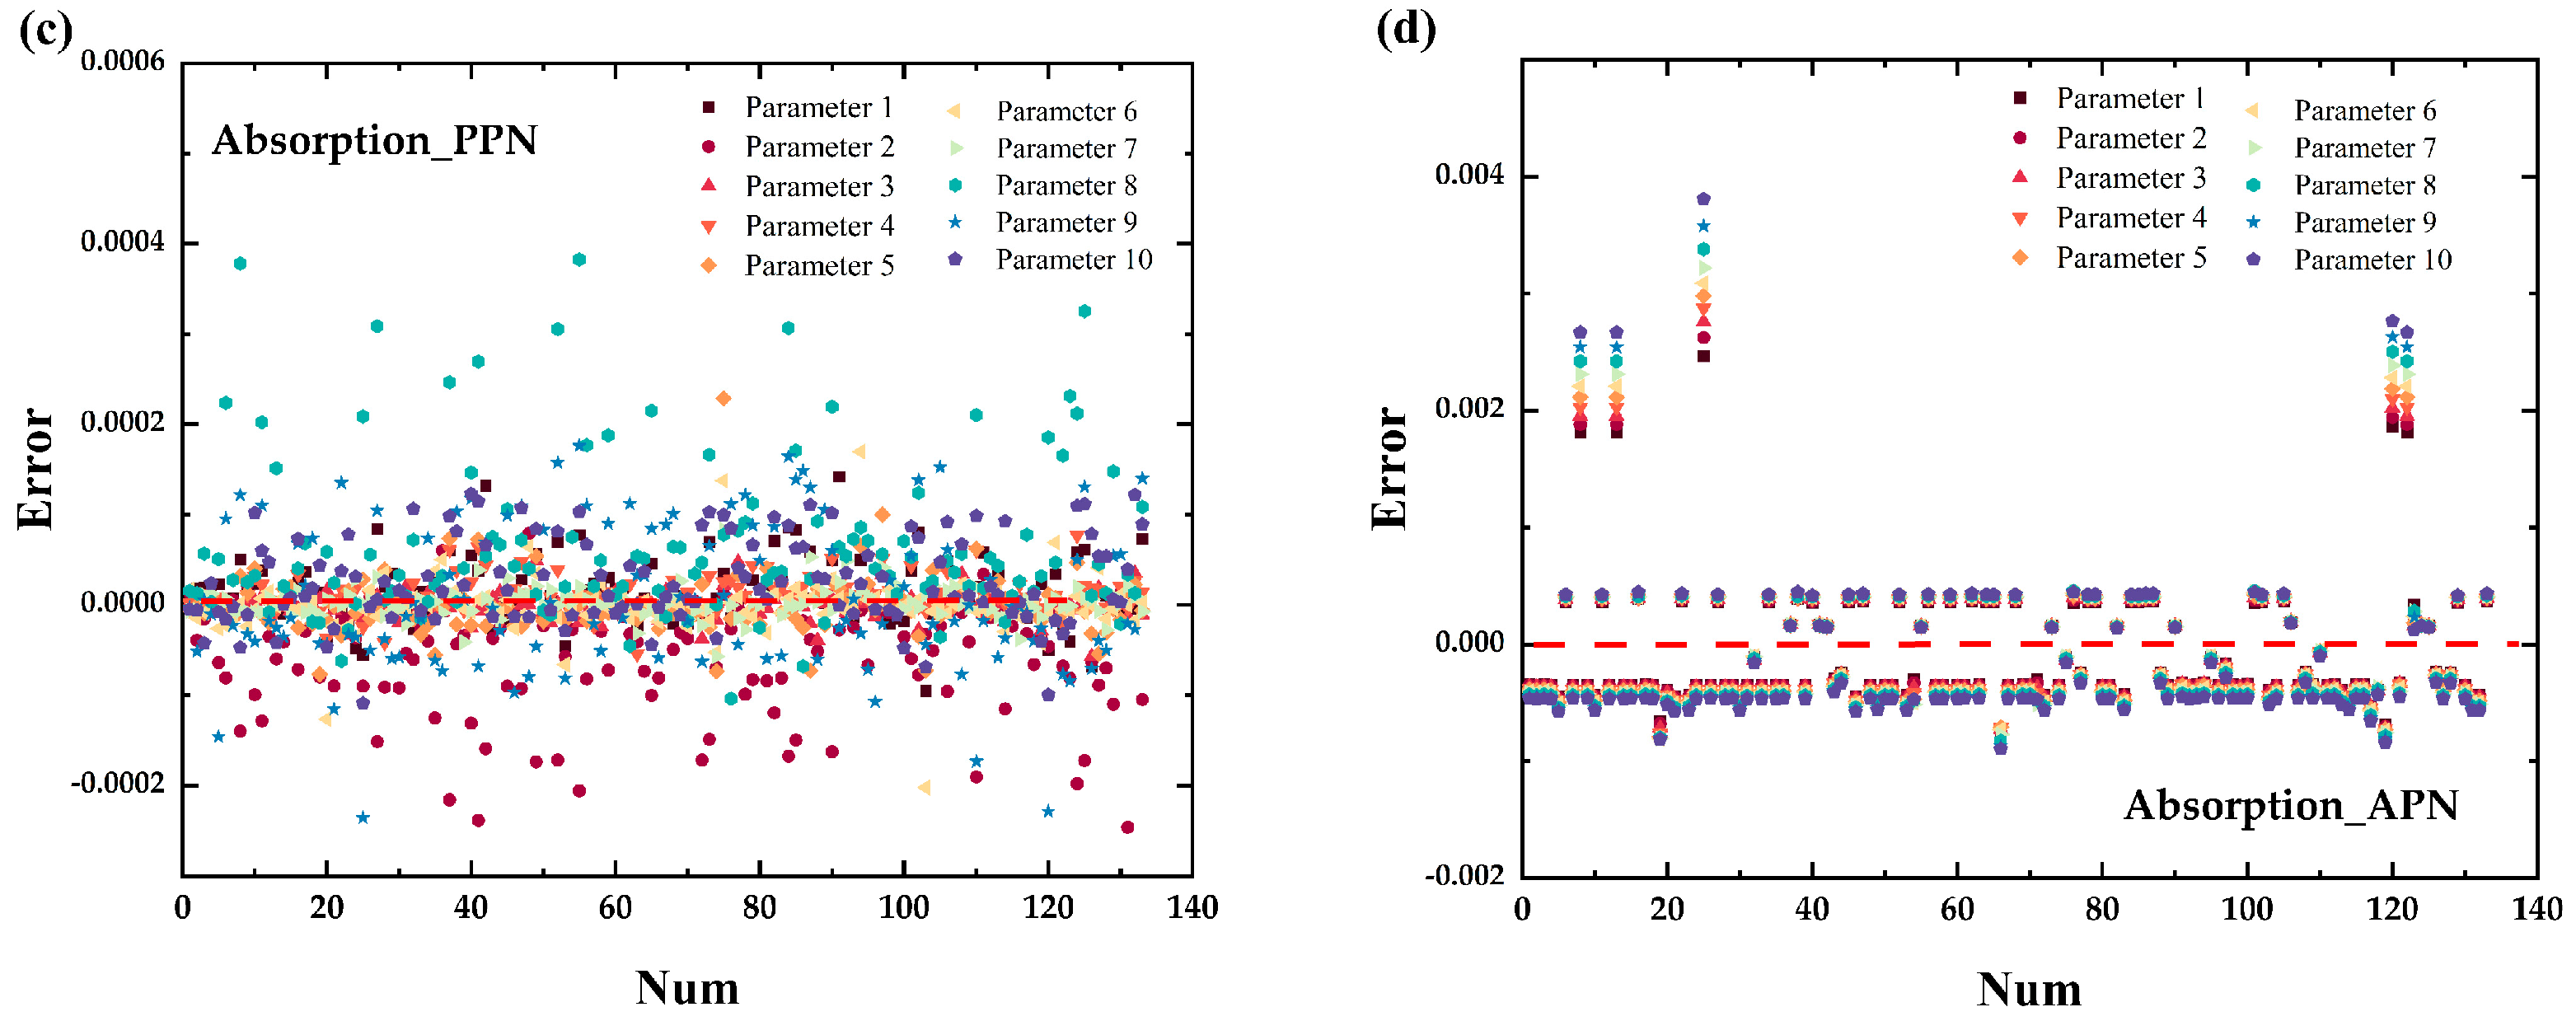
The errors predicted by the two models are shown in Figure 10. There are a total of 400 data points in the spectrum prediction. In order to illustrate the error more clearly in the figure, we selected the first 10 data points for error statistics. The red dotted line means zero error. In reflection spectrum prediction, the prediction error range for PPN is between −4.3 × 10⁻³ and 3.3 × 10⁻³, and the range of APN is −3.7 × 10⁻³ to 8.3 × 10⁻³. The samples with errors less than 0.001 have 1101 samples for the PPN model (a total of 1330 samples). In absorption spectrum prediction, the PPN model has an error range of −2.5 × 10⁻⁴ to 1.2 × 10⁻⁴, and the APN is −8.9 × 10⁻⁴ to 3.8 × 10⁻³. Among the samples with errors less than 0.0001, the PPN model has 1230 samples. The results show that the error of predicting the absorption spectrum is smaller than that of predicting the reflection spectrum.

3.3. Inverse Design

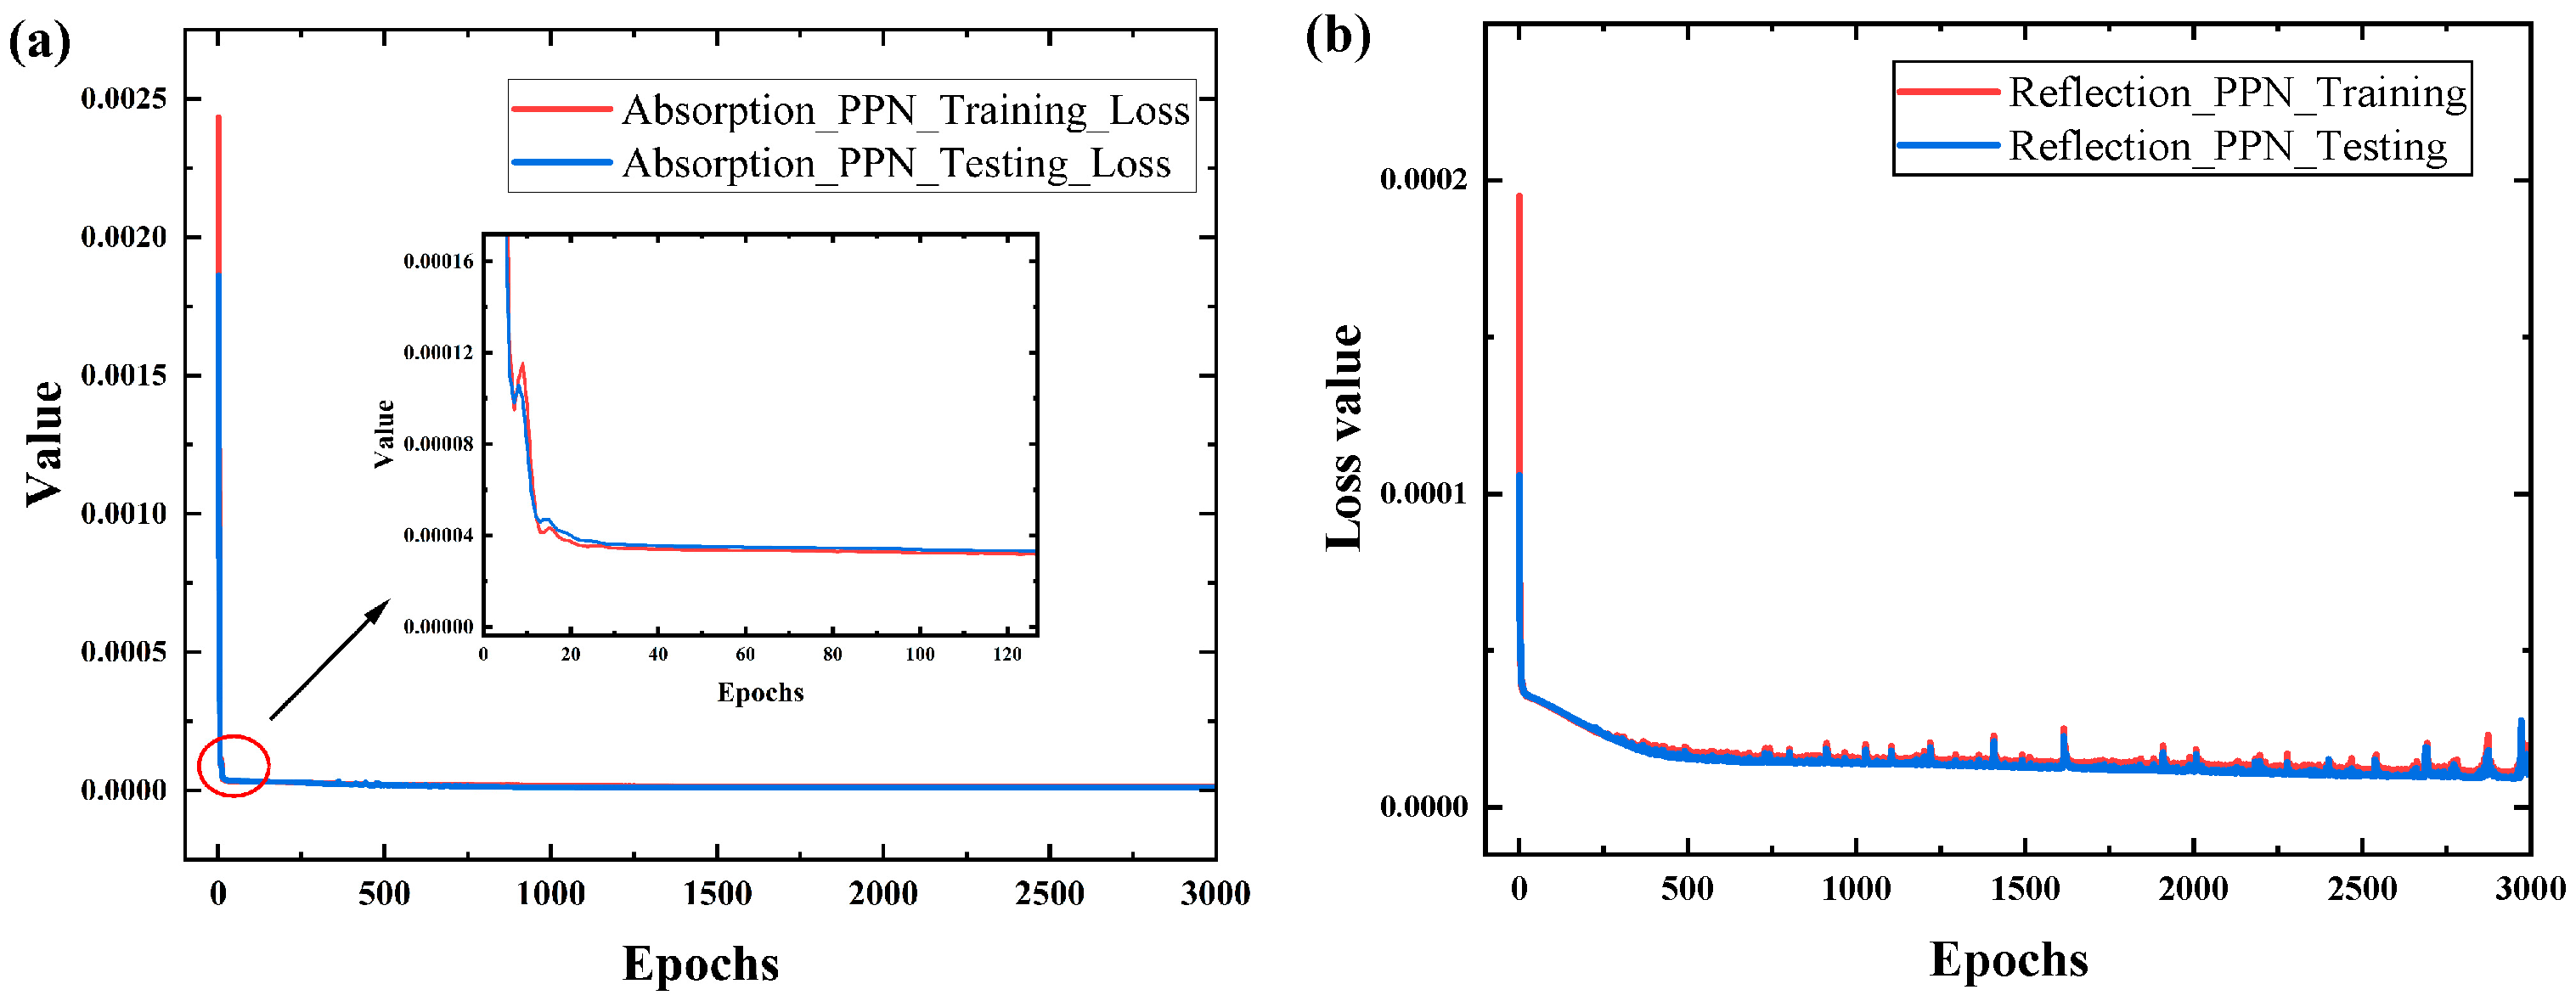
In inverse design, a mapping relationship is established between reflectance or transmittance spectra and geometric parameters. The desired spectral response is input to design the corresponding geometric parameters of a metamaterial absorber, thereby achieving on-demand design. The loss values of the PPN model training and testing are shown in Figure 11. Figure 11a,b shows the loss values of the inverse design geometric parameters for the absorption and reflection spectra, respectively. Compared to the reflection spectrum as an input to the model, the loss value of the absorption spectrum converges faster and stabilizes after 50 steps, with a stable value loss value of 3.35 × 10⁻⁵.
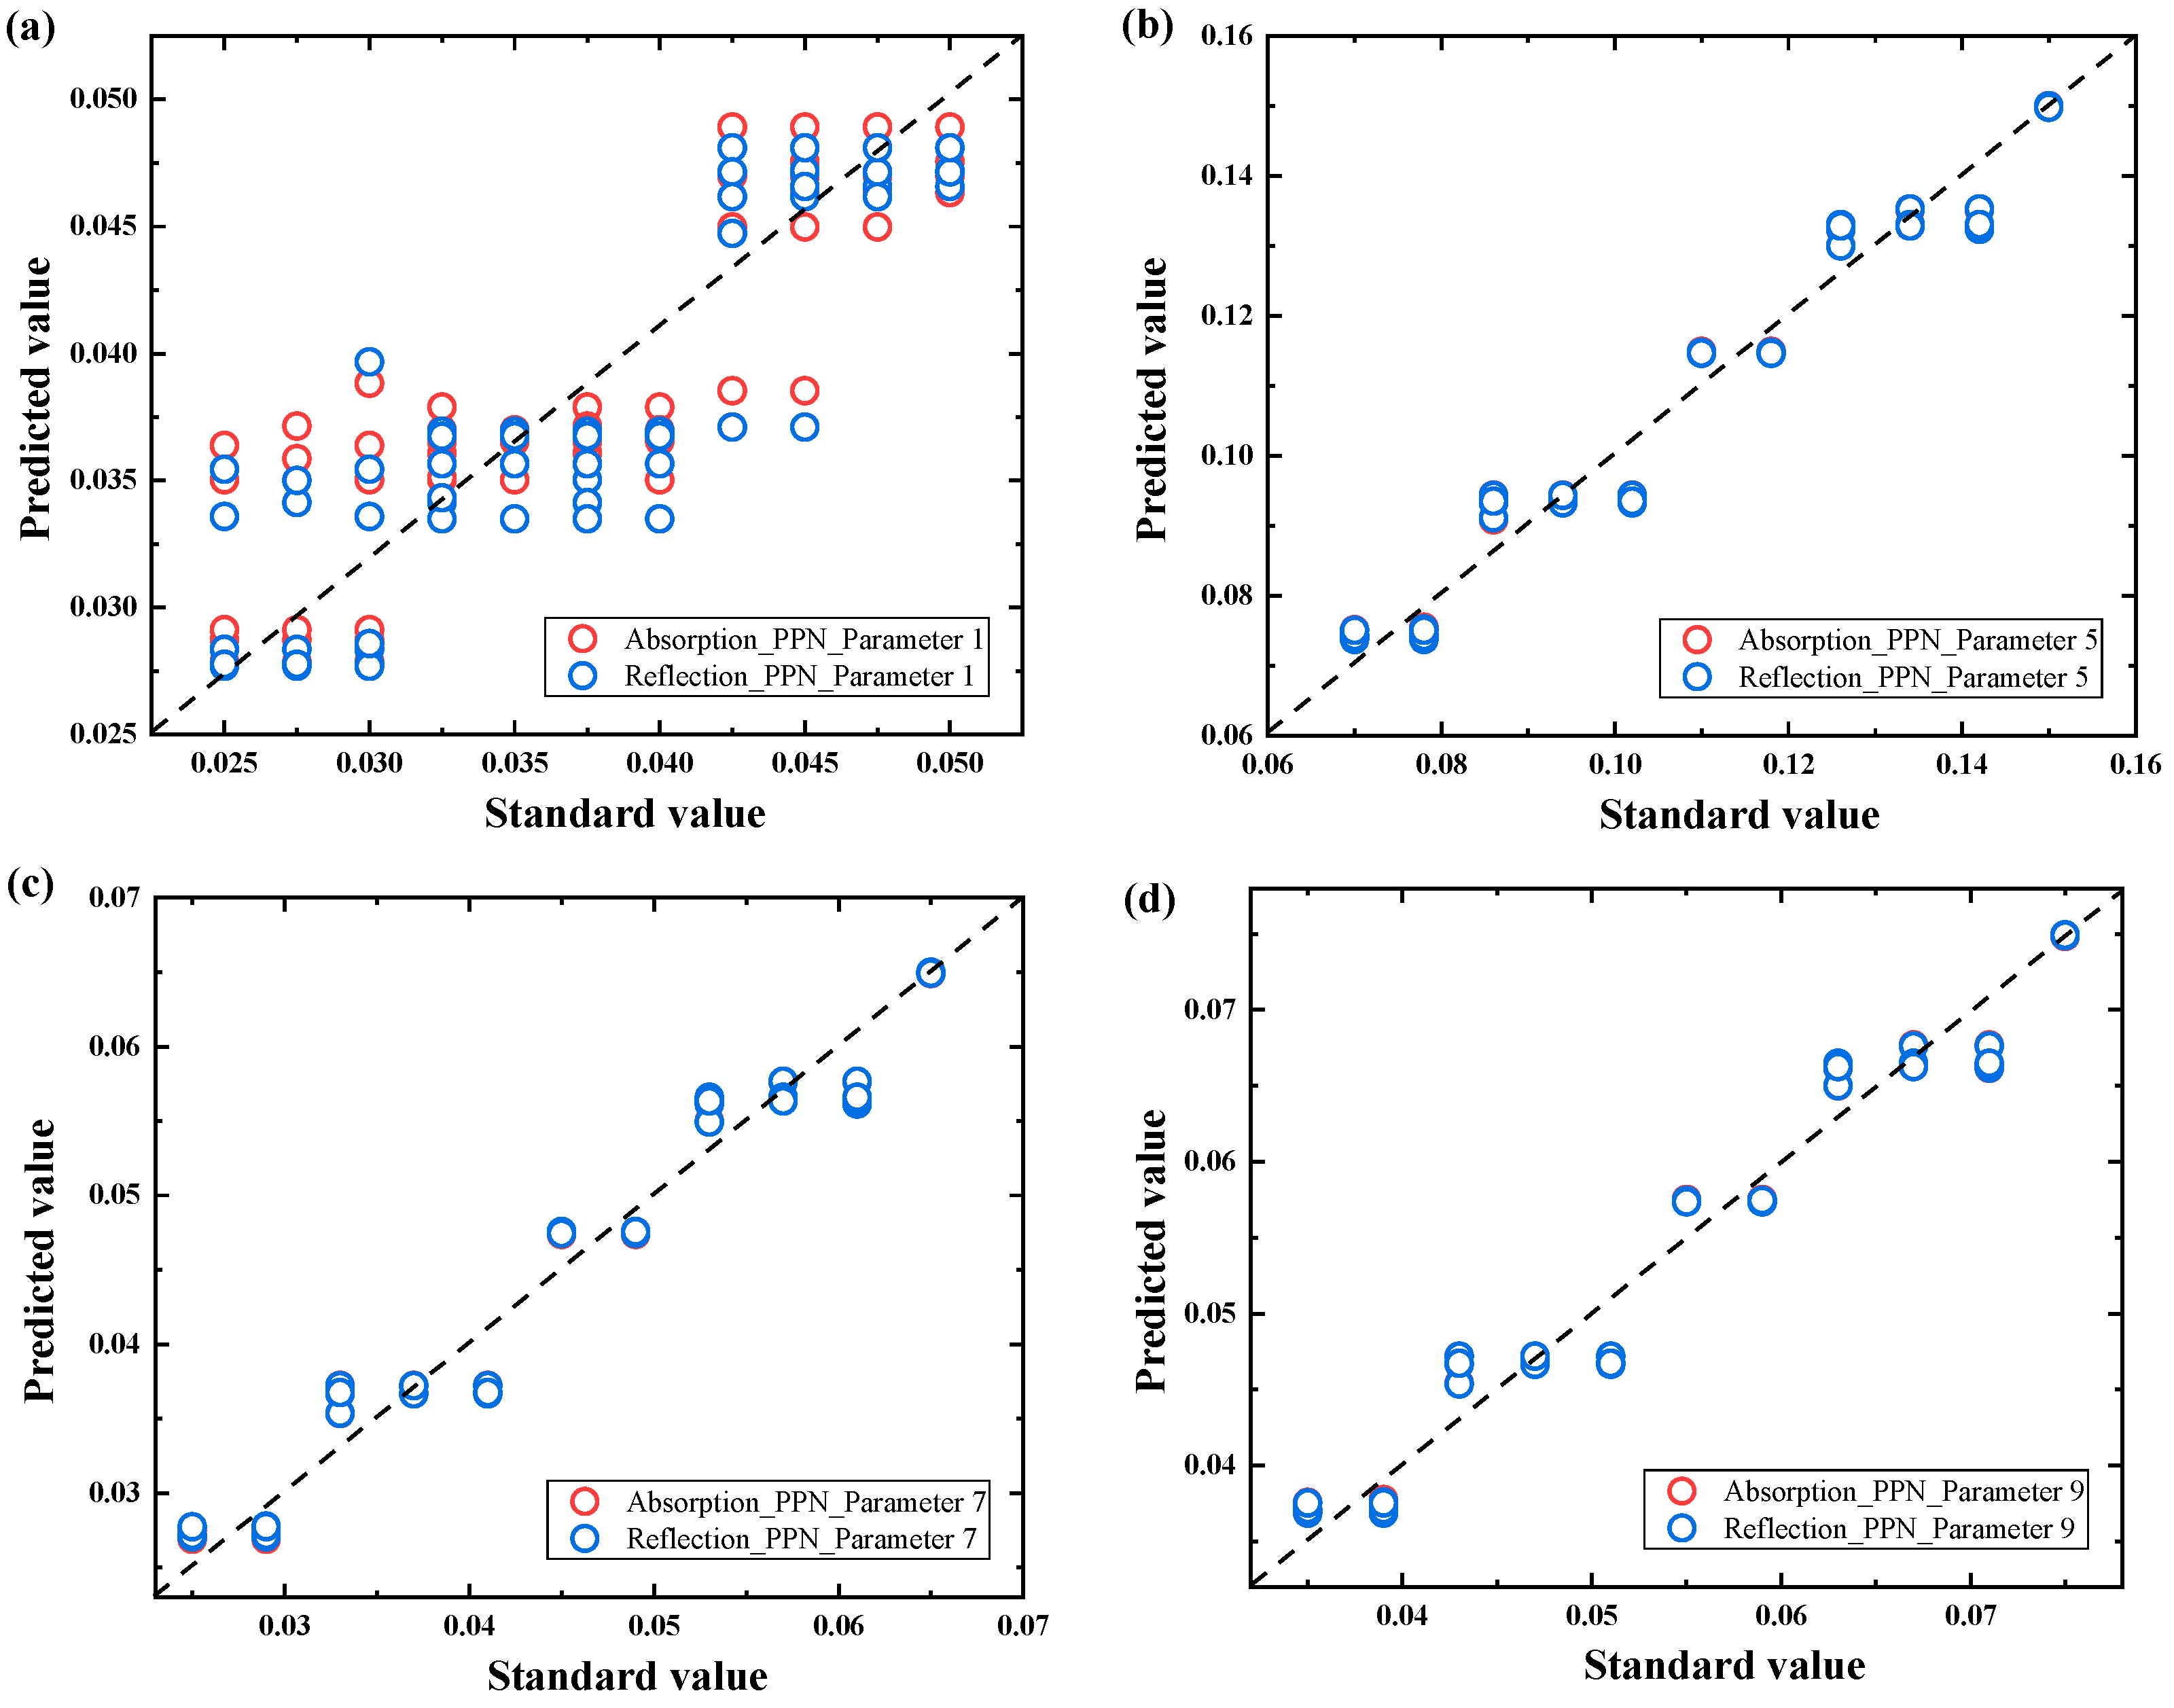
Figure 12 shows the distribution of geometric parameters with standard values for the design of absorption and reflection spectra in the test set (geometric parameters 1, 5, 7, 9). The black line in the figure is the standard line, and the closer the prediction point is to the standard line, the smaller the prediction error is. The predicted values of the absorption and reflection spectra in (b), (c), and (d) almost coincide with each other and have small errors with the standard values, which is consistent with the performance measures of the corresponding parameters in Figure 13. In the prediction of geometric parameter 1, both of them have certain errors. The fitting coefficient for the reflection spectrum as input is 0.794, and for the absorption spectrum, it is 0.853.
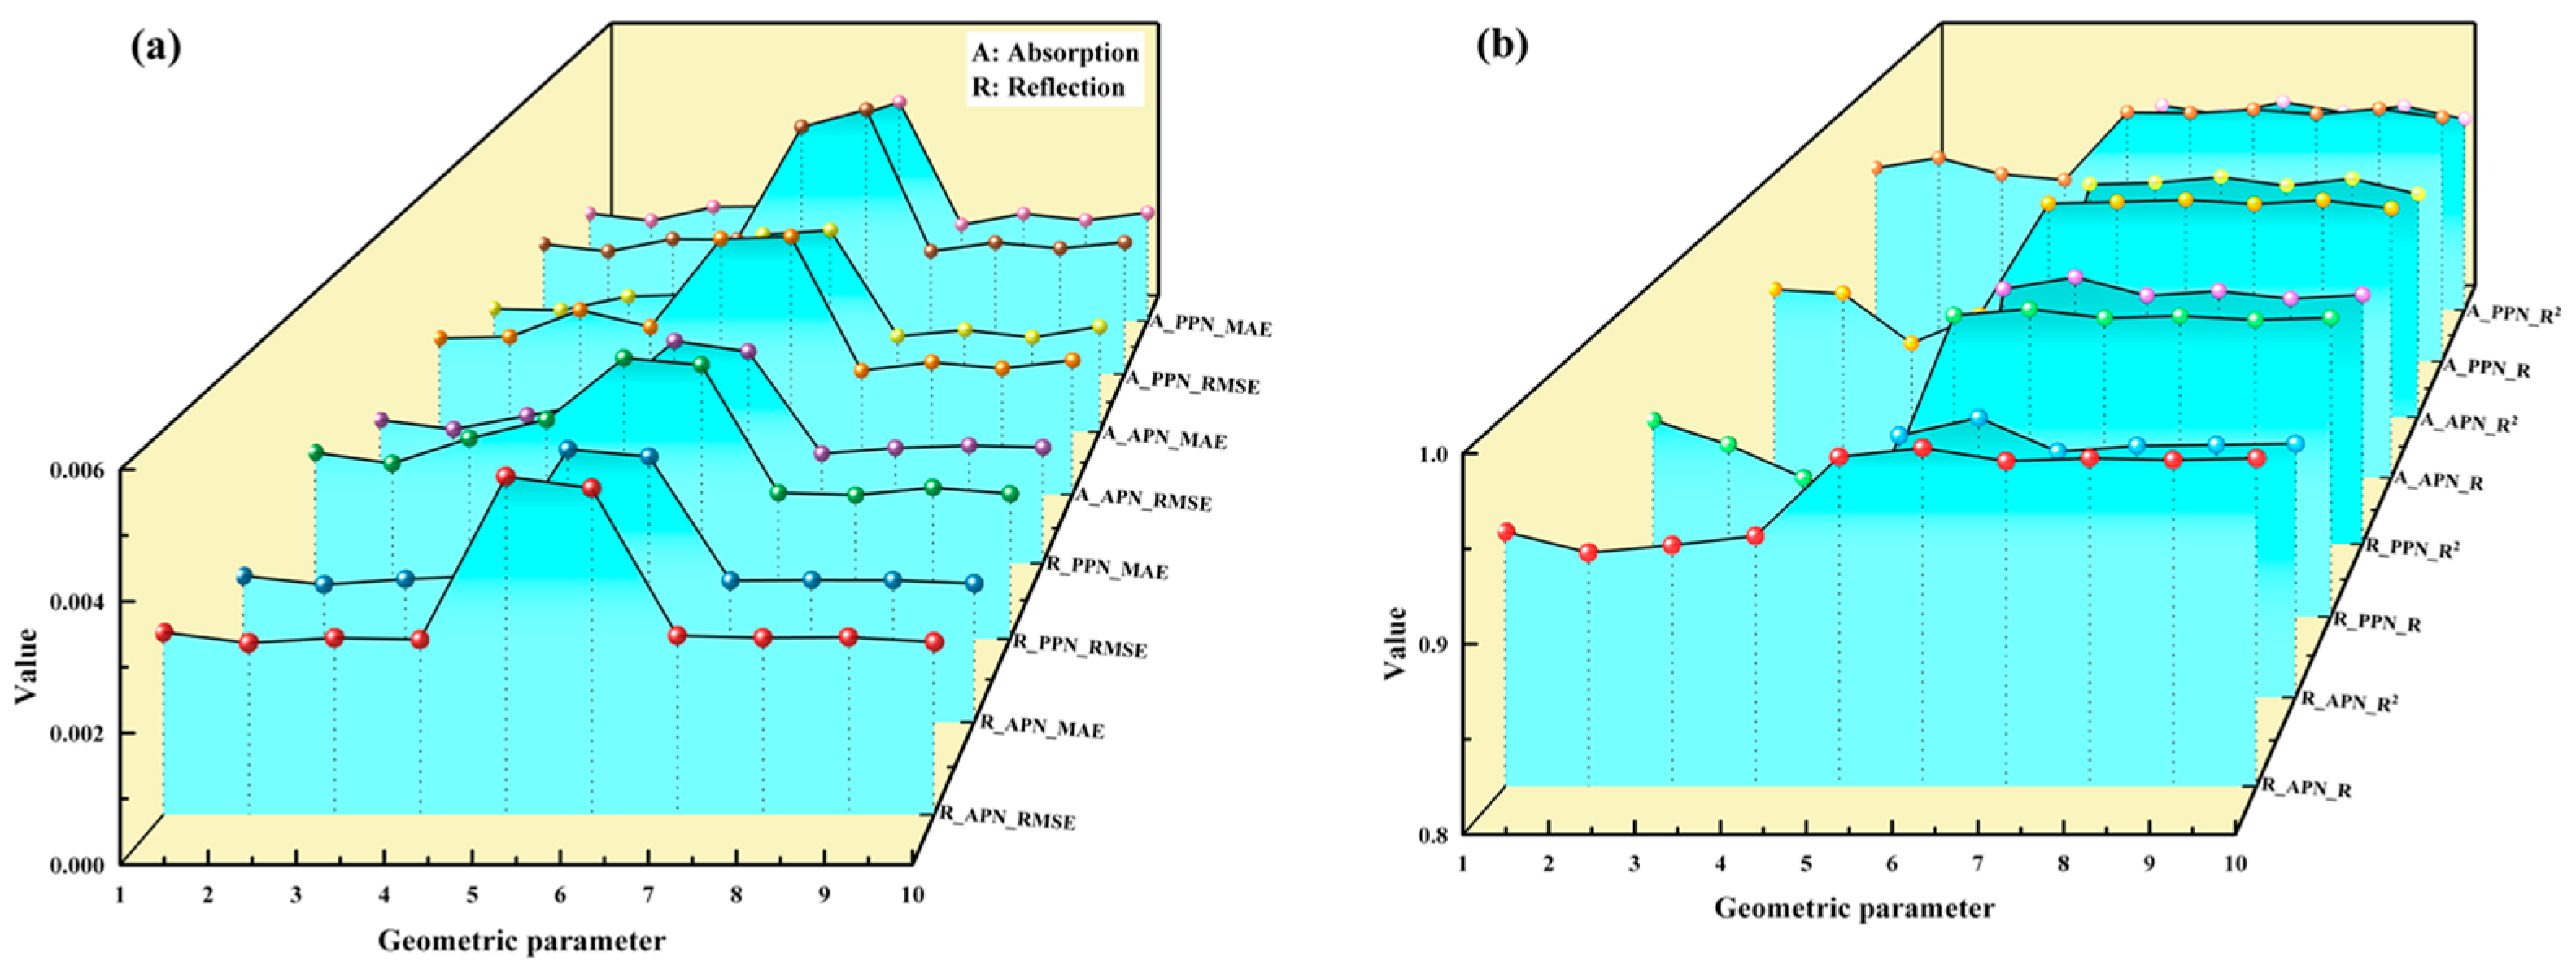
The performance metrics of the 10 geometric parameters in the inverse design are shown in Figure 13. Figure 13a Absorption and reflection spectra as PPN and APN inputs are the RMSE and MAE values. The RMSE and MAE values of all geometric parameters are below 0.006, indicating a small error between the predicted and true values. The average RMSE and MAE for all parameters is 0.003 (Table 4). In Figure 13b, the fit coefficients of parameters 5 to 10 are more stable and higher compared to parameters 1 to 4. The average Pearson correlation coefficient (R) and fit coefficient (R2) of the PPN model are 0.952 and 0.890, respectively (Reflection: 0.945, 0.870). Compared with the reflection spectrum as input data for the design of the geometric parameters of the metamaterial absorber, the absorption spectrum as input has a small improvement in the design average accuracy (0.4–2%). It has a certain reference value for improving the design efficiency of plasma metamaterial absorbers.
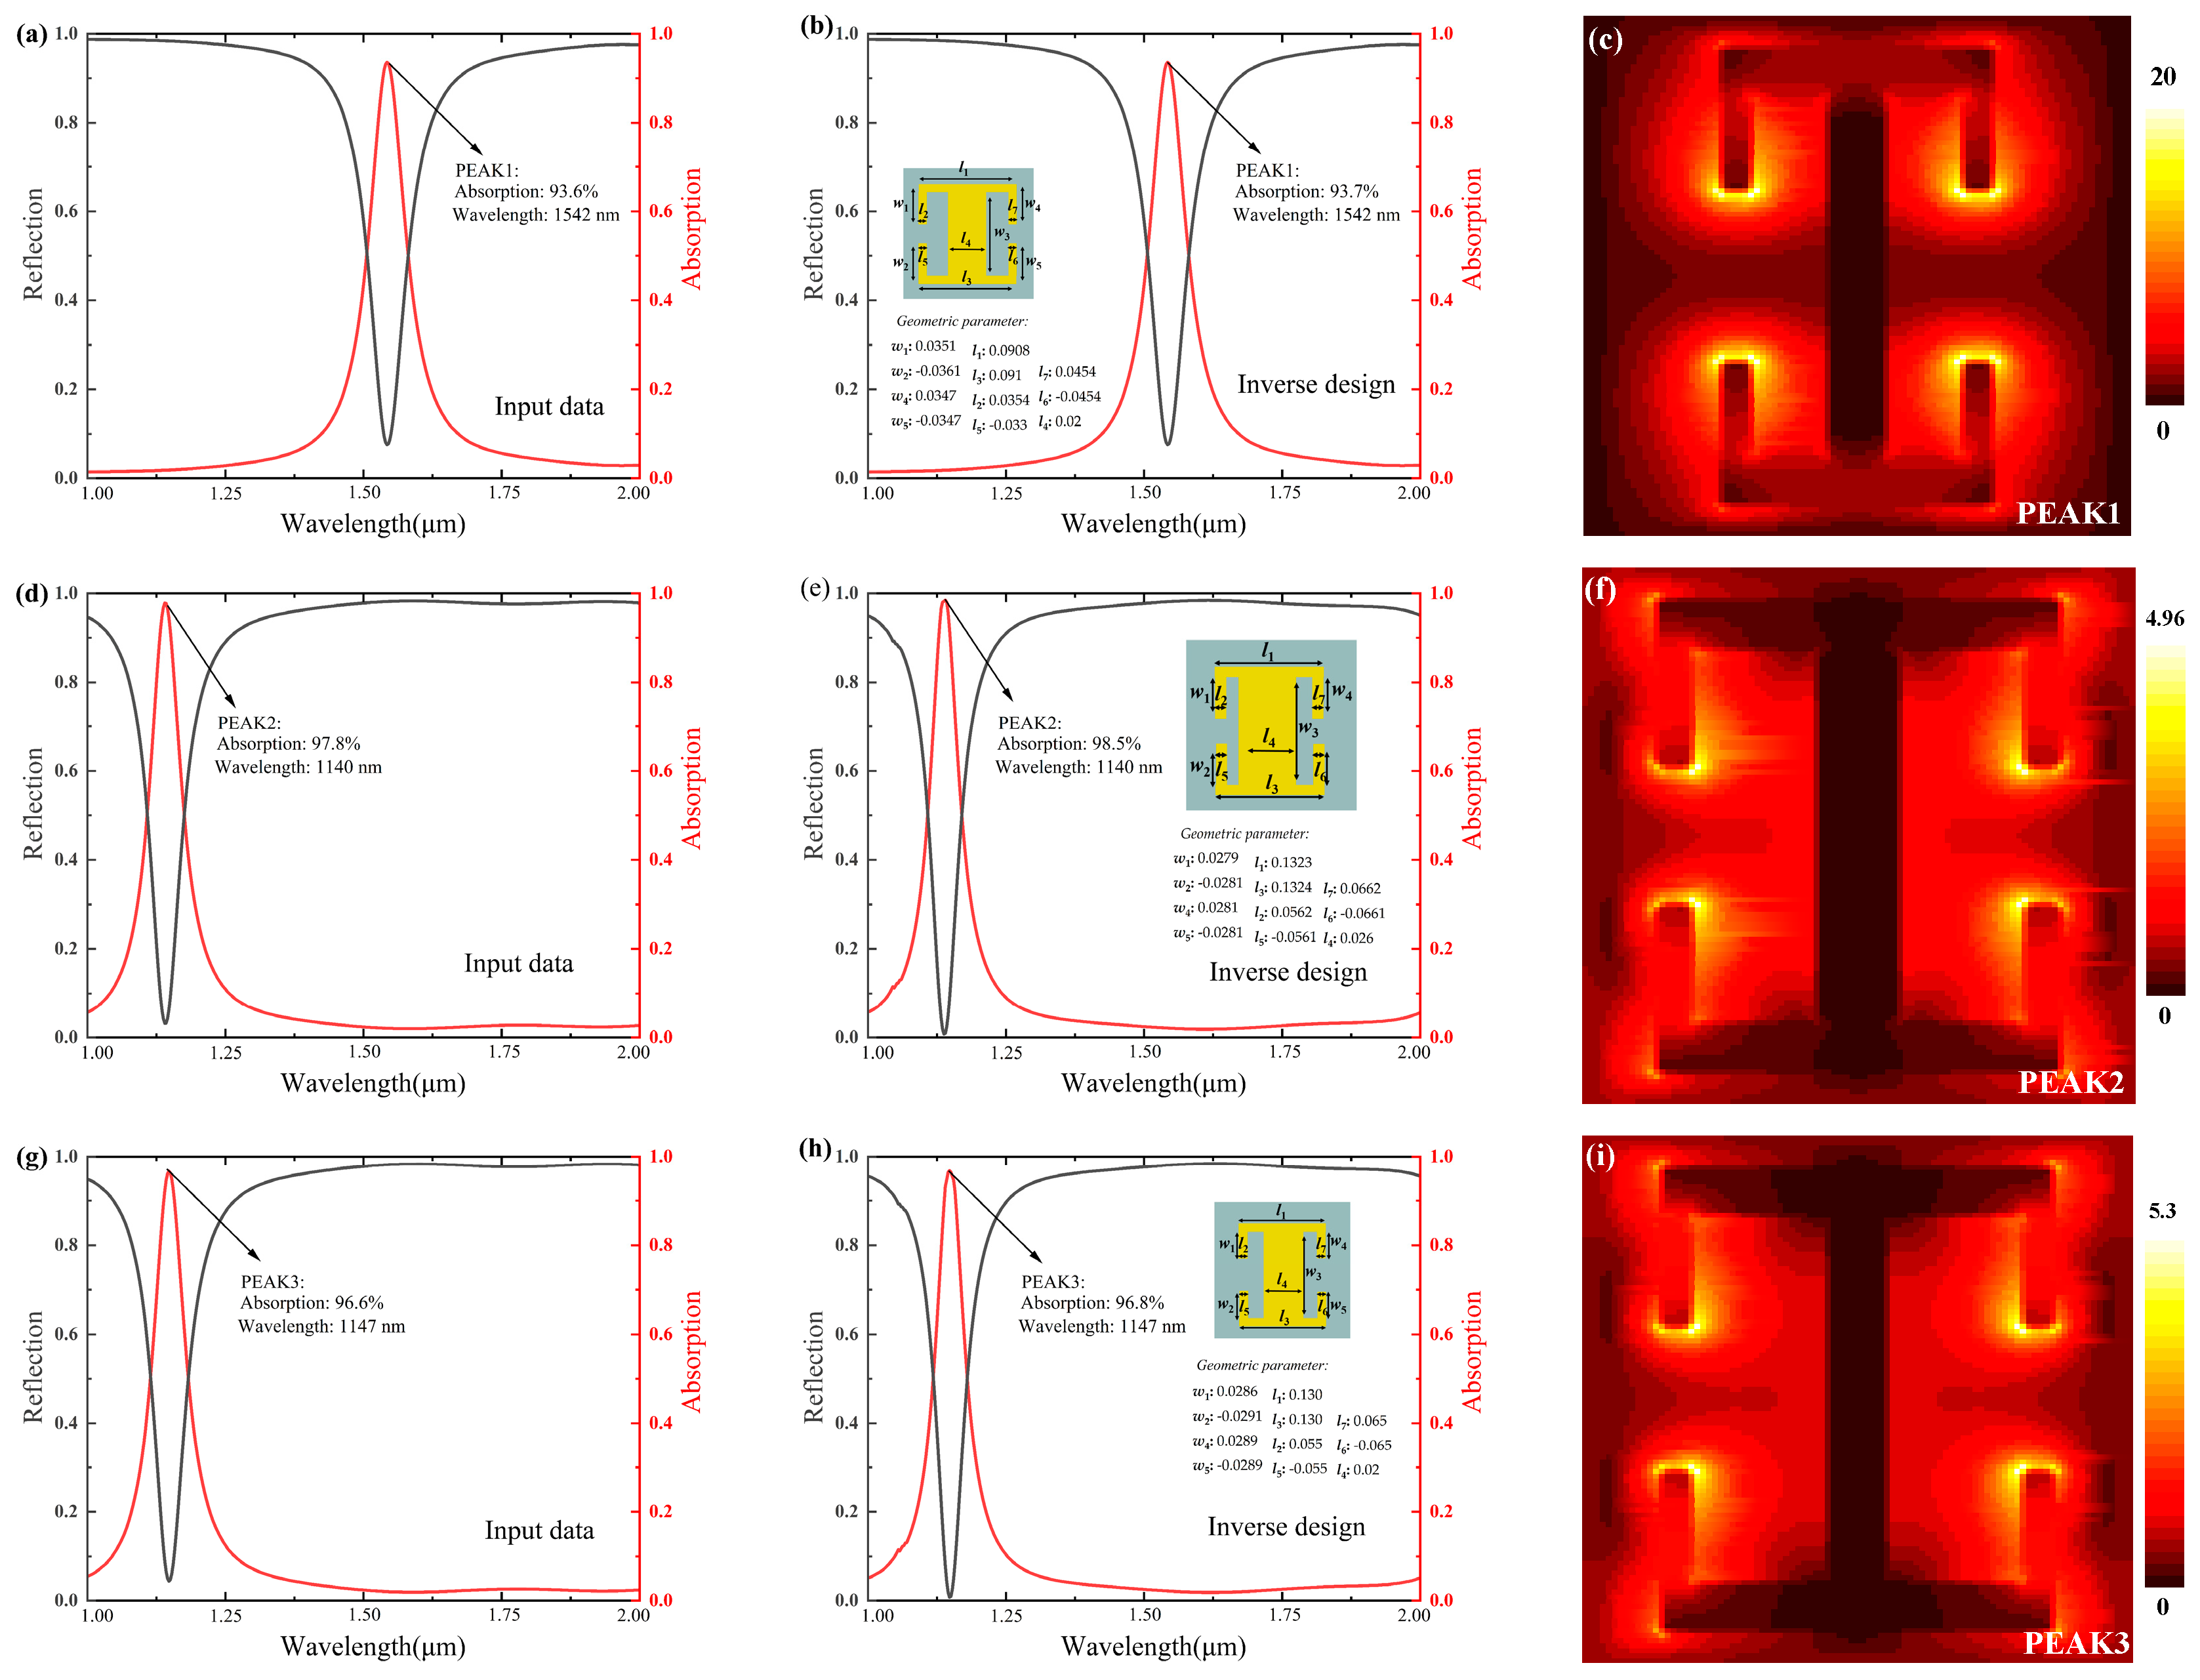
To further validate the performance of the model, we used three different absorption-reflection spectra to design metamaterial absorbers (Figure 14a,d,g). The design results are shown in Figure 14b,e,h, respectively, and the corresponding absorption-reflection spectra were obtained by simulating the designed geometric parameters with the top shape using FDTD software. The maximum design error of peak 2 is 0.7%, and the minimum design error of peak 1 is 0.1%. The designed plasma metamaterial absorber has a maximum absorption rate of 98.5%.
To provide a clearer and more intuitive understanding of metamaterial absorbers designed through inverse design, we present the near-field distribution of peaks 1, 2, and 3 on the center plane of the surface structure. As shown in Figure 14c, the near-field pattern of absorber peak 1 is concentrated on the edges of the surface structure, including the edges of the two SRRs and the rectangle patch, forming local resonance effects and modes. Peaks 2 and 3 are mainly concentrated around the two SRRs. The absorption peak of this band metamaterial absorber should be caused by the local resonance effect of the surface structure. For each absorption peak in the specimen, the local position of the near field or the enhanced area of the near field is different.

3.4. Design Framework Validation

In order to verify the usability of our proposed framework for different structures of metamaterial absorbers with different material absorbers, we chose the two structures in Figure 15 for testing. Figure 15a shows a three-dimensional chiral metamaterial absorber composed of gold and silica, and the dichroism of the circle (CD) corresponding to the four geometric parameters is obtained via the FDTD simulation software. Early studies of this chiral plasmonic metamaterial structure were used to realize using chiral plasmonic metamaterials with hot electron injection [42]. In this work, we use different plasma and structure shapes. Figure 15c shows a three-dimensional plasma metamaterial absorber composed of silver and alumina trioxide, and the reflectance spectra corresponding to four geometric parameters are obtained via FDTD simulation [43].
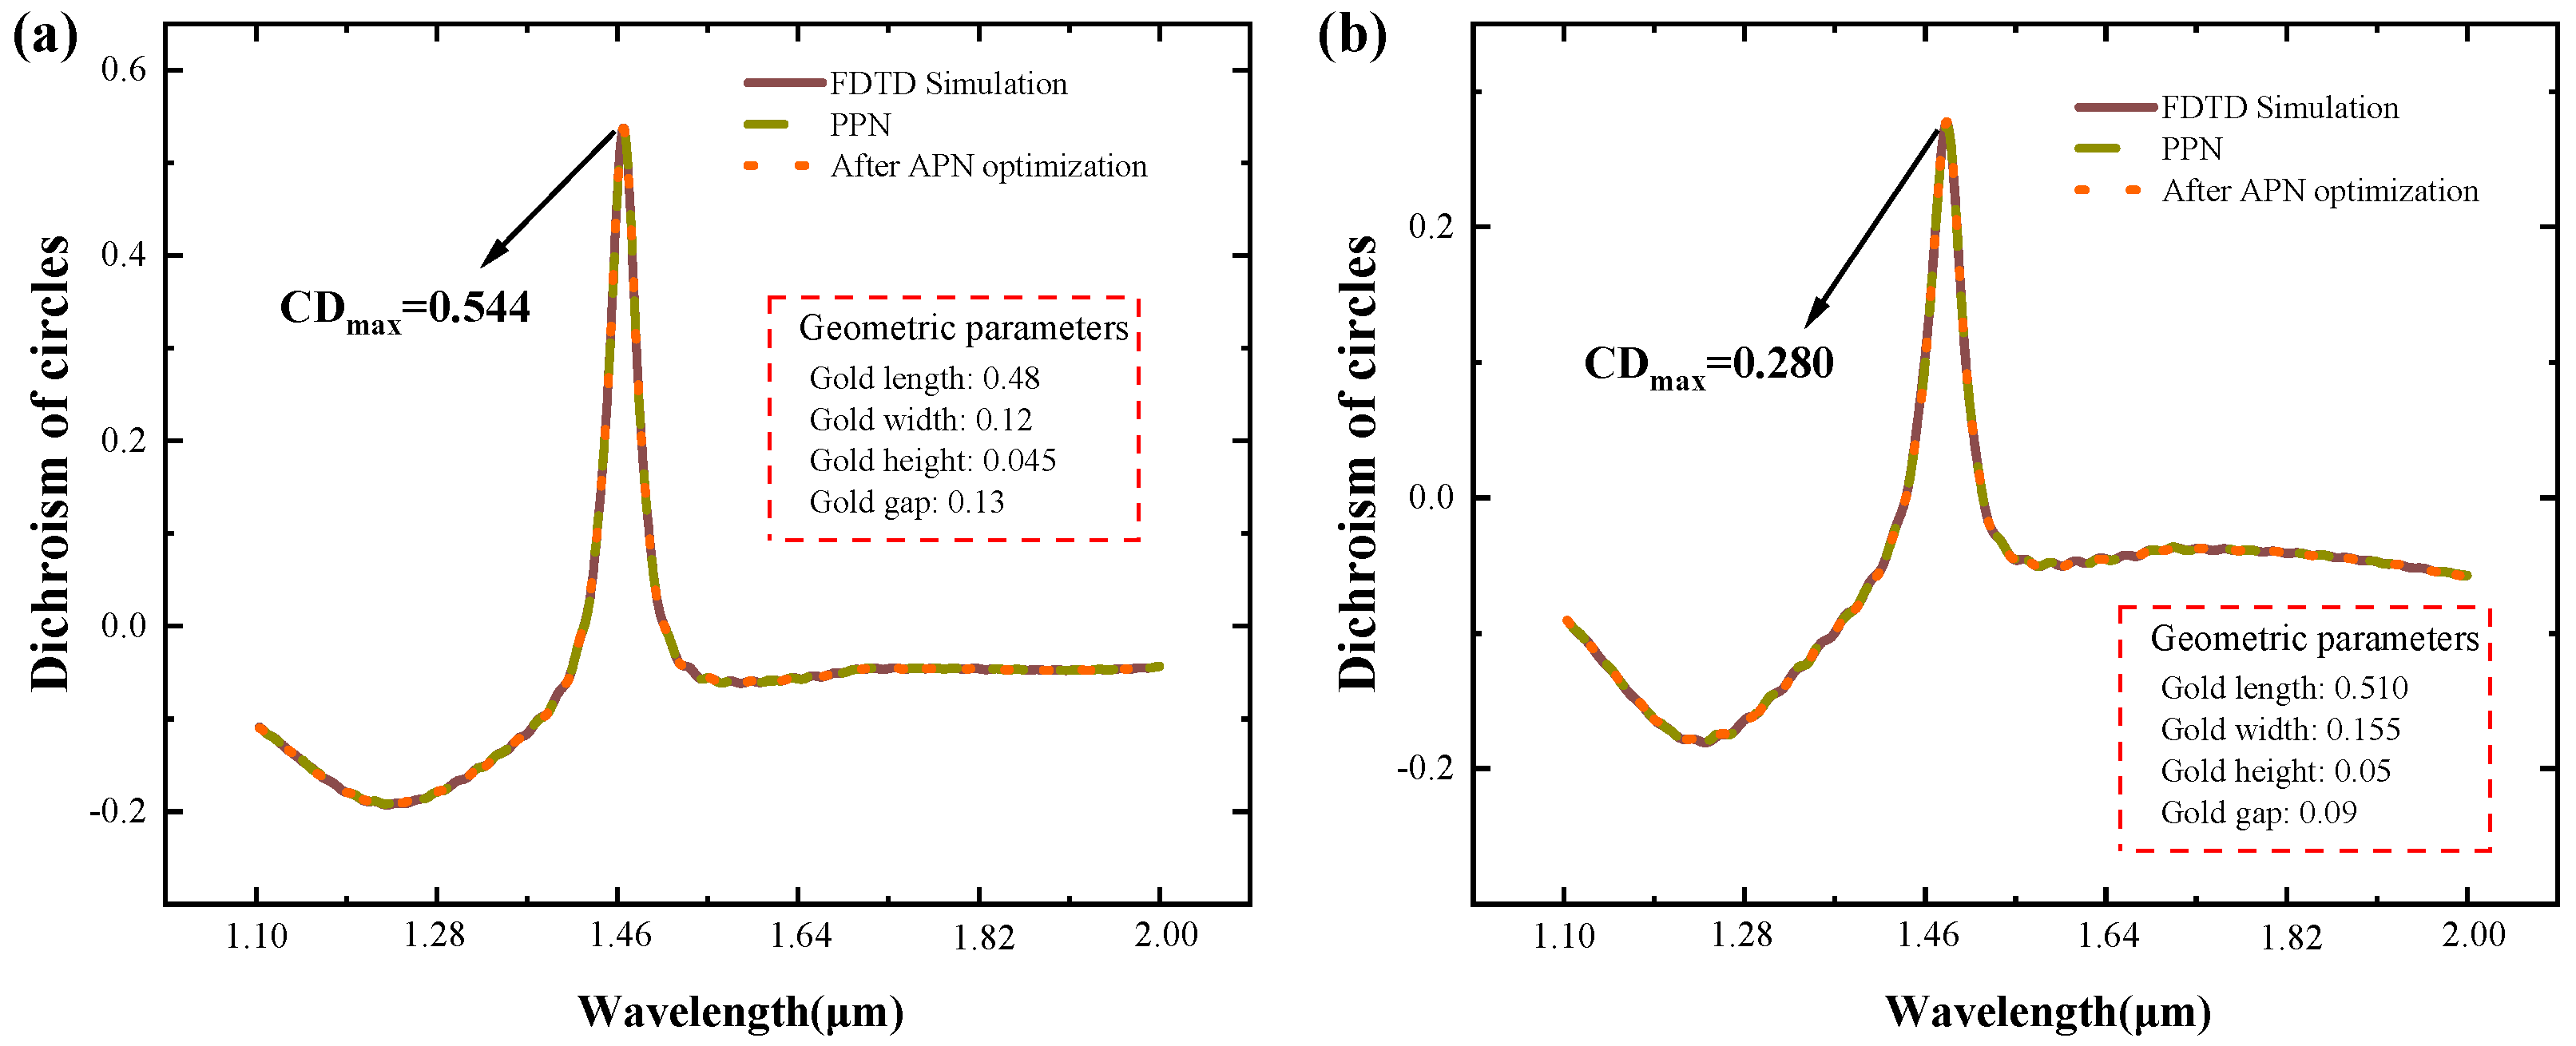
In the forward design, Figure 16 and Figure 17 show the predicted results for each of the two metamaterial absorbers. In the two test data in Figure 16, the geometrical parameters are input, and the predicted obtained CD values are compared with the simulation results of FDTD software, and we can find that the PPN prediction results are consistent with the simulation results. In Figure 17, which shows the predicted reflection spectrum by geometric parameters, the PPN prediction in Figure 17a shows a large error, but the error is reduced after optimization by the APN network. The above results show that our model has high accuracy in forward prediction for different structures, different materials, and different electromagnetic responses, and the model has the function of optimization.
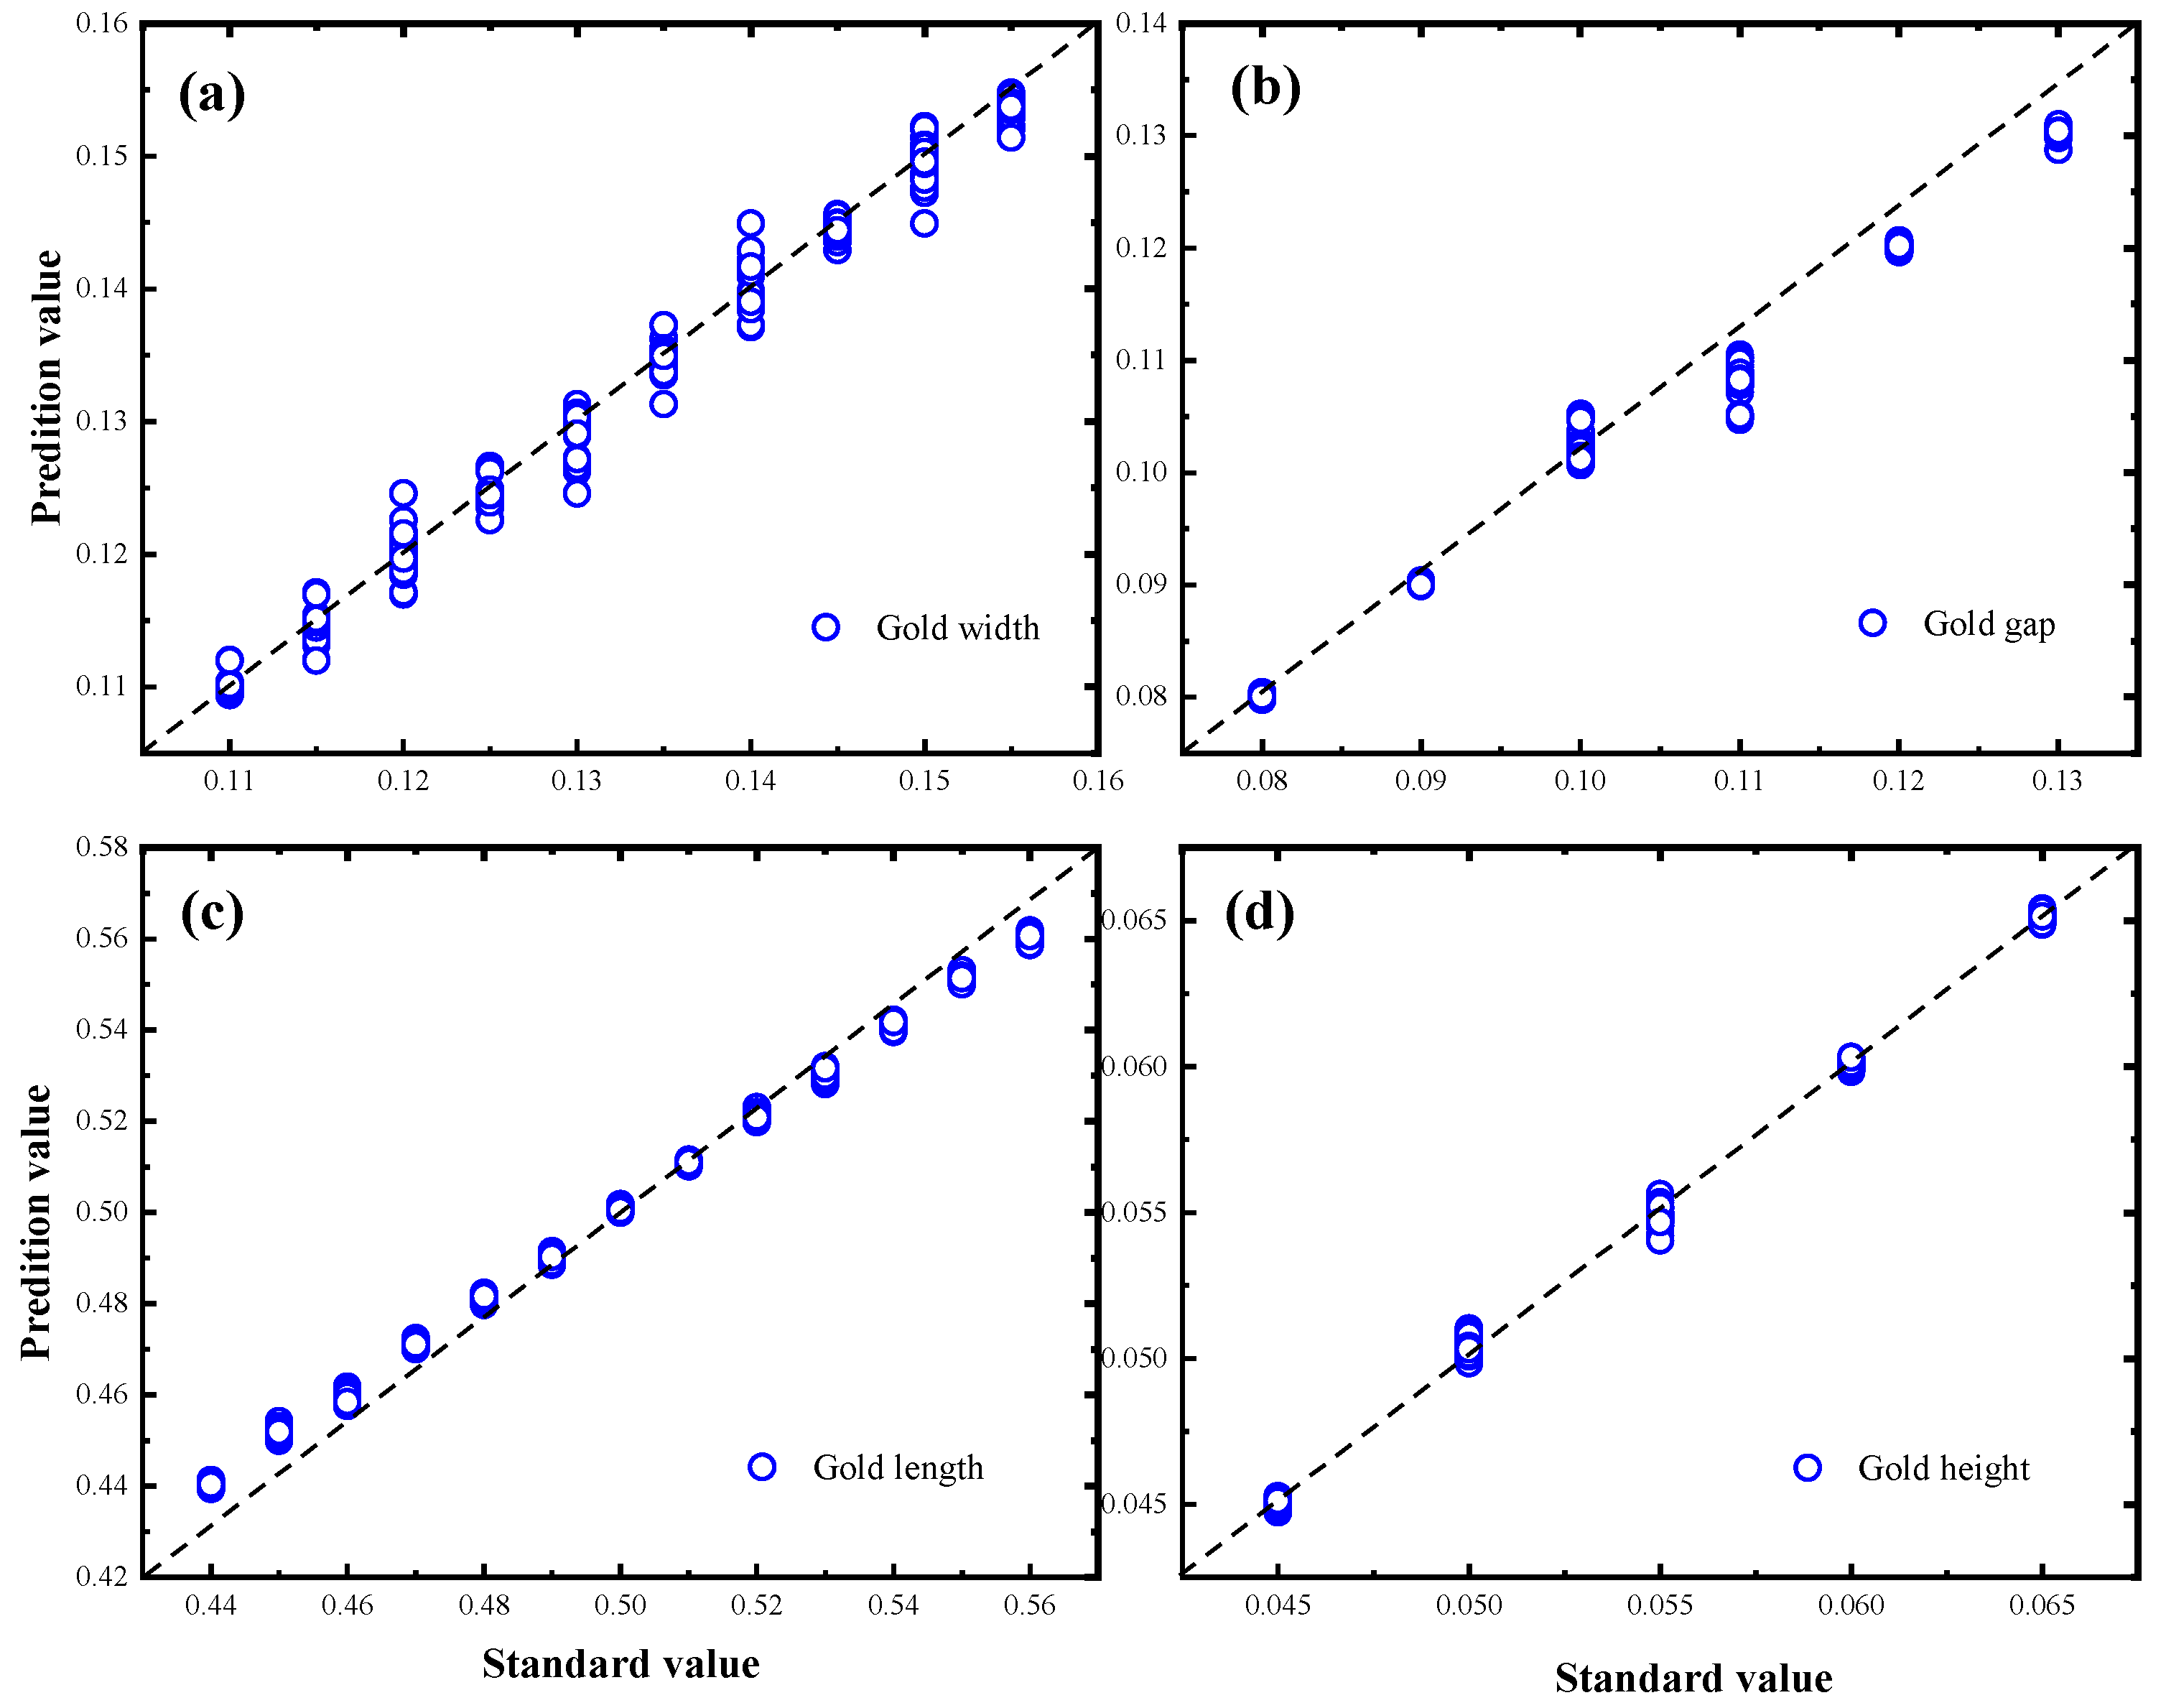
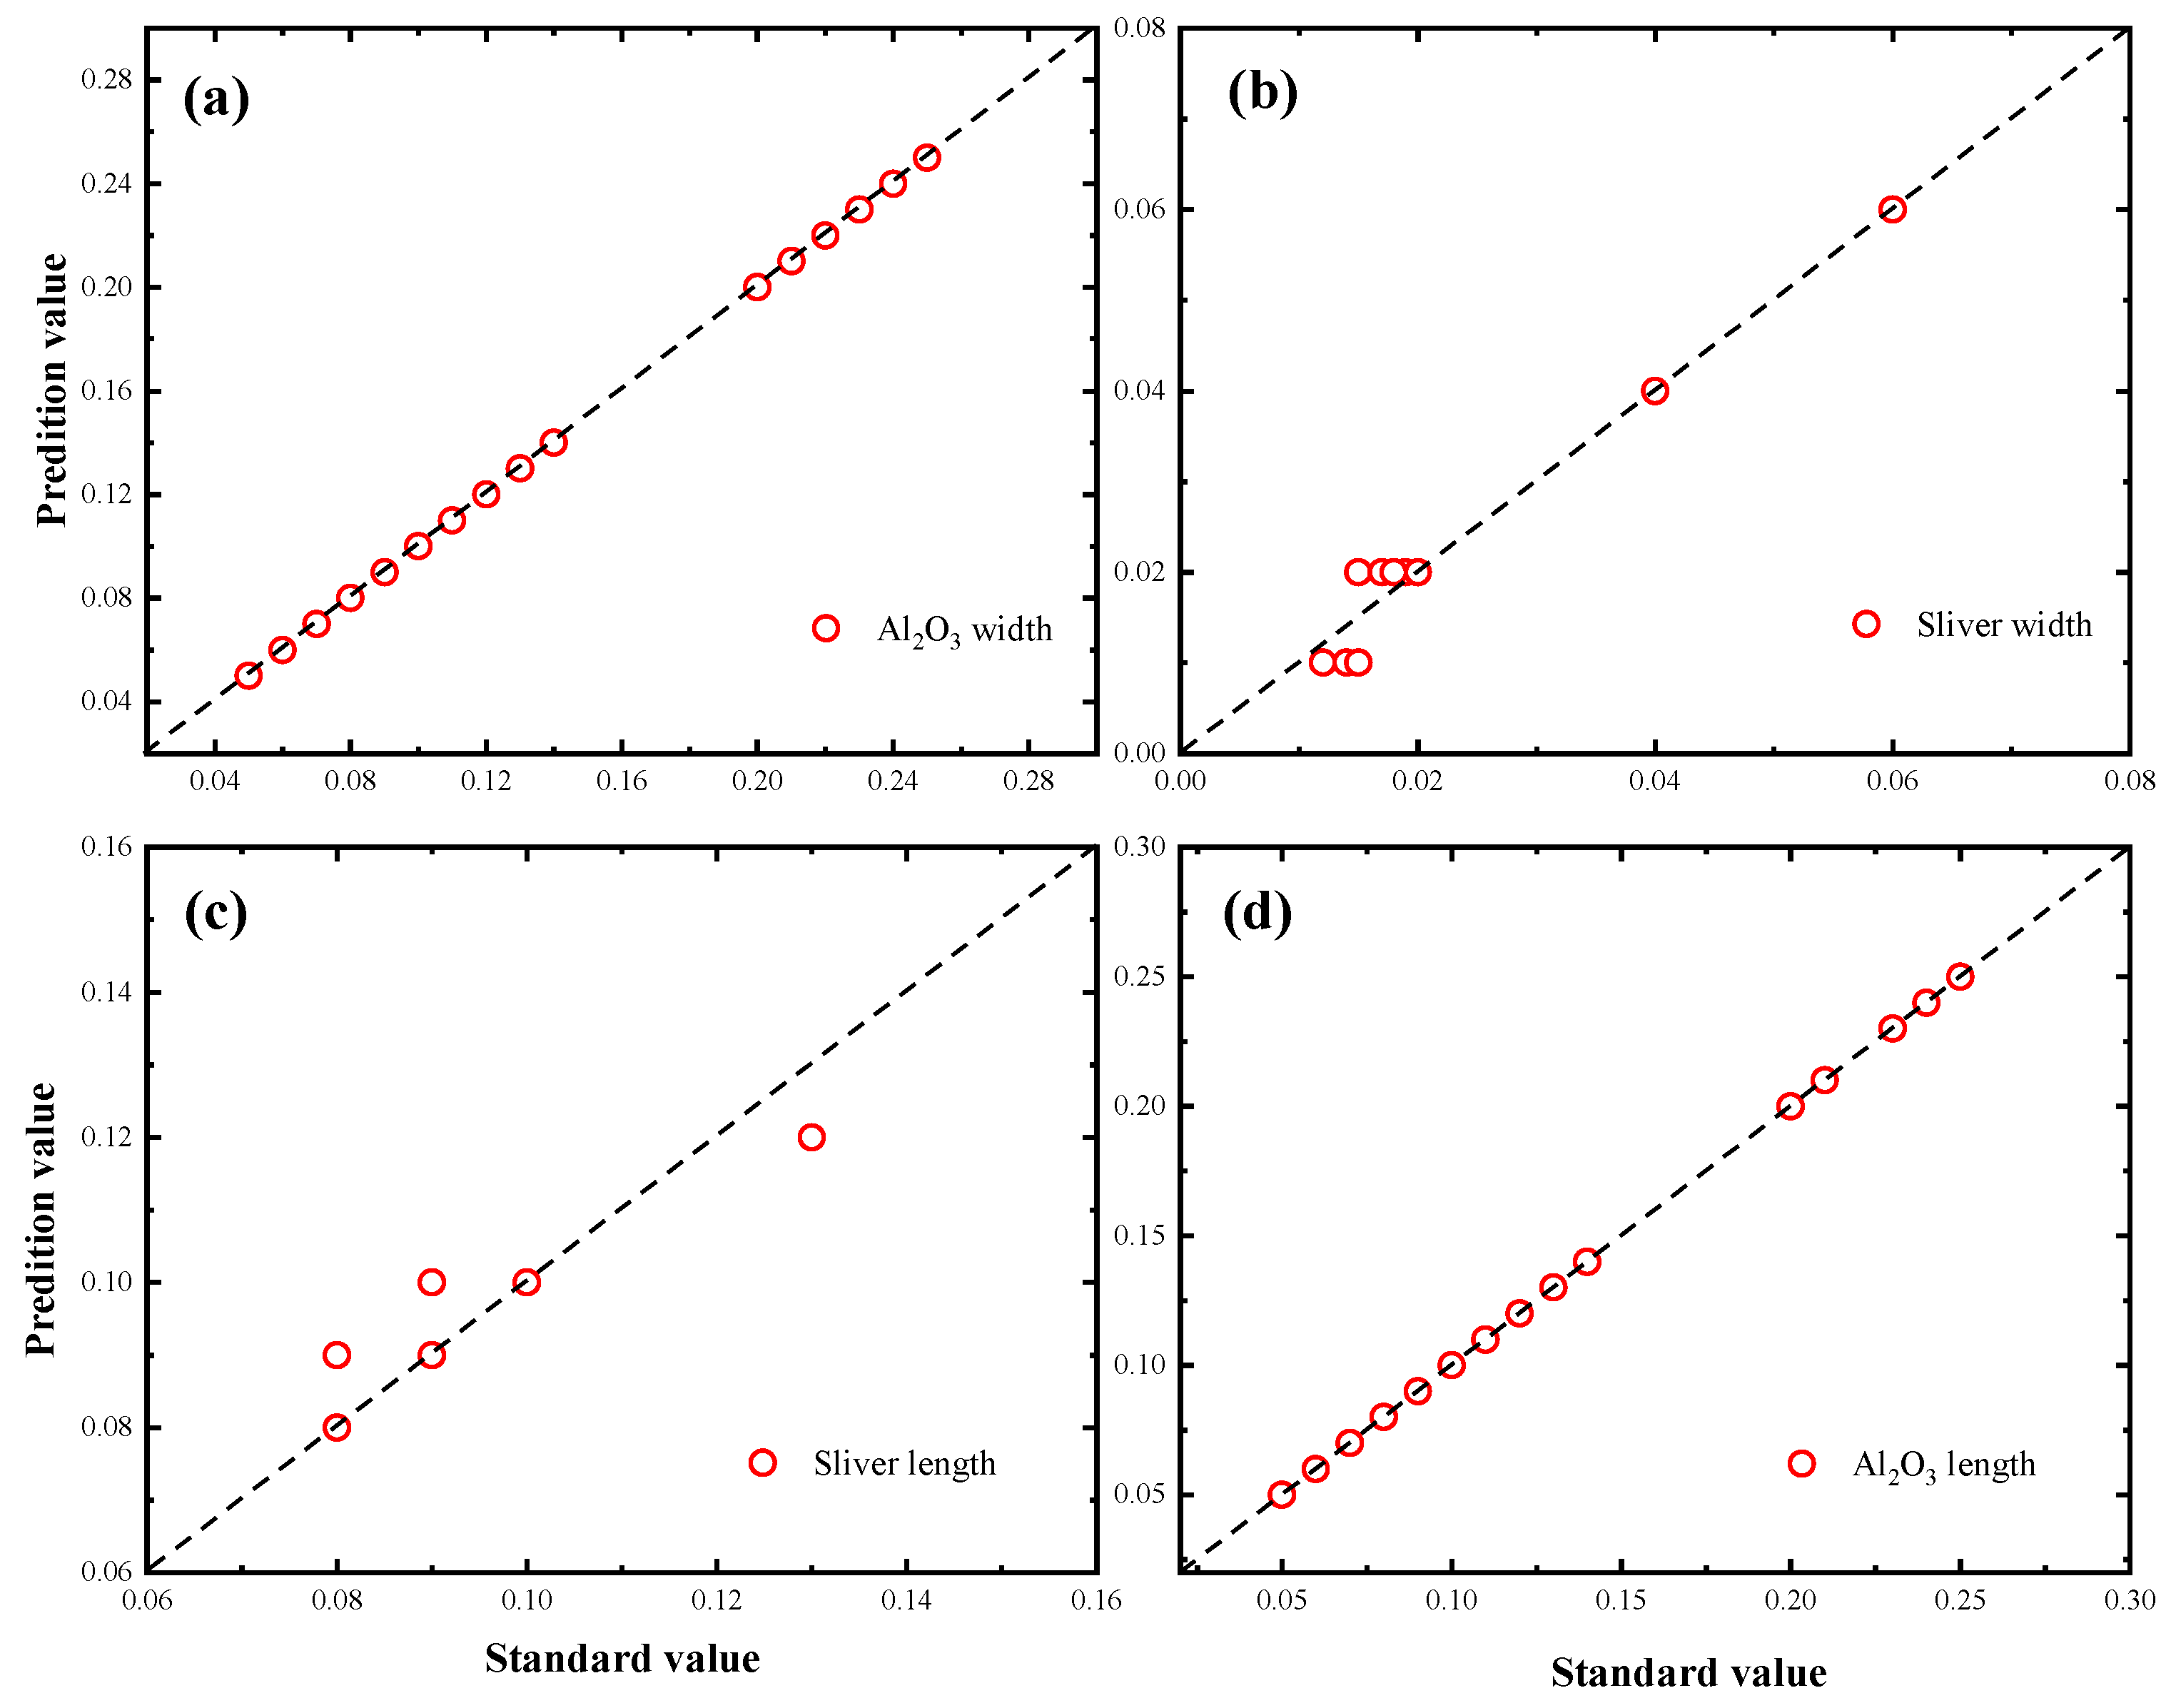
Inverse design is important for metamaterial absorber engineering practice. In the inverse design, we design the metamaterial on-demand based on the electromagnetic response. Therefore, we use the dichroism and reflection spectrum of the garden as the input to the metamaterial absorber design, respectively. The predicted results of the four geometrical parameters in the design of chiral plasma metamaterials via circular dichroism are shown in Figure 18, where the predicted and true values of the four geometrical parameters are distributed around the standard line. Compared with the reflection spectrum design geometrical parameters, different parameters have different errors. Figure 18c,d has less error than Figure 19a,d.
The performance metrics for a total of four tests of forward prediction and reverse design are shown in Table 5. The average RMSE and MAE values for predicted CD (Reflection) are below 0.016, indicating a small error between the predicted and true values. The average Pearson correlation coefficient (R) and fit coefficient (R2) of the PPN model are 0.997 and 0.994, respectively (Reflection: 0.999, 0.999). In the inverse design test, the design of the metamaterial absorber by reflectance spectrum and dichroism of circle both have high accuracy (R2cd: 0.999, R2reflection: 0.980). Our proposed framework provides some assistance in the design of metamaterial absorbers.

4. Conclusions

In this paper, we demonstrate the application of the PPN and APN models in predicting and designing metamaterial absorbers. Empirical evidence derived from our work yields the following conclusions: (1) To improve the accuracy of prediction, we optimized the part with the large error of the primary prediction network via the auxiliary prediction network. (2) When using the absorption spectrum to design metamaterial absorbers, it provides better forward prediction and inverse design than the reflection spectrum. (3) In the forward prediction, we adopted the many-to-one prediction method, and the average fitting coefficient of the prediction spectrum reached 0.999. (4) In the inverse design, the maximum absorption rate of the metamaterial absorber that provides on-demand design of absorption and reflection spectra reached 98.5%. (5) The framework is suitable for metamaterial absorbers of different structures and materials. The proposed on-demand design framework provides a reference value for the design of metamaterial absorbers. In future research, we plan to apply this framework to more complex nanophotonic functional materials and devices. Increasing the range of structures and materials for which frames can be designed is very rewarding, and this will be the direction of our future work.

Author Contributions

Conceptualization, L.G.; methodology, L.G.; software, L.G.; validation, L.G. and Z.W.; formal analysis, Z.W., J.G., R.W. and H.L.; investigation, L.G. and J.G.; data curation, J.G.; writing—original draft preparation, L.G.; writing—review and editing, Z.W., J.G., R.W., H.L. and L.G.; visualization, L.G.; supervision, J.G.; project administration, J.G.; and funding acquisition, Z.W., R.W. and H.L. All authors have read and agreed to the published version of the manuscript.

Funding

National Natural Science Foundation of China (Grant Nos. 62175070, 61875057); Basic and Applied Basic Research Foundation of Guangdong Province (Grant Nos. 2021A1515010352, 2021A1515012652, 2022A1515110752, 2023A1515011385, 2023A1515012966); Guangzhou Science and Technology Program key projects (Grant No. 202201010340).

Informed Consent Statement

Not applicable. The study did not involve humans.

Data Availability Statement

The data presented in this study are available from the corresponding author upon reasonable request.

Conflicts of Interest

The authors declare no conflict of interest.

References

  1. Liang, Y.; Koshelev, K.; Zhang, F.; Lin, H.; Lin, S.; Wu, J.; Jia, B.; Kivshar, Y. Bound states in the continuum in anisotropic plasmonic metasurfaces. Nano Lett. 2020, 20, 6351–6356. [Google Scholar] [CrossRef] [PubMed]
  2. Stewart, J.W.; Nebabu, T.; Mikkelsen, M.H. Control of Nanoscale Heat Generation with Lithography-Free Metasurface Absorbers. Nano Lett. 2022, 22, 5151–5157. [Google Scholar] [CrossRef]
  3. Ghaedizadeh, A.; Shen, J.; Ren, X.; Xie, Y.M. Tuning the performance of metallic auxetic metamaterials by using buckling and plasticity. Materials 2016, 9, 54. [Google Scholar] [CrossRef] [PubMed] [Green Version]
  4. Al-Ketan, O.; Al-Rub, R.K.A. Multifunctional mechanical metamaterials based on triply periodic minimal surface lattices. Adv. Eng. Mater. 2019, 21, 1900524. [Google Scholar] [CrossRef]
  5. Yang, M.; Sheng, P. Sound absorption structures: From porous media to acoustic metamaterials. Annu. Rev. Mater. Res. 2017, 47, 83–114. [Google Scholar] [CrossRef]
  6. Lai, R.; Shi, P.; Yi, Z.; Li, H.; Yi, Y. Triple-band surface plasmon resonance metamaterial absorber based on open-ended prohibited sign type monolayer graphene. Micromachines 2023, 14, 953. [Google Scholar] [CrossRef]
  7. Chen, Z.; Cai, P.; Wen, Q.; Chen, H.; Tang, Y.; Yi, Z.; Wei, K.; Li, G.; Tang, B.; Yi, Y. Graphene Multi-Frequency Broadband and Ultra-Broadband Terahertz Absorber Based on Surface Plasmon Resonance. Electronics 2023, 12, 2655. [Google Scholar] [CrossRef]
  8. Li, Y.; Yu, G.; Liang, B.; Zou, X.; Li, G.; Cheng, S.; Cheng, J. Three-dimensional ultrathin planar lenses by acoustic metamaterials. Sci. Rep. 2014, 4, 6830. [Google Scholar] [CrossRef] [Green Version]
  9. Khorasaninejad, M.; Chen, W.T.; Devlin, R.C.; Oh, J.; Zhu, A.Y.; Capasso, F. Metalenses at visible wavelengths: Diffraction-limited focusing and subwavelength resolution imaging. Science 2016, 352, 1190–1194. [Google Scholar] [CrossRef] [Green Version]
  10. Liang, S.; Xu, F.; Li, W.; Yang, W.; Cheng, S.; Yang, H.; Chen, J.; Yi, Z.; Jiang, P. Tunable smart mid infrared thermal control emitter based on phase change material VO2 thin film. Appl. Therm. Eng. 2023, 2023, 121074. [Google Scholar] [CrossRef]
  11. Chen, T.; Li, S.; Sun, H. Metamaterials application in sensing. Sensors 2012, 12, 2742–2765. [Google Scholar] [CrossRef] [Green Version]
  12. Eslami, S.; Gibbs, J.; Mark, A.G.; Lee, T.C.; Jeong, H.-H.; Kim, I.; Fischer, P. Parallel fabrication of wafer-scale plasmonic metamaterials for nano-optics. In Advanced Fabrication Technologies for Micro/Nano Optics and Photonics VIII; SPIE: Bellingham, WA, USA, 2015; pp. 115–122. [Google Scholar]
  13. Zhou, Y.; Zheng, H.; Kravchenko, I.I.; Valentine, J. Flat optics for image differentiation. Nat. Photonics 2020, 14, 316–323. [Google Scholar] [CrossRef]
  14. Pahlevaninezhad, H.; Khorasaninejad, M.; Huang, Y.-W.; Shi, Z.; Hariri, L.P.; Adams, D.C.; Ding, V.; Zhu, A.; Qiu, C.-W.; Capasso, F. Nano-optic endoscope for high-resolution optical coherence tomography in vivo. Nat. Photonics 2018, 12, 540–547. [Google Scholar] [CrossRef]
  15. Zheng, Y.; Yi, Z.; Liu, L.; Wu, X.; Liu, H.; Li, G.; Zeng, L.; Li, H.; Wu, P. Numerical simulation of efficient solar absorbers and thermal emitters based on multilayer nanodisk arrays. Appl. Therm. Eng. 2023, 230, 120841. [Google Scholar] [CrossRef]
  16. Qin, F.; Chen, J.; Liu, J.; Liu, L.; Tang, C.; Tang, B.; Li, G.; Zeng, L.; Li, H.; Yi, Z. Design of high efficiency perovskite solar cells based on inorganic and organic undoped double hole layer. Sol. Energy 2023, 262, 111796. [Google Scholar] [CrossRef]
  17. Wu, F.; Shi, P.; Yi, Z.; Li, H.; Yi, Y. Ultra-broadband solar absorber and high-efficiency thermal emitter from uv to mid-infrared spectrum. Micromachines 2023, 14, 985. [Google Scholar] [CrossRef]
  18. Sheokand, H.; Ghosh, S.; Singh, G.; Saikia, M.; Srivastava, K.V.; Ramkumar, J.; Ramakrishna, S.A. Transparent broadband metamaterial absorber based on resistive films. J. Appl. Phys. 2017, 122, 105105. [Google Scholar] [CrossRef]
  19. Zhou, Y.; Kravchenko, I.I.; Wang, H.; Zheng, H.; Gu, G.; Valentine, J. Multifunctional metaoptics based on bilayer metasurfaces. Light: Sci. Appl. 2019, 8, 80. [Google Scholar] [CrossRef] [Green Version]
  20. Ren, H.; Fang, X.; Jang, J.; Bürger, J.; Rho, J.; Maier, S.A. Complex-amplitude metasurface-based orbital angular momentum holography in momentum space. Nat. Nanotechnol. 2020, 15, 948–955. [Google Scholar] [CrossRef]
  21. Rundo, F.; Trenta, F.; di Stallo, A.L.; Battiato, S. Machine learning for quantitative finance applications: A survey. Appl. Sci. 2019, 9, 5574. [Google Scholar] [CrossRef] [Green Version]
  22. Goodell, J.W.; Kumar, S.; Lim, W.M.; Pattnaik, D. Artificial intelligence and machine learning in finance: Identifying foundations, themes, and research clusters from bibliometric analysis. J. Behav. Exp. Financ. 2021, 32, 100577. [Google Scholar] [CrossRef]
  23. Callahan, A.; Shah, N.H. Machine learning in healthcare. In Key Advances in Clinical Informatics; Elsevier: Amsterdam, The Netherlands, 2017; pp. 279–291. [Google Scholar]
  24. Chen, P.-H.C.; Liu, Y.; Peng, L. How to develop machine learning models for healthcare. Nat. Mater. 2019, 18, 410–414. [Google Scholar] [CrossRef] [PubMed]
  25. Singh, N.; Chaturvedi, S.; Akhter, S. Weather forecasting using machine learning algorithm. In Proceedings of the 2019 International Conference on Signal Processing and Communication (ICSC), Noida, India, 7–9 March 2019; pp. 171–174. [Google Scholar]
  26. Scher, S.; Messori, G. Predicting weather forecast uncertainty with machine learning. Q. J. R. Meteorol. Soc. 2018, 144, 2830–2841. [Google Scholar] [CrossRef]
  27. Ma, W.; Liu, Z.; Kudyshev, Z.A.; Boltasseva, A.; Cai, W.; Liu, Y. Deep learning for the design of photonic structures. Nat. Photonics 2021, 15, 77–90. [Google Scholar] [CrossRef]
  28. Ma, W.; Cheng, F.; Liu, Y. Deep-learning-enabled on-demand design of chiral metamaterials. ACS Nano 2018, 12, 6326–6334. [Google Scholar] [CrossRef]
  29. Liu, Z.; Zhu, D.; Rodrigues, S.P.; Lee, K.-T.; Cai, W. Generative model for the inverse design of metasurfaces. Nano Lett. 2018, 18, 6570–6576. [Google Scholar] [CrossRef] [Green Version]
  30. Surden, H. Machine learning and law. Wash. L. Rev. 2014, 89, 87. [Google Scholar]
  31. Qiu, J.; Wu, Q.; Ding, G.; Xu, Y.; Feng, S. A survey of machine learning for big data processing. EURASIP J. Adv. Signal Process. 2016, 2016, 67. [Google Scholar] [CrossRef] [Green Version]
  32. Hou, Z.; Tang, T.; Shen, J.; Li, C.; Li, F. Prediction network of metamaterial with split ring resonator based on deep learning. Nanoscale Res. Lett. 2020, 15, 83. [Google Scholar] [CrossRef] [Green Version]
  33. Jiang, L.; Li, X.; Wu, Q.; Wang, L.; Gao, L. Neural network enabled metasurface design for phase manipulation. Opt. Express 2021, 29, 2521–2528. [Google Scholar] [CrossRef]
  34. Gu, L.; Xie, S.; Zhang, Y.; Huang, Y.; He, Y.; Liu, H.; Wei, Z.; Guo, J. Plasmonic Metamaterial Absorbers Design Based on XGBoost and LightGBM Algorithms. Plasmonics 2022, 17, 2037–2047. [Google Scholar] [CrossRef]
  35. Han, C.; Zhang, B.; Wang, H.; Ding, J. Metamaterial perfect absorber with morphology-engineered meta-atoms using deep learning. Opt. Express 2021, 29, 19955–19963. [Google Scholar] [CrossRef]
  36. Catal, C. Performance evaluation metrics for software fault prediction studies. Acta Polytech. Hung. 2012, 9, 193–206. [Google Scholar]
  37. Cohen, I.; Huang, Y.; Chen, J.; Benesty, J.; Benesty, J.; Chen, J.; Huang, Y.; Cohen, I. Pearson Correlation Coefficient. In Noise Reduction in Speech Processing; Springer: Berlin/Heidelberg, Germany, 2009; pp. 1–4. [Google Scholar]
  38. Chai, T.; Draxler, R.R. Root mean square error (RMSE) or mean absolute error (MAE). Geosci. Model Dev. Discuss. 2014, 7, 1525–1534. [Google Scholar]
  39. Wang, W.; Lu, Y. Analysis of the mean absolute error (MAE) and the root mean square error (RMSE) in assessing rounding model. In IOP Conference Series: Materials Science and Engineering; IOP Publishing: Bristol, UK, 2018; p. 012049. [Google Scholar]
  40. Wang, D.-N.; Li, L.; Zhao, D. Corporate finance risk prediction based on LightGBM. Inf. Sci. 2022, 602, 259–268. [Google Scholar] [CrossRef]
  41. Li, J. Monthly housing rent forecast based on lightgbm (light gradient boosting) model. Int. J. Intell. Inf. Manag. Sci. 2018, 7, 3–9. [Google Scholar]
  42. Li, W.; Coppens, Z.J.; Besteiro, L.V.; Wang, W.; Govorov, A.O.; Valentine, J. Circularly polarized light detection with hot electrons in chiral plasmonic metamaterials. Nat. Commun. 2015, 6, 8379. [Google Scholar] [CrossRef] [Green Version]
  43. Hao, J.; Zhou, L.; Qiu, M. Nearly total absorption of light and heat generation by plasmonic metamaterials. Phys. Rev. B 2011, 83, 165107. [Google Scholar] [CrossRef]
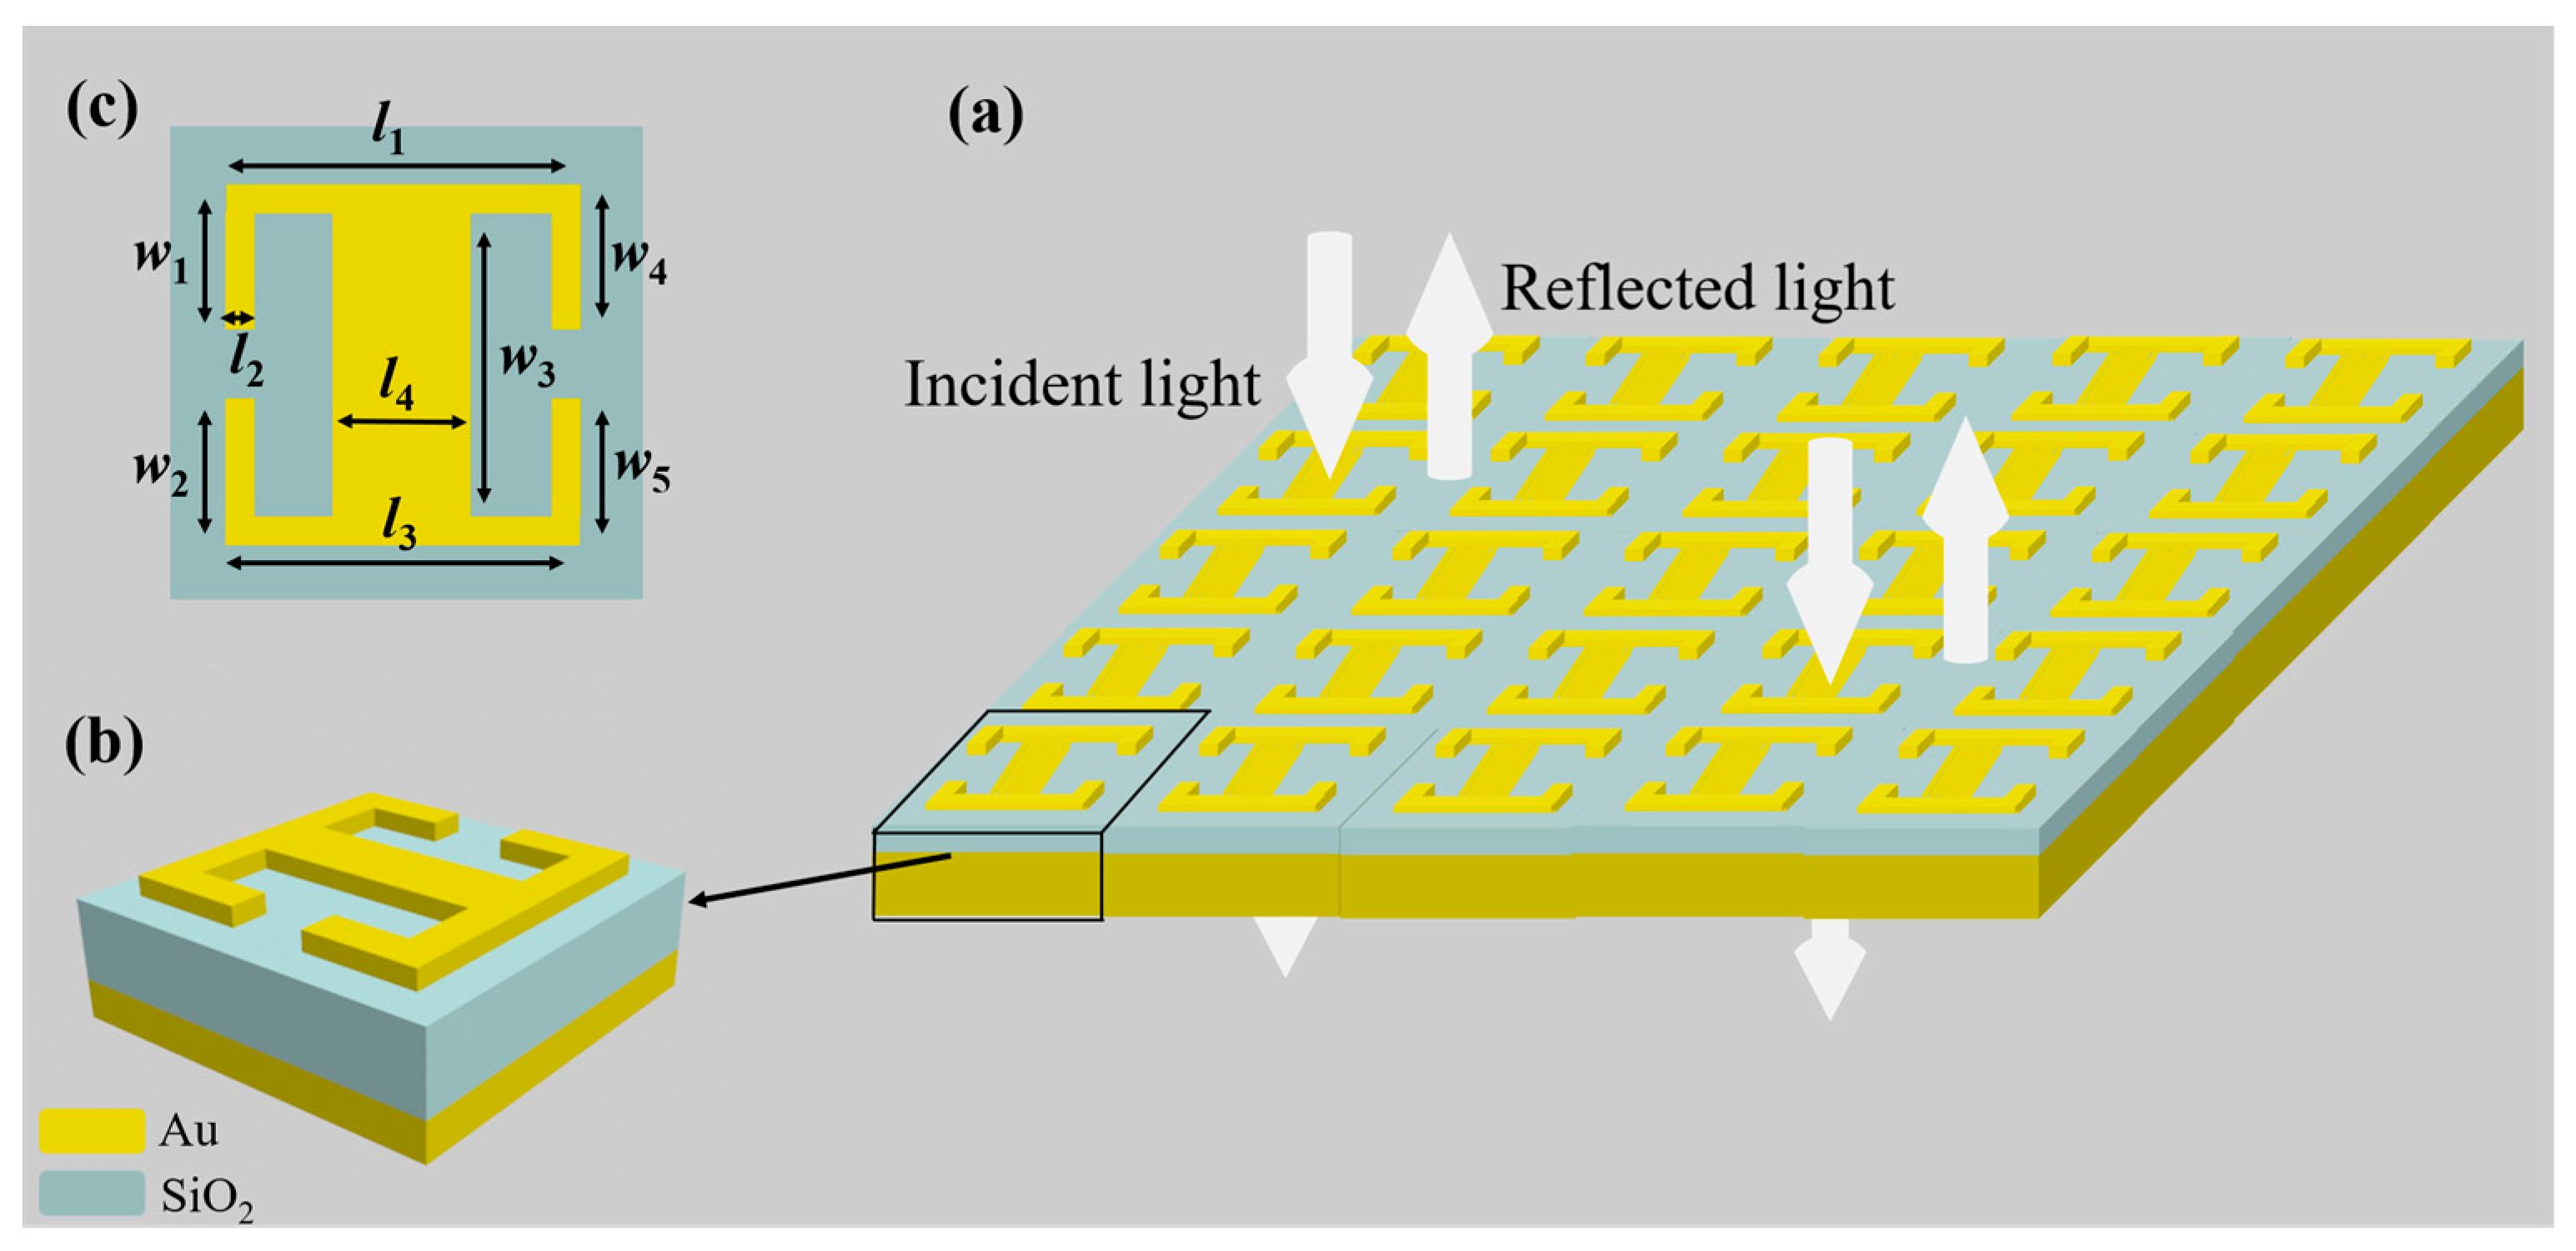
Figure 1. Schematic diagram of the structure. (a) The metamaterial consists of repeatedly arranged meta-atoms, and the linearly polarized light is incident perpendicular to the metamaterial; (b) the three-dimensional view of the meta-atom structure; (c) the top view of the meta-atom structure with eight geometric parameters.
Photonics 10 00874 g001
Figure 2. Distribution of (a) electric field |E| and (b) magnetic field |H| at operating wavelength (1 µm–2 µm).
Photonics 10 00874 g002
Figure 3. Schematic of the forward predicting network (FPN) and the inverse designing network (IDN).
Photonics 10 00874 g003
Figure 4. Primary prediction network structure diagram.
Photonics 10 00874 g004
Figure 5. Auxiliary prediction network structure diagram.
Photonics 10 00874 g005
Figure 6. (a,b) Reflectance (Transmittance) of each unit with different simulation wavelength and rectangular patch length; (c,d) reflectance (transmittance) of each unit with different simulation wavelength and split ring length; (e,f) reflectance (transmittance) of each unit with different simulation wavelength and split ring width.
Photonics 10 00874 g006
Figure 7. (ah) Performance measurement (RMSE, MAE) of absorptivity and reflectance prediction via PPN and APN.
Photonics 10 00874 g007
Figure 8. (ah) Performance measurement (R, R2) of absorptivity and reflectance prediction via PPN and APN.
Photonics 10 00874 g008
Figure 9. Predict the absorption and reflection spectrum at a fixed geometric parameter. (a,d,g) The metamaterial geometric parameter and FDTD simulation reflection and absorption spectrum; (b,e,h) the PPN predict reflection spectrum; (c,f,i) the APN model optimization error is large in the region.
Photonics 10 00874 g009
Figure 10. The errors of PPN and APN prediction (the first ten data points for each spectrum). (a) The error of PPN predict reflection; (b) the error of APN predict reflection; (c) the error of PPN predict absorption; (d) the error of APN predict absorption.
Photonics 10 00874 g010aPhotonics 10 00874 g010b
Figure 11. The training loss and validation loss of PPN. (a) The loss of the absorption predict; (b) the loss of the reflection predict.
Photonics 10 00874 g011
Figure 12. The distribution of predicted and standard values in the test set. (ad) The PPN model predict parameter 1, 5, 7, 9 (red circle: absorption, blue circle: reflection).
Photonics 10 00874 g012
Figure 13. Performance metrics for ten geometric parameters in inverse design. (a) The performance metrics (RMSE, MAE) for PPN and APN; (b) the performance metrics (R, R2) for PPN and APN.
Photonics 10 00874 g013
Figure 14. (a,d,g) Absorption spectrum and reflection spectrum of input model, (b,e,h) absorption spectrum and reflection spectrum corresponding to geometric parameters of inverse design, (c,f), (i) electric field |E| distribution of Peak at the central plane of the surface structure.
Photonics 10 00874 g014
Figure 15. Schematic diagram of the structure. (a) Chiral plasmonic metamaterial absorber meta-atom structure. (b,d) Top view of plasmonic metamaterial absorber. (c) Plasmonic metamaterial absorber meta-atom structure.
Photonics 10 00874 g015
Figure 16. (a,b) Prediction of circular dichroism in chiral plasma metamaterial absorbers using geometric parameters.
Photonics 10 00874 g016
Figure 17. (a,b) Prediction of reflectivity of metamaterial absorbers using geometric parameters.
Photonics 10 00874 g017
Figure 18. The distribution of predicted and standard values in the test set (circular dichroism). (ad) The predict of geometric parameters (Gold width, Gold gap, Gold length and Gold height).
Photonics 10 00874 g018
Figure 19. The distribution of predicted and standard values in the test set (reflection spectrum). (ad) The predict of geometric parameters (Al2O3 width, Sliver width, Sliver length and Al2O3 length).
Photonics 10 00874 g019
Table 1. The primary prediction network core parameters.
ParametersMeaningEffects of ModelingValue
num_boost_roundThe number of iterationsImprove accuracy3000
learning_rateConverge the objective function to the minimumImprove accuracy0.0001
keep_probProbability of retaining a hidden layerPrevent overfitting0.8
hidden layerFeature extraction and representation learningImprove accuracy6
Table 2. The auxiliary network core parameters.
ParametersMeaningEffects of ModelingValue
num_boost_roundThe number of iterationsImprove accuracy3000
bagging_fractionThe ratio of data used in each iterationPrevent overfitting1
feature_fractionRandomly select certain parameters to build the tree in the iterationReduce overfitting1
bagging_freqBagging timesPrevent overfitting5
learning_rateConverge the objective function to the minimumImprove accuracy0.01
num_leavesNumber of leaf nodesPrevent overfitting31
max_depthMaximum depth of treeReduce overfitting50
verboseControl the level of approach verbosityIncrease efficiency10
Table 3. The average performance metric for forward design.
ValueAverage Performance Metrics
Name RMSEMAERR2
Reflection PPN0.0100.0060.9960.989
Reflection APN0.0020.0010.9990.999
Absorption PPN0.0100.0060.9960.989
Absorption APN0.0010.0010.9990.999
Table 4. The average performance metric for inverse design.
ValueAverage Performance Metrics
Name RMSEMAERR2
Reflection PPN0.0030.0030.9450.870
Reflection APN0.0030.0030.9570.902
Absorption PPN0.0030.0030.9520.890
Absorption APN0.0030.0030.9620.906
Table 5. The average performance metric for forward prediction and inverse design.
ValueAverage Performance Metrics
Name RMSEMAERR2
Forward_Test10.0160.0100.9970.994
Forward_Test20.0010.0010.9990.999
Inverse_Test30.0010.0010.9980.996
Inverse_Test40.0010.0010.9940.980
Disclaimer/Publisher’s Note: The statements, opinions and data contained in all publications are solely those of the individual author(s) and contributor(s) and not of MDPI and/or the editor(s). MDPI and/or the editor(s) disclaim responsibility for any injury to people or property resulting from any ideas, methods, instructions or products referred to in the content.