Abstract
The Vertical Cavity Surface-Emitting Laser (VCSEL) has led to the rapid development of advanced fields such as communication, optical sensing, smart cars, and more. The accurate testing of VCSEL beam quality is an important prerequisite for its effective application. In this paper, a method for measuring the divergence angle of the VCSEL far field spot based on transmissive Fourier ptychography is proposed. First, a single CCD multi-angle VCSEL far-field spot acquisition system is designed. Second, based on the proposed Fourier ptychographic algorithm with synchronous optimization of embedded optical transfer function, a resolution-enhanced phase image of the spot is reconstructed and the boundary extracted by the Sobel operator of the phase image is defined as the boundary position of the beam waist. In this way, the beam waist radius of the laser beam is calculated. Finally, the divergence angle of the laser beam is measured via the radius of the beam waist. Compared with the traditional Gaussian beam definition method, the method proposed in this paper has higher accuracy in divergence angle measurement. The experimental results show that this method can improve the divergence angle measurement accuracy by up to 9.7%.
1. Introduction
The Vertical Cavity Surface-Emitting Laser (VCSEL) is a semiconductor laser developed based on GaAs semiconductor materials. By arranging individual VCSEL chips in a two-dimensional array of emitting units, high-power light beam emission is achieved. This technology possesses the advantages of coherence in semiconductor laser light sources, low energy consumption, and long lifespan. Moreover, the VCSEL itself is characterized by its small and symmetric beam divergence angle, ease of coupling, and low threshold current [1,2]. VCSEL chips are widely used in many fields, such as short-distance and long-distance fiber communication, 3D sensing, and laser illumination; nowadays they have even driven recent evolution in solid-state lidar [3,4,5]. In recent years, laser technology has found numerous applications in garment design and manufacturing, including cutting garment patterns [6], creating tie designs [7,8], conducting 3D body scanning [9,10], denim fading [11], and leather engraving [12]. Beam quality is an important parameter for evaluating laser performance, and must be tested after VCSEL production. The accuracy of beam quality measurement directly affects the application of VCSEL in these multiple fields.
Currently, common beam quality evaluation indicators mainly include the far-field divergence angle, power in the bucket (PIB) [13,14,15], Gaussian content, M2 factor [16,17], and beam parameter product. Among these, the far-field divergence angle and M2 factor are the most commonly used beam quality evaluation parameters. The M2 factor determines the focusing ability of the laser beam; the closer the value of M2 is to 1, the better the focusing ability of the beam and the more stable it is in practical applications. The measurement of the M2 factor requires the far-field divergence angle. The smaller the divergence angle of the Gaussian beam, the greater the utilization of laser energy, which can make the beam more directional and intense, reduce the requirements for input power and receiving sensitivity, and have a significant effect on the applications of lidar and long-distance communication. Measurement of the far-field divergence angle can be achieved through beam analyzers, knife-edge methods, CCD, etc. While beam analyzers can directly and accurately measure the beam quality, their complex implementation conditions make it difficult to measure large numbers of chips [18]. The knife-edge method measures the energy integral distribution of the beam spot to measure the beam divergence angle, which is not constrained by the waist position of the beam; however, its accuracy is not as high as other methods, and the measurement error is large [19]. Directly using CCD to measure the far-field divergence angle of the beam has the problem of fixed energy threshold biases, which can affect the accurate estimation of the final angle [20].
Although existing research has made great contributions to the methods and accuracy of beam quality measurement, there are a number of problems. In 2008, Sheldakova et al. proposed using Hartmann wavefront sensors to measure the wavefront of the beam and obtain the quality factor (M2) of the beam through one measurement [18]. In 2012, Schulze et al. used spatial light modulators to measure beam quality and eliminated the need for scanning a large number of datapoints in the projection direction [21]. In 2017, Pan et al. proposed a real-time complex amplitude reconstruction method based on the intensity propagation equation to calculate beam quality and compared the experimental results with the standard values of the laser, proving the reliability of their method [22]. However, the measured beam modes were limited to single-mode beams, an approach that is not reliable for measuring the non-standard beams emitted by VCSELs. In 2020, Du et al. used the ptychographic algorithm to collect the pattern of supercontinuum lasers and calculate the beam quality of the laser; however, the calculation complexity of this approach is high, and further optimization of the algorithm and process is needed [23]. In 2022, Kang et al. used two cameras to measure the spot size of multiple wavelengths of the supercontinuum transmitted after a certain distance; the spot was indirectly measured on a diffuse plate, which may lead to measurement errors [24].
To address the above issues, the present paper proposes a VCSEL beam far-field divergence angle measurement method based on Fourier Ptychography (FP) imaging technology. Fourier Ptychography is a super-resolution imaging technology [25] which iterates the collected images in the spatial and Fourier domains by capturing intensity images of the sample at multiple illumination angles, then reconstructs a high-resolution sample image. The FP algorithm is a phase recovery algorithm, which uses the spatial and frequency domains to fuse multiple small-aperture images into a large-aperture high-resolution image. In this way, it is possible to recover the phase information of the target sample. The beam spot formed by VCSEL on the CCD plane has a phase difference, and the edge area of the beam spot is essentially not part of the beam, with the energy and phase significantly decreasing. Therefore, the edge area needs to be removed, with only the central beam spot area retained to obtain the effective beam spot area. Moreover, VCSEL forms a far-field spot on the CCD plane through the focusing lens on the chip, meaning that the image formed is after Fraunhofer diffraction and can be viewed as a Fourier plane, which is an important prerequisite for the FP algorithm. Therefore, the phase image generated via FP can be used as a basis for defining the beam diameter. The FP technique includes data acquisition and high-resolution image reconstruction. First, multiple far-field beam spot images of VCSEL chips are directly acquired at different positions using a CCD. Second, the FP algorithm is used to process the far-field beam spot images from multiple positions, recover the phase of the far-field beam spot image, and define and measure the beam waist region by using the Sobel operator to extract the effective phase boundary. Finally, the far-field divergence angle of the beam emitted by the VCSEL is calculated. Experimental results show that the measurement error of the algorithm for measuring the far-field divergence angle of the beam through CCD is reduced by a maximum of 9.7% compared with traditional algorithms.
2. Method
2.1. CCD Imaging Measurement Method for VCSEL Beam Divergence Angle
As shown in Figure 1a, a VCSEL is typically available in the form of a multi-cell package, which increases its output power. The near-field spot of the VCSEL array reflects whether there are any damaged cells in the package. Each cell emits a Gaussian-like beam with a certain divergence angle, which propagates in space until it overlaps exactly to form a far-field spot. The propagation path of a standard Gaussian beam [26] is shown in Figure 1b. For a standard Gaussian beam, the divergence angle at the waist position ω0, i.e., the focus position, is the radius ω of the waist position divided by the differential of the depth z, and can also be expressed as θ = λ/(πω0). The beam emitted by the VCSEL is a circular spot with a central intensity lower than that of the surrounding area, similar in form to a standard Gaussian beam. In practice, the intensity at the center of the spot formed by the emitted VCSEL beam is reduced, and the most commonly used method to measure the divergence angle of the spot is to calculate the spot size using a CCD and then use the spot at the waist position to calculate the divergence angle [18]. The recording device for measuring the spot using the CCD imaging method is commonly a diffuse reflector plate, which is used as an intermediate medium for laser projection, after which the spot projection on the diffuse reflector plate is recorded by the CCD through the objective lens. Alternatively, the spot can be directly recorded via CCD. The schematic diagram of the device for recording the spot directly via CCD is shown in Figure 2. The specific implementation method is to adjust the distance d between the VCSEL and CCD and set the step size s for each adjustment while recording the spot pattern on the CCD for each adjustment. The circle is extracted using the Sobel operator from the part of the image with pixel values greater than zero, and the radius of the circle is calculated in the connected domain. After each step of movement, the radius of the circle extracted using the Sobel operator is compared; because the spot size is smallest at the focusing of the laser beam, the spot at the waist position can be identified when the radius is the smallest. Then, the waist radius r of the beam is defined by a specific segmentation method, and finally the divergence angle is obtained as twice the inverse tangent value of r and d.

Figure 1.
(a) The propagation of the VCSEL beam and (b) the standard Gaussian beam.
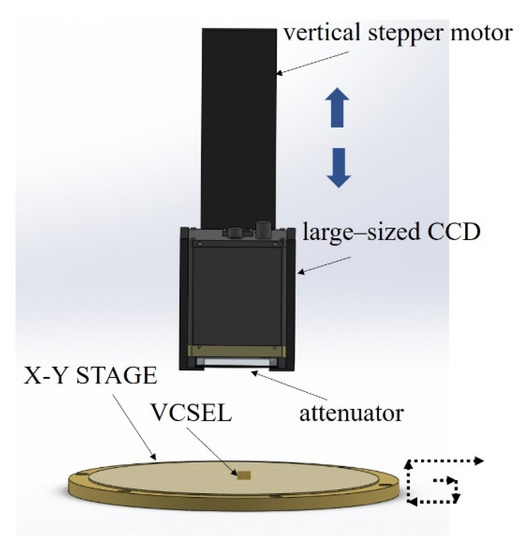
Figure 2.
Schematic diagram of the capturing setup.
Traditional methods of capturing the far-field image of laser beams using CCDs have been based on defining the effective diameter of the beam using the 1/e2, D4σ, and full width at half maximum (FWHM) methods based on Gaussian beam definitions [16,27]. These methods are feasible and efficient for standard Gaussian beams, i.e., TEM00 basic transverse mode Gaussian beams. However, for non-ideal higher-order transverse mode Gaussian beams, such as the “doughnut mode” resulting from the superposition of TEM10 and TEM01 modes emitted by certain VCSELs. These methods cannot fully represent the effective range of the beam or accurately calculate its divergence angle. For example, when using the 1/e2 segmentation method according to the ISO 11146 standard to calculate the beam divergence angle with a CCD, it is necessary to preprocess the baseline noise caused by unavoidable noise sources such as dark current noise and scattered particle noise during the operation of the image sensor [28]. In addition, the calculation area for the divergence angle needs to be at least three times the diameter of the beam [27]. The 1/e2 method defines the beam width as the distance between the rising and falling intensities of the beam distribution curve, typically in the X and Y directions, i.e., between the 1/e2 points of the peak intensity. However, even after preprocessing external noise there is remains the problem of inaccurate measurement angles due to CCD noise and crosstalk [29,30], even when measured according to ISO standards. Similarly, the FWHM waist width definition method sets the part of the beam intensity higher than 50% as the effective area and multiplies it by a factor of 1.69 to obtain the equivalent beam size when calculating the doughnut-shaped beam of the VCSEL [31]. This method shares the same problem of inaccurate waist width definition as the 1/e2 method.
2.2. Fourier Ptychographic Capturing Method and Algorithm
In this section, we introduce the use of the FP algorithm to recover the phase of the target beam and measure the divergence angle of the beam. To implement the phase recovery of the beam image using the FP algorithm, it is necessary to capture the beam images formed on the CCD at multiple angles. The specific method is to slightly move the position of the VCSEL chip, as shown by the side arrows on the X-Y platform in Figure 2. This movement strategy is the same as the updating method of the FP algorithm, moving clockwise or counterclockwise from the center to the periphery to a certain extent, thereby ensuring the convergence of the algorithm. After each movement, the intensity of the beam image formed on the CCD is recorded as Ix,y, where x and y represent the horizontal distance from the center of the CCD and the angle θ formed between x and the CCD recording plane in the x direction is the arctangent function of x/h, where h is the beam waist height. The same applies to the y direction. According to Fraunhofer diffraction law, the CCD recording plane is the Fourier plane of the far-field beam; thus, the beam image can be expressed as follows:
where O is the spatial spectrum of the beam spot, (k) is the coherent transfer function, kθ is the wavenumber of Ix,y corresponding to the angle θ, which is 2π·sinθ/λ, and λ is the wavelength of the VCSEL beam.
After multi-angles spot images have been acquired, FP algorithm reconstruction can be performed. The FP algorithm is straightforward: first, initialize a high-resolution spatial frequency spectrum O, which can be a random phase image or an image with constant values. Then, transform the initialized high-resolution image to the frequency domain using Fourier transform. Second, take a subregion u,v from and perform the inverse Fourier transform on u,v to obtain Φu,v in the spatial domain. Third, perform phase recovery iteration on the Φu,v region, for which the most commonly used algorithms are the Gerchberg and Fienup [32] phase recovery algorithms. In this paper, the Gerchberg–Saxton (GS) algorithm is used. In the tth iteration, the amplitude of is updated to the measured value, with the following intensity constraint used to ensure that the phase is unchanged.
After updating via inverse Fourier transform, it is further transformed to the frequency domain and then updated to the high-resolution frequency domain . In order to improve the accuracy of phase recovery and reduce the influence of crosstalk and other factors, this paper uses a transmission function synchronization update strategy [33,34], i.e., updating the transmission function while updating the spectrum to enhance the algorithm’s robustness against noise. The update method initializes the coherent transfer function to 1 and updates the transfer function using a step size equal to the product of the difference between the pre- and post-update spectrum u,v and the transfer function. The update strategy for the transfer function is similar:
where * represents taking the complex conjugate, α and β are constraint parameters to prevent the function values from overflowing, and the constants α and β adjust the step size of the update and the step size of the transfer function, respectively, normally setting them all as 1. At this point, the fourth step is to perform iteration on all subregions. Fifth, repeat the second to fourth steps until the phase of the high-resolution reconstructed image converges. Due to the constraint conditions provided by multiple spot images, often only 5–10 iterations are required, significantly reducing the number of iterations compared to traditional phase recovery algorithms. As shown in Figure 3, the phase error is defined as the difference between the reconstructed phase result for each iteration and the set phase threshold value decreases to the lowest level after five iterations, indicating the convergence of the phase. Therefore, the number of iterations can be set to 5–10 for full convergence. Finally, the phase result is output. The corresponding algorithm flowchart is shown in Figure 4.
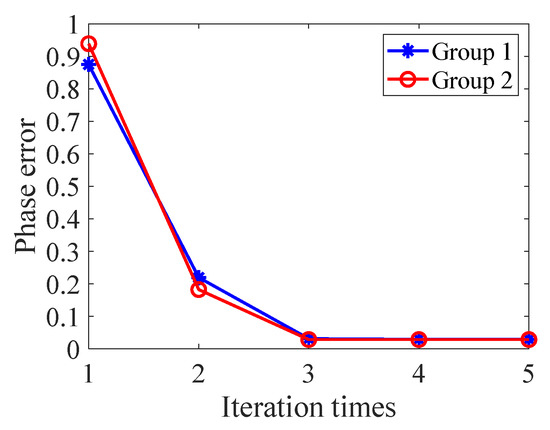
Figure 3.
After five iterations the reconstruction phase of FP reaches convergence in two groups of experiments.
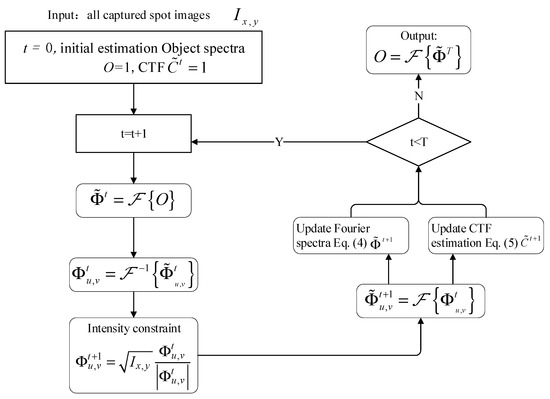
Figure 4.
The phase retrieval algorithm flow chart based on FP.
Compared with the complex texture structure of cells in Fourier microscopy imaging, the features occupied by spots are greatly reduced. Therefore, unlike the general FP algorithm, which requires a large number of low-resolution images to complete high-resolution reconstruction, the FP reconstruction algorithm for VCSEL chip beam spots presented in this paper only requires a small number of spot images. When the FP reconstruction result already satisfies the requirement for positioning the beam waist of the spot, the number of spot acquisitions has met the demand. Figure 5 shows FP phase recovery with different amounts of collected data. The innermost phase defines the size of the beam spot. Figure 5a shows reconstruction using only one spot image with the traditional GS phase recovery algorithm; it can be seen that the recovered phase is incomplete. By measuring the effective area of the spot corresponding to the recovered phase, the beam waist radius size is determined to be 12.636 mm. Figure 5b uses 3 × 3 collected spot images for reconstruction; the measured beam waist radius size based on the effective area of the spot corresponding to the recovered phase is 12.986 mm. Figure 5c increases the number of collected spot images to 7 × 7 for reconstruction. The measured beam waist radius size is 12.988 mm, which is essentially consistent with the 3 × 3 result, with an error within a single pixel size, indicating that the reconstruction results of 3 × 3 and 7 × 7 spot images are equivalent. Therefore, this system only needs to collect 3 × 3 spot images to achieve accurate definition of the beam spot size. Using more data for reconstruction only increases computational complexity and cannot obtain more accurate results. At the same time, these results demonstrate that the FP reconstruction results are more accurate than those obtained using the GS algorithm alone.
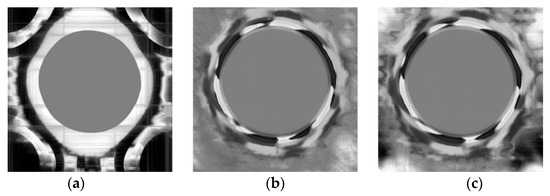
Figure 5.
FP reconstruction results with different quantities of beam spot images. (a) 1 × 1 result. (b) 3 × 3 result. (c) 7 × 7 result.
As shown in Figure 6, a comparison of image regions is made between the method of defining spot size using 1/e2 and the FP-based method proposed in this paper. The FP-based phase recovery method can more accurately locate the position of the spot, while the 1/e2 method has shortcomings such as locating the beam waist position outside the spot region. Therefore, using the FP phase recovery method proposed in this paper to define the beam divergence angle is more accurate.
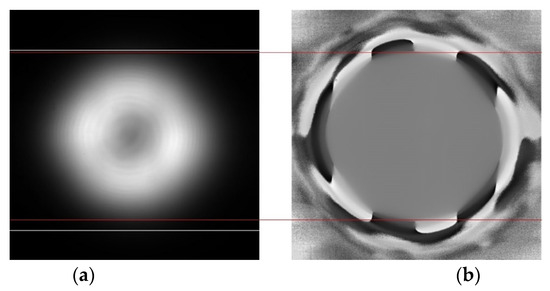
Figure 6.
The difference in beam spot size between the definitions obtained using the 1/e2 method and the FP-based phase retrieval algorithm: (a) the beam waist defined using the 1/e2 method and (b) the beam waist defined using the FP-based method.
3. FP Beam Divergence Angle Measurement System
The FP beam divergence angle measurement system mainly includes a stepper motor system, a power meter system, a CCD camera system, and a computer control end, as shown in Figure 7. The stepper motor system has a stepping accuracy of 1 um and the CCD camera uses a large-sized CCD, the model of which is the B6620 industrial camera produced by IMPERX. The pixel count is 6600 × 4400 and the single pixel size is 5.5 μm. The specific parameters and experimental system setup are shown in Table 1.
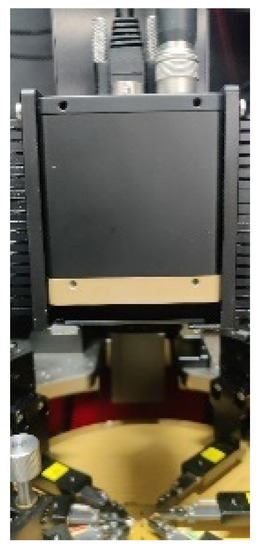
Figure 7.
Experimental setup for capturing FP data.

Table 1.
Parameters of the CCD.
In the experiment, the measured VCSEL is located at the center of the CCD. The source table system applies a pulsed current to the vertical stepper motor through a probe and the bottom X-Y platform to adjust the up and down positions of the stepper motor in order to adjust the brightness and size of the spot observed on the CCD. Using the method of locating the smallest spot described in Section 2.1 with the CCD camera method for measuring the VCSEL beam divergence angle, the results collected by the camera after each step are extracted by using the Sobel operator to form a circle, then the diameters of all circles are compared to find the camera axial position with the smallest circular area, which indicates that the beam waist position has been located. It should be noted that the VCSEL has high optical power. Directly acquiring spot information through the CCD may cause overexposure of the CCD, and the collected spots may be non-uniform, which may damage the CCD components [35]. Therefore, an attenuator is placed between the CCD and the VCSEL to reduce the light intensity passing through the CCD and to make the collected spots uniformly distributed on the CCD. After the center position spot is collected, the X-Y platform is slightly moved, and the power is reconnected to collect the spot image again until all the required spot images have been collected.
4. Experimental Results and Analysis
In the experiment, a VCSEL chip with gallium arsenide as the semiconductor material was used. The wavelength was 940 nm, and it contained a total of 305 emitting units. The size of a single VCSEL was measured microscopically to be 620 × 505 μm. Two VCSELs were used in the experiment for spot collection, one of which was a standard VCSEL with a rated power of 2 W and a standard divergence angle of 18° (based on manufacturer’s specifications and measured via precision beam quality analyzer by the manufacturer), while the other was a defective VCSEL with weaker parameters and beam quality than the standard VCSEL. The experimental steps for the two VCSELs were the same. The beam waist position was first located by applying a 2A pulsed current to the VCSEL, then the vertical position of the camera was adjusted to confirm the beam waist position at a distance of 25.5 mm from the imaging surface of the CCD. Spot data were collected on this plane. Data collection was performed in a darkroom; ideally, the pixel value of the CCD in this situation should be zero without a light source. However, due to the CCD noise problem mentioned above a denoising step was performed first. Before measuring the spot, optical imaging was performed, in which a small number of white speckle areas were observed in the field of view. Based on the bandpass filtering and sampling principle, an active bandpass filter with an adjustable center frequency was used to suppress broadband white noise to finally remove the CCD noise [36]. Five sets of spot data were collected for each VCSEL chip, with each set consisting of 3 × 3 spot images collected relative to the CCD center. Each time a spot image was collected, the VCSEL was moved by 4 μm.
After collecting five sets of spot data for each VCSEL chip, the divergence angle was measured using the 1/e2 definition method for the fifth spot image in each set, which was the spot image at the center of the CCD. At the same time, the FP-based phase recovery algorithm was used to process all nine spot images in each set in order to generate a recovered phase image; the divergence angle was measured as well. After determining the beam width using both methods, the calculation method for the divergence angle was almost the same, i.e., the number of pixels included in the determined beam width was multiplied by the pixel size. Because the size of the phase image reconstructed by FP was twice that of the original image, the pixel size was half the CCD size. The half of the beam width was then divided by the height d between the CCD and VCSEL and the arctangent value of this quotient was taken to obtain the divergence angle. Figure 8a,b shows microscopic images of each chip, (c) and (d) show the part of the image containing the spot collected in the fifth set of the first group for (a) and (b), respectively, and (e) and (f) show the results of the first group of FP phase recovery for each chip. As the difference in the definition of the beam size between the two cannot be directly distinguished from the images alone, the actual measured data for the two are analyzed and calculated below.
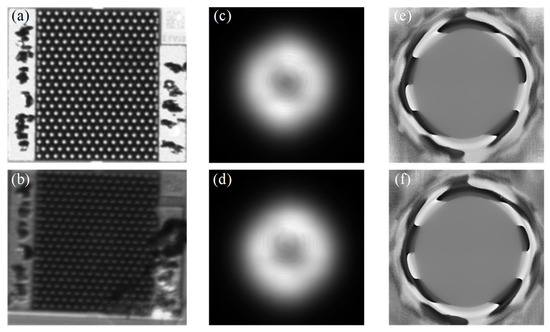
Figure 8.
(a) The standard VCSEL and (b) the impaired VCSEL; their experimental results are shown in (c,e) and (d,f), respectively.
When using a standard VCSEL for the experiment, as shown in Figure 9a and Table 2, the measured value of the beam divergence angle obtained using the FP-based method to determine the waist width of the beam (Figure 8a) differs from the standard value by a maximum of only 1.14°. When using the 1/e2 method to determine the waist width, the measurement result differs from the standard value by up to 2.24°, which is higher than the measurement result obtained using the method proposed in this paper. Compared with the standard value, the accuracy of the FP beam divergence angle measurement method is 9.7% higher than that of the 1/e2 method, which is consistent with the result in Figure 5. When using the FWHM method to measure the divergence angle, the accuracy is lower than that of the FP-based method when applied to non-standard Gaussian beam spots formed by VCSEL, as shown in Table 2. The FWHM method cannot represent the true divergence angle of the beam, and its error is 30.6% higher than that of the FP beam divergence angle measurement method. In the experiment using the defective VCSEL, as shown in Figure 8b, the lower right part of the chip has been damaged, and should be excluded during optical detection. For VCSELs, the focusability is partially determined by the divergence angle, which means that VCSELs with better performance are certain to have smaller angles and those with worse performance are usually damaged or manufactured defectively. Thus, this study is used to verify whether the proposed method can distinguish between the divergence angles of defective and standard VCSELs. In Table 3 and Figure 9b, the divergence angles calculated using the 1/e2, FWHM, and FP methods are all higher than the standard VCSEL’s divergence angle, indicating that the FP method has a certain detection capability for the chip’s divergence angle. At the same time, each chip underwent a total of five repeated tests, and the variance showed that the FP-based measurement method has a certain stability.
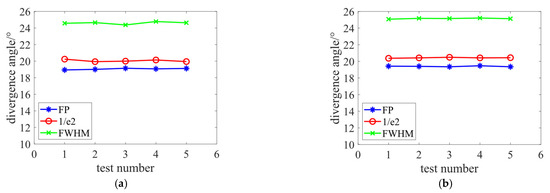
Figure 9.
Divergence angle measurement line charts, showing (a) VCSEL1 and (b) VCSEL2 via three measurement standards.

Table 2.
The divergence angle measurements with standard VCSEL via three measurement standards.

Table 3.
The divergence angle measurement with impaired VCSEL via three measurement standards.
5. Conclusions
In response to the problem of low measurement accuracy in measuring the far-field divergence angle of a beam using the current 1/e2 waist width definition method due to the influence of CCD crosstalk, this paper proposes a method for measuring the beam divergence angle based on FP phase recovery algorithm. Based on the characteristics of the FP algorithm, which can restore high-resolution images and phases from multiple images taken from different angles, this paper applies the FP algorithm to measure the beam divergence angle. The VCSEL was moved multiple times to capture far-field beam images, then the phase of the beam was restored using the FP algorithm. The edge information of the reconstructed phase image is extracted based on the Sobel operator in order to define the beam waist width more accurately, which reduces the crosstalk of both the CCD itself and the divergence of the VCSEL beam and more accurately measures the beam divergence angle. Our experimental results demonstrate that the FP algorithm has higher accuracy and better repeatability than the traditional 1/e2 method for calculating the divergence angle of VCSEL far-field beams, with the accuracy being improved by 9.7% compared to the traditional method. The proposed method has good performance for measuring beam quality, and can obtain accurate results without using more precise beam quality analysis instruments.
While the proposed method for measuring the beam divergence angle based on the FP phase recovery algorithm shows promising results and improvements over the traditional 1/e2 waist width definition method, it is important to discuss its limitations and potential future directions for further development. One limitation of the proposed method is its dependency on VCSEL movement. To capture far-field beam images from different angles, the VCSEL needs to be moved multiple times. This introduces the possibility of errors and limitations due to mechanical vibrations or misalignments during the movement process. These factors can result in inaccuracies in the measured divergence angle. Another limitation is the sensitivity of the FP algorithm to noise. While the algorithm is capable of restoring high-resolution images and phases, it may be sensitive to noise present in the captured images. If the noise level is significant, especially in low-light or high-contrast scenarios, the accuracy of the divergence angle measurement could be compromised. To overcome these limitations and further develop the proposed method, several potential future directions can be explored. First, research efforts can focus on developing robust noise reduction techniques. Advanced denoising algorithms, adaptive filtering methods, or image enhancement techniques tailored specifically for the FP phase recovery process could improve accuracy in the presence of noise. In addition, calibration and stabilization mechanisms can be investigated to mitigate the limitations associated with VCSEL movement. Precise calibration and stabilization would ensure accurate alignment and minimize vibrations or misalignments during the capturing process, leading to more reliable measurements.
Author Contributions
Conceptualization, L.A. and L.J.; methodology, L.A.; software, L.J.; validation, L.J., X.Q. and L.A.; formal analysis, L.A.; investigation, X.Q.; resources, X.Q.; data curation, L.J.; writing—original draft preparation, L.J.; writing—review and editing, L.A.; visualization, X.Q.; supervision, L.A.; project administration, L.J.; funding acquisition, L.A. All authors have read and agreed to the published version of the manuscript.
Funding
This research was funded by the 111 project (grant number B23008), Natural Science Foundation of Jiangsu Province (grant number BK20180597), China Postdoctoral Science Foundation (grant number 2020M681483), National Natural Science Foundation of China (grant number 62205130), Jiangsu Province Social Science Foundation Youth Project (grant number 22YSC001), Jiangsu Province Culture and Tourism Research General Project (grant number 22YB30), Jiangsu Province Universities Philosophy, and Social Science General Project (grant number 2021SJA0866).
Institutional Review Board Statement
Not applicable.
Informed Consent Statement
Not applicable.
Data Availability Statement
Data are available on request due to restrictions, e.g., privacy or ethical.
Conflicts of Interest
The authors declare no conflict of interest.
References
- Koyama, F. Recent advances of VCSEL photonics. J. Light. Technol. 2006, 24, 4502–4513. [Google Scholar] [CrossRef]
- Michalzik, R. VCSEL fundamentals. In VCSELs: Fundamentals, Technology and Applications of Vertical-Cavity Surface-Emitting Lasers; Springer: Berlin/Heidelberg, Germany, 2012; pp. 19–75. [Google Scholar]
- Dummer, M.; Johnson, K.; Rothwell, S.; Tatah, K.; Hibbs-Brenner, M. The role of VCSELs in 3D sensing and LiDAR. In Optical Interconnects XXI; SPIE: Bellingham, WA, USA, 2021; pp. 42–55. [Google Scholar]
- Giovane, L.M.; Wang, J.; Murty, M.R.; Harren, A.L.; Cheng, A.-N.; Dolfi, D.; Feng, Z.-W.; Leong, N.; Sridhara, A.; Taslim, S.-J. Development of next generation data communication VCSELs. In Proceedings of the 2020 Optical Fiber Communications Conference and Exhibition (OFC), San Diego, CA, USA, 8–12 March 2020; pp. 1–3. [Google Scholar]
- Ledentsov, N.; Shchukin, V.; Kalosha, V.; Turkiewicz, J.; Ledentsov, N. Development of VCSELs and VCSEL-based Links for Data Communication beyond 50 Gb/s. In Optical Fiber Communication Conference; Optica Publishing Group: Washington, DC, USA, 2020; p. M2A-3. [Google Scholar]
- Tian, Y.; Liu, Q.; Zhang, Y.; Hou, X.; Zhang, Y. Obtaining colored patterns on polyamide fabric with laser pretreatment and pomegranate peel dyeing. Text. Res. J. 2022, 92, 2080–2089. [Google Scholar] [CrossRef]
- Nayak, R.; Padhye, R. The use of laser in garment manufacturing: An overview. Fash. Text. 2016, 3, 5. [Google Scholar] [CrossRef]
- Sarkar, J.; Al Faruque, M.A.; Khalil, E. Predicting the tearing strength of laser engraved denim garments using a fuzzy logic approach. Heliyon 2022, 8, e08740. [Google Scholar] [CrossRef]
- Bartol, K.; Bojanić, D.; Petković, T.; Pribanić, T. A review of body measurement using 3D scanning. IEEE Access 2021, 9, 67281–67301. [Google Scholar] [CrossRef]
- Xia, S.; Guo, S.; Li, J.; Istook, C. Comparison of different body measurement techniques: 3D stationary scanner, 3D handheld scanner, and tape measurement. J. Text. Inst. 2019, 110, 1103–1113. [Google Scholar] [CrossRef]
- Du, W.; Zuo, D.; Gan, H.; Yi, C. Comparative study on the effects of laser bleaching and conventional bleaching on the physical properties of indigo kapok/cotton denim fabrics. Appl. Sci. 2019, 9, 4662. [Google Scholar] [CrossRef]
- Nayak, R.; Gon, D.P.; Khandual, A. Application of LASER in Apparel Industry. Man-Made Text. India 2008, 51, 341–346. [Google Scholar]
- Mahdieh, M. Numerical approach to laser beam propagation through turbulent atmosphere and evaluation of beam quality factor. Opt. Commun. 2008, 281, 3395–3402. [Google Scholar] [CrossRef]
- Soskind, Y.; Anisimov, I. Laser cavity mode formation employing diffractive phase structures. In Laser Technology for Defense and Security XII; SPIE: Bellingham, WA, USA, 2016; pp. 85–92. [Google Scholar]
- Zhou, P.; Liu, Z.; Xu, X.; Chen, Z.; Wang, X. Beam quality factor for coherently combined fiber laser beams. Opt. Laser Technol. 2009, 41, 268–271. [Google Scholar] [CrossRef]
- Sasnett, M. Propagation of multimode laser beams–the M2 factor. In The Physics and Technology of Laser Resonators; CRC Press: Boca Raton, FL, USA, 2020; pp. 132–142. [Google Scholar]
- Siegman, A.E. Defining, measuring, and optimizing laser beam quality. Laser Reson. Coherent Opt. Model. Technol. Appl. 1993, 1868, 2–12. [Google Scholar]
- Kudryashov, A.V.; Sheldakova, J.V.; Paxton, A.H.; Kudryashov, A.V.; Zavalova, V.Y.; Ilchenko, V.S.; Cherezova, T.Y. Beam quality measurements with Shack-Hartmann wavefront sensor and M2-sensor: Comparison of two methods. In Laser Resonators and Beam Control IX; SPIE: Bellingham, WA, USA, 2007. [Google Scholar]
- de Araújo, M.A.; Silva, R.; de Lima, E.; Pereira, D.P.; de Oliveira, P.C. Measurement of Gaussian laser beam radius using the knife-edge technique: Improvement on data analysis. Appl. Opt. 2009, 48, 393–396. [Google Scholar] [CrossRef]
- Zhou, X.; Zhang, D.; Wang, Y.; Xiao, W.; Jiang, C. Measurement of laser energy distribution on the target surface of CCD detector by image fusion method. In Sixth International Symposium on Laser Interaction with Matter; SPIE: Bellingham, WA, USA, 2022; pp. 17–23. [Google Scholar]
- Schulze, C.; Flamm, D.; Duparré, M.; Forbes, A. Beam-quality measurements using a spatial light modulator. Opt. Lett. 2012, 37, 4687–4689. [Google Scholar] [CrossRef]
- Pan, S.; Ma, J.; Zhu, R.; Ba, T.; Zuo, C.; Chen, F.; Dou, J.; Wei, C.; Zhou, W. Real-time complex amplitude reconstruction method for beam quality M(2) factor measurement. Opt. Express 2017, 25, 20142–20155. [Google Scholar] [CrossRef]
- Du, M.; Loetgering, L.; Eikema, K.S.E.; Witte, S. Measuring laser beam quality, wavefronts, and lens aberrations using ptychography. Opt. Express 2020, 28, 5022–5034. [Google Scholar] [CrossRef]
- Kang, J.; Chen, S.; Yang, W. Measuring far-field beam divergence angle of supercontinuum fiber sources. J. Nonlinear Opt. Phys. Mater. 2022, 31, 2350003. [Google Scholar] [CrossRef]
- Zheng, G.; Horstmeyer, R.; Yang, C. Wide-field, high-resolution Fourier ptychographic microscopy. Nat. Photonics 2013, 7, 739–745. [Google Scholar] [CrossRef]
- Alda, J. Laser and Gaussian beam propagation and transformation. Encycl. Opt. Eng. 2003, 999, 1013. [Google Scholar]
- ISO 11146-1:2005; ISO 11146-1 Lasers and Laser-Related Equipment—Test Methods for Laser Beam Widths, Divergence Angles and Beam Propagation Ratios—Part 1: Stigmatic and Simple Astigmatic Beams. International Standardization for Standardization-ISO: Geneva, Switzerland, 2005.
- Healey, G.E.; Kondepudy, R. Radiometric CCD camera calibration and noise estimation. IEEE Trans. Pattern Anal. Mach. Intell. 1994, 16, 267–276. [Google Scholar] [CrossRef]
- Santos, C.N.; Chrétien, S.; Merella, L.; Vandewal, M. Visible and near-infrared laser dazzling of CCD and CMOS cameras. In Technologies for Optical Countermeasures XV; SPIE: Bellingham, WA, USA, 2018; pp. 179–187. [Google Scholar]
- Schwarz, B.; Ritt, G.; Eberle, B. Impact of threshold assessment methods in laser-induced damage measurements using the examples of CCD, CMOS, and DMD. Appl. Opt. 2021, 60, F39–F49. [Google Scholar] [CrossRef]
- Sharma, P.; Guler, Z.; Jackson, N. Development and characterization of confocal sputtered piezoelectric zinc oxide thin film. Vacuum 2021, 184, 109930. [Google Scholar] [CrossRef]
- Fienup, J.R. Phase retrieval algorithms: A comparison. Appl. Opt. 1982, 21, 2758–2769. [Google Scholar] [CrossRef] [PubMed]
- Holloway, J.; Wu, Y.; Sharma, M.K.; Cossairt, O.; Veeraraghavan, A. SAVI: Synthetic apertures for long-range, subdiffraction-limited visible imaging using Fourier ptychography. Sci. Adv. 2017, 3, e1602564. [Google Scholar] [CrossRef] [PubMed]
- Ou, X.; Zheng, G.; Yang, C. Embedded pupil function recovery for Fourier ptychographic microscopy. Opt. Express 2014, 22, 4960–4972. [Google Scholar] [CrossRef]
- Dewey, C.W.; Brunke, M.W.; Sakovitch, K. Transcranial photobiomodulation (laser) therapy for cognitive impairment: A review of molecular mechanisms and potential application to canine cognitive dysfunction (CCD). Open Vet. J. 2022, 12, 256–263. [Google Scholar] [CrossRef]
- Faraji, H.; MacLean, W.J. CCD noise removal in digital images. IEEE Trans. Image Process. 2006, 15, 2676–2685. [Google Scholar] [CrossRef]
Disclaimer/Publisher’s Note: The statements, opinions and data contained in all publications are solely those of the individual author(s) and contributor(s) and not of MDPI and/or the editor(s). MDPI and/or the editor(s) disclaim responsibility for any injury to people or property resulting from any ideas, methods, instructions or products referred to in the content. |
© 2023 by the authors. Licensee MDPI, Basel, Switzerland. This article is an open access article distributed under the terms and conditions of the Creative Commons Attribution (CC BY) license (https://creativecommons.org/licenses/by/4.0/).