Article

Manganese-Doped Carbon Dots as a Promising Nanoprobe for Luminescent and Magnetic Resonance Imaging

by
Evgeniia A. Stepanidenko
1,*,
Anna A. Vedernikova
1,
Zilya F. Badrieva
2,
Ekaterina A. Brui
2,
Saikho O. Ondar
1,3,
Mikhail D. Miruschenko
1,
Olga V. Volina
4,
Aleksandra V. Koroleva
4,
Evgeniy V. Zhizhin
4 and
Elena V. Ushakova
1,*
1
International Research and Education Center for Physics of Nanostructures, ITMO University, 197101 Saint Petersburg, Russia
2
Faculty of Physics, ITMO University, 197101 Saint Petersburg, Russia
3
Saint-Petersburg State Institute of Technology, 190013 Saint Petersburg, Russia
4
Research Park, Saint Petersburg State University, 199034 Saint Petersburg, Russia
*
Authors to whom correspondence should be addressed.
Photonics 2023, 10(7), 757; https://doi.org/10.3390/photonics10070757
Submission received: 24 April 2023 / Revised: 23 June 2023 / Accepted: 28 June 2023 / Published: 30 June 2023
(This article belongs to the Special Issue Women’s Special Issue Series: Photonics)

Abstract

:
Luminescent carbon nanodots (CDs) are a low-toxic nanomaterial with a tunable emission in a wide spectral range and with various functional groups on the surface. Therefore, CDs can prospectively serve as luminescent nanoprobes for biomedical applications, such as drug-delivery, visualization, sensing, etc. The doping of CDs with paramagnetic or transition metals allows the expansion of the range of applications of CDs and the fabrication of a multimodal nanoprobe for bioimaging. Here, we developed CDs doped with manganese (Mn) based on commonly used precursors—o-phenylenediamine or citric acid and formamide. The chemical structure, morphology, optical properties, and magnetic resonance responses have been carefully studied. The obtained CDs are up to 10 nm, with emissions observed in the 400–650 nm spectral region. CDs exhibit an ability to reduce both T1 and T2 relaxation times by up to 6.4% and 42.3%, respectively. The high relaxivity values suggest the use of CDs as promising dual-mode contrast agents for T1 and T2 MRI. Therefore, our developed CDs can be utilized as a new multifunctional nanoscale probe for photoluminescent and magnetic resonance bioimaging.

1. Introduction

Carbon-based materials have taken a unique place among the currently existing luminescent nanomaterials. The most interesting and promising representative from the carbon family are carbon nanodots (CDs), which have been known about since 2004 [1] and are being actively studied at present [2]. CDs demonstrate unique physicochemical characteristics, as they have a wide and adjustable photoluminescence (PL) band, they are biologically compatible, low toxic, and can also be used in various fields, from optoelectronics [3,4,5] and cryptography [6,7,8] to biomedicine [9,10].
Today, photonic nanoprobes are very popular and are used as sensors on different solvent polarities, pH values, gases, pollutions, metal ions, humidities, etc. [11,12]. These probes are based on changes in optical signals and the detection of this response. One of the methods for biomedical diagnostics is the lab-on-fiber concept for sensing glucose, urea, cholesterol, etc. [13], including those where the optical tips are covered with CDs [14]. Another example of optical nanoprobes are those based on surface-enhanced Raman scattering (SERS), which are very sensitive [15] and can be also supported by the lab-on-fiber concept [16,17]. But these methods are complex and require expensive instrumentation in contrast to fluorescent nanoprobes, which act instantly, and the signal can be easily detected even with the naked eye. Ratiometric nanoprobes [18], based on the reversible changing ratio of several absorption and/or luminescence bands in the presence of analytes, allow real-time visualization. For the authors of [19], the photonic nanoprobe for the detection of low thrombin concentration in human serum is based on a reduction in the Raman signal and recovering PL signal. Carbon dots, as excellent fluorescent nanoprobes, could be used for bioapplications to track different analytes (metal ions, molecules, biomarkers, proteins, etc.) by increasing/decreasing optical density and/or PL intensity [20]. In our previous research, we suggested CDs as simultaneous ratiometric pH probes and optical sensors for solvent polarity in real-time [21].
In biomedical applications, CDs are mainly used as luminescent nanoprobes for bioimaging to label various cells, track changes in the body by PL monitoring, etc. In this regard, an important task is to develop CDs with absorption/emission in the long-wavelength spectral range, including the near infrared region (NIR), since this range is transparent for biological tissues and since such nanoprobes will reduce cell autofluorescence during diagnostics [22].
Apart from luminescent biovisualization, one of the reliable and most informative diagnostic methods is magnetic resonance imaging (MRI). The image obtained during MR scanning reflects the magnetic characteristics of tissues and the time of longitudinal (T1) and transverse (T2) relaxation of protons; the contrast of the image is affected by the magnetic characteristics of tissues, as well as their various functional features. In order to enhance the signal and identify pathologies, contrast agents (CAs) are used, which contain paramagnetic or transition elements that can enhance contrast due to a controlled change in the relaxation rates of hydrogen protons in tissues, and contain unpaired electrons at the external level (substances based on gadolinium (Gd), manganese (Mn), dysprosium (Dy), iron (Fe), etc.) [23]. The main characteristic of CA is relaxivity (r), which reflects how T1 or T2 relaxation rates depend on CAs’ concentration. As shown by the authors of [24], the relaxivity can change depending on the environment and the strength of the magnetic field. The other vital property of CA is its low toxicity and safety. Gd-CAs are the most popular and widely used, although there are still cases of side effects from their use [25]. In addition, the use of Gd-CAs increases the cost of an expensive MR diagnostic. In this regard, the search for new CAs based on other low-cost substances, such as Mn, is in demand [26,27,28,29].
The development and design of novel photonic nanoprobes with MR and optical responses are in high demand in biomedicine [30]. State-of-the-art research development is seen in the formation of CAs based on CDs, doped by the above-mentioned metals [31]; such nanomaterial is expected to demonstrate a combination of the best properties of CDs (high PL, biocompatibility, nanometer size, etc.) and the ability to influence the proton relaxation times. These two-modal nanoprobes based on Gd [32,33,34,35], different lanthanides [36,37,38], and Mn [39,40,41,42], etc., have been recently suggested. Another interesting direction is the development of dual T1 and T2 CAs, usually based on nano- and microparticles with a complex structure [43,44,45,46]. The main drawback of these particles is their size; the use of particles larger than 5.5 nm is limited [47].
Herein, we suggested synthesis protocols to fabricate Mn-doped CDs based on o-phenylenediamine or citric acid and formamide with PL varying from the blue to red spectral region. The influence of using a Mn source on the chemical structure of CDs was investigated in detail. These Mn-doped CDs demonstrate good relaxivity values, r1 ranging from 4.8 to 9.7 L mmol−1s−1 and r2 ranging from 42.2 to 89.0 7 L mmol−1s−1 depending on the organic precursor and Mn salts used. A decrease in T1 relaxation time by 4–6.4% was observed; a strong decrease in T2 relaxation time by up to 42.3% was observed, while the concentration of Mn-doped CDs was 2.5 µmol/L. Therefore, we developed Mn-doped CDs’ prospects for future research as dual-modal nanoprobes for PL and MR bioimaging.

2. Materials and Methods

2.1. Materials

Citric acid (CA, 99.5%), o-phenylenediamine (OPD, flaked, 99.5%), formamide (FA, ≥99.0%, ReagentPlus, GC), manganese (II) acetate tetrahydrate (Mn(AcO)2·4H2O) (99.99%), and manganese (II) chloride tetrahydrate (MnCl2·4H2O) (98%) were purchased from Sigma–Aldrich. Ethanol (EtOH) (>96%) was purchased from Vekton (Saint Petersburg, Russia). Water was purified using a Milli-Q (18.2 MΩ) reagent-grade water system from Millipore (Burlington, MA, USA). Saline solution 0.9% (SOLOPHARM, Grotex, Russia) was used as a solvent throughout the MRI experiments. All chemicals were used as received.

2.2. Carbon Dots Synthesis

CDs were synthesized by one-pot solvothermal heating of the precursors’ solution. CD-1 was synthesized from 2.8 mmol of OPD and 0.8 mmol of Mn(AcO)2 in 10 mL of EtOH. CD-2 was synthesized from 2.8 mmol of OPD and 0.8 mmol of MnCl2 in 10 mL of EtOH. CD-3 was obtained from 2.6 mmol of CA and 0.5 mmol of Mn(AcO)2 in 5 mL of FA. CD-4 was obtained from 2.6 mmol of CA and 0.5 mmol of MnCl2 in 5 mL of FA. All precursor mixtures were stirred until they completely dissolved, then mixtures were placed in Teflon-lined stainless-steel autoclaves and heated at 180 °C for 12 h. After the reaction, the autoclave was naturally cooled to room temperature. To remove unreacted precursors and molecular fluorophores, stock solutions of CD-1 and CD-2 were transferred to a dialysis tube with a molecular weight cut-off of 3.5 kDa for dialysis against deionized (DI) water for 24 h. To purify CD-3 and CD-4 from molecular fluorophores, stock solutions of CDs were dissolved in 30 mL of EtOH and precipitated by centrifugation at 6000 rpm for 15 min. This procedure was repeated 3 times, until the supernatants changed the color from dark red to light purple, then the precipitants were dissolved in DI water and transferred to dialysis tubes (a molecular weight cut-off of 3.5 kDa) for dialysis against DI water for 24 h. After dialysis, CD solutions were filtered through a 0.22 μm membrane to remove large particles and agglomerates. The synthesis conditions for all samples are summarized in Table S1 (Supporting Information, SI).

2.3. Experimental Setup

Atomic force microscopy (AFM) measurements were carried out using a Solver PRO-M microscope (NT-MDT, Moscow, Russia) in the semi-contact mode. For AFM measurements, solutions of CDs were spin-coated onto the mica substrates at 1500 rpm for 20 s. Fourier transform infrared (FTIR) spectra were recorded on a Tenzor II infrared spectrophotometer (Bruker, Billerica, MA, USA) in an attenuated total reflection mode. X-ray photoelectron spectroscopy (XPS) was carried out using an ESCALAB 250Xi photoelectron spectrometer (Thermo Fisher Scientific, Waltham, MA, USA) with AlKα radiation (photon energy of 1486.6 eV) in the constant pass energy mode at 100 eV for the survey spectrum, and at 50 eV for the element core level spectra using an XPS spot size of 650 μm. The peaks were fitted with Voigt functions. The metal content in CDs was determined by inductively coupled plasma-emission spectrometer (ICPE-9000, Shimadzu Kyoto, Japan). Standard samples for the calibration were made of multi- and mono-standards MERC in 0.1 N HNO3. For MRI measurements, CDs were dissolved in saline solution 0.9% in different concentration of metal-ion in a range of 0–7 µmol/L. Relaxivity was measured using a 1.5 T clinical MRI scanner (Magnetom Espree, Siemens Helthineers, Erlangen, Germany). For this, series of T1- and T2-weighted MR images of tubes (ø = 3 cm) with samples were acquired based on inversion-recovery (TR = 6000 ms, TE = 92 ms, TI = 35/100/200/400/800/1600/3200/4000/5000 ms) and multi-echo turbo spin-echo (TR = 6000 ms, TE = 8.6/325/642 ms, TSE factor = 8) pulse sequences, respectively. Then, the acquired MR data were postprocessed using home-built Matlab (MathWorks Inc., Natick, MA, USA) scripts. For this, for each pixel, signal evolution curves were fitted with corresponding theoretical curves: S T I = C ( 1 2 e T I / T 1 ) and S T I = C e T E T 2 ) , correspondingly for T1 and T2 mapping. Mean T1 and T2 values were measured in the acquired maps in circle-shape regions of interest (ROIs) in each sample. Relaxivity values (r1, r2) were calculated from the slopes of linear trends of the dependencies of relaxation rates (1/T1 and 1/T2) on the concentrations of Mn in the samples. Absorption spectra were recorded on a spectrophotometer UV-3600 (Shimadzu, Kyoto, Japan). PL excitation-emission (PLE-PL) maps in the UV-Vis range were collected on a Cary Eclipse fluorescence spectrometer (Agilent, Santa Clara, CA, USA).

3. Results and Discussion

3.1. Morphology and Chemical Composition of CDs

At first, the morphology and chemical composition of the Mn-doped CDs were studied by AFM, XPS, and FTIR spectroscopy. The typical AFM images and corresponding heights distributions are shown in Figure 1 and Figure S1 (SI). The height values of particles were statistically analyzed and the parameters are given in Table S2 (SI). The CD-1 heights were within the range of 1–4 nm with a mean value of 1.9 ± 1.3 nm (Figure 1a,e). The height distribution for samples CD-2 and CD-3 have been approximated by two Gaussian peaks (Figure S2), which show the presence of two fractions of nanoparticles in both samples. CD-2 had height distributions with maxima at 1.1 ± 0.3 and 4.9 ± 2.3 nm, and a mean value, estimated by statistical analysis, of 5.7 ± 3.5 nm (Figure 1b,f and Figure S2a). In sample CD-3, maxima were at 1.6 ± 1.2 and 5.7 ± 2.1 nm and the mean value of the CD-3 height was 3.5 ± 2.7 (Figure 1c,g and Figure S2b). In samples CD-3 and CD-4, prepared from CA and FA, larger aggregates with heights up to 25–38 nm were observed (Figure S1c,d, SI). The mean value of the CD-4 height was 2.8 ± 2.3 nm (Figure 1d,h).
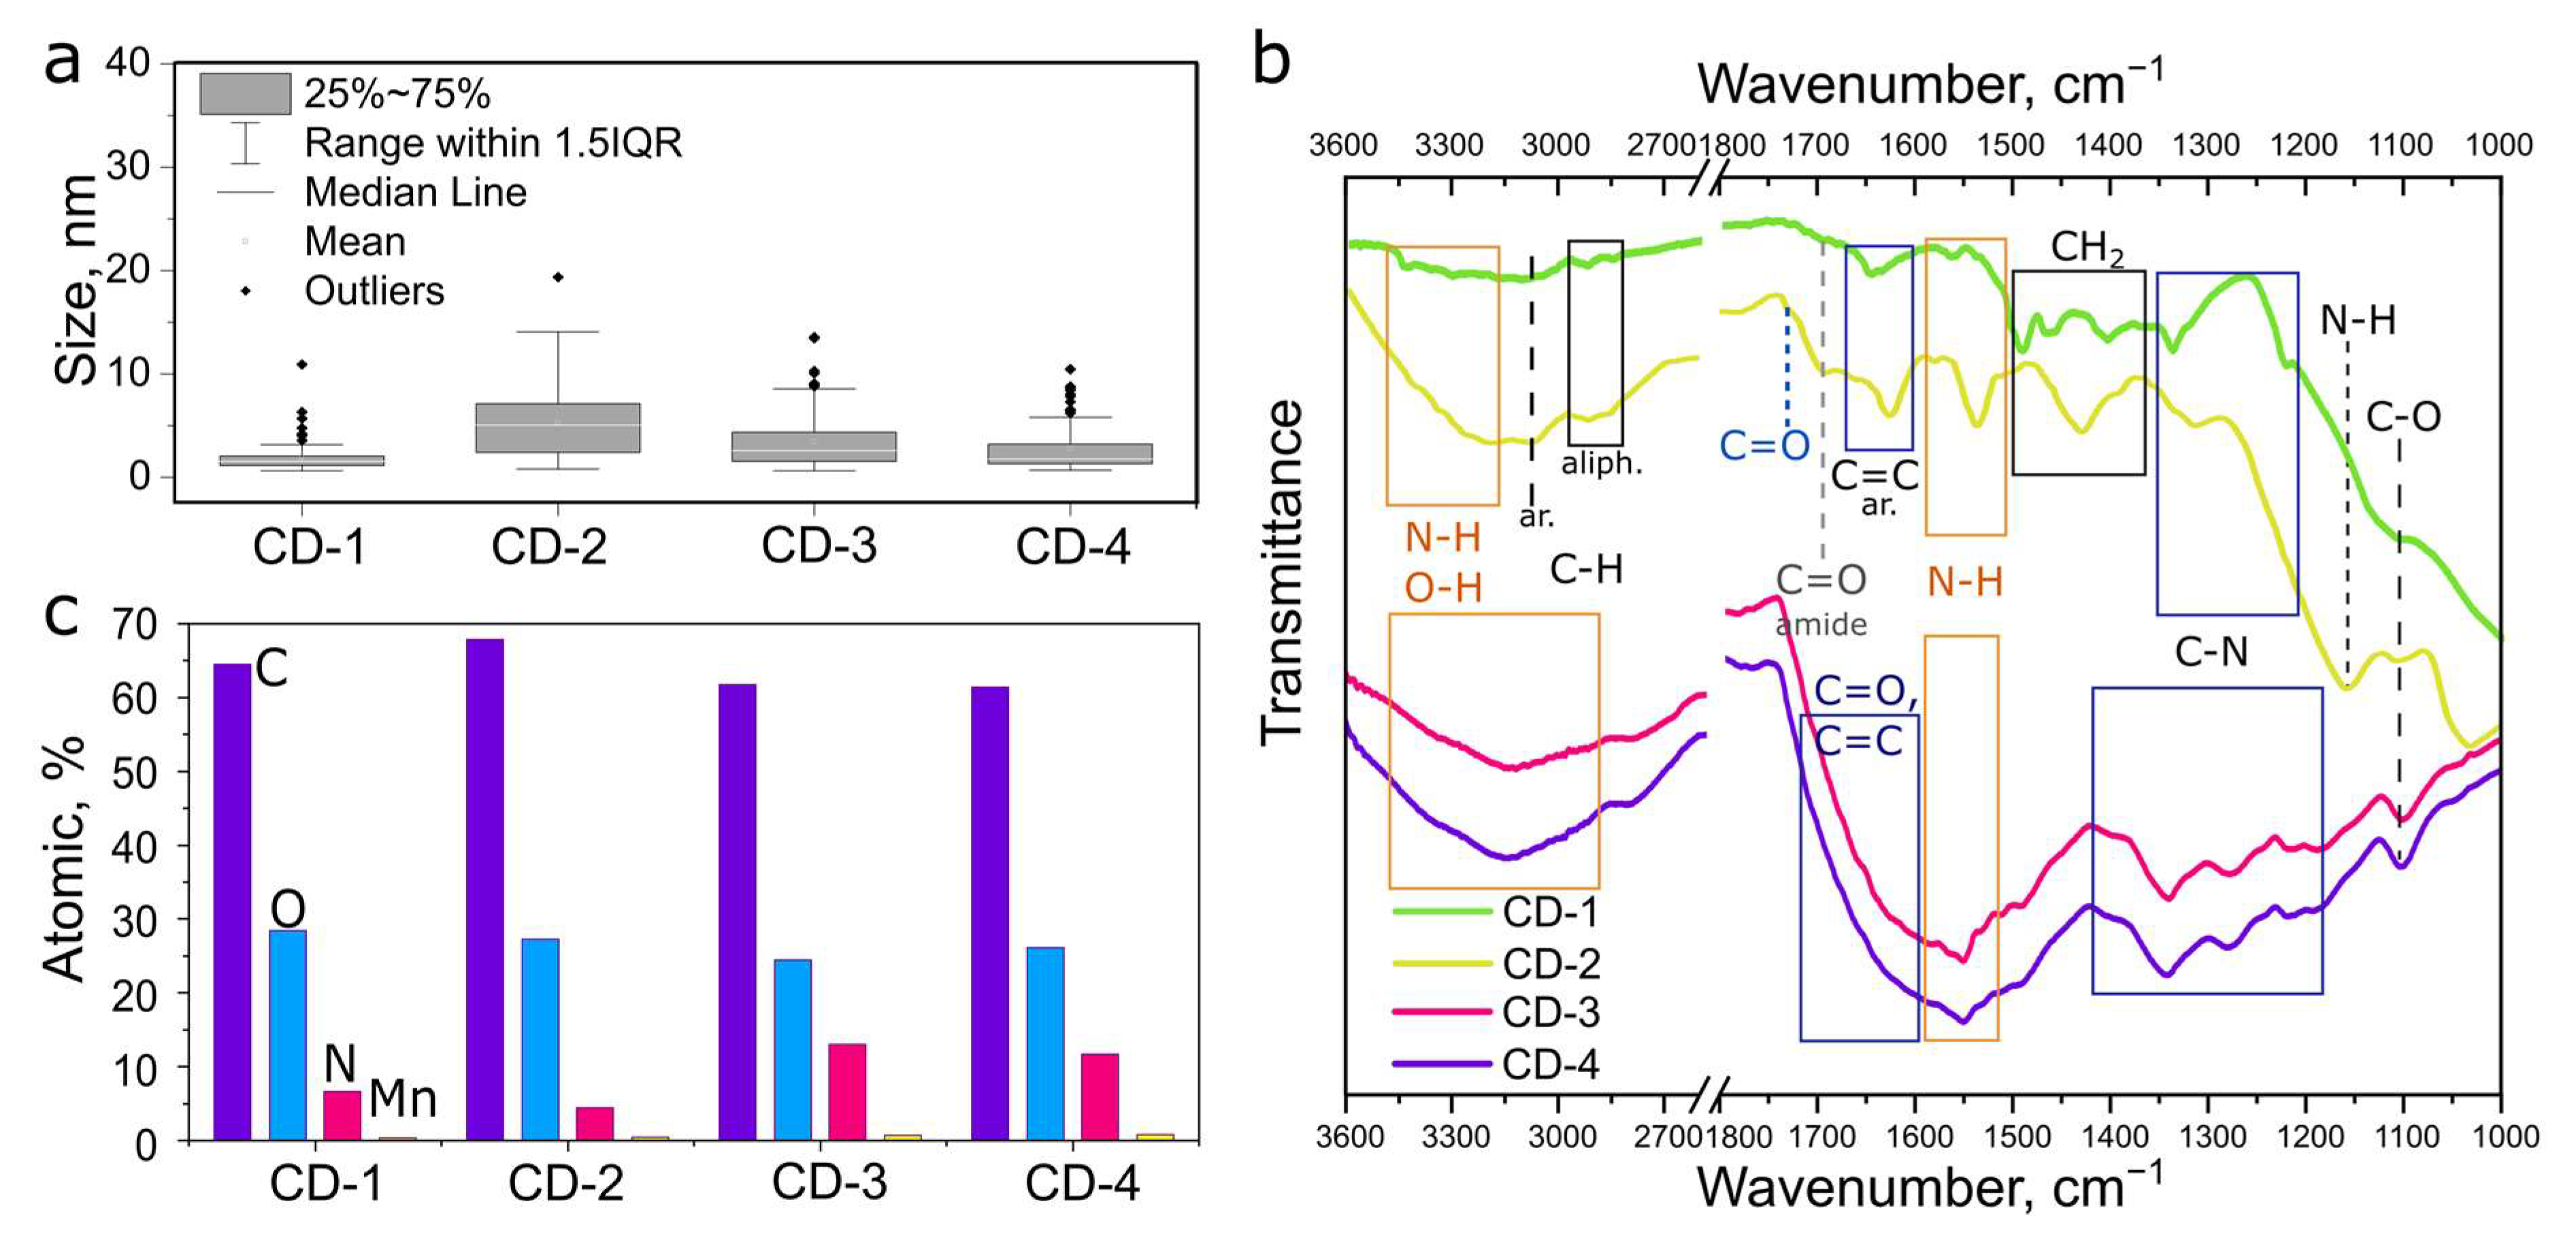
From the statistical analysis of the AFM images, the average height of all CDs did not exceed 10 nm (Figure 2a). Thus, the use of a different source of manganese led to the formation of particles of different sizes in both types of CDs (based on OPD and CA + FA) in a different way: in the CD-1 and CD-2 pair, MnCl2 caused the formation of larger nanoparticles with a better distribution. In contrast, for the second set of CDs, the larger particles were formed with the use of Mn(AcO)2 (CD-3).
FTIR spectra of all CDs in Figure 2b show that, despite using different kinds of Mn-precursors, there are significant similarities between CDs based on OPD (CD-1 and CD-2) and CA + FA (CD-3 and CD-4). In all four samples, intense broad absorption in the range of 2800–3400 cm−1 was present and corresponded to the H-bonding. The absorption at 3100–3500 cm−1 was attributed to the N-H stretching vibrations of amines/amides and was present for all samples. The FTIR spectra of CD-1 and CD-2 (green and yellow lines in Figure 2b) demonstrated peaks of stretching vibrations of amines/amides at 3440–3400 and 3340–3365 cm−1 for the—NH groups; the peak at 1222 cm−1 in CD-1 spectra could be attributed to the C-N bonds. The peaks at 1300–1340 and 3050–3080 cm−1 corresponded to the stretching of C-N and C-H in the aromatic ring in both CD-1 and CD-2. The low intense peak at 1690 cm−1 could be related to the C=O band of amide I. Well-defined peaks, at around 1646 and 1560 for CD-1 and at 1624 and 1534 cm−1 for CD-2, could be due to the vibrations of the C=C aromatic and N-H bending groups, respectively. The peaks at 1350–1500 cm−1, together with the peaks at 2850–3000 cm−1, corresponded to the -CH2 and -CH3 aliphatic groups, therefore, the strong peaks at these ranges of CD-2 may indicate the presence of aliphatic chains, which could explain the larger size of CD-2. The absorption at approx. 1150 and 1100 cm−1 may be associated with C-O-C vibrations, and the peak at 1150 cm−1 in CD-2 may be due to bending vibrations of N-H in (NH2)-C=O. Hence, CD-1 and CD-2 had N-doped aromatic domains and surfaces rich with amine groups; moreover, the CD-2 sample had a significant amount of aliphatic carbon groups.
The FTIR spectra of CD-3 and CD-4, shown in Figure 2b as pink and purple lines, respectively, also demonstrated peaks at 2800 and 2930 cm−1 attributed to the C-H aliphatic groups. The wide absorption in the range 1680–1520 cm−1, with peaks around 1625 and 1564 cm−1, could be attributed to the stretching and bending vibrations of amide I (C=O) and amide II (N-H), respectively. Furthermore, the intense absorption around 1700–1650 cm−1 could also have been caused by a vibration of the C=O bonds of the carboxyl groups, along with the formation of an aromatic C=C network. The peak at 1354 cm−1 in both spectra of CD-3 and CD-4 was attributed to the C–N groups within the secondary amide associated with the aromatic carbon network. The peaks at 1282, 1220, and 1100 cm−1 may indicate the presence of (NH)-C=O groups and the vibration of C-O within the CDs, respectively. Thus, CD-3 and CD-4 demonstrated a high content of aromatic carbon domains, along with the presence of secondary amines and amides.
From the full survey XPS spectrum (Figure S3, SI), all CDs consisted of 60–67% carbon, 4–13% nitrogen, 24–28% oxygen, and 0.4–0.8% manganese (Figure 2c and Table S1, SI). The nitrogen and manganese contents were highest in the CD-3 and CD-4 samples. Moreover, their chemical composition was almost the same, which agrees well with the FTIR spectra. The lowest nitrogen content with the highest carbon content was observed for the CD-2 sample, which corresponds to the previous assumption about a high content of aliphatic carbon. High-resolution XPS spectra for C 1s, N 1s, O 1s, and Mn 2p bands, and their decomposition into peaks corresponding to various bonds, are presented in Figure S4 (SI), from which it can be inferred that the composition of CDs depended on the synthesis type, i.e., CDs synthesized from OPD or from CA and FA. For all CDs, the C 1s band was deconvoluted to peaks at approx. 285, 286.3, and 288.5 eV, which were attributed to the C–C/C-H carbon network, C–OH/C–O–C/C–N bonds, and R–C=O bonds, respectively. However, the first peak prevailed in CD-1 and CD-2, while the content of the N–C=O groups was small. From the N 1s spectra of CD-1 and CD-2, the nitrogen was in the form of amine, amide, and pyridinic N with a small amount of graphitic N. From O 1s of CD-1 and CD-2, the oxygen was mostly in the C-O-C/C=O groups. On the contrary, in CD-3 and CD-4, the significant content of the N-C=O groups was revealed, which was seen from all C 1s, N 1s, and O 1s spectra. For all samples, Mn 2p spectra demonstrated two bands: peak at approx. 642.0 eV (2p3/2) and peak at 653.7 eV for CD-1 and CD-2, and 653.9 eV for CD-3 and CD-4 (2p1/2). It is seen that both spectra have a shoulder near the peaks 2p3/2 and 2p1/2 in a higher energy region. This could be related to the presence of Mn ions with an increased degree of oxidation state as the 2p peaks shifted to higher energies [48,49]. According to the literature, the peaks observed at 643.8 and approx. 646 eV are attributed to Mn (VI) in K2MnO4 and Mn (VII) in KMnO4, respectively [50,51]. The deconvolution parameters for the Mn 2p3/2 band are given in Table S4 (SI). The use of MnCl2 as a precursor led to the increased oxidation state of the Mn ions incorporated into the CD structure. For the second CD set (CD-3 and CD-4), the degree of Mn ion oxidation in the CD structure was larger compared to OPD-based CDs (CD-1 and CD-2).
To conclude, CD-1 and CD-2 mostly consist of an aromatic C=C network, with oxygen mostly in the C-O-C bounds, and a small amount of nitrogen groups at the surface and in the aromatic carbon domains. The substantial presence of aliphatic C-C and C-H in CD-2 may explain the larger size in contrast to CD-1. The composition of CD-3 and CD-4 is similar: both samples consist of an aromatic C=C network and have many amides and amines on their surface, including those associated with aromatic domains. XPS analysis confirmed the incorporation of Mn into the CD’s structure, mainly in the IV state, with a small amount of Mn (VII).

3.2. Optical Properties and MR Performance

The optical properties of Mn-doped CDs are presented in Figure 3. In the absorption spectra of CD-1 and CD-2, two peaks were observed at 258 nm and 418 nm (Figure 3a). The first one was attributed to π-π* transitions of sp2-hybridized carbon domains, and the second peak was attributed to optical transitions of OPD derivatives, such as 2,3-diaminophe-nazine (2,3-DAPN), which was formed during the carbonization process [21,52]. The similar absorption spectra of CD-1 and CD-2 indicate the similarity of formed optical centers within carbon nanoparticles, regardless of their size. PLE-PL maps of OPD-based CDs are shown in Figure 3b,c; in these CDs, the most intense emissive center is observed at 560 nm, efficiently excited at 418 and 255 nm and corresponding to absorption peaks.
The absorption spectra of CD-3 and CD-4 (Figure 3a) demonstrated the monotonous increase in the optical density in the range of 200–300 nm, which was attributed to the formation of C=C bonds and to optical transitions of the CDs’ “core”. According to the authors of [53], an absorption within 300–450 nm, and a broad absorption band at 500–600 nm with maximum at 535 nm, are due to transitions in optical centers similar to N and O-doped polycyclic aromatic hydrocarbons (PAHs) in the CDs’ core and on their surface; the monotonically decreasing absorption in the 600–700 nm region may originate from optical n–π* transitions of surface molecular groups bonded to sp2-domains. It should be noted that the absorption spectra for both CD-3 and CD-4 were not affected by the scattering signal, as shown in Figure S5 (SI). From the PLE-PL maps of the second CDs set (Figure 3d,e), the excitation-dependent PL band was observed with a peak that shifted from 420 to 550 nm under an excitation from 350 to 450 nm. Another PL band was excitation-independent, with a maximum at 620 nm under excitation at 550 nm. From a comparison of the absorption and PLE bands, the blue-green emission of CD-3 and CD-4 was due to different doped PAHs within the CDs, and the red PL band was caused by the CDs’ surface groups [53]. It should be noted that the CDs emission in the spectral range from 500 to 670 nm cannot be attributed to Mn-complexes within the CDs, since most of the emissive complexes were based on Mn (II) [41] and the manganese content was too low for its contribution to overall emission.
To summarize, the Mn-doped CDs developed in this work demonstrated emission in a wide spectral range, including blue, yellow, and red spectral regions. The optical parameters of all CD samples are summarized in Table S3 (SI).

3.3. MR Performance

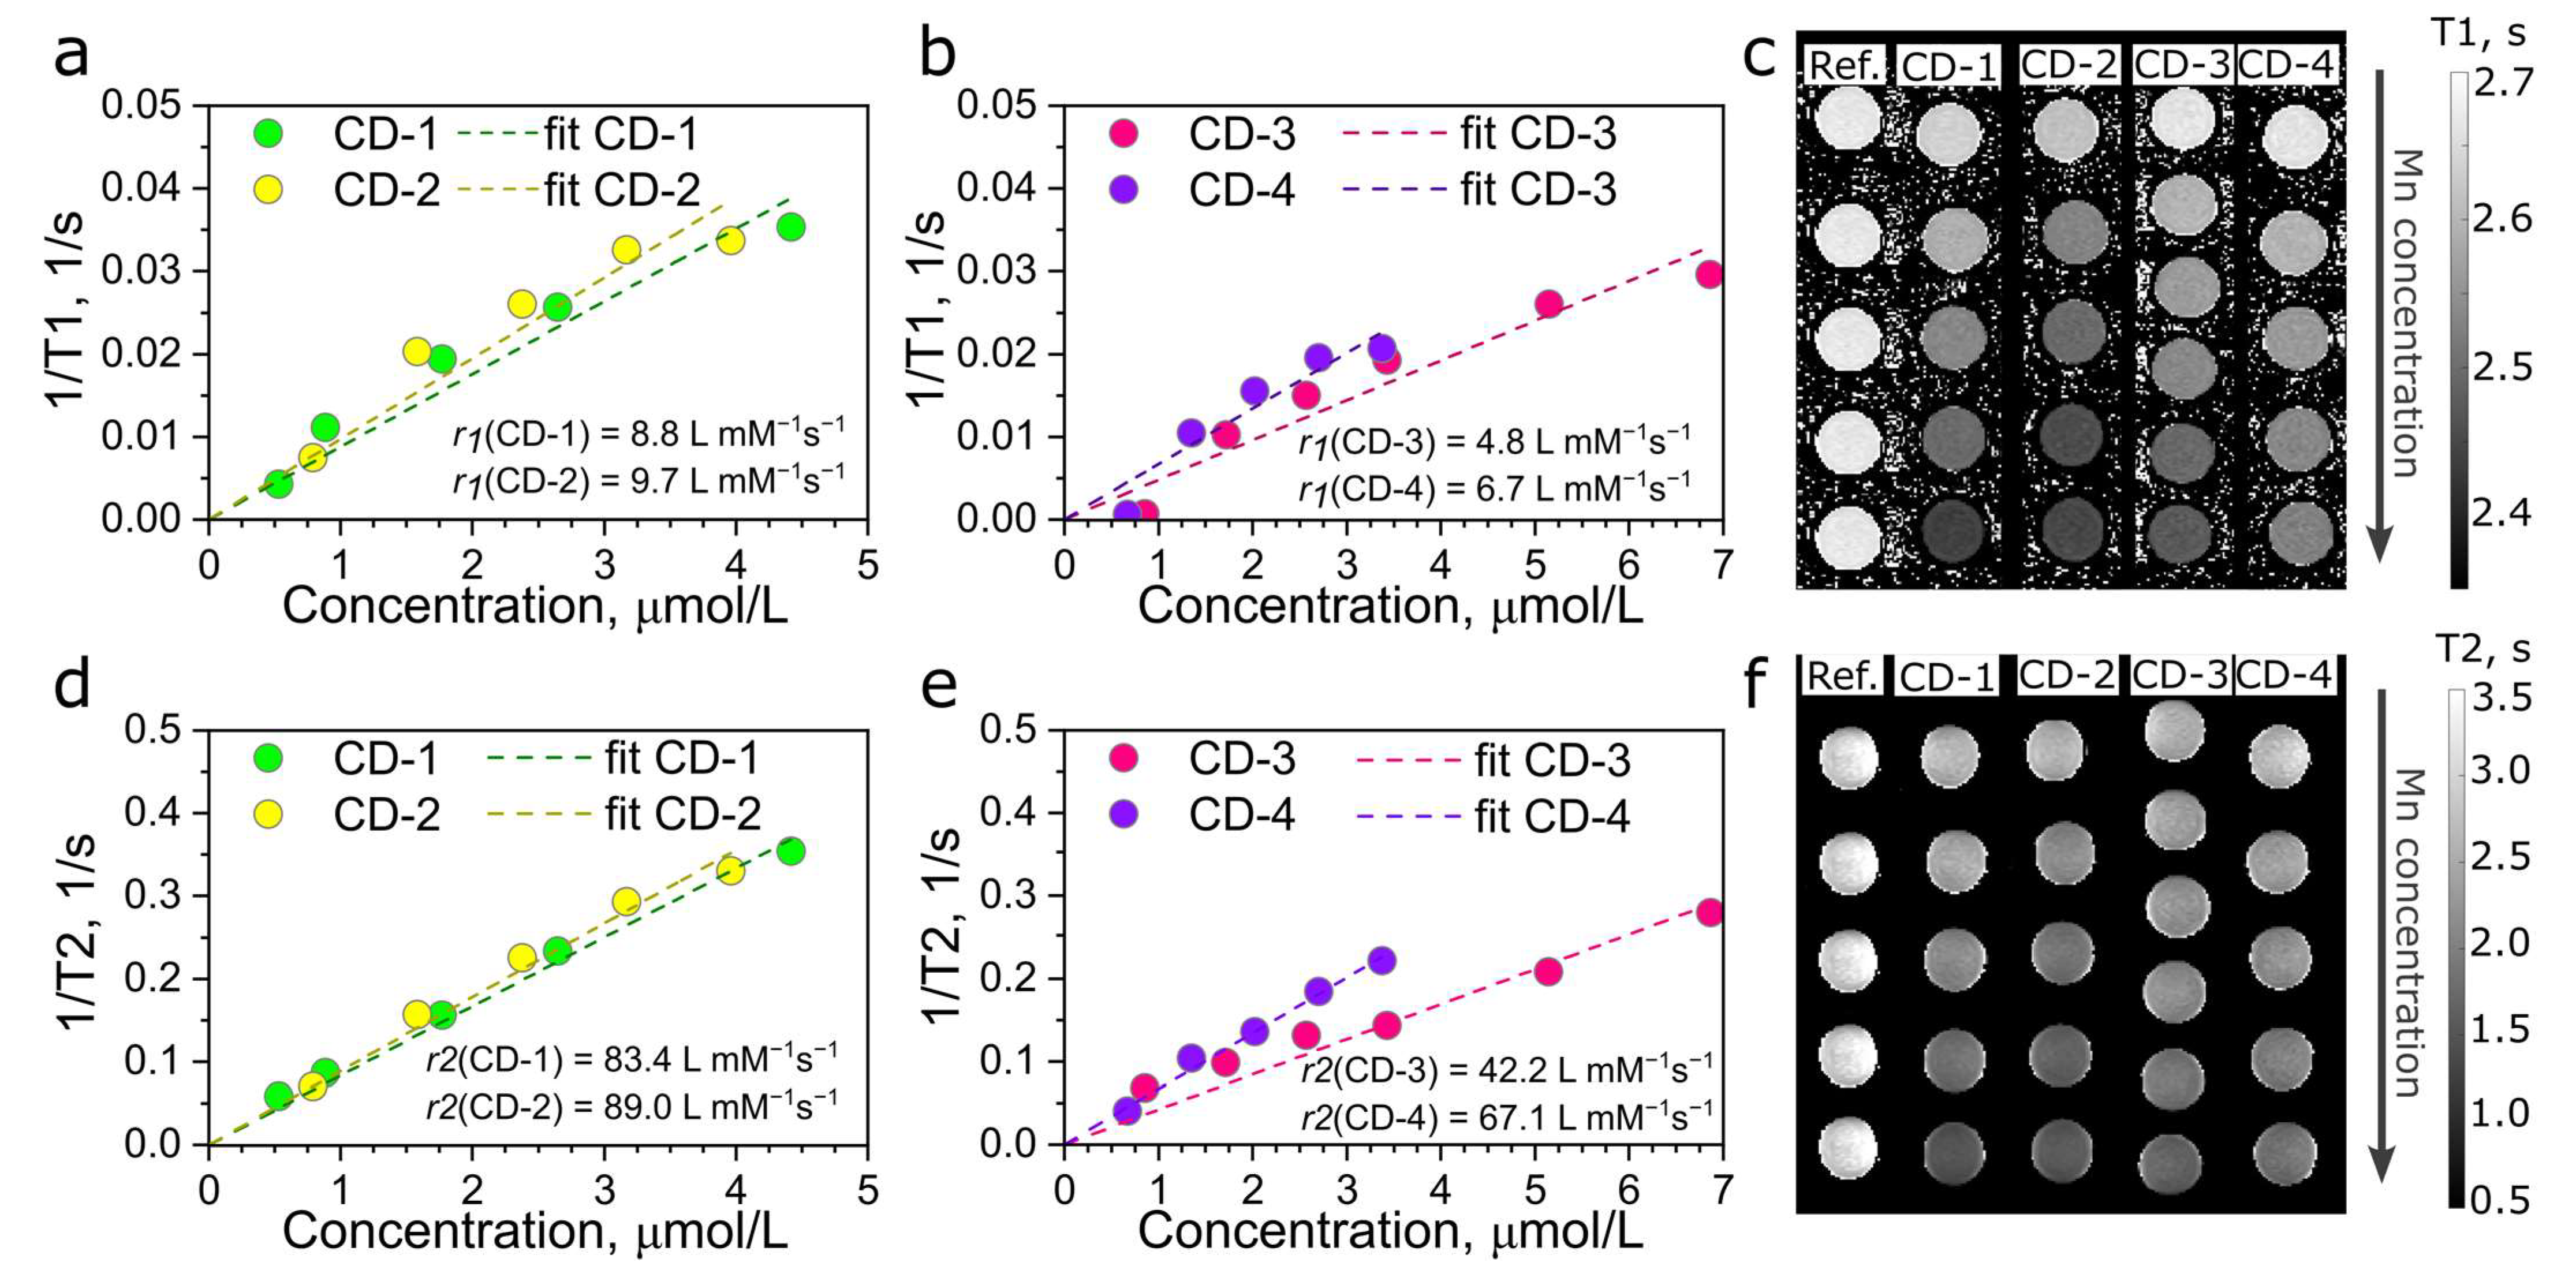
The MR imaging and relaxation performances of Mn-doped CDs were then investigated in vitro. The results are summarized in Figure 4. Saline solutions (0.9%) of CDs with various Mn concentrations (0–7 µmol/L) underwent MR-scanning to investigate the effect of changing the proton-relaxation time in water in the presence of Mn ions. Figure 4a,b,d,e shows the dependence of the relaxation rate (1/T1 and 1/T2), averaged in the ROIs in each of the samples, on the corresponding T1-/T2-maps (Figure 4c,f) and on the concentration of Mn ion within CDs. As can be seen from the T1-/T2- maps, the synthesized CDs were able to reduce T1 and T2. The relaxivity values (r1, r2) were estimated for each case, in the corresponding panels in Figure 4a,b,d,e, as coefficients in a linear fitting of 1/T as a function of concentration (C) with zero intercept. The values of r1 and r2 obtained in this work exceeded the corresponding values for a commercial CA based on manganese dipyridoxyl-di-phosphate (Mn-DPDP, TESLASCAN), which were, respectively, 3.6 and 7.1 in plasma at a magnetic field of 1.5 T [24]. For CD-1 and CD-2, r1 and r2 were very close (r1 = 8.8 ± 0.6 and 9.7 ± 0.6 L mmol−1s−1, and r2 = 83.4 ± 2.5 and 89.0 ± 2.7 L mmol−1s−1) (Figure 4a,d), but the relaxivities for CD-2 were slightly larger. Both relaxivities for CD-3 were slightly lower than that for CD-4: r1 = 4.8 ± 0.3 and 6.7 ± 0.5 L mmol−1s−1, and r2 = 42.2 ± 2.2 and 67.1 ± 1.5 L mmol−1s−1 for CD-3 and CD-4, respectively (Figure 4b,e). These differences may be explained by the variation of Mn content in the CDs.
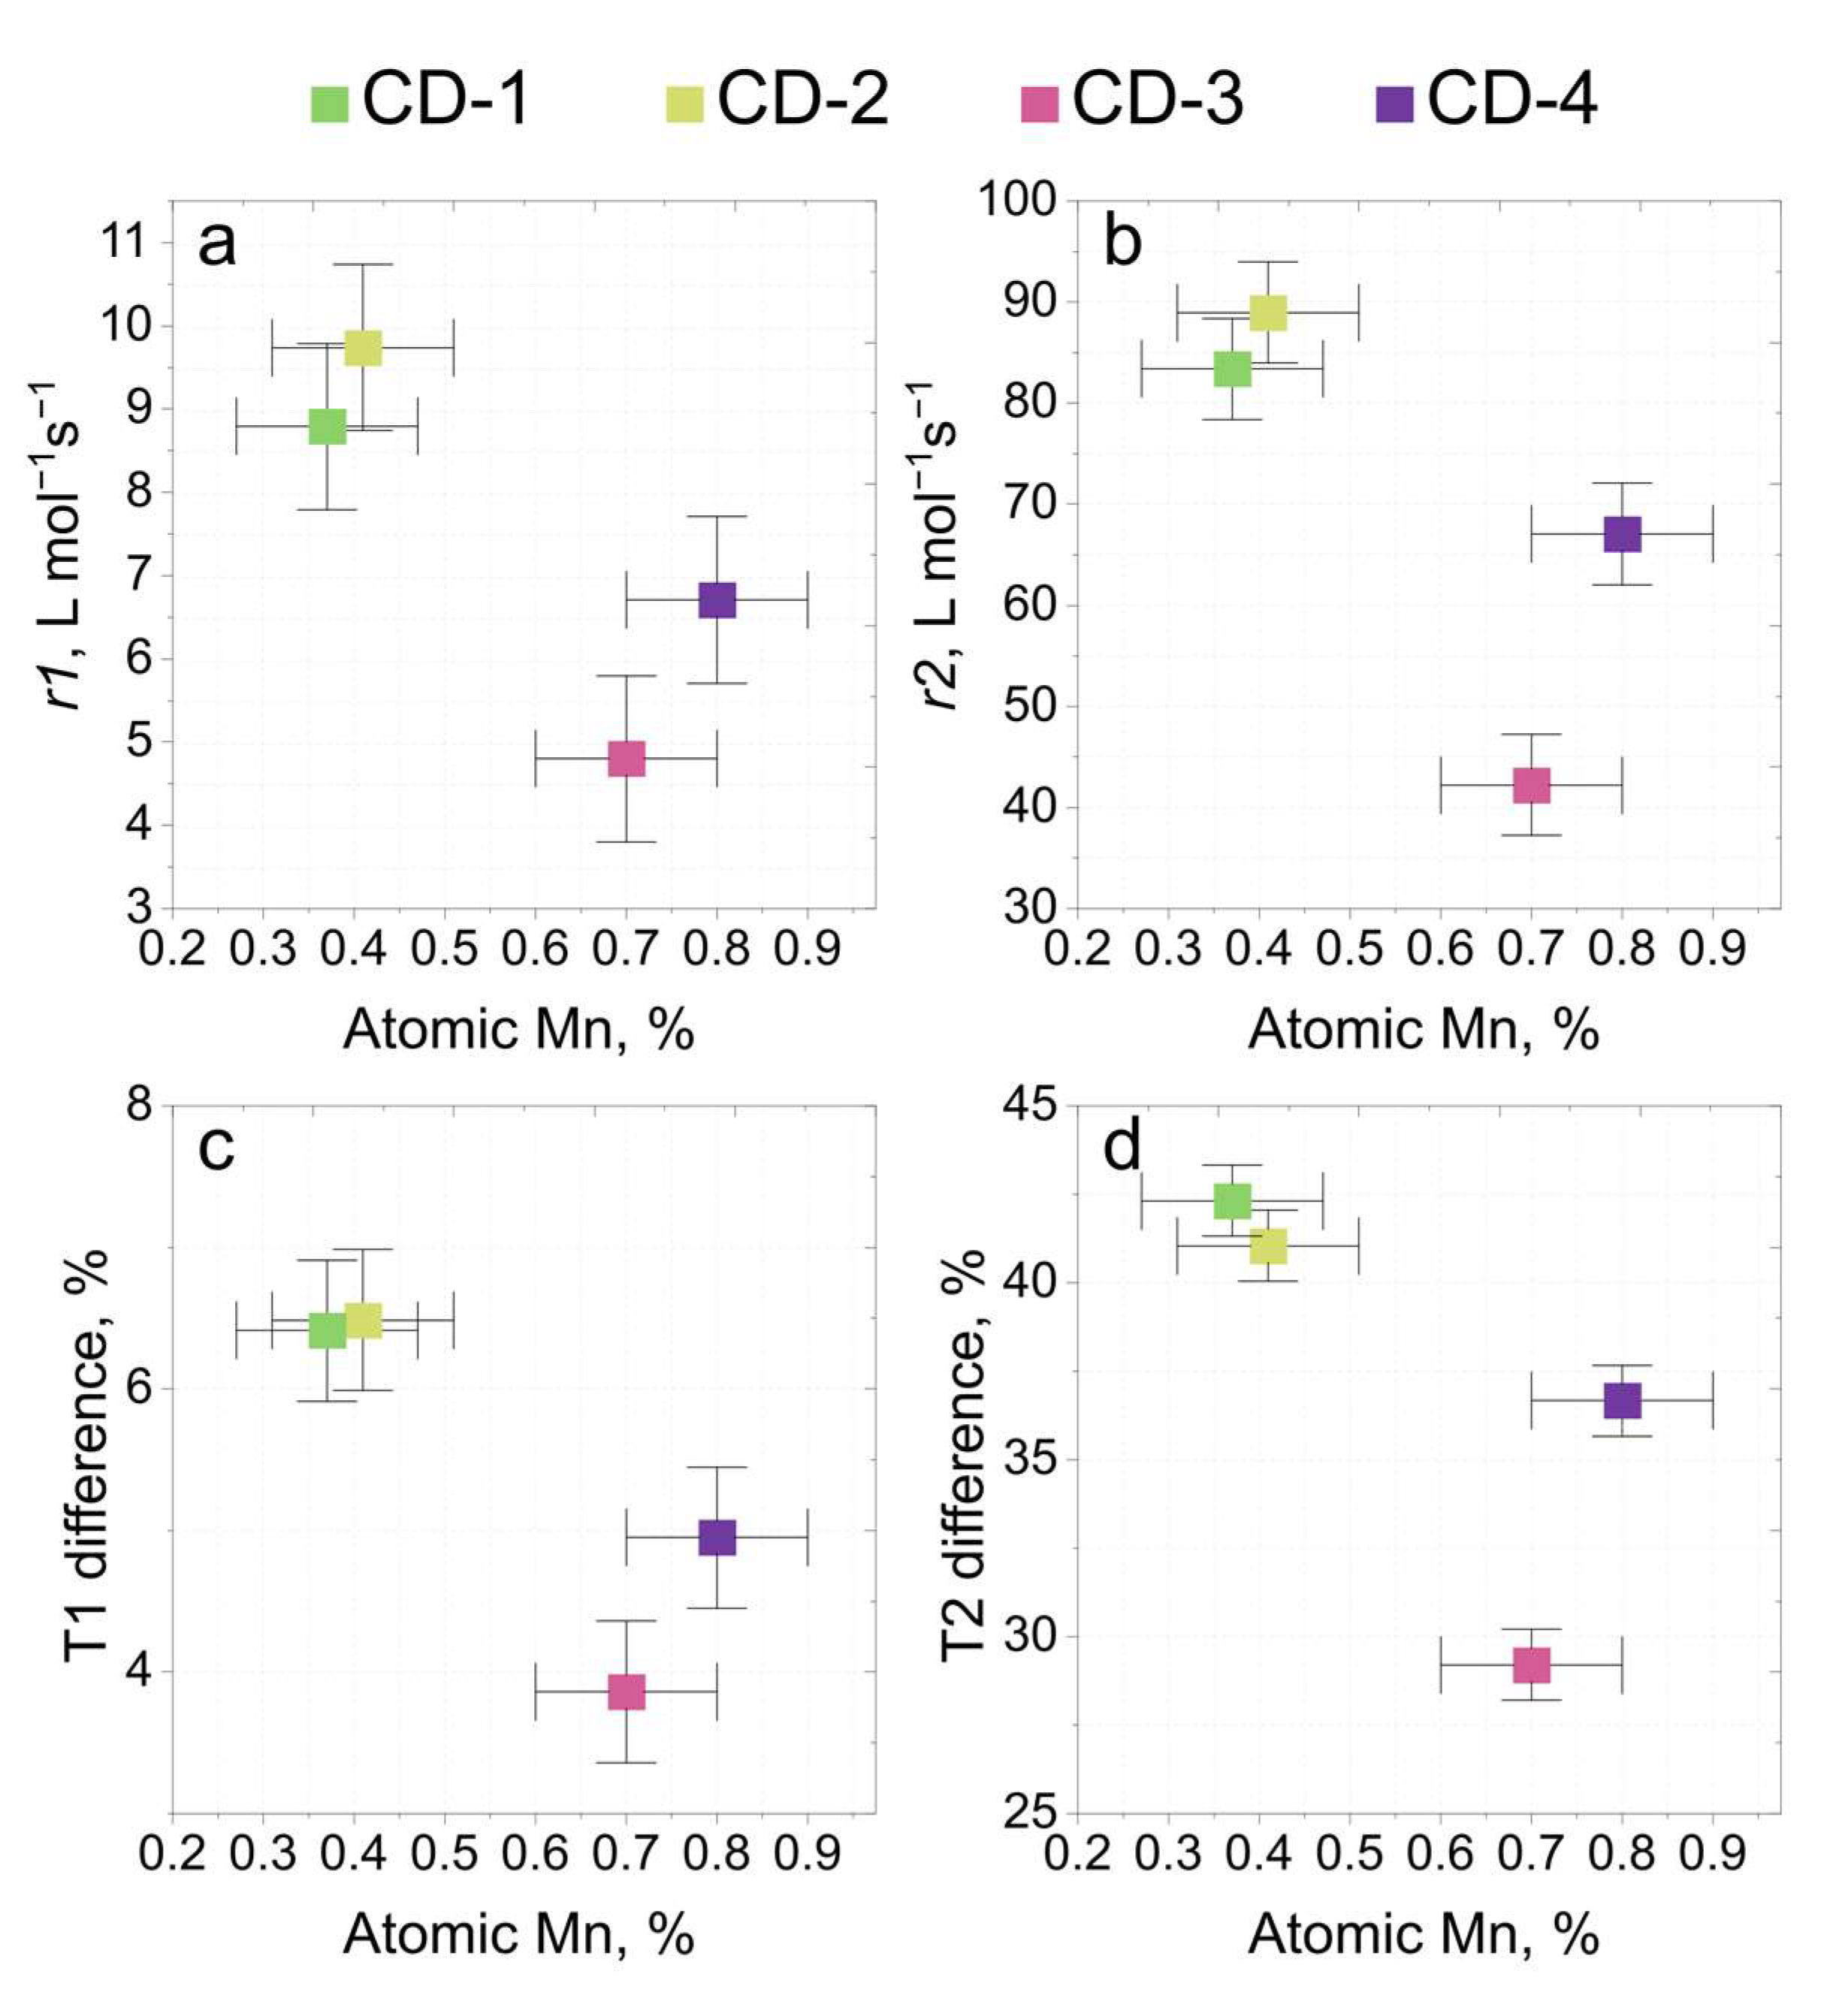
Figure 5 shows the dependence of relaxivities and relaxation times on the Mn content in atomic percentage. For the set of CDs based on OPD (CD-1 and CD-2), the r1 and r2 relaxivities were larger than those observed for the second CDs set (CD-3 and CD-4). Although the Mn ion concentration in pairs of CDs (CD-1 and CD-2, CD-3 and CD-4) was very close, slight differences were observed (see Table S1). From XPS measurements, the use of MnCl2 resulted in a slightly higher Mn ion concentration (CD-2 and CD-4); at the same time, the use of CA and FA also resulted in a slightly higher Mn ion concentration (CD-3, CD-4). Thus, comparing separately the set of CDs made of the OPD and those of the CA and FA, it transpired that the r1, r2 relaxivities were larger for the samples prepared with MnCl2: CD-2 and CD-4 (Figure 5a,b).
It is believed that the r2/r1 ratio defines the type of Cas; a small ratio up to 5 is referred to as positive or T1-Cas and a ratio above 10 is referred to as negative or T2-CAs [54]. The estimated r2/r1 ratio for all CDs was in the range of 8.8–10, which corresponds to dual-mode T1- and T2-CAs. Similarly high r2/r1 ratios were shown in [27], where MnCl2 was studied as a CA. It should be noted that, in that paper, the r2 value was higher than those obtained in our work, which is probably due to the use of a 3 T MRI scanner, since higher magnetic field strengths tend to precisely increase T2 relaxation time [36]. Another interesting observation is the fact that the r1 and r2 relaxivities depend almost linearly on the ratio of the peak 1 (641.8–642.0 eV) and peak 2 (645.1–646.0 eV) areas of the Mn 2p3/2 band (Figure S6, SI). The increase in the ratio of peak 1 and peak 2 areas indicates an increase in the oxidation state of Mn ions within the CD structure, thus the larger relaxivities can be attributed to an increase in the oxidation state of Mn during CD synthesis.
Next, we compared the relaxation T1 and T2 times obtained during a MR scan, for a reference saline solution without nanoparticles, with the corresponding relaxation times of the CDs saline solution with a concentration of Mn of approx. 2.5 µmol/L (Figure 5c,d). T1 decreased by approx. 6.4% for CD-1 and CD-2 and by 3.9 and 4.9% for CD-3 and CD-4, respectively. More notable changes were observed for T2 times: transverse relaxation time decreased by 42.3, 41.0, 29.2, and 36.7% with the addition of CD-1, CD-2, CD-3, and CD-4, respectively. These results agree with the evaluation of r1 and r2 relaxivities. The higher relaxivities and the higher difference between relaxation times were observed for CDs based on OPD. Interestingly, a further increase in metal concentration led to a gradual decrease in T1 and T2 times. In a recent study [55], similar values of T1 time decrease were obtained, when manganese porphyrin (MnP) CA was introduced to polyurethane hydrogel to track polyurethane-based implanted biomaterial by MR diagnoses. It has been shown that MnP CA, with a concentration of 4 ppm, in a polyurethane implant reduced its T1 by 362 msec compared to an unlabeled implant. The use of MnP CAs has allowed the distinction of an implant from its surrounding biological objects in rats, as well as the tracking of time-caused implant degradation. Table S5 (SI) summarizes some of the Mn-based CAs under development and their characteristics (relaxivities and MR-scanning conditions). As can be seen, the CDs obtained in this study have high relaxivities and are promising for further research and applications as CAs.
An essential point to effectively change the relaxation times is the achieving of a small distance between water molecules and the contrast agent. Considering this, and since high values of relaxivity are observed at very low concentrations, it can be assumed that the metal is located either at and/or near the surface of the CDs. However, it should be noted that the metal concentrations in the developed CDs are quite small, and the difference between the relaxation times for the pure saline solution and in the presence of CDs should be improved for clinical studies. In this regard, additional studies, aimed either at scaling up the synthesis or at developing a new approach that would allow increasing the metal concentration within CDs without deterioration of optical and morphological characteristics, are needed. However, it has been reported [55] that even small amounts of CAs comparable to the relaxation time changes presented in this article, may provide good MRI contrast. Although there are several studies that have shown the biological compatibility and low toxicity of Mn-doped CDs [39,42,56], this is still a controversial issue requiring more research. Additionally, CAs less than 6 nm have been shown to be easily excreted by the kidneys and therefore can be administered intravenously, while larger particles are suitable for diagnoses of the gastrointestinal tract [47]. Therefore, all the suggested CDs are small enough and would possibly be easily excreted from the body with urine. However, further studies of the hydrodynamic particle diameter in different biological media are needed.

4. Conclusions

To summarize, we have developed two types of CDs based on o-phenylenediamine and citric acid and formamide, which have a wide PL band from the blue to red spectral region. It was shown that the content of nitrogen and manganese within synthesized CDs depends on the combination of precursors, leading to the variation of optical and relaxation properties. This opens up the possibility of the future adjustment and control of the chemical composition and optical properties for the fabrication of luminescent bioprobes and MRI CAs simultaneously with specified parameters. In addition to long-wavelength PL, the obtained CDs demonstrated high relaxivities r1 and r2. The r2/r1 ratio were in the range of 8.8–10, which makes these CDs promising dual-mode CAs for T1 and T2 MRI. Furthermore, small CD sizes, up to 10 nm, widen the applicability limits. Hence, the combination of luminescent and magnetic properties developed in this work makes Mn-doped CDs promising multimodal nanoprobes for bioimaging. For this, future studies on biocompatibility and toxicity, along with the optimization of the syntheses’ protocols for Mn ion concentration control, are needed. We believe that our research will attract the attention of physicists studying luminescent nanostructures, chemists, and biologists, and will become an impetus for new research at the intersection of sciences.

Supplementary Materials

The following supporting information can be downloaded at: https://www.mdpi.com/article/10.3390/photonics10070757/s1, Figure S1: Additional AFM images of CD samples; Figure S2: The height distributions for CD-2 (a) and CD-3 (b) fitted by Double Gauss function; Figure S3: Full X-ray photoelectron spectroscopy (XPS) survey spectra of CD-1 (a), CD-2 (b), CD-3 (c), and CD-4 (d); Figure S4: High-resolution XPS spectra of Mn-doped CDs: C 1s (1st left row), O 1s (2nd row), N 1s (3rd row) and Mn 2p (4th right row), with deconvolution of bands to specific peaks attributed to different chemical groups, shown by different colors and explained in the legends. For Mn 2p, peak 1 at 641.8–642.0 eV and peak 3 at 653.7–653.9 eV are attributed to Mn(IV) compounds, peak 2 at 645.1–646.0 eV and peak 4 at 656.1–657.2 eV are attributed to Mn(VII) compounds; Figure S5: Optical spectra measured in a direct mode (pink and purple lines) and using an integrating sphere (black lines). The first spectra are attributed to absorption and the latter ones are sum of absorption and reflection. It is seen that the signals in the 600–800 nm spectral region are almost the same, thus, the optical density in the 600–700 nm spectral region originates from absorption by CDs; Figure S6: Dependence of r1 and r2 relaxivities on the ratio of the peak 1 and peak 2 in Mn 2p3/2 band areas taken from Table S3; Table S1: Synthesis conditions and composition of CDs; Table S2: Height distribution parameters of CDs from statistical analysis of AFM images; Table S3: Optical properties of CDs; Table S4: Deconvolution parameters for Mn 2p3/2 band; Table S5: Characteristics of Mn-based contrast agents. References [28,39,41,42,43,56,57,58,59,60,61] are cited in the Supplementary Materials.

Author Contributions

Synthesis of CDs, A.A.V. and S.O.O.; optical measurements, A.A.V., S.O.O. and E.A.S.; AFM analysis, M.D.M.; XPS measurements, A.V.K. and E.V.Z.; MRI measurement and analysis Z.F.B. and E.A.B.; ICP-OC measurement O.V.V.; writing—original draft preparation, E.A.S.; writing—review and editing, E.V.U.; supervision, project administration, funding acquisition, E.A.S. and E.V.U. All authors have read and agreed to the published version of the manuscript.

Funding

The study was supported by the Russian Science Foundation (RSF) grant No. 22-73-00090, https://rscf.ru/project/22-73-00090/ accessed on 23 April 2023. The part of the work devoted to MR experiments was supported by a grant from the Scientific School HШ-2359.2022.4. E.V.U, A.A.V. and M.D.M. thank the Priority 2030 Federal Academic Leadership Program for their financial support.

Institutional Review Board Statement

Not applicable.

Informed Consent Statement

Not applicable.

Data Availability Statement

Not applicable.

Acknowledgments

The authors express their gratitude to the ITMO University Core Facility Center “Nanotechnologies”. XPS studies were performed using equipment from the Resource Center “Physical methods of surface investigation” of the Scientific Park of St. Petersburg State University. The determination of metal concentration in the samples was performed on equipment from the “Chemical Analysis and Materials” Research Centre of the St. Petersburg State University Research Park. MRI analysis was performed on equipment from the St. Petersburg State University and the Almazov National Medical Research Center.

Conflicts of Interest

The authors declare no conflict of interest.

References

  1. Xu, X.; Ray, R.; Gu, Y.; Ploehn, H.J.; Gearheart, L.; Raker, K.; Scrivens, W.A. Electrophoretic Analysis and Purification of Fluorescent Single-Walled Carbon Nanotube Fragments. J. Am. Chem. Soc. 2004, 126, 12736–12737. [Google Scholar] [CrossRef] [PubMed]
  2. He, C.; Xu, P.; Zhang, X.; Long, W. The Synthetic Strategies, Photoluminescence Mechanisms and Promising Applications of Carbon Dots: Current State and Future Perspective. Carbon 2022, 186, 91–127. [Google Scholar] [CrossRef]
  3. Litvin, A.P.; Zhang, X.; Ushakova, E.V.; Rogach, A.L. Carbon Nanoparticles as Versatile Auxiliary Components of Perovskite-Based Optoelectronic Devices. Adv. Funct. Mater. 2021, 31, 2010768. [Google Scholar] [CrossRef]
  4. Stepanidenko, E.A.; Ushakova, E.V.; Fedorov, A.V.; Rogach, A.L. Applications of Carbon Dots in Optoelectronics. Nanomaterials 2021, 11, 364. [Google Scholar] [CrossRef] [PubMed]
  5. Falara, P.P.; Zourou, A.; Kordatos, K.V. Recent Advances in Carbon Dots/2-D Hybrid Materials. Carbon 2022, 195, 219–245. [Google Scholar] [CrossRef]
  6. Jiang, K.; Wang, Y.; Cai, C.; Lin, H. Conversion of Carbon Dots from Fluorescence to Ultralong Room-Temperature Phosphorescence by Heating for Security Applications. Adv. Mater. 2018, 30, 1800783. [Google Scholar] [CrossRef]
  7. Tian, Z.; Li, D.; Ushakova, E.V.; Maslov, V.G.; Zhou, D.; Jing, P.; Shen, D.; Qu, S.; Rogach, A.L. Multilevel Data Encryption Using Thermal-Treatment Controlled Room Temperature Phosphorescence of Carbon Dot/Polyvinylalcohol Composites. Adv. Sci. 2018, 5, 1800795. [Google Scholar] [CrossRef] [Green Version]
  8. Ding, Y.; Wang, X.; Tang, M.; Qiu, H. Tailored Fabrication of Carbon Dot Composites with Full-Color Ultralong Room-Temperature Phosphorescence for Multidimensional Encryption. Adv. Sci. 2022, 9, 2103833. [Google Scholar] [CrossRef]
  9. Su, W.; Wu, H.; Xu, H.; Zhang, Y.; Li, Y.; Li, X.; Fan, L. Carbon Dots: A Booming Material for Biomedical Applications. Mater. Chem. Front. 2020, 4, 821–836. [Google Scholar] [CrossRef]
  10. Khan, S.; Dunphy, A.; Anike, M.S.; Belperain, S.; Patel, K.; Chiu, N.H.L.; Jia, Z. Recent Advances in Carbon Nanodots: A Promising Nanomaterial for Biomedical Applications. Int. J. Mol. Sci. 2021, 22, 6786. [Google Scholar] [CrossRef]
  11. Li, S.; Wei, J.; Yao, Q.; Song, X.; Xie, J.; Yang, H. Emerging Ultrasmall Luminescent Nanoprobes for in Vivo Bioimaging. Chem. Soc. Rev. 2023, 52, 1672–1696. [Google Scholar] [CrossRef] [PubMed]
  12. He, H.; Zhang, X.; Du, L.; Ye, M.; Lu, Y.; Xue, J.; Wu, J.; Shuai, X. Molecular Imaging Nanoprobes for Theranostic Applications. Adv. Drug Deliv. Rev. 2022, 186, 114320. [Google Scholar] [CrossRef]
  13. Gupta, B.D.; Pathak, A.; Shrivastav, A.M. Optical Biomedical Diagnostics Using Lab-on-Fiber Technology: A Review. Photonics 2022, 9, 86. [Google Scholar] [CrossRef]
  14. Yu, S.; Ding, L.; Lin, H.; Wu, W.; Huang, J. A Novel Optical Fiber Glucose Biosensor Based on Carbon Quantum Dots-Glucose Oxidase/Cellulose Acetate Complex Sensitive Film. Biosens. Bioelectron. 2019, 146, 111760. [Google Scholar] [CrossRef] [PubMed]
  15. Fang, X.; Zheng, C.; Yin, Z.; Wang, Z.; Wang, J.; Liu, J.; Luo, D.; Liu, Y.J. Hierarchically Ordered Silicon Metastructures from Improved Self-Assembly-Based Nanosphere Lithography. ACS Appl. Mater. Interfaces 2020, 12, 12345–12352. [Google Scholar] [CrossRef] [PubMed]
  16. Pisco, M.; Galeotti, F.; Grisci, G.; Quero, G.; Cusano, A. Self-Assembled Periodic Patterns on the Optical Fiber Tip by Microsphere Arrays. In Proceedings of the 24th International Conference on Optical Fibre Sensors, Curitiba, Brazil, 28 September–2 October 2015; Volume 9634, pp. 165–168. [Google Scholar] [CrossRef]
  17. Managò, S.; Quero, G.; Zito, G.; Tullii, G.; Galeotti, F.; Pisco, M.; De Luca, A.C.; Cusano, A. Tailoring Lab-on-Fiber SERS Optrodes towards Biological Targets of Different Sizes. Sens. Actuators B Chem. 2021, 339, 129321. [Google Scholar] [CrossRef]
  18. Huang, X.; Song, J.; Yung, B.C.; Huang, X.; Xiong, Y.; Chen, X. Ratiometric Optical Nanoprobes Enable Accurate Molecular Detection and Imaging. Chem. Soc. Rev. 2018, 47, 2873–2920. [Google Scholar] [CrossRef]
  19. Dong, Y.; Dong, W.; Liang, X.; Wang, Y.R.; Xu, F.; Li, L.; Han, L.; Jiang, L.R. Construction and Application of Thrombin-Activated Fluorescence-SERS Dual-Mode Optical Nanoprobes. Spectrochim. Acta A Mol. Biomol. Spectrosc. 2023, 293, 122513. [Google Scholar] [CrossRef]
  20. Ng, S.M. Carbon dots as optical nanoprobes for biosensors. In Nanobiosensors for Biomolecular Targeting, 1st ed.; Gopinath, S.C.B., Lakshmipriya, T., Eds.; Elsevier: Amsterdam, The Netherlands, 2019; pp. 269–300. [Google Scholar] [CrossRef]
  21. Vedernikova, A.A.; Miruschenko, M.D.; Arefina, I.A.; Babaev, A.A.; Stepanidenko, E.A.; Cherevkov, S.A.; Spiridonov, I.G.; Danilov, D.V.; Koroleva, A.V.; Zhizhin, E.V.; et al. Dual-Purpose Sensing Nanoprobe Based on Carbon Dots from o-Phenylenediamine: PH and Solvent Polarity Measurement. Nanomaterials 2022, 12, 3314. [Google Scholar] [CrossRef]
  22. Ding, H.; Zhou, X.X.; Wei, J.S.; Li, X.B.; Qin, B.T.; Chen, X.B.; Xiong, H.M. Carbon Dots with Red/near-Infrared Emissions and Their Intrinsic Merits for Biomedical Applications. Carbon 2020, 167, 322–344. [Google Scholar] [CrossRef]
  23. Xiao, Y.D.; Paudel, R.; Liu, J.; Ma, C.; Zhang, Z.S.; Zhou, S.K. MRI Contrast Agents: Classification and Application (Review). Int. J. Mol. Med. 2016, 38, 1319–1326. [Google Scholar] [CrossRef] [Green Version]
  24. Rohrer, M.; Bauer, H.; Mintorovitch, J.; Requardt, M.; Weinmann, H.-J. Comparison of Magnetic Properties of MRI Contrast Media Solutions at Different Magnetic Field Strengths. Investig. Radiol. 2005, 40, 715–724. [Google Scholar] [CrossRef] [PubMed] [Green Version]
  25. Hazardous Substances Data Bank (HSDB): 7547—PubChem. Available online: https://pubchem.ncbi.nlm.nih.gov/source/hsdb/7547 (accessed on 6 April 2023).
  26. Kueny-Stotz, M.; Garofalo, A.; Felder-Flesch, D. Manganese-Enhanced MRI Contrast Agents: From Small Chelates to Nanosized Hybrids. Eur. J. Inorg. Chem. 2012, 2012, 1987–2005. [Google Scholar] [CrossRef]
  27. Nofiele, J.T.; Cheng, H.-L.M. Ultrashort Echo Time for Improved Positive-Contrast Manganese-Enhanced MRI of Cancer. PLoS ONE 2013, 8, e58617. [Google Scholar] [CrossRef] [Green Version]
  28. Li, J.; Wu, C.; Hou, P.; Zhang, M.; Xu, K. One-Pot Preparation of Hydrophilic Manganese Oxide Nanoparticles as T1 Nano-Contrast Agent for Molecular Magnetic Resonance Imaging of Renal Carcinoma in Vitro and in Vivo. Biosens. Bioelectron. 2018, 102, 1–8. [Google Scholar] [CrossRef]
  29. Podyablonsky, A.S.; Belyanin, M.L.; Borodin, O.Y.; Belousov, M.V.; Brazovskiy, K.S.; Krivoshchekov, S.V.; Ussov, W.Y.; Shimanovskii, N.L. Paramagnetic Contrast Enhancement in MRI Imaging of Liver Using an Original Hepatotropic High-Affinity Agent GDOF-Mn-DTPA. Transl. Med. 2021, 8, 14–22. [Google Scholar] [CrossRef]
  30. Mnasri, W.; Parvizian, M.; Ammar-Merah, S. Design and Synthesis of Luminescent Lanthanide-Based Bimodal Nanoprobes for Dual Magnetic Resonance (MR) and Optical Imaging. Nanomaterials 2021, 11, 354. [Google Scholar] [CrossRef]
  31. Li, X.; Fu, Y.; Zhao, S.; Xiao, J.F.; Lan, M.; Wang, B.; Zhang, K.; Song, X.; Zeng, L. Metal Ions-Doped Carbon Dots: Synthesis, Properties, and Applications. J. Chem. Eng. 2022, 430, 133101. [Google Scholar] [CrossRef]
  32. Chen, H.; Qiu, Y.; Ding, D.; Lin, H.; Sun, W.; Wang, G.D.; Huang, W.; Zhang, W.; Lee, D.; Liu, G.; et al. Gadolinium-Encapsulated Graphene Carbon Nanotheranostics for Imaging-Guided Photodynamic Therapy. Adv. Mater. 2018, 30, 1802748. [Google Scholar] [CrossRef] [PubMed]
  33. Zheng, S.; Yu, N.; Han, C.; Xie, T.; Dou, B.; Kong, Y.; Zuo, F.; Shi, M.; Xu, K. Preparation of Gadolinium Doped Carbon Dots for Enhanced MR Imaging and Cell Fluorescence Labeling. Biochem. Biophys. Res. Commun. 2019, 511, 207–213. [Google Scholar] [CrossRef]
  34. Huang, Y.; Li, L.; Zhang, D.; Gan, L.; Zhao, P.; Zhang, Y.; Zhang, Q.; Hua, M.; Jia, C. Gadolinium-Doped Carbon Quantum Dots Loaded Magnetite Nanoparticles as a Bimodal Nanoprobe for Both Fluorescence and Magnetic Resonance Imaging. Magn. Reason. Imaging 2020, 68, 113–120. [Google Scholar] [CrossRef] [PubMed]
  35. Cardo, L.; Martínez-Parra, L.; Cesco, M.; Echeverría-Beistegui, B.M.; Martínez-Moro, M.; Herrero-Álvarez, N.; Cabrerizo, M.; Carregal-Romero, S.; Ramos-Cabrer, P.; Ruiz-Cabello, J.; et al. Luminescent Carbon Nanodots Doped with Gadolinium (III): Purification Criteria, Chemical and Biological Characterization of a New Dual Fluorescence/MR Imaging Agent. Small 2023, 2206442. [Google Scholar] [CrossRef] [PubMed]
  36. Das, G.K.; Johnson, N.J.J.; Cramen, J.; Blasiak, B.; Latta, P.; Tomanek, B.; van Veggel, F.C.J.M. NaDyF 4 Nanoparticles as T 2 Contrast Agents for Ultrahigh Field Magnetic Resonance Imaging. J. Phys. Chem. Lett. 2012, 3, 524–529. [Google Scholar] [CrossRef] [PubMed]
  37. Samanta, T.; Hazra, C.; Mahalingam, V. C-Dot Sensitized Eu 3+ Luminescence from Eu 3+ -Doped LaF 3 –C Dot Nanocomposites. NJC 2015, 39, 106–109. [Google Scholar] [CrossRef]
  38. Wu, F.; Yue, L.; Yang, L.; Wang, K.; Liu, G.; Luo, X.; Zhu, X. Ln(III) Chelates-Functionalized Carbon Quantum Dots: Synthesis, Optical Studies and Multimodal Bioimaging Applications. Colloids Surf. B Biointerfaces 2019, 175, 272–280. [Google Scholar] [CrossRef]
  39. Ji, Z.; Ai, P.; Shao, C.; Wang, T.; Yan, C.; Ye, L.; Gu, W. Manganese-Doped Carbon Dots for Magnetic Resonance/Optical Dual-Modal Imaging of Tiny Brain Glioma. ACS Biomater. Sci. Eng. 2018, 4, 2089–2094. [Google Scholar] [CrossRef]
  40. Jia, Q.; Ge, J.; Liu, W.; Zheng, X.; Chen, S.; Wen, Y.; Zhang, H.; Wang, P. A Magnetofluorescent Carbon Dot Assembly as an Acidic H2O2-Driven Oxygenerator to Regulate Tumor Hypoxia for Simultaneous Bimodal Imaging and Enhanced Photodynamic Therapy. Adv. Mater. 2018, 30, 1706090. [Google Scholar] [CrossRef]
  41. Zhang, M.; Zheng, T.; Sheng, B.; Wu, F.; Zhang, Q.; Wang, W.; Shen, J.; Zhou, N.; Sun, Y. Mn2+ Complex-Modified Polydopamine- and Dual Emissive Carbon Dots Based Nanoparticles for in Vitro and in Vivo Trimodality Fluorescent, Photothermal, and Magnetic Resonance Imaging. J. Chem. Eng. 2019, 373, 1054–1063. [Google Scholar] [CrossRef]
  42. Sun, S.; Zhao, L.; Wu, D.; Zhang, H.; Lian, H.; Zhao, X.; Wu, A.; Zeng, L. Manganese-Doped Carbon Dots with Redshifted Orange Emission for Enhanced Fluorescence and Magnetic Resonance Imaging. ACS Appl. Bio. Mater. 2021, 4, 1969–1975. [Google Scholar] [CrossRef]
  43. Niu, D.; Luo, X.; Li, Y.; Liu, X.; Wang, X.; Shi, J. Manganese-Loaded Dual-Mesoporous Silica Spheres for Efficient T1- and T2-Weighted Dual Mode Magnetic Resonance Imaging. ACS Appl. Mater. Interfaces 2013, 5, 9942–9948. [Google Scholar] [CrossRef]
  44. Torkashvand, N.; Sarlak, N. Fabrication of a Dual T1 and T2 Contrast Agent for Magnetic Resonance Imaging Using Cellulose Nanocrystals/Fe3O4 Nanocomposite. Eur. Polym. J. 2019, 118, 128–136. [Google Scholar] [CrossRef]
  45. Pan, C.; Lin, J.; Zheng, J.; Liu, C.; Yuan, B.; Akakuru, O.U.; Zubair Iqbal, M.; Fang, Q.; Hu, J.; Chen, J.; et al. An Intelligent T1–T2 Switchable MRI Contrast Agent for the Non-Invasive Identification of Vulnerable Atherosclerotic Plaques. Nanoscale 2021, 13, 6461–6474. [Google Scholar] [CrossRef] [PubMed]
  46. Liu, W.; Yin, S.; Hu, Y.; Deng, T.; Li, J. Microemulsion-Confined Biomineralization of PEGylated Ultrasmall Fe3O4 Nanocrystals for T2-T1 Switchable MRI of Tumors. Anal. Chem. 2021, 93, 14223–14230. [Google Scholar] [CrossRef] [PubMed]
  47. Longmire, M.; Choyke, P.L.; Kobayashi, H. Clearance Properties of Nano-Sized Particles and Molecules as Imaging Agents: Considerations and Caveats. Nanomedicine 2008, 3, 703–717. [Google Scholar] [CrossRef] [PubMed] [Green Version]
  48. Chang, J.-K.; Tsai, W.-T. Effects of Temperature and Concentration on the Structure and Specific Capacitance of Manganese Oxide Deposited in Manganese Acetate Solution. J. Appl. Electrochem. 2004, 34, 953–961. [Google Scholar] [CrossRef]
  49. Outram, J.G.; Couperthwaite, S.J.; Millar, G.J. Investigation of Manganese Greensand Activation by Various Oxidants. J. Env. Chem. Eng. 2018, 6, 4130–4143. [Google Scholar] [CrossRef]
  50. Oku, M. X-ray Photoelectron Spectra of KMnO4 and K2MnO4 Fractured in Situ. J. Electron Spectros. Relat. Phenom. 1995, 74, 135–148. [Google Scholar] [CrossRef]
  51. Biesinger, M.C.; Payne, B.P.; Grosvenor, A.P.; Lau, L.W.M.; Gerson, A.R.; Smart, R.S.C. Resolving Surface Chemical States in XPS Analysis of First Row Transition Metals, Oxides and Hydroxides: Cr, Mn, Fe, Co and Ni. Appl. Surf. Sci. 2011, 257, 2717–2730. [Google Scholar] [CrossRef]
  52. Wang, B.; Wei, Z.; Sui, L.; Yu, J.; Zhang, B.; Wang, X.; Feng, S.; Song, H.; Yong, X.; Tian, Y.; et al. Electron–Phonon Coupling-Assisted Universal Red Luminescence of o-Phenylenediamine-Based Carbon Dots. Light. Sci. Appl. 2022, 11, 172. [Google Scholar] [CrossRef]
  53. Zhang, B.; Wang, B.; Ushakova, E.V.; He, B.; Xing, G.; Tang, Z.; Rogach, A.L.; Qu, S.; Zhang, B.; Wang, B.; et al. Assignment of Core and Surface States in Multicolor-Emissive Carbon Dots. Small 2022, 2204158. [Google Scholar] [CrossRef]
  54. Caspani, S.; Magalhães, R.; Araújo, J.P.; Sousa, C.T. Magnetic Nanomaterials as Contrast Agents for MRI. Materials 2020, 13, 2586. [Google Scholar] [CrossRef] [PubMed]
  55. Tawagi, E.; Vollett, K.D.W.; Szulc, D.A.; Santerre, J.P.; Cheng, H.M. In Vivo MRI Tracking of Degradable Polyurethane Hydrogel Degradation In Situ Using a Manganese Porphyrin Contrast Agent. JMRI, 2023; in print. [Google Scholar] [CrossRef] [PubMed]
  56. Tiron, A.; Stan, C.S.; Luta, G.; Uritu, C.M.; Vacarean-Trandafir, I.-C.; Stanciu, G.D.; Coroaba, A.; Tiron, C.E. Manganese-Doped N-Hydroxyphthalimide-Derived Carbon Dots—Theranostics Applications in Experimental Breast Cancer Models. Pharmaceutics 2021, 13, 1982. [Google Scholar] [CrossRef] [PubMed]
  57. Pintaske, J.; Martirosian, P.; Graf, H.; Erb, G.; Lodemann, K.P.; Claussen, C.D.; Schick, F. Relaxivity of Gadopentetate Dimeglumine (Magnevist), Gadobutrol (Gadovist), and Gadobenate Dimeglumine (MultiHance) in Human Blood Plasma at 0.2, 1.5, and 3 Tesla. Investig. Radiol. 2006, 41, 213–221. [Google Scholar] [CrossRef]
  58. Anbu, S.; Hoffmann, S.H.L.; Carniato, F.; Kenning, L.; Price, T.W.; Prior, T.J.; Botta, M.; Martins, A.F.; Stasiuk, G.J. A Single-Pot Template Reaction towards a Manganese-Based T1 Contrast Agent. Angew. Chem. Int. Ed. 2021, 60, 10831–10839. [Google Scholar] [CrossRef]
  59. Wang, Y.; Wang, T.; Chen, X.; Xu, Y.; Li, H. Mn(II)-Coordinated Fluorescent Carbon Dots: Preparation and Discrimination of Organic Solvents. Opt. Mater. 2018, 78, 118–125. [Google Scholar] [CrossRef]
  60. Lee, B.H.; Hasan, M.T.; Lichthardt, D.; Gonzalez-Rodriguez, R.; Naumov, A.V. Manganese-Nitrogen and Gadolinium-Nitrogen Co-Doped Graphene Quantum Dots as Bimodal Magnetic Resonance and Fluorescence Imaging Nanoprobes. Nanotechnology 2021, 32, 095103. [Google Scholar] [CrossRef]
  61. Yao, Y.Y.; Gedda, G.; Girma, W.M.; Yen, C.L.; Ling, Y.C.; Chang, J.Y. Magnetofluorescent Carbon Dots Derived from Crab Shell for Targeted Dual-Modality Bioimaging and Drug Delivery. ACS Appl. Mater. Interfaces 2017, 9, 13887–13899. [Google Scholar] [CrossRef]
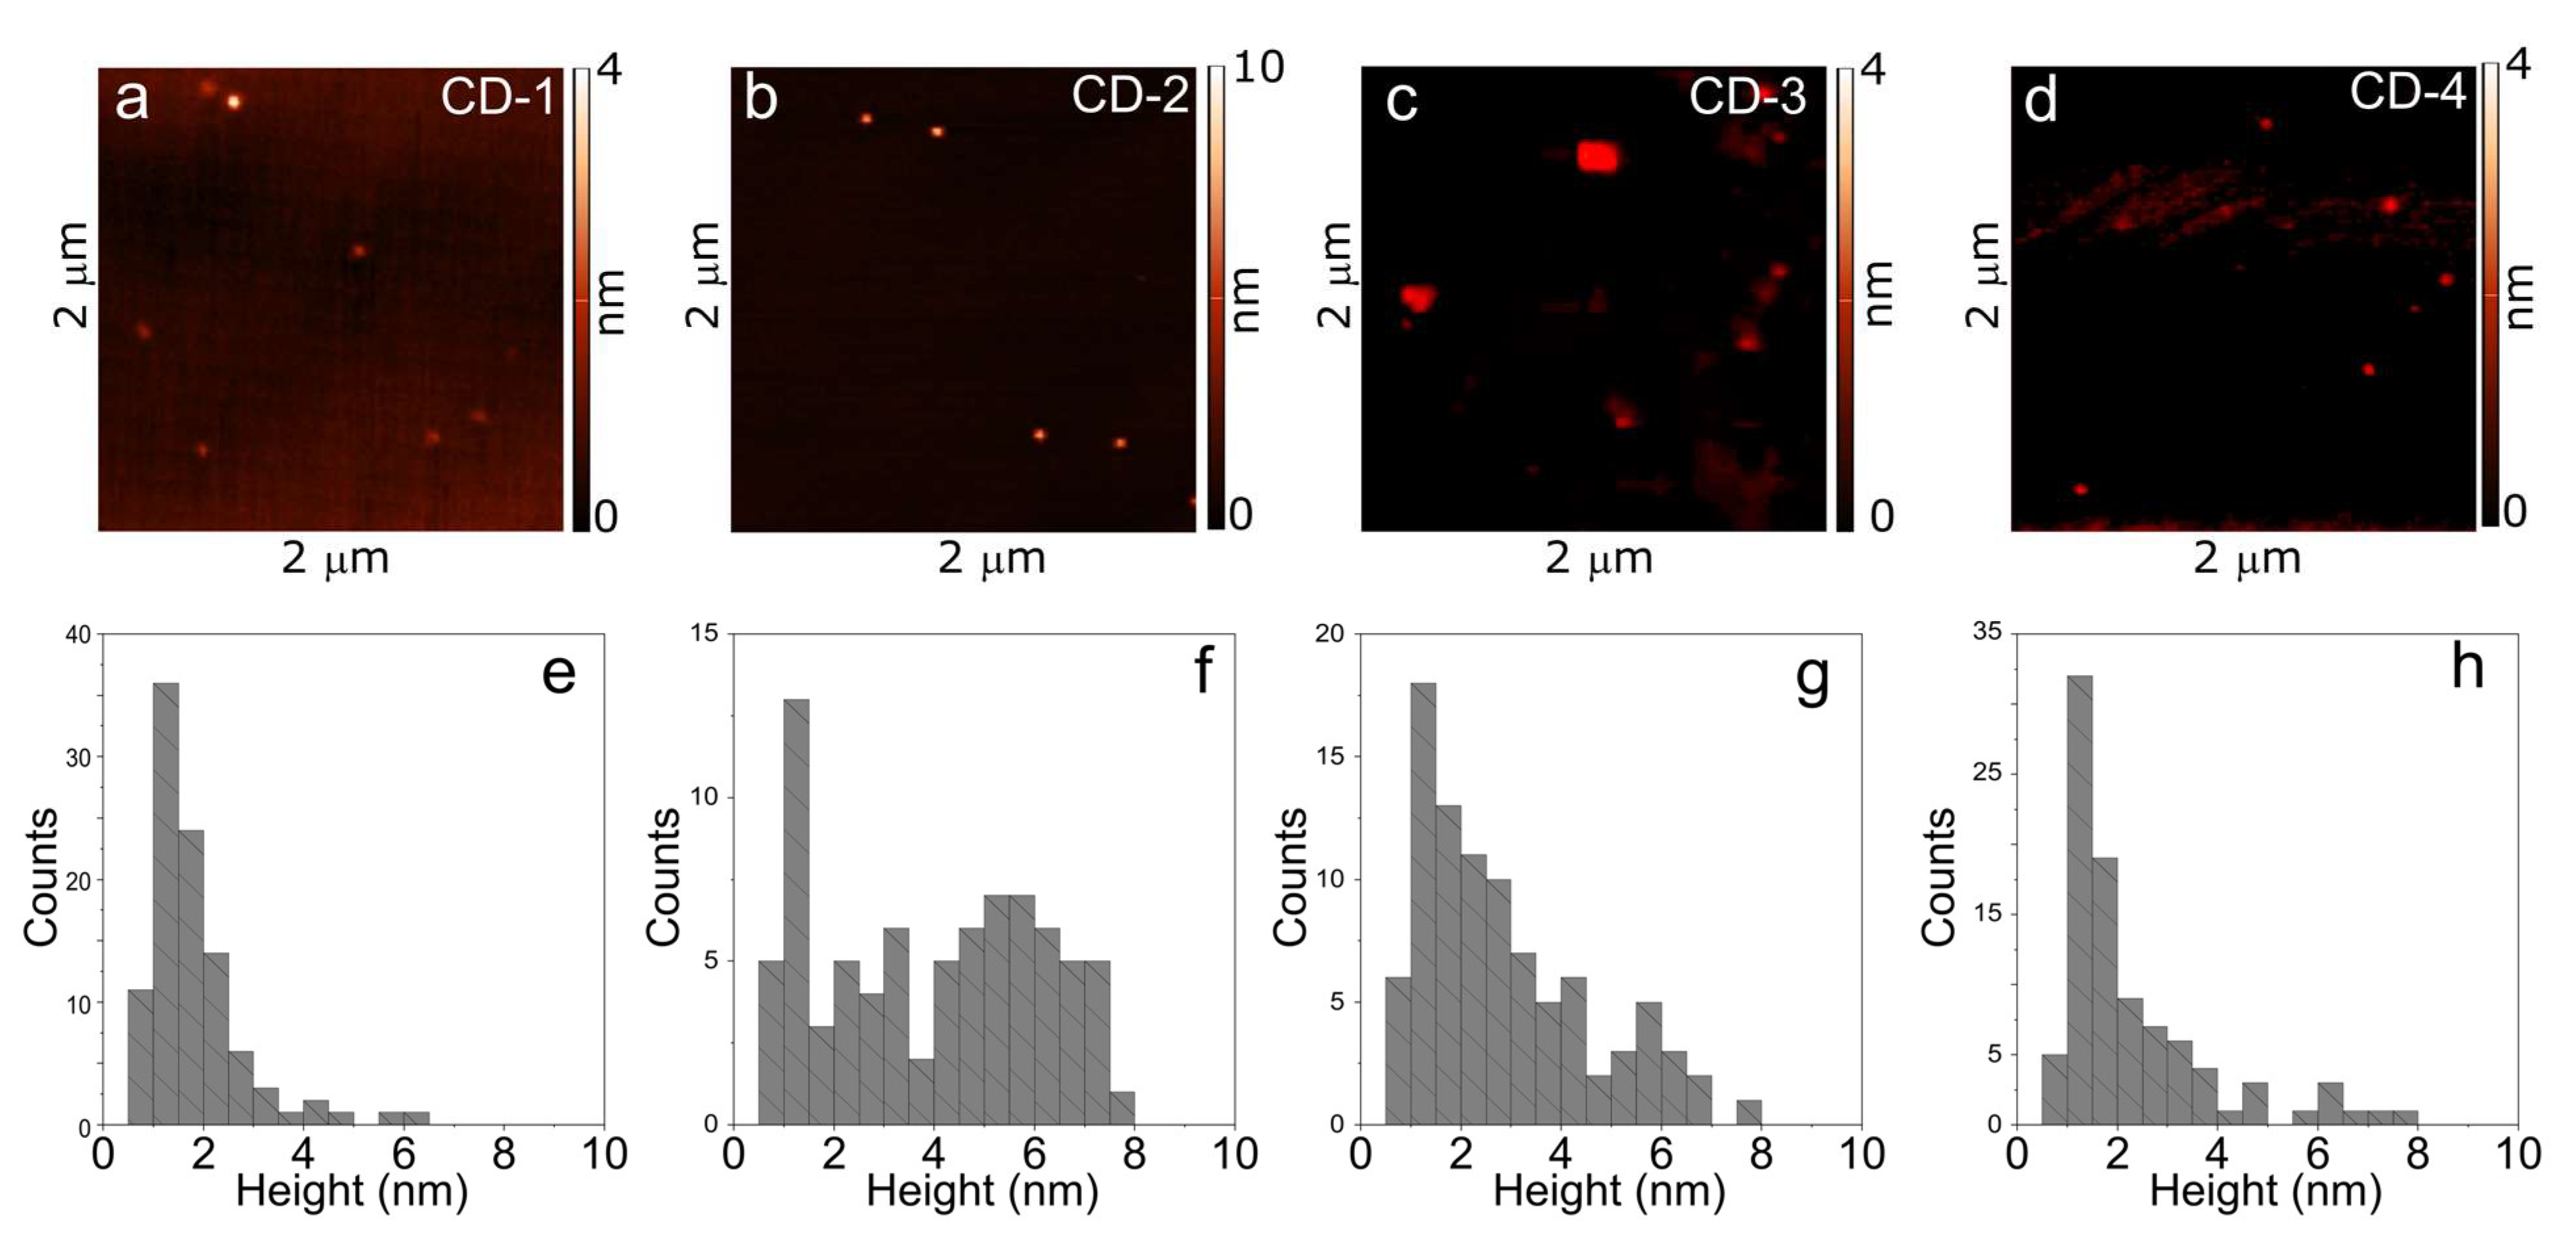
Figure 1. AFM analysis of Mn-doped CDs: AFM images (ad) and corresponding height distributions (eh) for CD-1 (a,e), CD-2 (b,f), CD-3 (c,g), and CD-4 (d,h).
Photonics 10 00757 g001
Figure 2. Morphology of Mn-doped CDs: (a) statistics of the CDs heights obtained from the analysis of AFM images (IQR—interquartile range); (b) FTIR spectra of CD-1 (green), CD-2 (yellow), CD-3 (pink), and CD-4 (purple); (c) chemical composition determined from XPS measurements.
Photonics 10 00757 g002
Figure 3. (a) Absorption spectra of aqueous solutions of CDs: CD-1 (green), CD-2 (yellow), CD-3 (pink), and CD-4 (purple). (be) PL-PLE maps of CD-1 (b), CD-2 (c), CD-3 (d), and CD-4 (e) in water.
Photonics 10 00757 g003
Figure 4. MRI performance of Mn-doped CDs: longitudinal T1 (a,b) and transverse T2 (d,e) relaxation rates as a function of Mn ion concentrations (dash lines: linear fitting) of CD-1 and CD-2 (a,d), CD-3 and CD-4 (b,e); T1 (c) and T2 (f) maps derived from MR images of CDs. Estimated relaxivity values are shown in (a,b,d,e).
Photonics 10 00757 g004
Figure 5. Relation between longitudinal r1 (a) and transverse relaxivities r2 (b) and atomic % of Mn ions within CDs. Difference in relaxation time T1 (c) and T2 (d) between the reference sample (saline solution, 0.9%) and the most concentrated solutions of CDs depending on the total atomic % of Mn.
Photonics 10 00757 g005
Disclaimer/Publisher’s Note: The statements, opinions and data contained in all publications are solely those of the individual author(s) and contributor(s) and not of MDPI and/or the editor(s). MDPI and/or the editor(s) disclaim responsibility for any injury to people or property resulting from any ideas, methods, instructions or products referred to in the content.