Article

The Analysis and Experiment of Pixel-Matching Method for Space-Dimensional Dual-Coded Spectropolarimeter

1
School of Opto-Electronic Engineering, Changchun University of Science and Technology, Changchun 130022, China
2
Jilin Provincial Key Laboratory of Space Optoelectronics Technology, Changchun University of Science and Technology, Changchun 130022, China
3
Northeast Industrial Group Co., Ltd., China North Industries Group Corporation Limited, Changchun 130103, China
*
Author to whom correspondence should be addressed.
Photonics 2023, 10(6), 632; https://doi.org/10.3390/photonics10060632
Submission received: 16 April 2023 / Revised: 17 May 2023 / Accepted: 22 May 2023 / Published: 31 May 2023

Abstract

:
In order to meet the high accuracy pixel-matching requirements of space-dimensional dual-coded spectropolarimeter, a dual-coded image pixel-matching method based on dispersion modulation is proposed. The mathematics of the dispersion power and the pixel matching is modeled. The relationship between different pixel-matching coefficients and the peak signal-to-noise ratio (PSNR) and structure similarity index measure (SSIM) of reconstructed images is analyzed. An imaging system experiment consisting of a digital micromirror device (DMD), a micro-polarizer array detector (MPA), and a prism–grating–prism (PGP) is built to reconstruct a spectral linear polarization data cube with 50 spectral channels and linear polarization parameters. The contrast ratio of the reconstructed spectropolarimeter image was raised 68 times against the ground truth. It can be seen from the reconstruction evaluation analysis that the spectral data and polarization data can be matched effectively by optimizing the dispersion coefficient of the PGP. The system can effectively reconstruct when the noise SNR is greater than 15 dB. The PSNR and SSIM of the reconstruction images can be improved by increasing the pixel-matching spacing. The optimal choice of the dual-coded pixel-matching spacing is one super-polarized pixel. The spectral resolution and quality of the spectropolarimeter are improved using the pixel-matching method.

1. Introduction

Spectral characteristics are inherent characteristics of matter. The intensity and spectral 2D data of an object can be obtained by spectral imaging, and it is sensitive to the type, material, and composition of the target. It can effectively distinguish object material and has applications in remote sensing and medicine [1,2,3,4,5]. Spectral polarization imaging (SPI) can acquire space, spectrum, and polarization data and has been a research hotspot worldwide.
Conventional spectral polarization imaging modes use a combination of polarization devices and spectrometers. The traditional time-sharing imaging method uses a scanning form, which makes it unable to image moving targets [6,7,8]. Compressive sensing is used to obtain spatial and spectral data in a scene, which is called compressive imaging [9,10]. This acquisition method reduces the cost of sensing, storing, and transmitting data cubes. It can be applied to detecting moving objects and effectively captures 3D information using 2D projection measurement. Typical compressive spectral polarization imaging methods include the division of amplitude [11,12], Fourier [13], the division of focal plane [14,15,16,17], and a computer tomography imaging spectrometer (CTIS) [18].
With the development of technology, more and more scholars are using compressive imaging methods to achieve spectral polarization imaging. Tsung-Han Tsai proposed a coded aperture snapshot spectral polarization imager (CASSPI) [19]. CASSPI utilizes two additional birefringent crystals behind the encoded aperture to achieve polarization coding, enabling the acquisition of the first two Stokes parameters. Chen et al. proposed a compressive spectrum and polarization imager for linear Stokes spectral image measurements. A compressive-based coded aperture snapshot linear Stokes imaging spectral polarimeter (CASSIS) was proposed, which could recover linear Stokes spectral images from sparse samples [20]. Xu proposed a pixelated polarizers array–based coded aperture snapshot spectral polarization imaging method. The 2D measurement was used to recreate the polarization images of 16 spectral bands [21]. Ning used a combination of a double Amici prism (DAP) and Wollaston prisms for a compressive circular polarization snapshot spectral imager (CCPSSI) [22]. The system used Wollaston prisms to obtain the target dual Stocks polarization information containing 25 spectral channels with circular polarization. However, snapshot spectral polarization imaging technology that can provide multi-dimensional imaging of moving objects still faces many challenges, including stable imaging mechanisms, accurate optimization methods, and efficient reconstruction algorithms.
Previously, we proposed a compressive space-dimension dual-coded hyperspectral polarimeter (CSDHP). Hyperspectral polarization data with a single shot were realized [23]. In the compressive spectral polarization imaging method, the coded aperture is used to encode spatial and spectral data, and the micro-polarizer array (MPA) detector is used to encode the polarization data. The pixels of digital micromirror devices (DMDs) and MPA detectors are determined using a pixel-matching method to achieve data unmixing and reconstruction. The spectropolarimeters are referred to as dual-coded methods.
In spatial imaging, pixel matching can be achieved by modeling spectral data and spatial data based on the dispersion power of dispersion components. During the polarization encoding process of MPA detectors, the matching relationship between polarization data and spatial data is known. However, the spatial coordinate axes of the two are different, which makes it impossible to accurately know the matching relationship between spatial data, spectral data, and polarization data. As a result, high-precision pixel matching cannot be achieved. In order to improve the accuracy of pixel matching and enhance the imaging ability of space-dimensional dual-coded systems, we propose a dual-coded pixel-matching method based on the dispersion modulation of the prism–grating–prism (PGP) and model the relationship between the angular dispersion of the PGP and pixel matching. We analyze and evaluate the pixel-matching results of the images through the peak signal-to-noise ratio (PSNR) and structure similarity index measure (SSIM) of the reconstructed results. Finally, experiments are established to verify the pixel-matching accuracy using 50 spectral channels and linear polarization parameters obtained.
In Section 2, we induce a method of pixel matching and unmixing for the space-dimensional dual-coded spectropolarimeter (SDSP). A design process for optimizing the adjacent spectra spacing is proposed. The relationship between the angular dispersion of the PGP and the focal length of the imaging lens with different adjacent spectra spacing is analyzed. In Section 3, we set up tabletop experiments. The spectral polarization images with different spectral spacings are acquired. It shows the advantages of spectral polarization imaging over spectral imaging through comparative experiments. We compare the reconstruction effects of different adjacent spectra spacing. The pixel-matching effect of different adjacent spectral spacing is evaluated through SSIM and PSNR to determine the optimal solution. In Section 4 and Section 5, we present a discussion and conclusion.

2. Principle

2.1. Imaging Configuration

Previously, we proposed a compressive space-dimensional dual-coded hyperspectral polarization imaging method [23]. The structure of SDSP is shown in Figure 1. First, the data cube is imaged at the first image plane through the objective lens, and the 3D data cube is spatially modulated by the DMD. The DMD consists of a series of micromirrors, each of which has two possible states: “ON” (rays reaching this micromirror can be transmitted through the relay lens) and “OFF” (light reaching this micromirror will be reflected out of the optical system). Applying a coding mode on the DMD through computer control. The micromirror tilt angle is ±12°. The coded data cube reaches the PGP through the relay lens and reaches the detector through the PGP and imaging lens. Then, we acquire 2D spatial, spectral, and polarization aliasing data on the detector. The MPA detector is an array of micro-polarizers integrated directly into the focal plane of the camera sensor, and 2 × 2 adjacent pixels correspond to a polarization super-pixel.
In the CDSP, a DMD is used as a spatial light modulator, and the data cube is encoded at the primary image plane using the DMD to achieve data compression encoding. The micro-polarizer array detector completes the encoding and information acquisition of the polarization channel simultaneously. DMD is combined with an MPA to achieve controlled mixing of spectrally polarized data cubes, so the data cubes undergo two encodings. The first encoding is the spatial data coded by the coded aperture at the first image plane. Because of the special structure of MPA, its polarization encoding corresponds to the spatial position one by one. So, the second encoding is the polarization data (spatial) versus spectrum data by the MPA. The micromirrors of the DMD and the pixels of the MPA achieve precise encoding of spectral polarization data by means of pixel matching. The interval between adjacent spectral lines is determined by the dispersion power of the PGP and the focal length of the imaging lens. The simulation model of the PGP and the imaging lens is shown in the figure. The material of the two prisms in the PGP is BK7 with top angles of 7.4°. The material of the grating is B270, the number of lines is 360 lins/um, and the dispersion level is +1. Each pixel is coded according to the spatial coordinate position. The four adjacent pixels within a square region form a 2 × 2 super-polarized pixel. The polarized focal plane array divides into several 2 × 2 units to calculate the Stokes vector based on the super-polarized pixels.
The Stokes vector method is represented as
Stokes = I M C S = I 0 + I 90 I 0 I 90 I 45 I 135 I R I L ,
where  I  is the total irradiance of the beam,  M  is the horizontal ( I 0 ) polarized flux component minus the vertical ( I 90 ) flux component, and  C  is the 45° flux ( I 45 ) minus the 135° flux ( I 135 ). Finally,  S  measures the difference of the right ( I R ) minus left ( I L ) circularly polarized flux [24].
The degree of linear polarization ( D O L P ), which represents the percentage of the total intensity of polarized rays, is defined as
D O L P = M 2 + C 2 + S 2 I ( 0 D O L P 1 ) ,
The aliasing data received by the MPA detector, coming from each of the four pixels (0°, 45°, 90°, and 135°) composed of one super-pixel, are relatively independent and in different directions. In compressive imaging, the TwIST algorithm is selected to compare structural similarity (SSIM) and peak signal-to-noise ratio (PSNR). The TwIST algorithm used in this study is represented as [25]
f ^ = argmin S 1 2 g H f 2 2 + τ Γ T V ( f ) ,
where  τ  is a weighting coefficient between fidelity and sparsity and  Γ t w ( f )  is the total regularization term. If we define the discrete version of the original continuous 3D data cube  f 0 ( x , y ; λ )  as the  f 0 ( i , j ; w ) , the Total Variation ( T V ) regularization term becomes
Γ T V f = w i , j f ( i + 1 , j , w ) f ( i , j , w ) 2 + f ( i , j + 1 , w ) f ( i , j , w ) 2 ,
The spectral images of the four polarization angles are obtained separately after reconstruction. The pixels are then reconstructed into a spectral polarization image with an instantaneous field-of-view error based on the corresponding positions of the polarization code. Subsequently, using the bilinear interpolation method, the polarization super-pixels are complemented to resolve the instantaneous field-of-view error. Finally, the spectral data cubes of the Stocks are obtained separately. The 4D data cube is deconstructed with a single shot

2.2. Matching Model

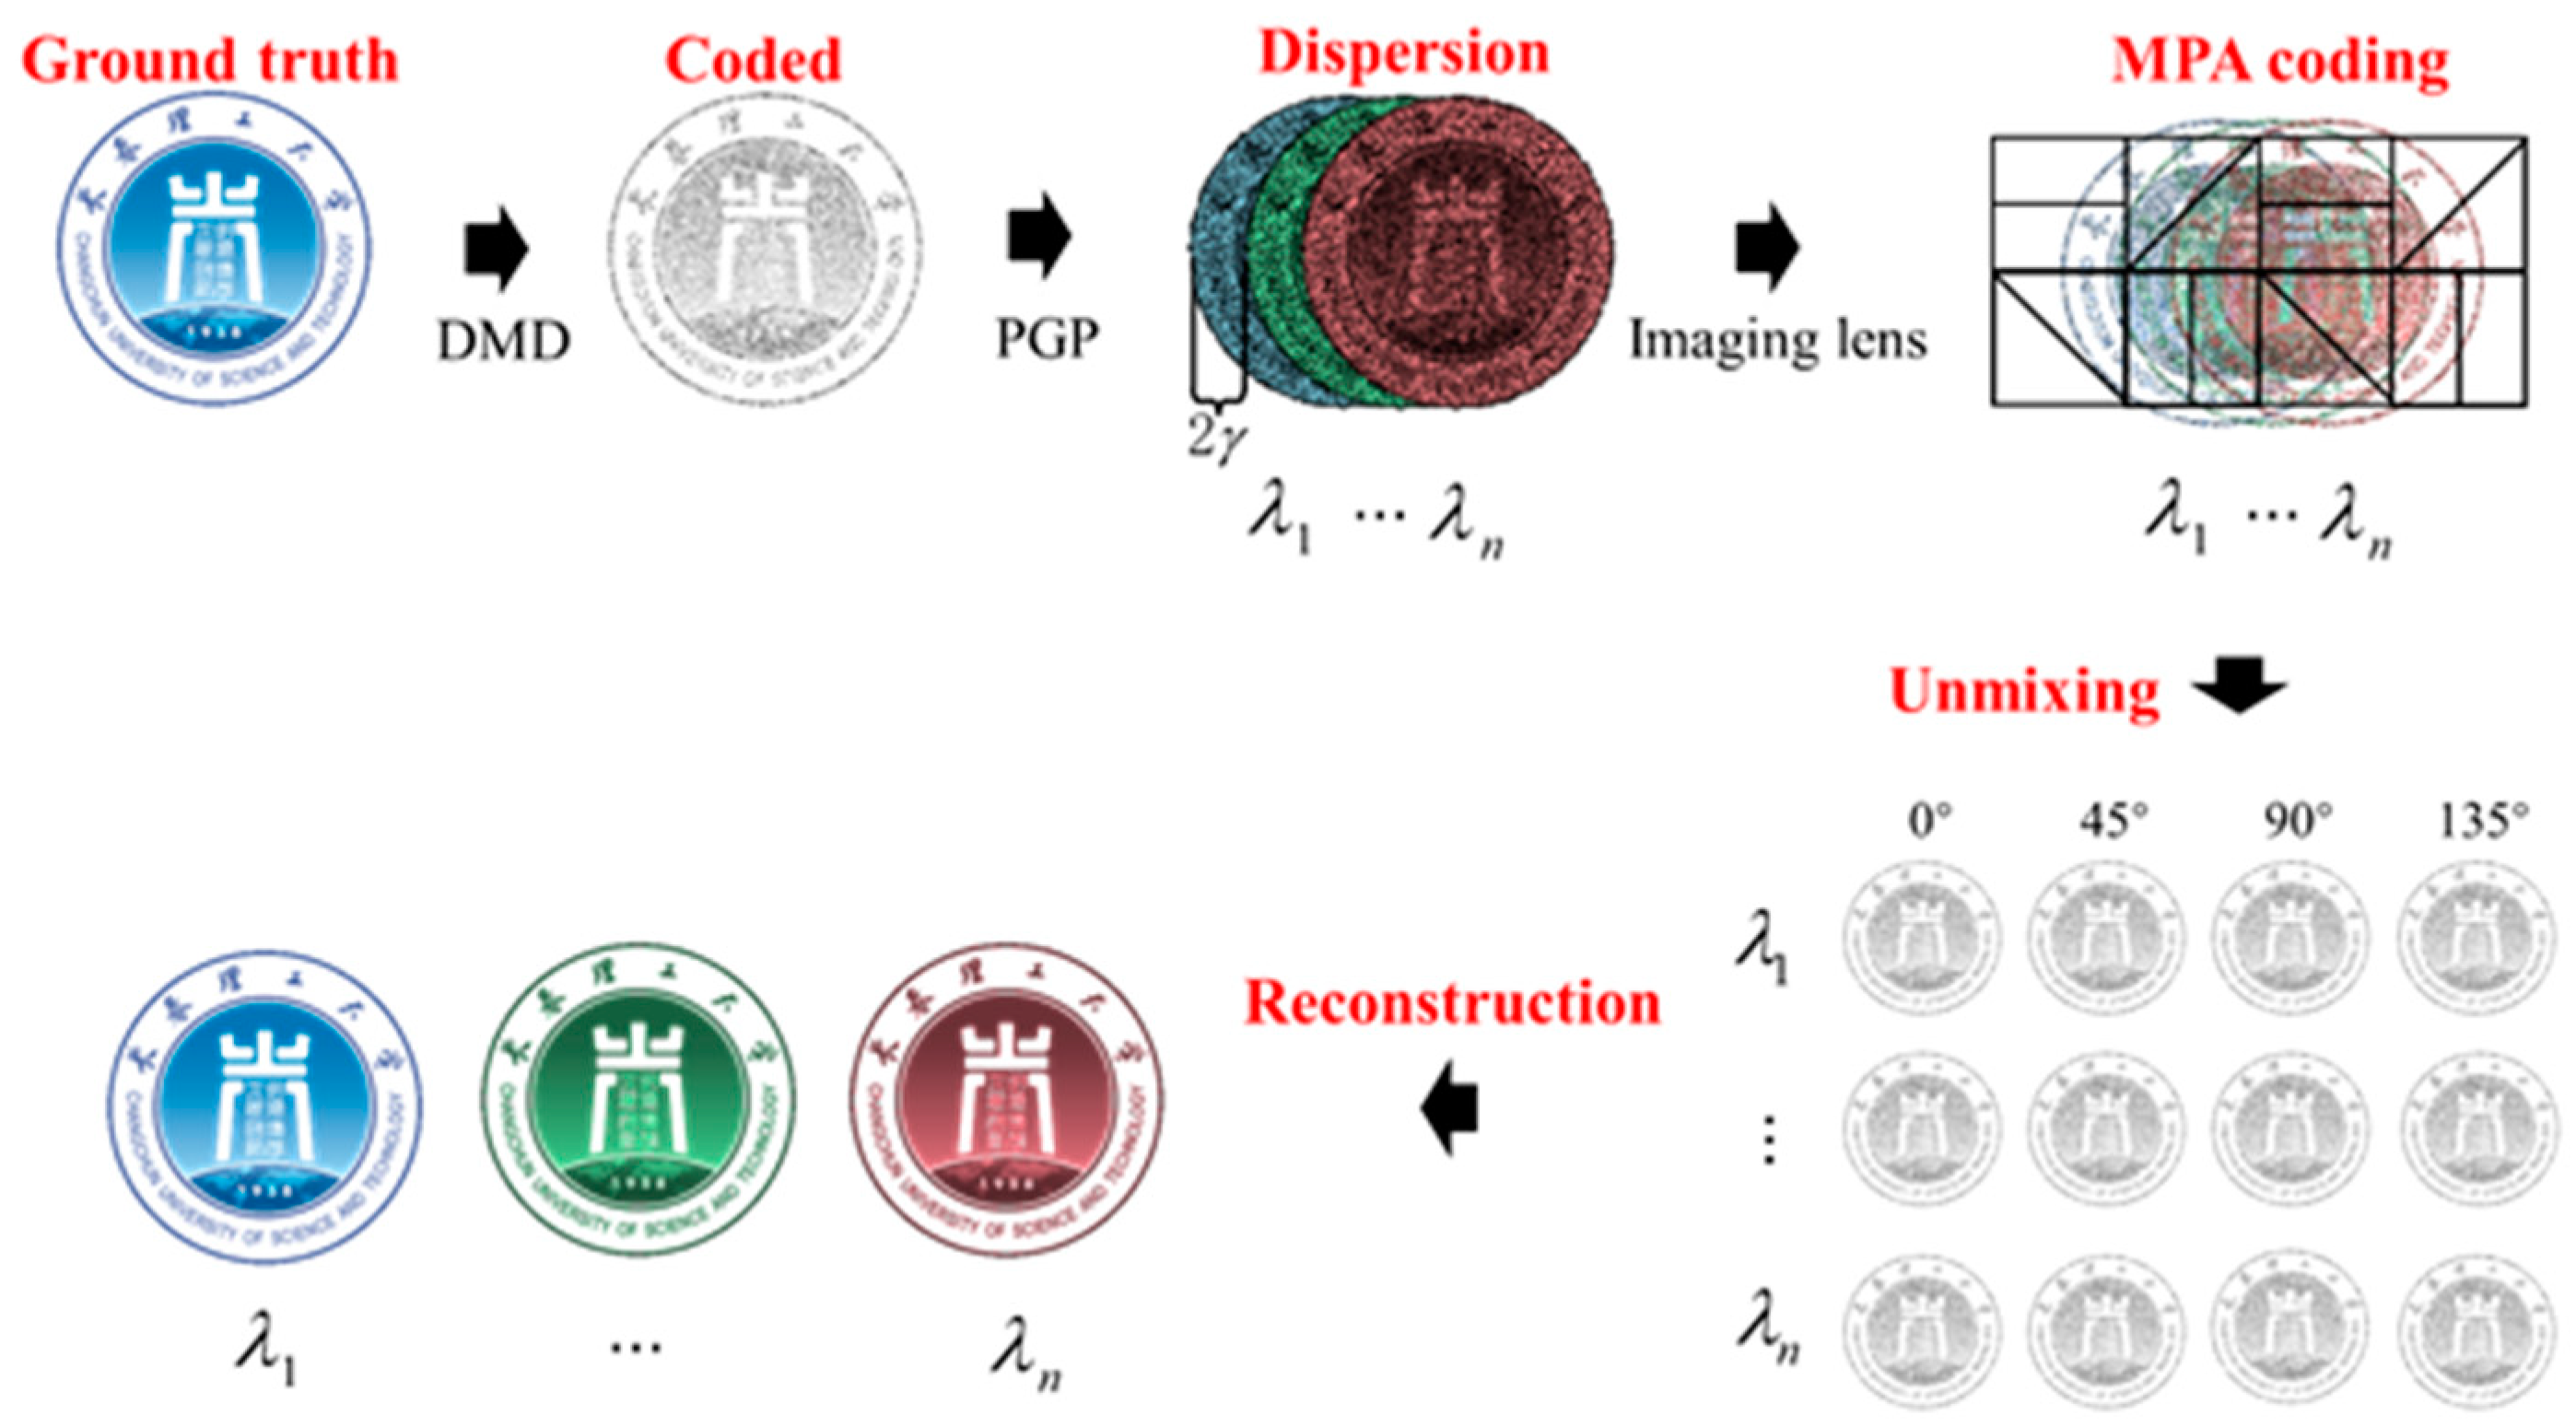
The schematic diagram of pixel matching, unmixing, and reconstruction is shown in Figure 2. The target data cube is coded by the DMD placed at the primary image plane of the objective lens. The rays pass through the relay lens to the PGP to generate dispersion. Eventually, the dispersive rays converge to the MPA detector by the imaging lens. The dispersion data cube is selected according to the polarization direction of the MPA at a specific position. A matched dispersive 2D data cube is formed. Subsequently, according to the coded polarization pixels, the super-pixels are separated. The groups of pixels with the same polarization angle are grouped to form four groups of images with different polarization directions. Finally, the matched dispersive 2D data cube is reconstructed.
According to the design process, the center of the Airy point of the  λ n  spectrum coincides with the primary dark ring of the Airy point of the  λ n + 1  spectrum at the pixel. To ensure the aliasing state, the adjacent spectral interval is changed from  2 γ ( γ N * )  to  γ  pixels. At this time, the sensing matrices are still known and conform to the original RIP criterion. Therefore, according to the Rayleigh criterion, the linear dispersion power is expressed as
d l d λ = 2 γ × P M P A ( γ N * ) ,
where  d l d λ  denotes the line linear dispersion power,  P M P A  denotes the size of the MPA detector pixels, and the coefficient  γ  is introduced to represent a multiple of detector pixels and can only be a positive even number.
Convert linear dispersion into character dispersion:
d θ d λ × f = 2 γ × P M P A ,
where  f  is the focal length of the imaging lens.
Because the role dispersion of the PGP is the sum of the dispersion rates of each device, there is
d θ d λ = d δ p 1 d λ + d δ G d λ + d δ p 2 d λ ,
Combine the Equations (6) and (7),
d δ p 1 d λ + d δ G d λ + d δ p 2 d λ × f = 2 γ × P M P A ,
From Equation (8), it can be seen that controlling the focal length  f  can achieve changes  γ  without changing the overall dispersion of the PGP.
To realize spectral polarization data unmixing and dual-coded pixel matching for the MPA, DMD, and PGP, according to the polarization encoding form of the MPA detecto  γ , determines the resolution and imaging quality of the system. So, we adopt a way to optimize the process of adjacent spectral spacing in terms of spectral resolution, spatial resolution, and imaging quality. The optimization process is shown in Figure 3.
Firstly, the DMD, MPA, and PGP introduce spatial coordinate aliasing, which is solved by pixel matching and super-pixel unmixing. Secondly, the pixel-matching theory is proposed based on  d l d λ = 2 γ × P M P A  to achieve controllable mixing of spatial, spectral, and polarization data. Thirdly, pixel matching is used to change the  γ  to 2, 4, 6, 8, …. Changing the value to 2, 4, 6, 8, …, the aliased data is unmixed and reconstructed. Finally, We analyze the PSNR and SSIM of the reconstructed image under different spectral resolutions and spatial resolutions and then judge the value of  γ .
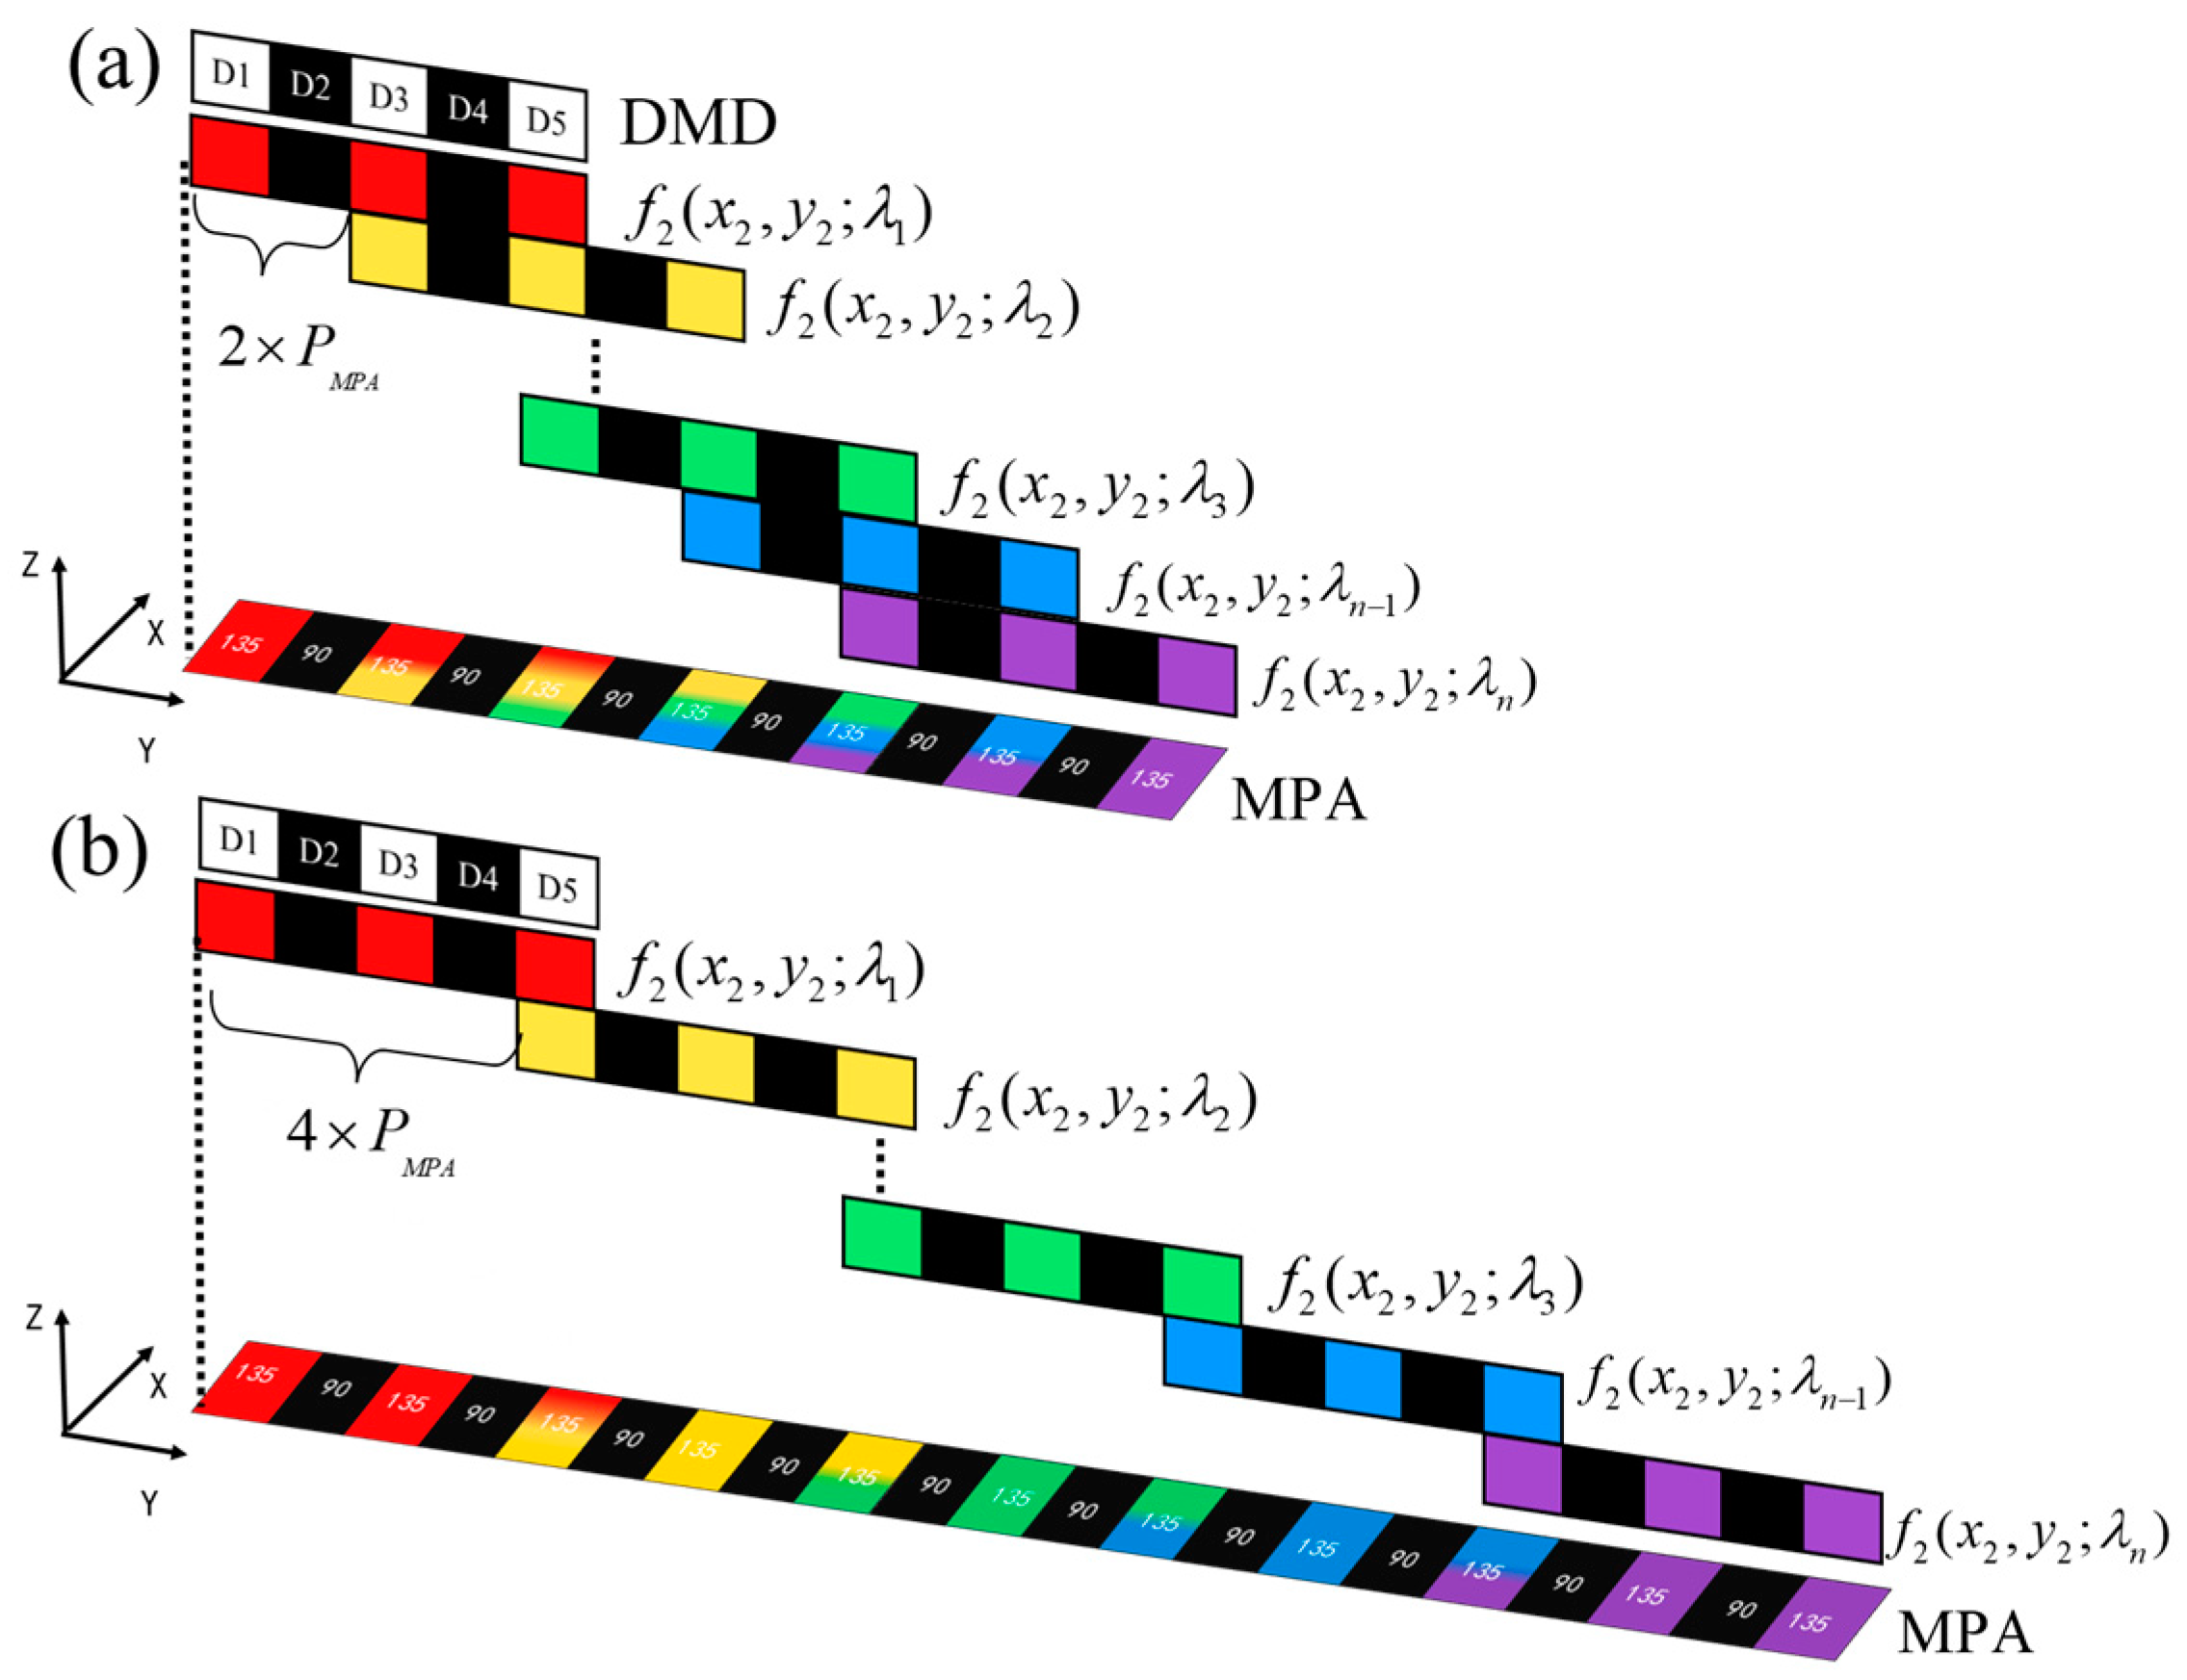
The pixel size of the MPA corresponds to the pixel size of the DMD through scaling of the focal length design of the relay and imaging lens. According to Equations (5)–(8), the distance of line dispersion is shown in Figure 4 (only  γ  = 2 and  γ  = 4 are drawn).
Therefore, we model the discrete energy transport of the system with the spectral density of each polarization Stocks parameter before entering the system, expressed as
f 0 ( x , y ; λ ) = S 0 ( x 0 , y 0 ; λ ) + S 1 ( x 0 , y 0 ; λ ) + S 2 ( x 0 , y 0 ; λ ) ,
where  S 0 ( x 0 , y 0 ; λ ) S 1 ( x 0 , y 0 ; λ ) , and  S 2 ( x 0 , y 0 ; λ )  represent the corresponding spatial and spectral data cubes of the three covariates of Stocks before entering the system.
The spectral density after the coded aperture is
f 1 ( x 1 , y 1 ; λ ) = T ( x D M D , y D M D ) f 0 ( x 0 , y 0 ; λ ) ,
where  T ( x D M D , y D M D )  denotes the spectral polarization density corresponding to the DMD spatial coordinates. After optical design alignment, the spatial coordinates of space, the DMD, and the detector target surface correspond to each other, and so they are
T x D M D , y D M D = i , j t ( i , j ) rect x D M D p D M D i , y D M D p D M D j ,
where  t ( i , j )  represents a binary value at the  ( i , j ) t h  micromirror on the DMD and  rect x D M D p D M D i , y D M D p D M D j  denotes the spatial range of the  ( i , j ) t h  micromirror.
After PGP dispersion along the y-axis, the spectral density currently is
f 2 ( x 2 , y 2 ; λ ) = f 1 ( x 1 , y 1 ; λ ) δ ( x , y , λ ) d x 1 d y 1 = δ x 1 x 2 , y 1 y 2 d l d λ T ( x , y ) S 0 ( x 0 , y 0 ; λ ) d x 1 d y 1 + δ x 1 x 2 , y 1 y 2 d l d λ T ( x , y ) S 1 ( x 0 , y 0 ; λ ) d x 1 d y 1 + δ x 1 x 2 , y 1 y 2 d l d λ T ( x , y ) S 2 ( x 0 , y 0 ; λ ) d x 1 d y 1 ,
where the  δ  function represents the dispersion effect of PGP and  λ C  is the central wavelength.
The spectral density is dispersed on the y-axis of the detector plane. The encoded data cube is projected onto the sensor of the MPA detector. The final continuous image on the detector plane can be described as
g ( x 3 , y 3 ) = ω λ f 2 ( x 2 , y 2 ; λ ) d λ ,
where  ω λ  is the spectral response coefficient corresponding to the wavelength.
Finally, each pixel of the detector measures the integrated intensity of the spectral density at a specific polarization angle. Detector surfaces are pixelated in space at the size of image elements  p M P A  such that that the spatial domain at the detector plane  g ( x 3 , y 3 )  is sampled as 
g x 3 , y 3 = g x 3 , y 3 rect x 2 p M P A x 3 , y 2 p M P A y 3 d x 2 d y 2 = λ ω ( λ ) f 2 x 2 , y 2 ; λ rect x 2 p M P A x 3 , y 2 p M P A y 3 d x 2 d y 2 d λ = λ ω ( λ ) T ( x , y ) δ x 1 x 2 , y 1 y 2 d l d λ S 0 x 0 , y 0 ; λ rect x 2 p M P A x 3 , y 2 p M P A y 3 d x 1 d y 1 d x 2 d y 2 d λ + λ ω ( λ ) T ( x , y ) δ x 1 x 2 , y 1 y 2 d l d λ S 1 x 0 , y 0 ; λ rect x 2 p M P A x 3 , y 2 p M P A y 3 d x 1 d y 1 d x 2 d y 2 d λ + λ ω ( λ ) T ( x , y ) δ x 1 x 2 , y 1 y 2 d l d λ S 2 x 0 , y 0 ; λ rect x 2 p M P A x 3 , y 2 p M P A y 3 d x 1 d y 1 d x 2 d y 2 d λ ,
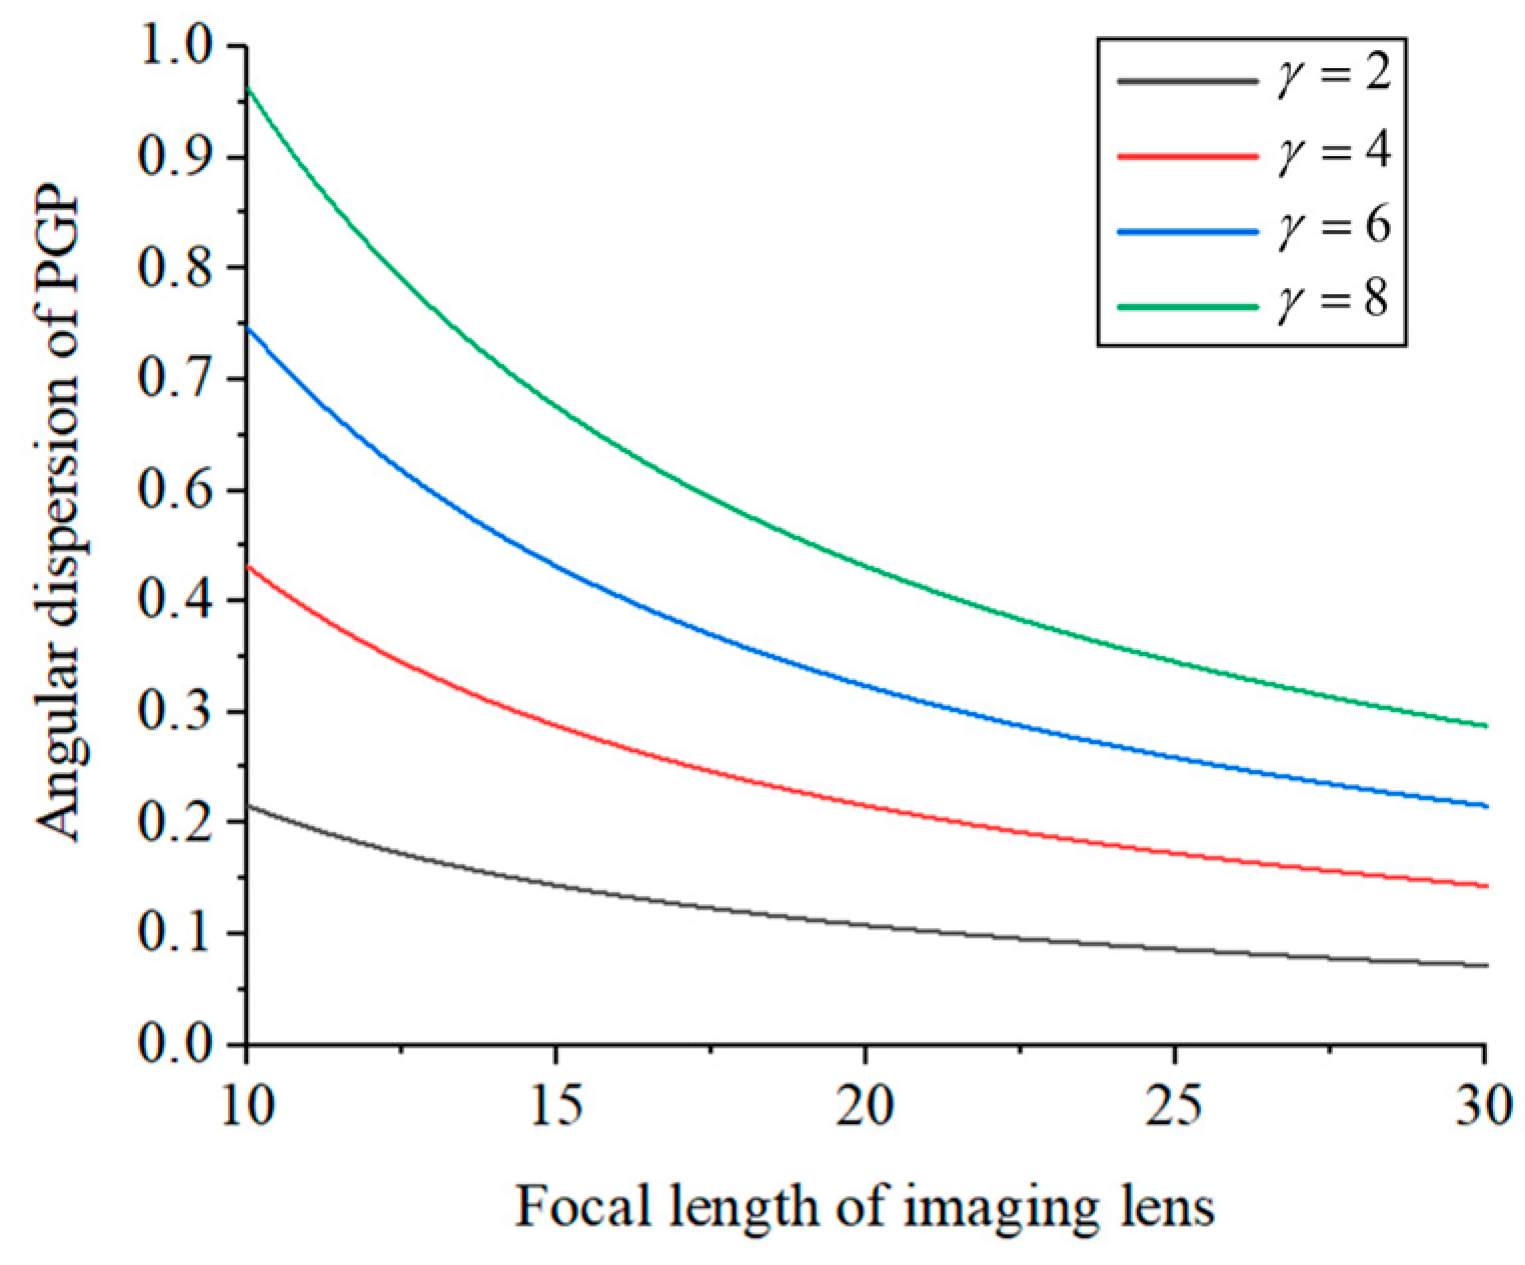
From Equation (14), the correspondence of the micromirrors and pixels can be derived. Each pixel contains discrete spectral data and three parameters of the polarization data. In the polarization array, each polarization parameter is encoded and filtered to form the spectral polarization aliasing data. Without changing the system structure, the pixel-matching spacing is determined by the angular dispersion of the PGP and the focal length of the imaging lens; the normalized results are shown in Figure 5. From the figure, It can be seen that the angular dispersion is proportional to  γ . In addition, the correspondence can be used to provide a basis for the design of PGP and the imaging lens.

3. Experiment

3.1. Experimental Platform

Figure 6 depicts the experimental prototype of SDSP. The coded aperture selected DMD (Texas Instruments DLP6500, Dallas, TX, USA) included 1920 × 1080 elements of a random binary pattern with a 7.65 × 7.65 µm mirror pitch. The measured images were taken using an MPA detector (Flir Blackfly BFS-U3-123S6C-C) with a pixel size of 3.45 µm and a resolution of 4120 × 3000. The working wavelength of the prism was 425–675 nm (Edmund #35-788). The central wavelength of the grating was 532 nm (WP-360/532-25.4).

3.2. Contrast of Reconstruction Results

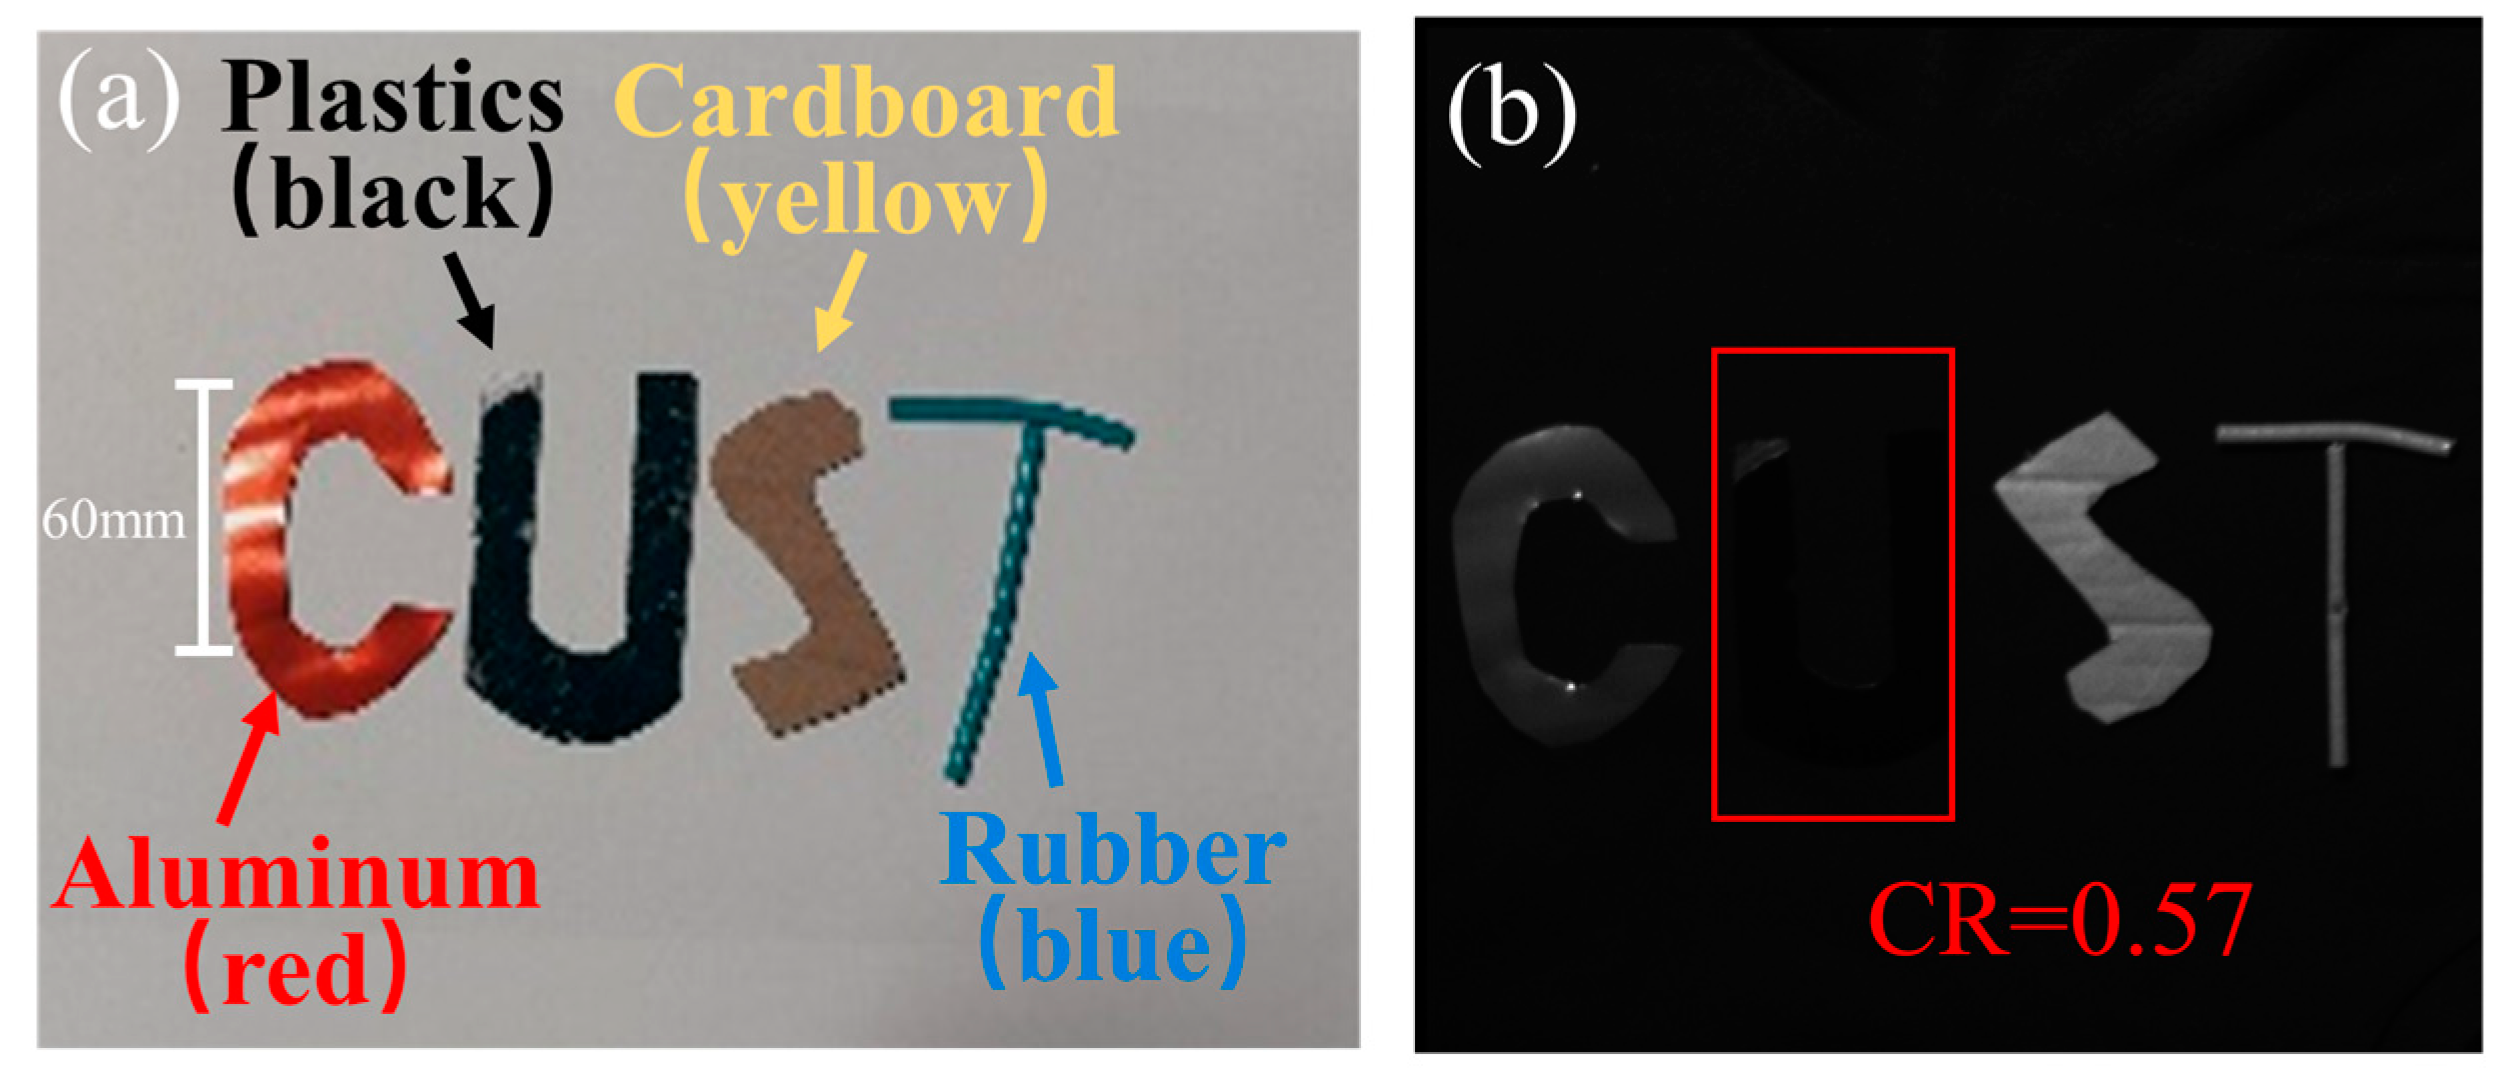
According to Equations (5)–(8) and Figure 4 in Section 2, we changed the focal length of the imaging lens to make  γ  = 2 and 4 to unmix and reconstruct the data cube. As shown in Figure 7a, the abbreviated letters of this institution were chosen for the corresponding target: “C” for red aluminum, “U” for black plastic, “S” for light yellow cardboard, and “T” for blue rubber. The ground truth is shown in Figure 7b. Because the letter “U” was black, it is not obvious in a dark room.
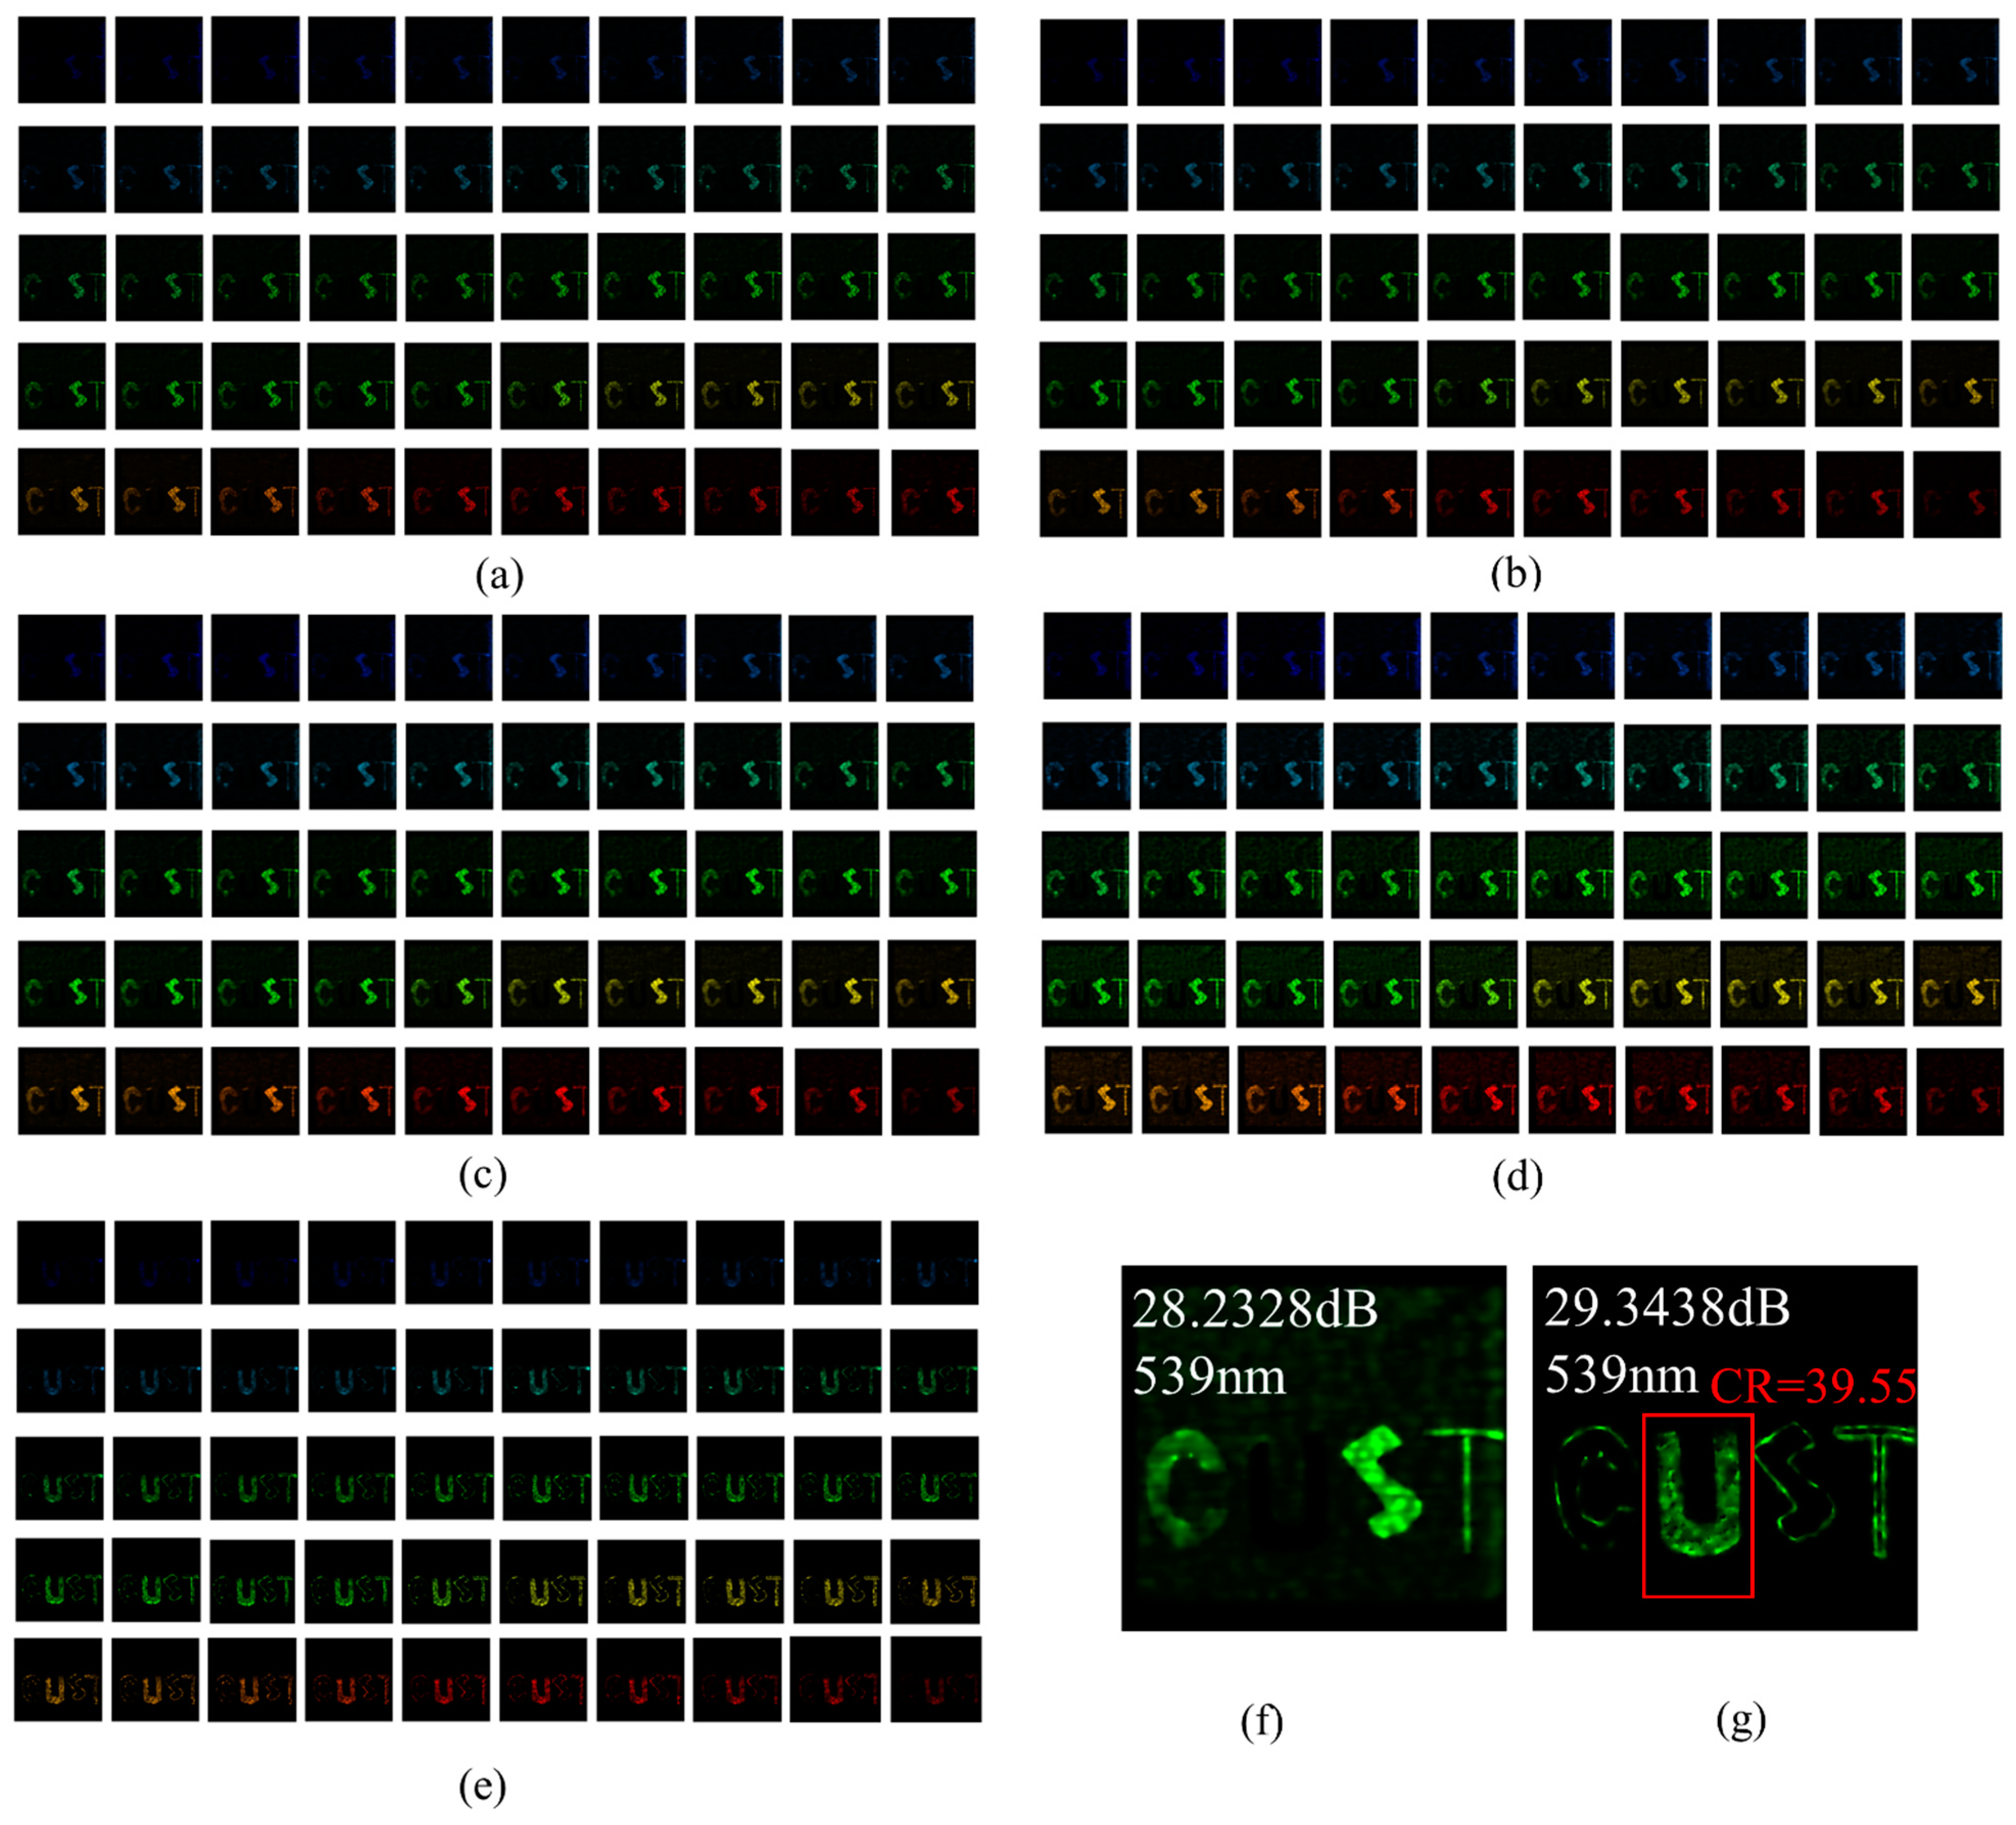
The reconstructed spectral polarization image is shown in Figure 8a–e. Figure 8f,g show the magnified view at 539 nm, respectively. The variable  γ = 4 , spatial resolution is 512 × 496, and the 50 channels are from 450 to 650 nm.
A comparison of Figure 8a–d shows that each letter had high spectral resolutions in the spectral images of all four polarization directions. The letters “C” and “T” had distinct peak bands that could be easily distinguished. The letter “S” had a complete spectrum. Since the letter “U” was black and had the same spectral characteristics as the background, it was difficult to distinguish. However, in the polarization images of Figure 8e,g, the letter “U” was clearly distinguishable because the polarization characteristics were different from the background. Comparing the contrast ratio (CR) of the letter “U” in Figure 7b with that in Figure 8g, the contrast ratio improved from 0.57 to 39.55. It can be concluded that polarization can improve the imaging contrast and the system spectral polarization imaging effect is effective in the case of interference due to unfavorable environmental spectral imaging. This proves that spectrally polarized images can be used to distinguish the object material.
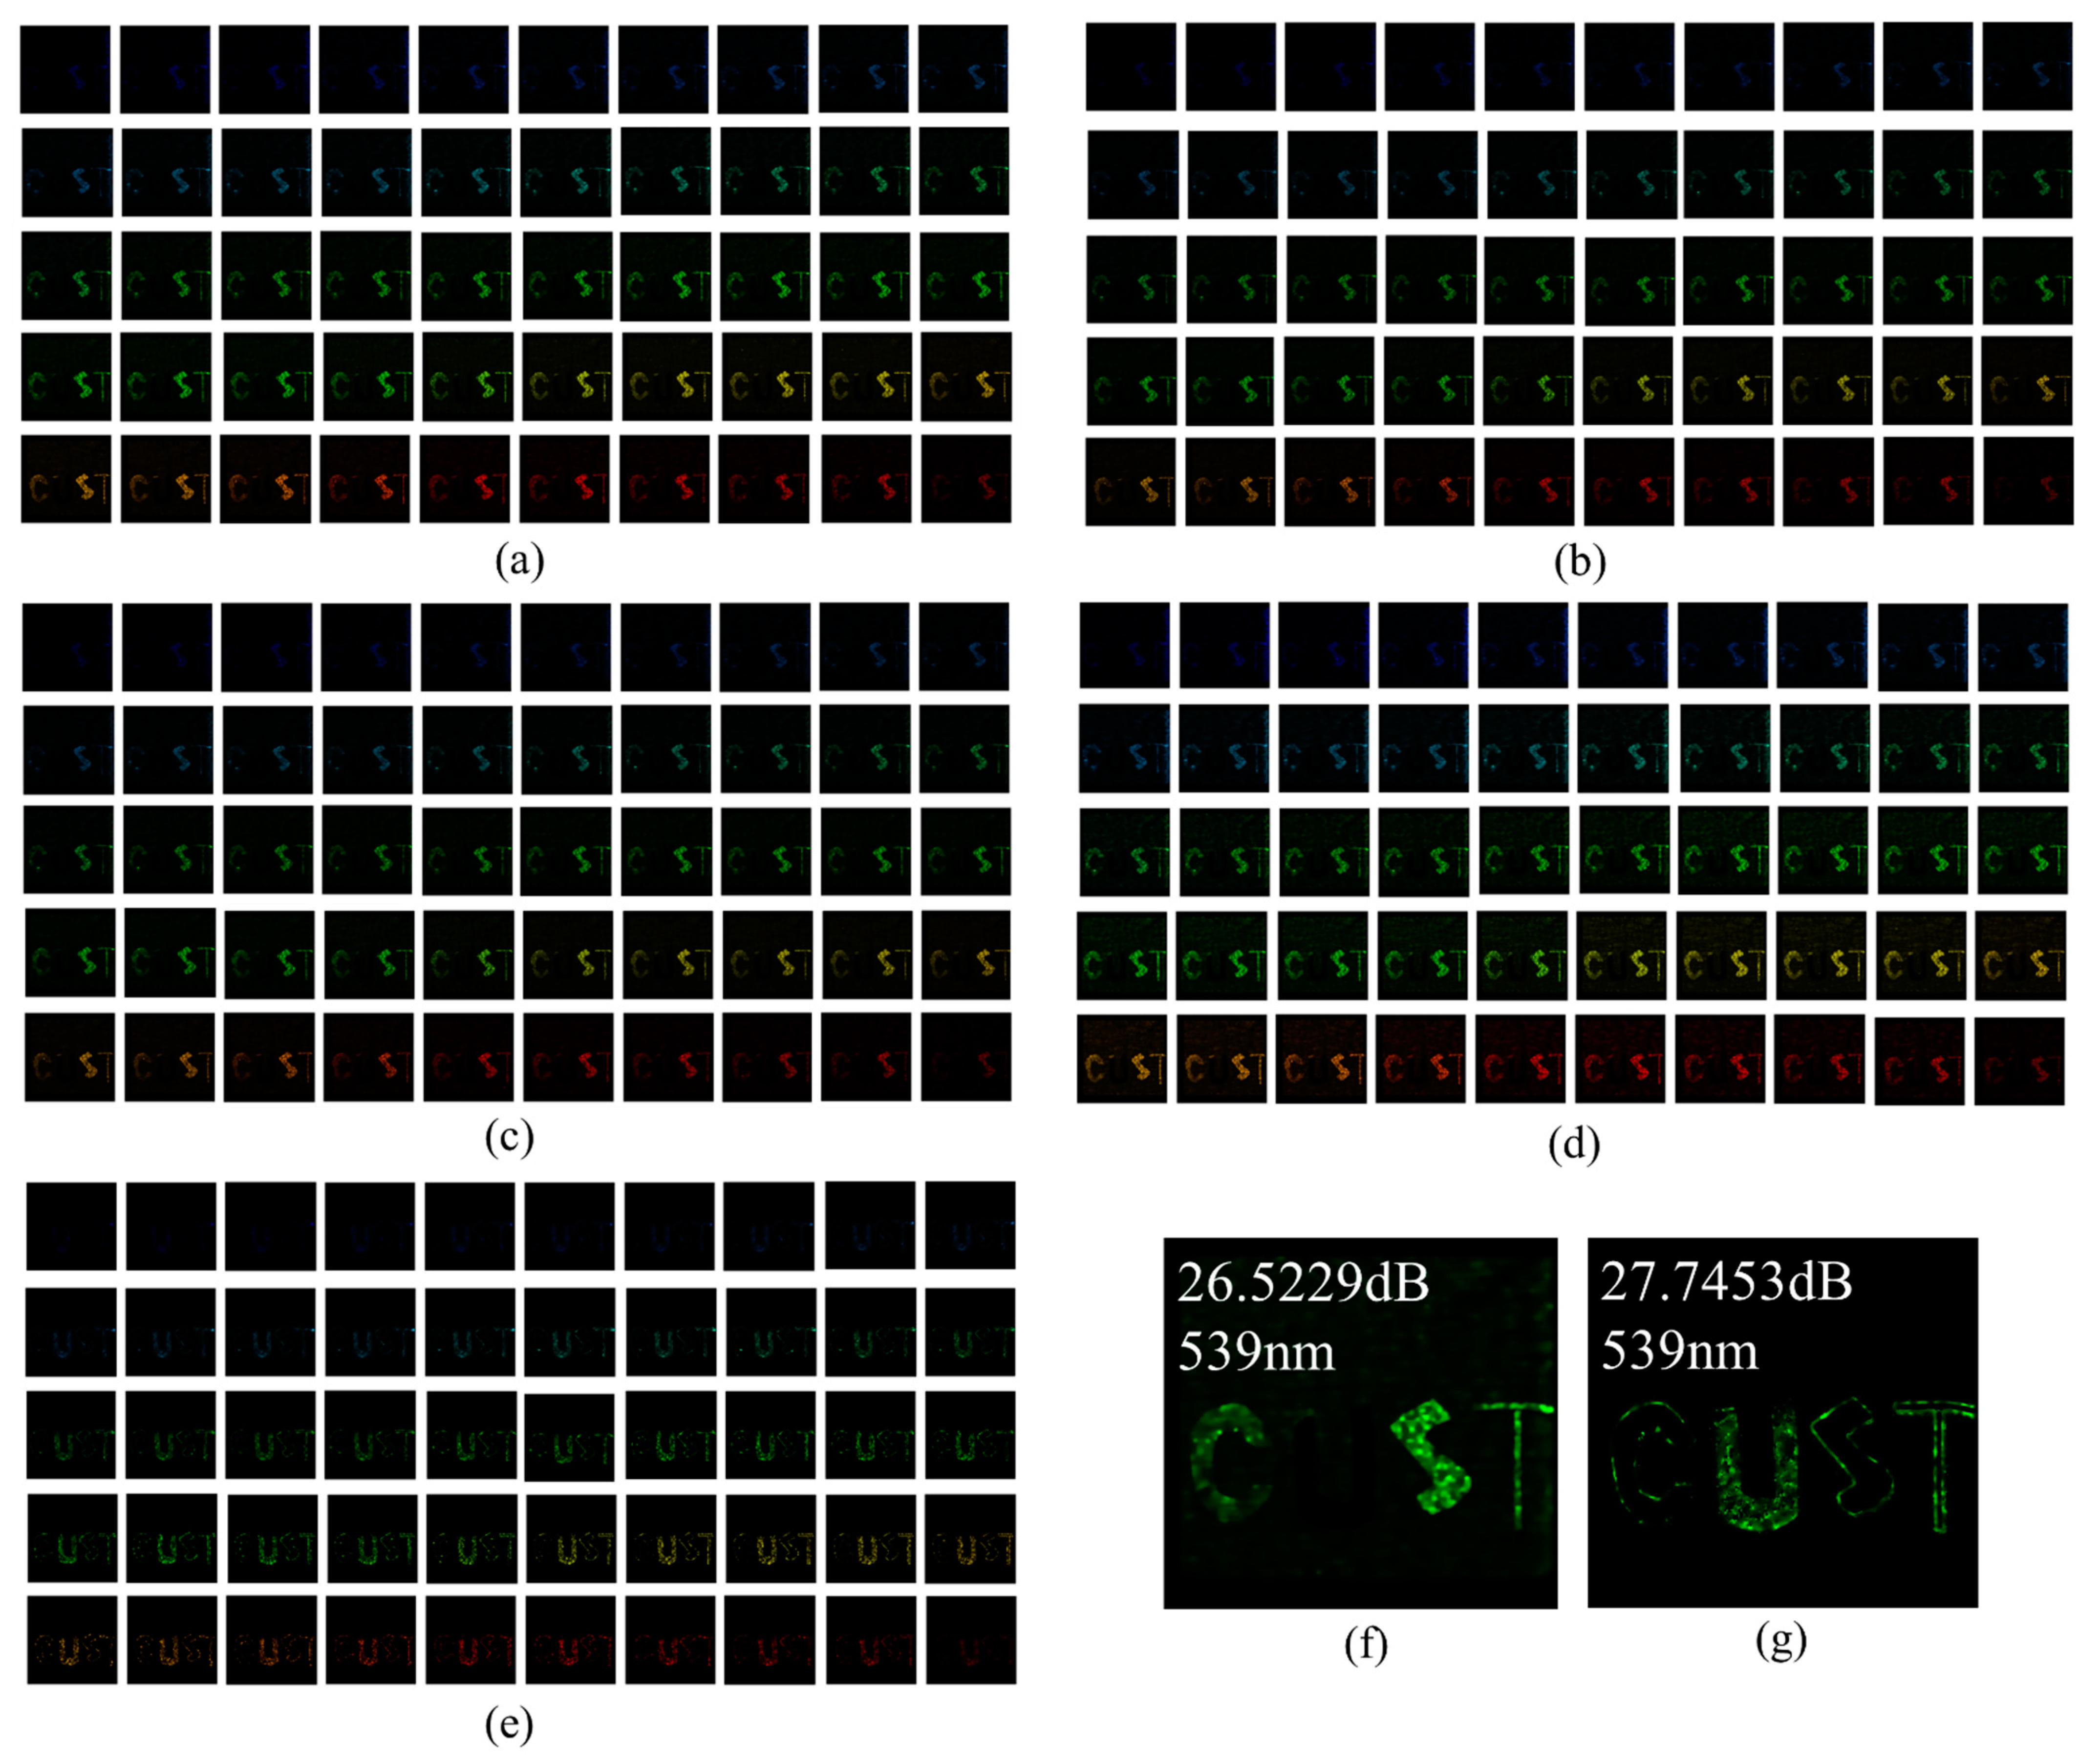
Next, we changed the structure of the PGP and the imaging lens to make  γ = 2  and performed the unmixing and reconstruction experiment again.
It is known from Figure 9 that each letter had the same high spectral resolution in all four polarization directions of the spectral image. The letters “C”, ”U”, “S”, and ”T” did not differ much from those in Figure 8, but the signal-to-noise ratio (SNR) was lower.

3.3. Evaluation

To compare the final effects of the two aliasing methods, the reconstruction performance was measured using SSIM and PSNR, thus evaluating the effect of dual-coded aliasing of spectral polarization data cubes.
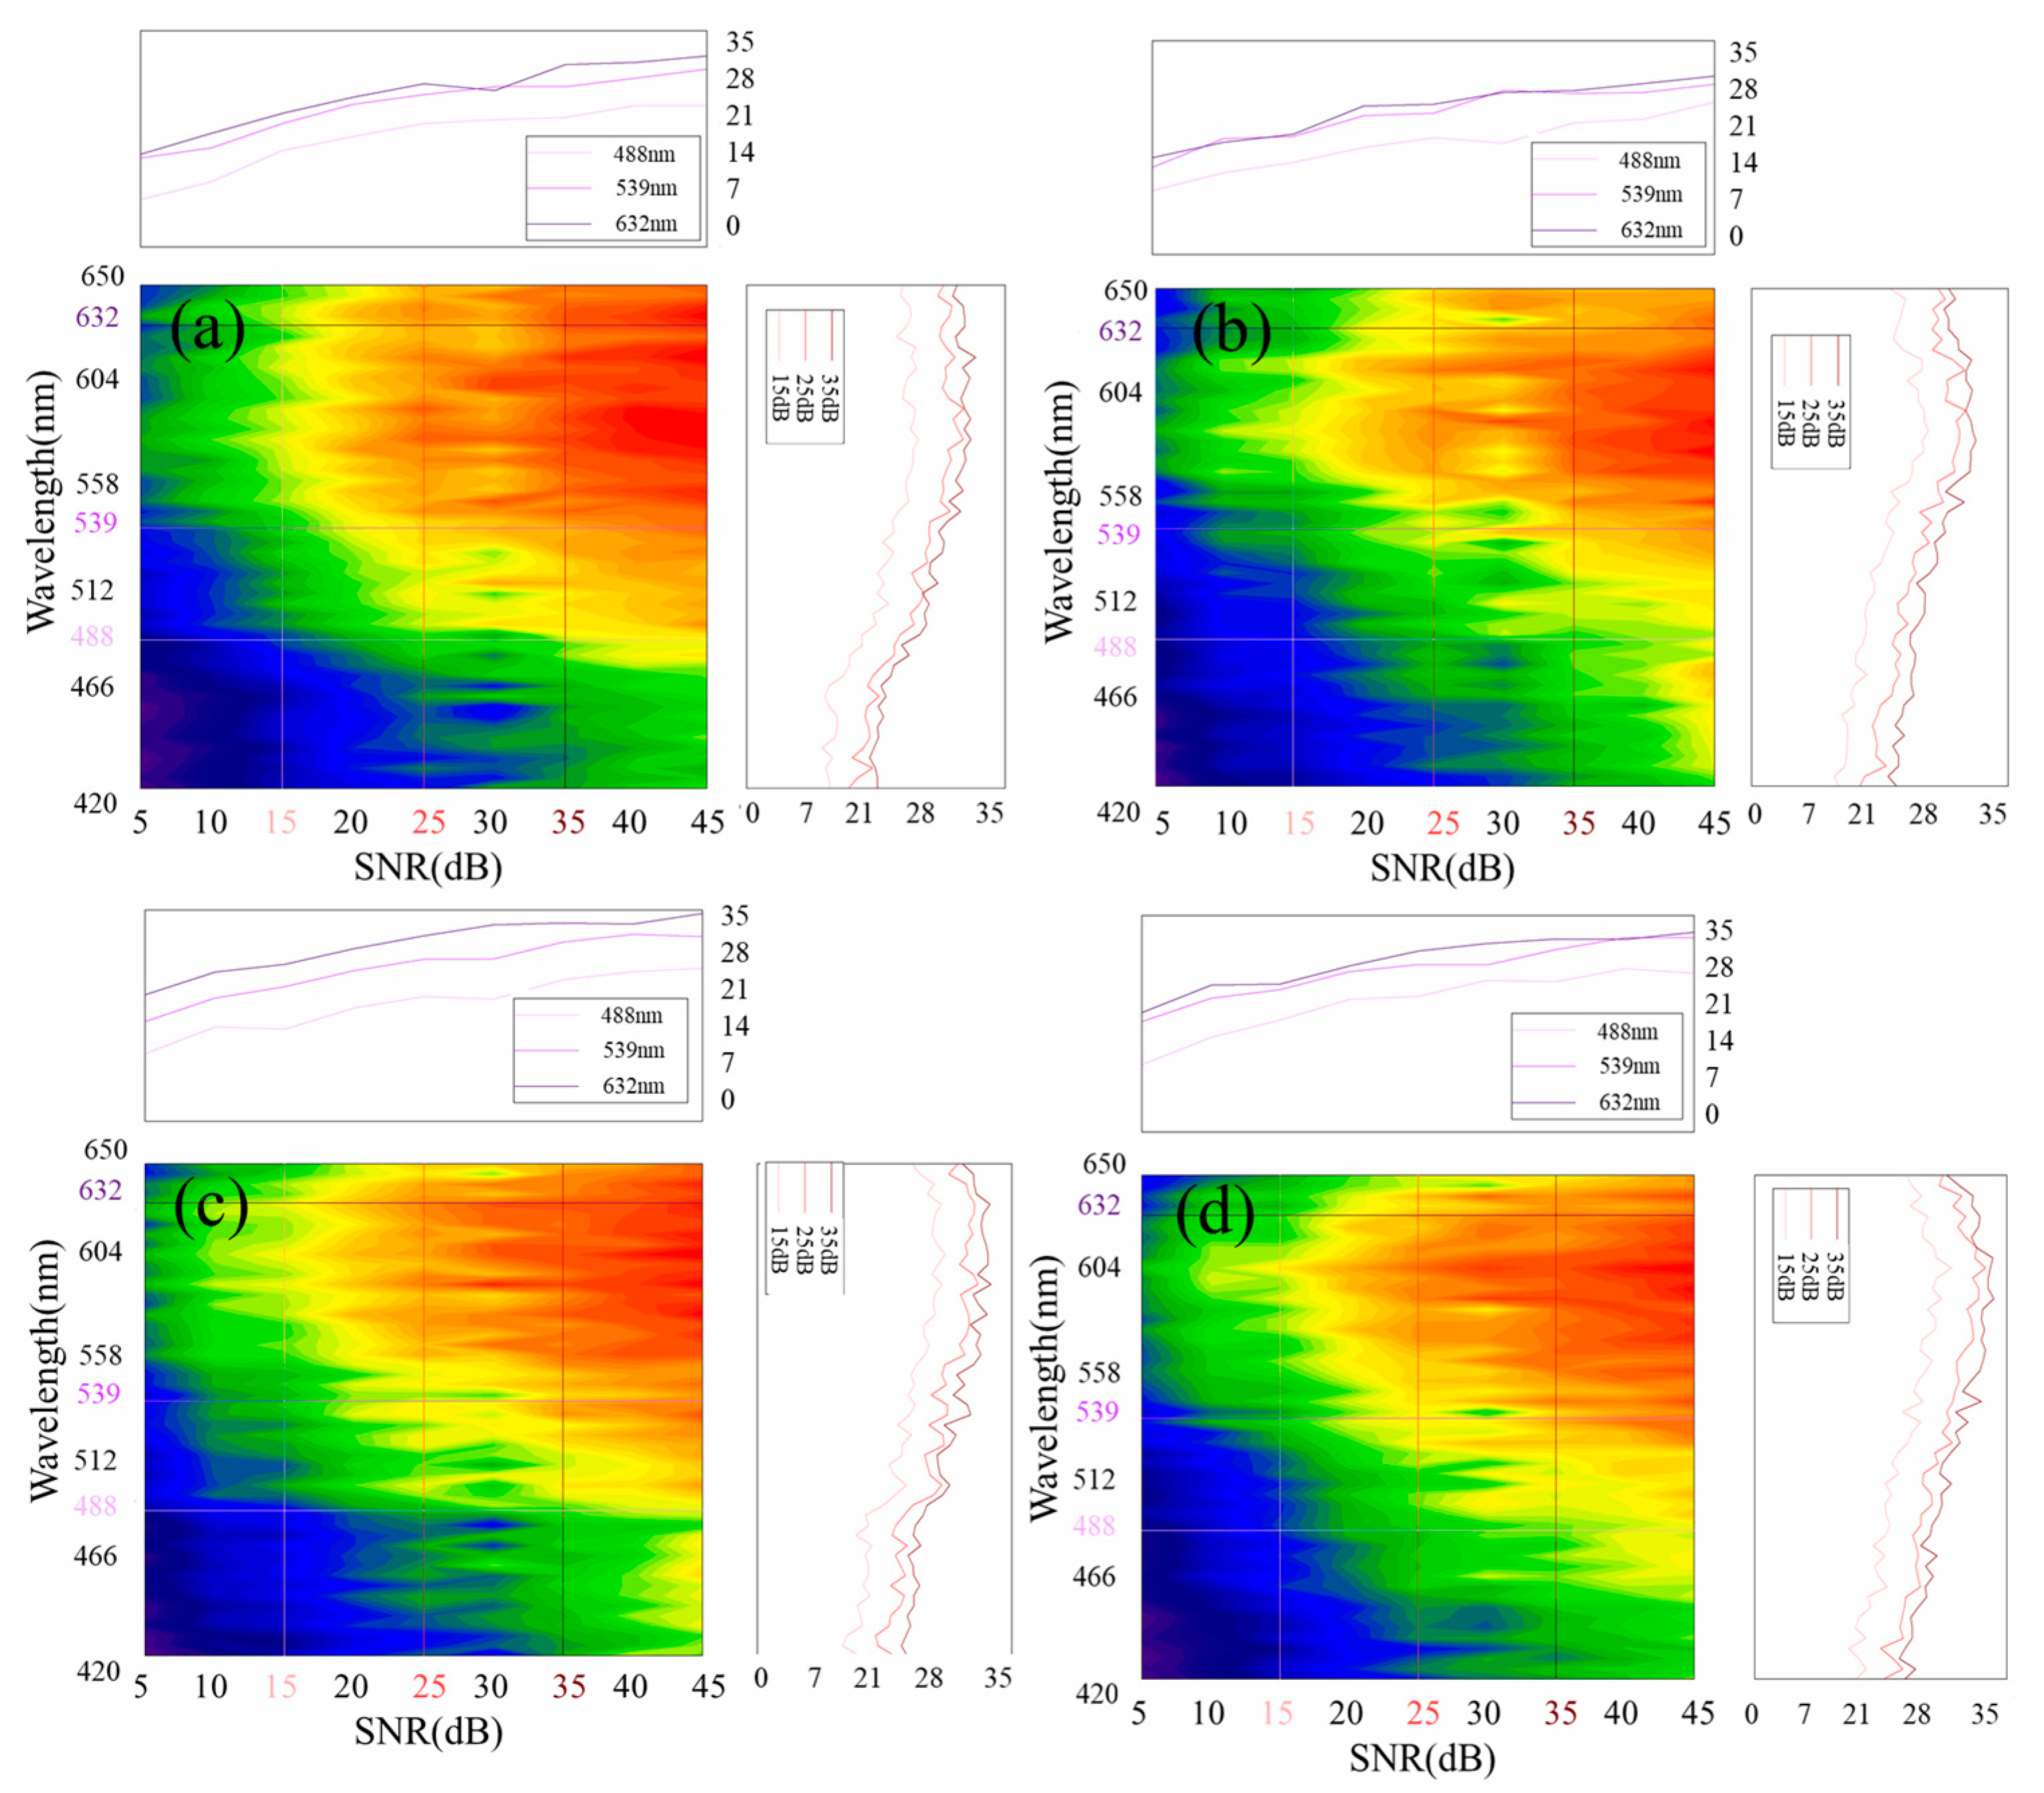
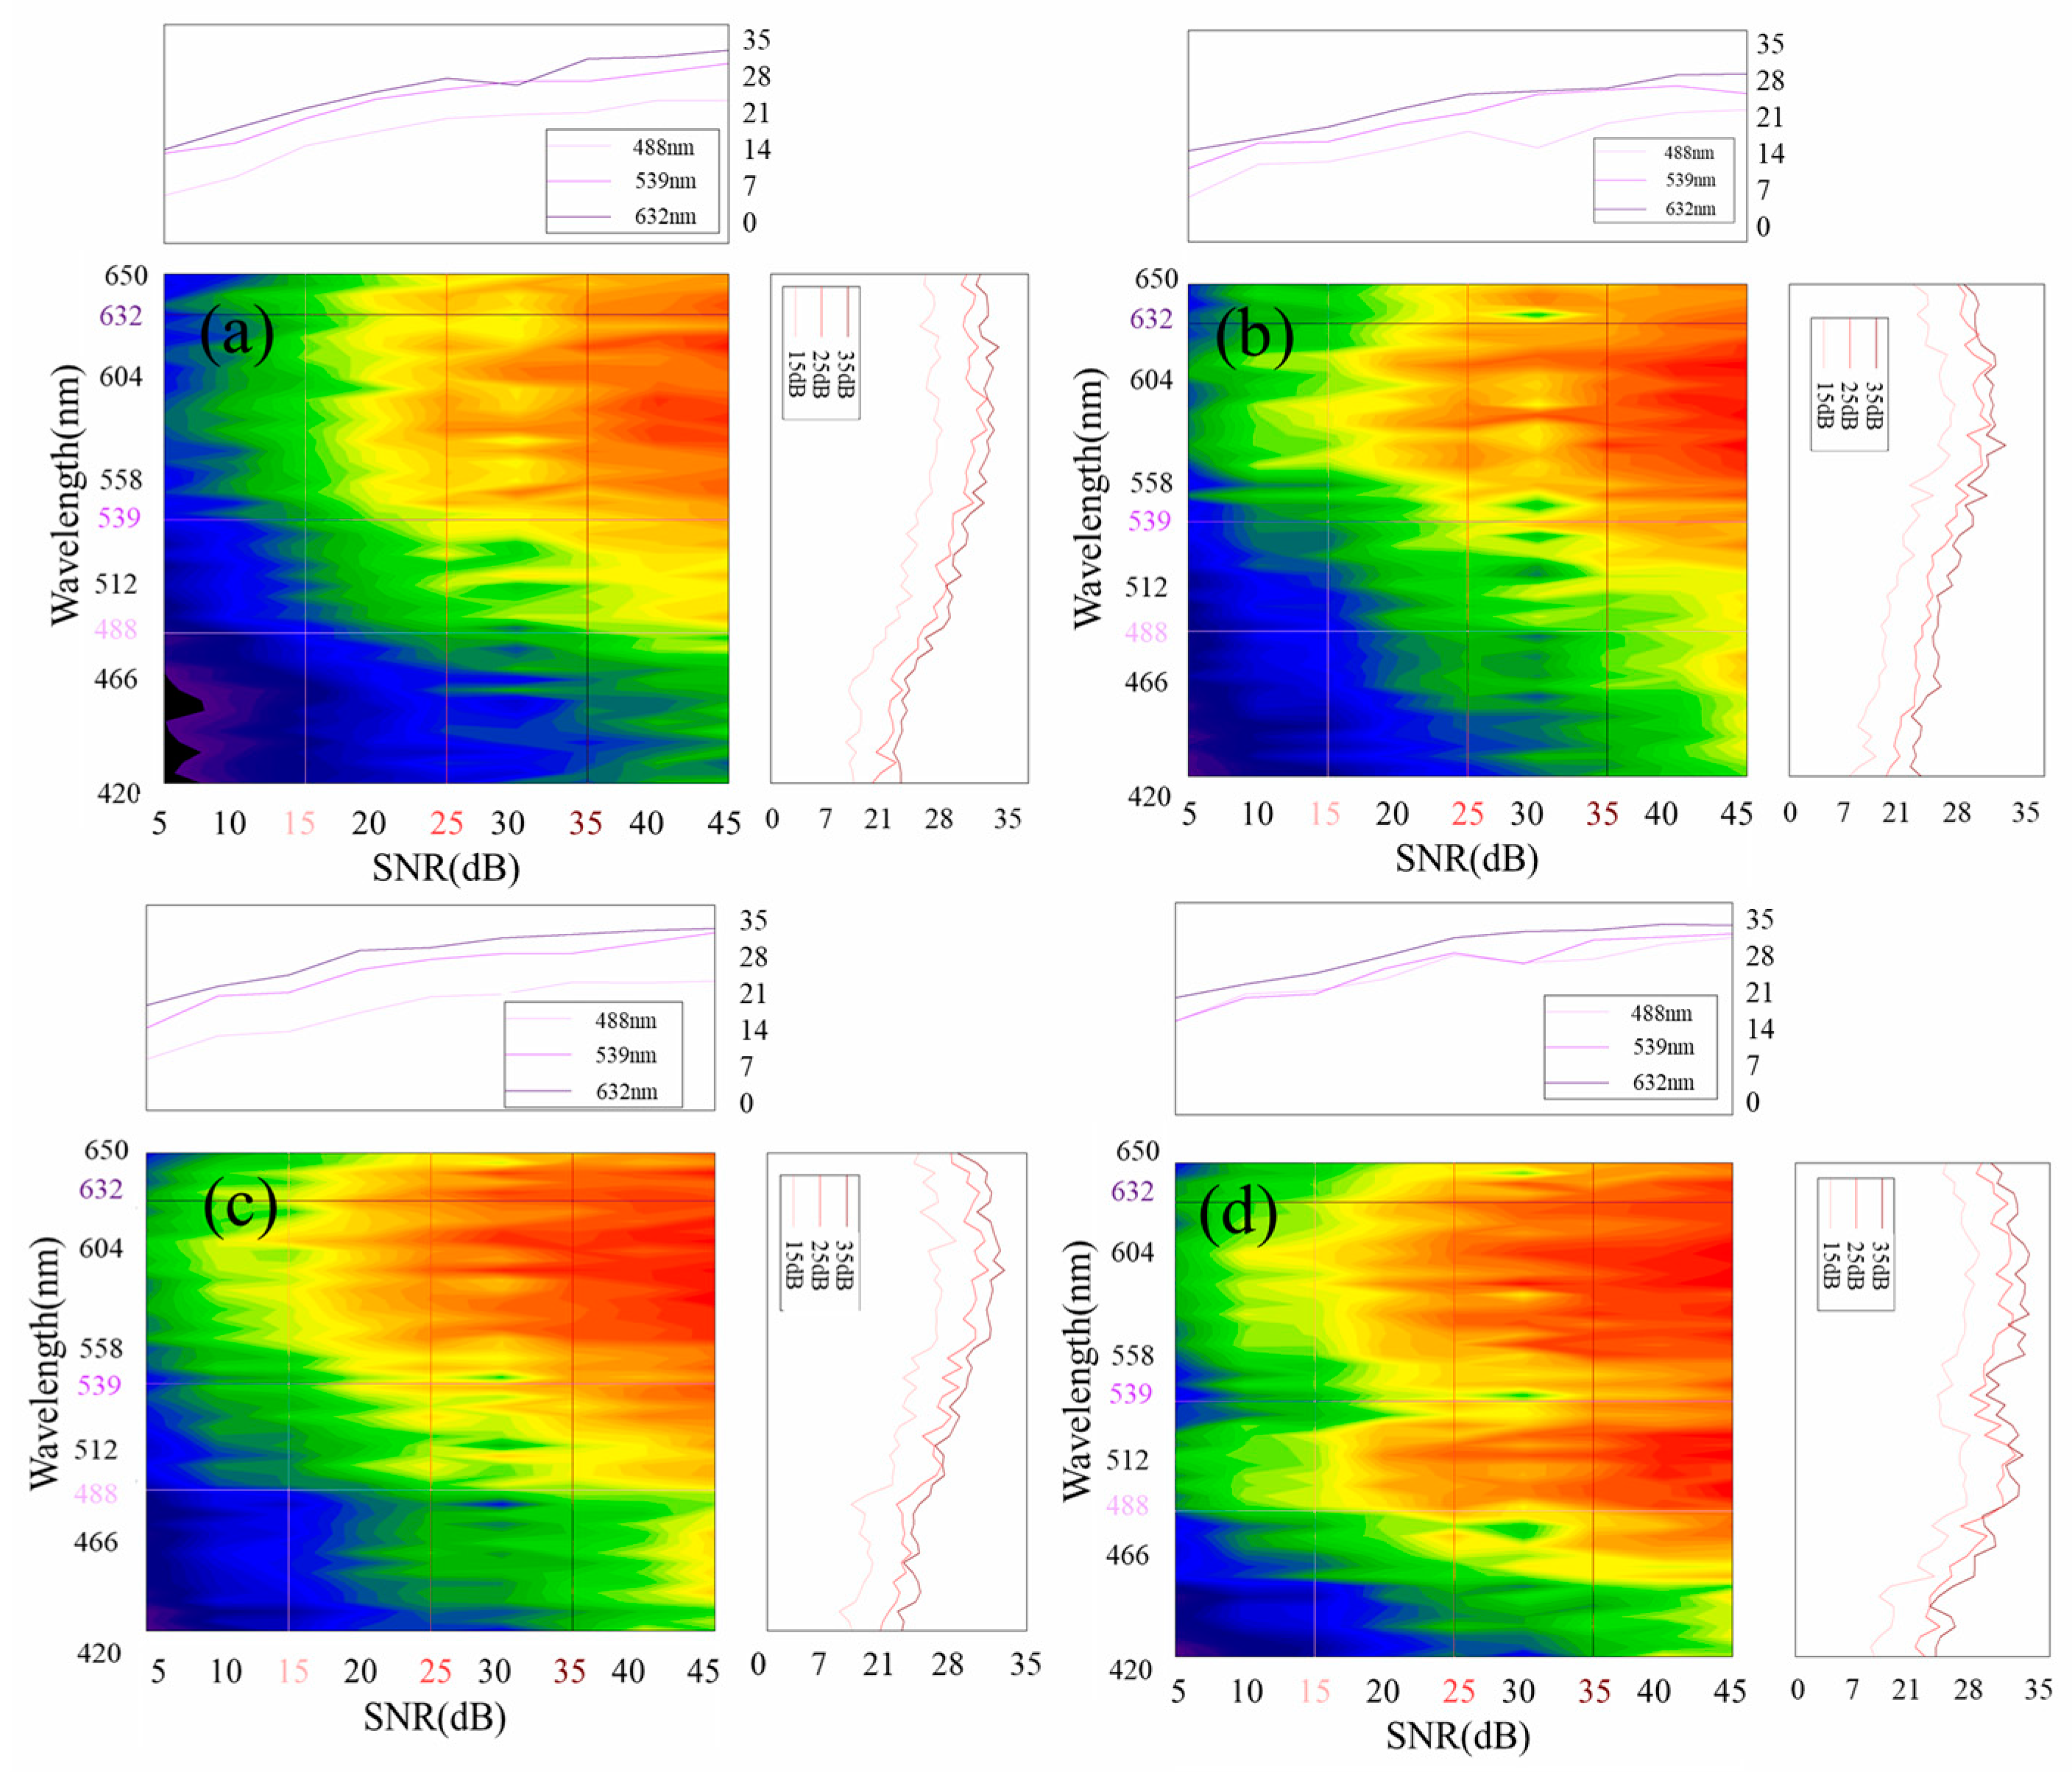
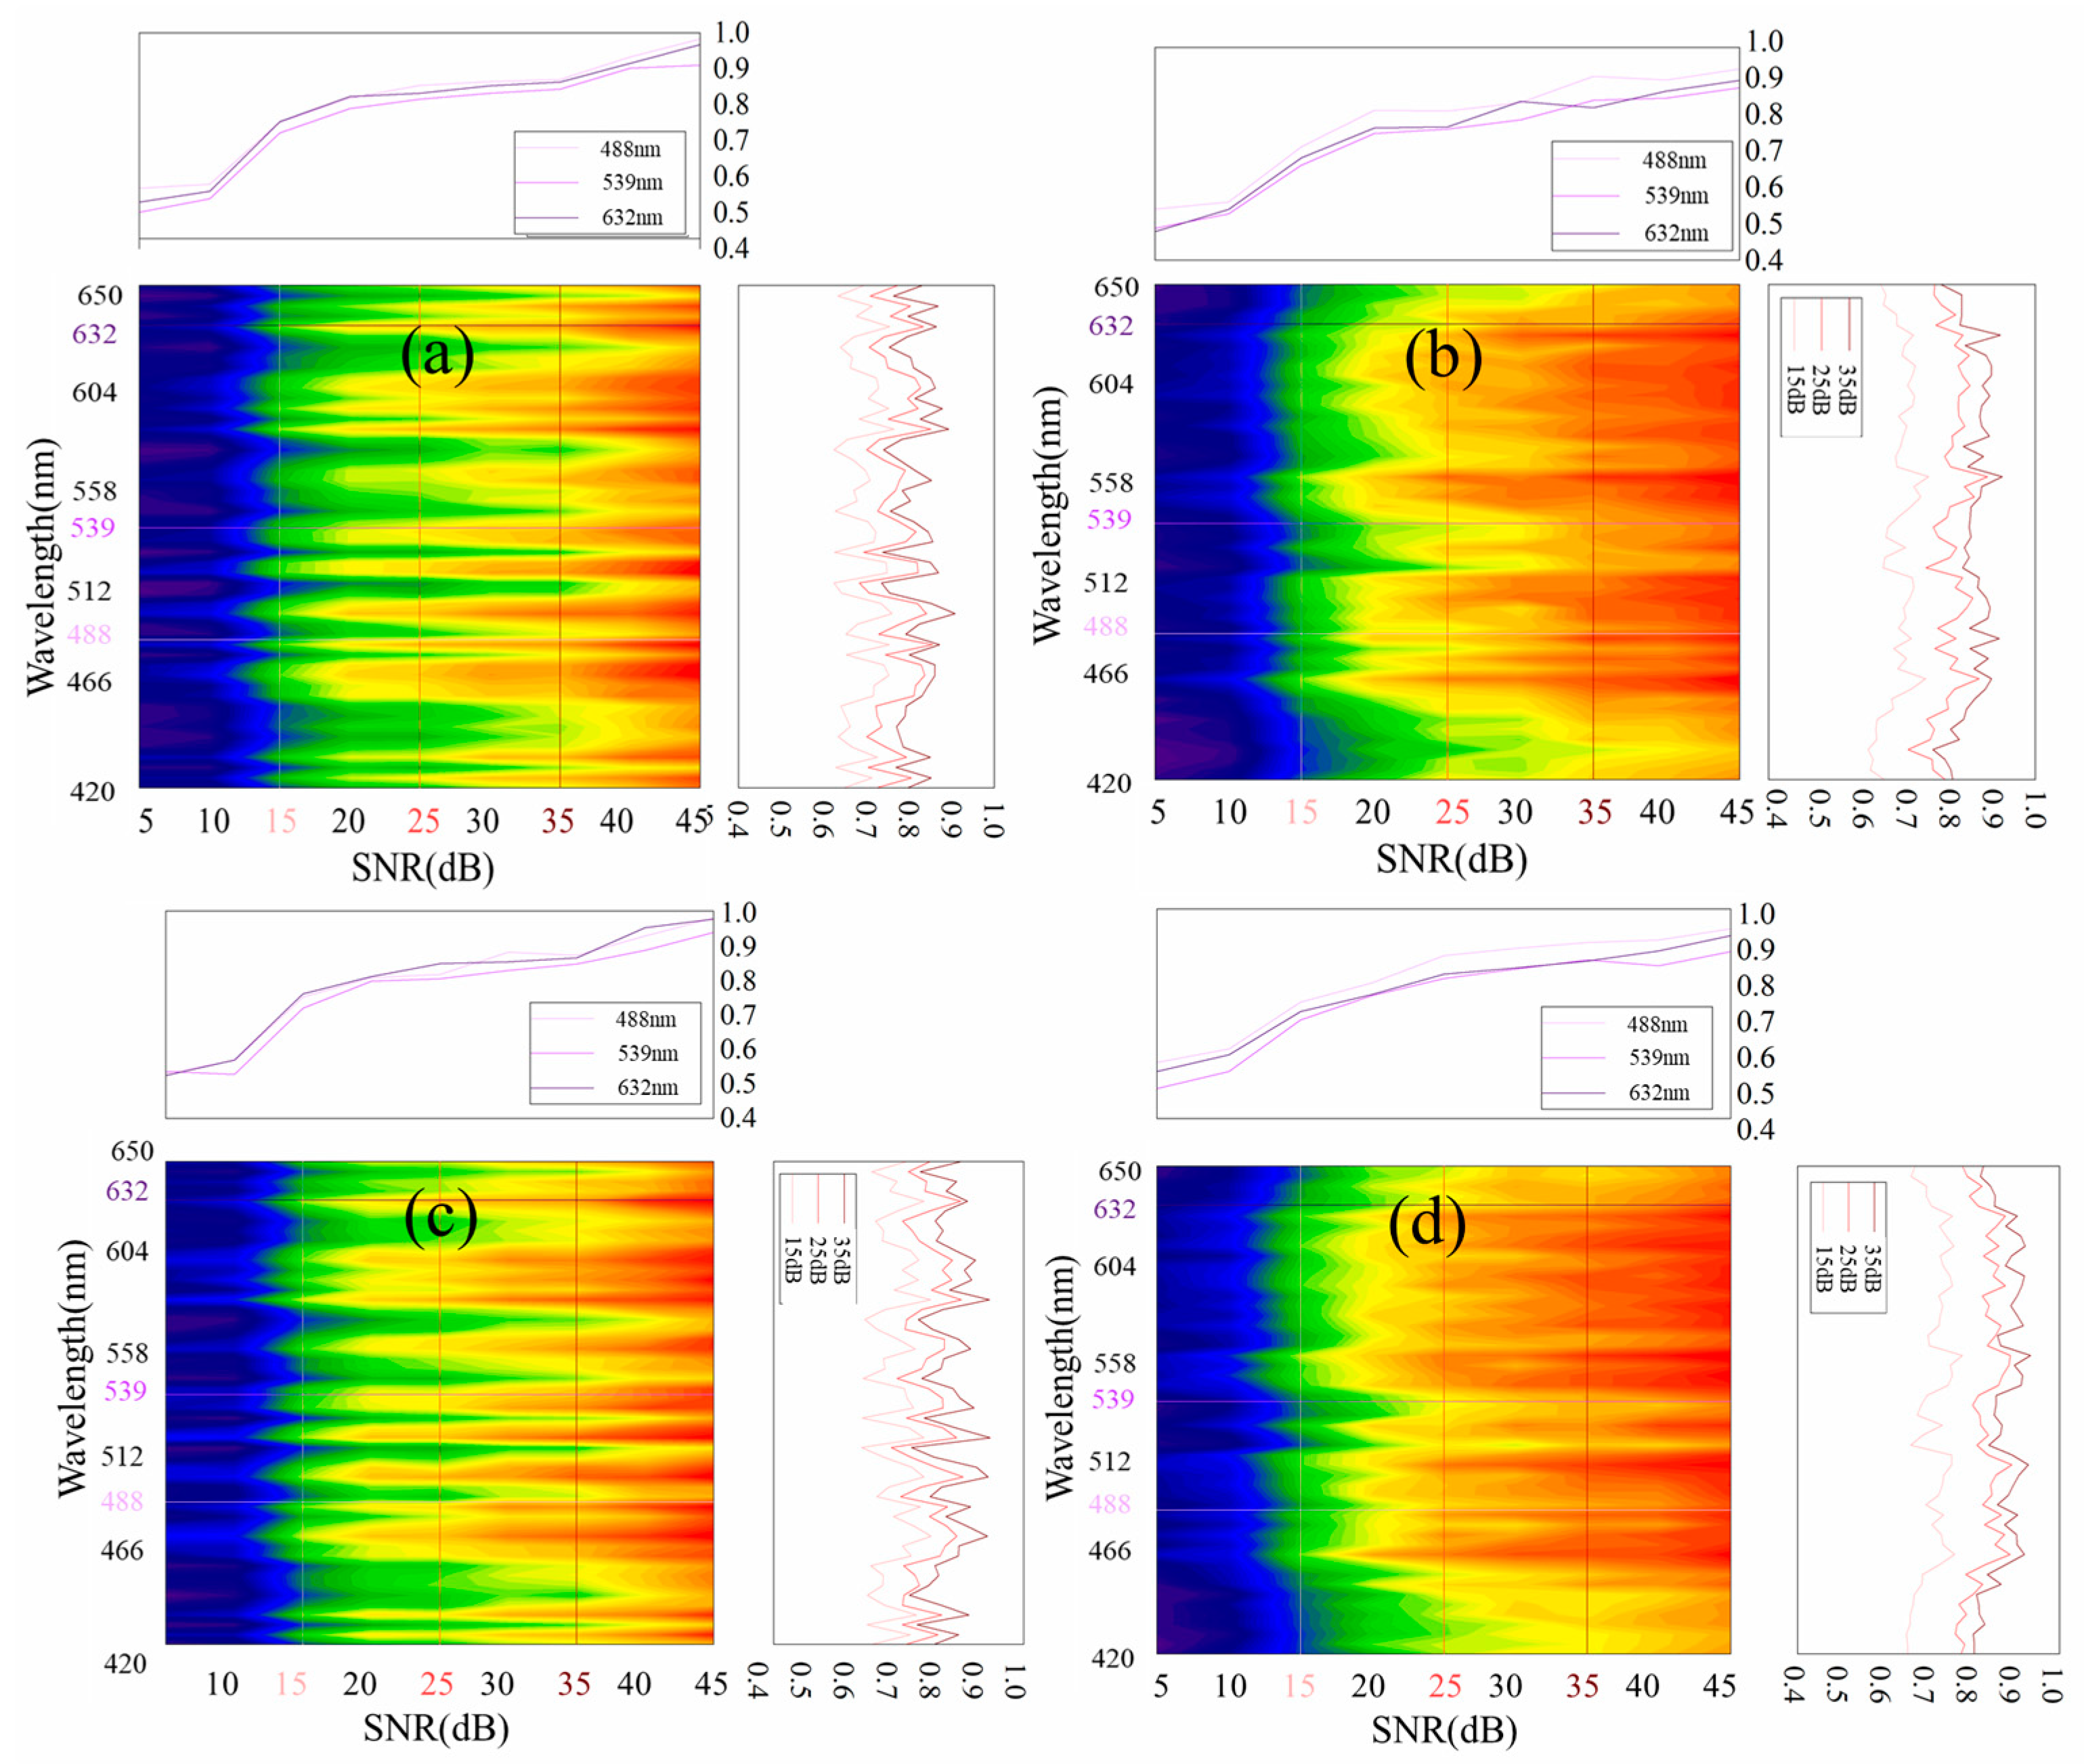
To analyze the robustness of noise, Gaussian noise was introduced into the standard image to generate contaminated images at 5 dB intervals within an SNR of 5 to 45 dB. The PSNR and SSIM for each polarization angle with  γ  = 2 and 4 are shown in Figure 10, Figure 11, Figure 12 and Figure 13. Each graph has three horizontal and vertical auxiliary lines, and the trend is shown above and to the right, where the wavelengths selected were 488, 539, and 632 nm, and SNR was selected as 15, 25, and 35 dB.
As can be seen from the overall perspective, when the SNR is greater than 25 dB, the PSNR is greater than 20 dB whether  γ = 2  or  γ = 4 . The reconstruction performance of the shorter spectral band is lower than that of the longer spectral band. The best reconstruction performance can be achieved with an SNR greater than 30 dB. When the SNR of the contaminated image is greater than 35 dB, the SSIM value is greater than 0.9 dB and the SSIM value is greater than 0.8 dB. When the image SNR of the four reconstructed polarization reaches 45 dB, their SSIMs are all close to 1 dB. When the SNR is greater than 15 dB, all the images can be effectively reconstructed.
From the PSNR corresponding to the three wavelengths, there is a slight decrease in the PSNR of  γ = 2  over  γ = 4 , but the slope is almost unchanged. It shows that the change in  γ  only affects the degraded image and does not affect the reconstruction algorithm accuracy. From the PSNR corresponding to the three SNRs, there is a large improvement from 15 to 25 dB, but the improvement becomes slow from 25 to 35 dB, which indicates that the image reconstruction quality is nonlinearly related to the image SNR after the SNR reaches a certain level. From the SSIM corresponding to the three wavelengths, curve slopes vary with different spacing and wavelengths, which indicates that the adjacent wavelengths have completely different aberrations at  γ  = 2 or  γ  = 4.

4. Discussion

For spectral polarization imaging, we propose a pixel-matching imaging structure based on DMD, PGP, and MPA detectors, building on our previous research. Based on the corresponding hardware principles of obtaining spectral data and polarization data, we introduce a new classification mode named dual-coded imaging mode. The SDSP retains the advantages of compressive imaging and uses unmixing for polarization data, eliminating the process of reconstruction using algorithms such as Fourier transform and obtaining high spatial resolution and spectral resolution.
In the experiment, data cubes with two groups of 50 spectral channels and three Stocks vectors with different linear dispersion powers were reconstructed. When the spectral curve of the object is similar to the background, the contrast of the spectral polarization reconstruction image is increased from 0.57 to 39.55, which is 68 times higher than the ground truth. The data provided at this time were selected through multiple experiments.
The overall variation of PSNR and SSIM shows that the image reconstruction quality at this time at  γ  = 2 is not as good as at  γ  = 4. With the rise in  γ , the system aberration decreases, the degraded image is closer to the ideal image, the adjacent spectra spacing channels become larger, and the focal length of the imaging lens becomes longer; thus, the reconstruction quality increases. This also indicates that the spectral smile is the main problem of system reconstruction. Therefore, a larger adjacent spectral spacing should be selected under the premise of ensuring spectral resolution and spatial resolution. Without changing the spatial resolution or structure of the imaging system, we finally conducted a comparative theoretical analysis of the results of different  γ  values, and the results are shown in Table 1.
When the spatial resolution remains unchanged at  512 × 496 , theoretical spectral channels correspond to different  γ , PSNR, and SSIM, as shown in Table 1. It can be seen that after exceeding  γ = 4 , no significant increase in PSNR or SSIM occurs. This indicates that the system is sufficient in correcting linear dispersion power at this time.
At present, the resolution of DMD is the main limiting factor for the spatial resolution of our method, which is also a problem that everyone is facing. However, our method can increase the spatial resolution to the DMD limit resolution. In terms of spectral resolution, we can increase the number of channels to 1089 through simulation, but it takes a long time to calculate, so we will start to improve the reconstruction rate based on deep learning in the future.

5. Conclusions

In summary, we proposed an image pixel-matching approach based on DMD, PGP, and MPA detectors. A coefficient  γ  is proposed to model the dispersive power and pixel matching. The relationships among  γ , the focal length of the imaging lens, and the dispersion power are given. The results indicate that the spectral imaging effect is not ideal when the target and background spectra are close, but the SDSP is still effective. The analysis shows that the system has good robustness to noise under different pixel-matching rules. The data can be effectively reconstructed when the SNR is greater than 15 dB under different matching rules.
The analysis of the imaging results of the matching rules shows that the larger the adjacent spectral spacing, the better the imaging results, and a loss of resolution occurs. From the perspective of PSNR, the changing of matching rules does not affect the accuracy of the reconstruction algorithm, and the image reconstruction quality is nonlinearly related to the image SNR after it reaches a certain level. From the perspective of SSIM, adjacent wavelengths at  γ = 2  or  γ = 4  have completely different aberrations, showing the spectral smile is the main consideration in the system reconstruction. Finally, the comparative analysis of the results in different  γ  values theoretically shows that  γ = 4  is a relatively balanced result.

Author Contributions

Conceptualization, J.W.; data curation, Q.F., C.W. and Q.W.; project administration, H.J.; visualization, Y.L. and H.L.; writing—original draft, J.W; writing—review & editing, J.W., H.S. and J.L. All authors have read and agreed to the published version of the manuscript.

Funding

This work was supported by the Jilin Provincial Department of Education Science and Technology Research Project (JJKH20230813KJ). Natural Science Foundation of Jilin Province (YDZJ202301ZYTS417). National Natural Science Foundation of China (61890960).

Institutional Review Board Statement

Not applicable.

Informed Consent Statement

Not applicable.

Data Availability Statement

Not applicable.

Acknowledgments

Our thanks go to the editors and reviewers for their efficient work.

Conflicts of Interest

Author Haiying Liu was employed by the company Northeast Industrial Group Co., Ltd. The remaining authors declare that the research was conducted in the absence of any commercial or financial relationships that can be construed as a potential conflict of interest.

References

  1. El-Habashi, A.; Bowles, J.; Foster, R.; Gray, D.; Chami, M. Polarized Observations for Advanced Atmosphere-Ocean Algorithms Using Airborne Multi-Spectral Hyper-Angular Polarimetric Imager. J. Quant. Spectrosc. Radiat. Transf. 2021, 262, 107515. [Google Scholar] [CrossRef]
  2. Qi, J.; He, C.; Elson, D.S. Real Time Complete Stokes Polarimetric Imager Based on a Linear Polarizer Array Camera for Tissue Polarimetric Imaging. Biomed. Opt. Express 2017, 8, 4933. [Google Scholar] [CrossRef] [PubMed]
  3. Feng, X.; Cherney, J.H.; Cherney, D.J.R.; Digman, M.F. Practical Considerations for Using the NeoSpectra-Scanner Handheld Near-Infrared Reflectance Spectrometer to Predict the Nutritive Value of Undried Ensiled Forage. Sensors 2023, 23, 1750. [Google Scholar] [CrossRef] [PubMed]
  4. Liu, Y.; Yang, Z.-H.; Yu, Y.-J.; Wu, L.-A.; Song, M.-Y.; Zhao, Z.-H. Chromatic-Aberration-Corrected Hyperspectral Single-Pixel Imaging. Photonics 2023, 10, 7. [Google Scholar] [CrossRef]
  5. Zhu, M.; Qi, J.; Yi, W.; Du, J.; Fu, M.; Zhu, S.; Liu, J.; Li, X. Design and Dispersion Calibration of Direct-Vision Push-Broom Compressive Double-Amici-Prism Hyperspectral Imager. Photonics 2022, 9, 732. [Google Scholar] [CrossRef]
  6. Chen, Z.; Zhang, C.; Mu, T.; Wang, Y.; He, Y.; Yan, T.; Chen, Z. Coded Aperture Full-Stokes Imaging Spectropolarimeter. Opt. Laser Technol. 2022, 150, 107946. [Google Scholar] [CrossRef]
  7. Islam, M.N.; Tahtali, M.; Pickering, M. Specular Reflection Detection and Inpainting in Transparent Object through MSPLFI. Remote Sens. 2021, 13, 455. [Google Scholar] [CrossRef]
  8. Li, S.; Jiao, J.; Wang, C. Research on Polarized Multi-Spectral System and Fusion Algorithm for Remote Sensing of Vegetation Status at Night. Remote Sens. 2021, 13, 3510. [Google Scholar] [CrossRef]
  9. Ren, S.; Wu, H.; Chen, W.; Li, D. Polarization Domain Spectrum Sensing Algorithm Based on AlexNet. Sensors 2022, 22, 8946. [Google Scholar] [CrossRef]
  10. Alouini, M.; Goudail, F.; Grisard, A.; Bourderionnet, J.; Dolfi, D.; Bénière, A.; Baarstad, I.; Løke, T.; Kaspersen, P.; Normandin, X.; et al. Near-Infrared Active Polarimetric and Multispectral Laboratory Demonstrator for Target Detection. Appl. Opt. 2009, 48, 1610. [Google Scholar] [CrossRef]
  11. Gendre, L.; Foulonneau, A.; Lapray, P.-J.; Bigué, L. Database of Polarimetric and Multispectral Images in the Visible and NIR Regions. Unconv. Opt. Imaging 2018, 10677, 666–679. [Google Scholar] [CrossRef]
  12. Tu, X.; Spires, O.J.; Tian, X.; Brock, N.; Liang, R.; Pau, S. Division of Amplitude RGB Full-Stokes Camera Using Micro-Polarizer Arrays: Erratum. Opt. Express 2018, 26, 4192. [Google Scholar] [CrossRef] [PubMed]
  13. Rehbinder, J.; Vizet, J.; Park, J.; Ossikovski, R.; Vanel, J.-C.; Nazac, A.; Pierangelo, A. Depolarization Imaging for Fast and Non-Invasive Monitoring of Cervical Microstructure Remodeling in Vivo during Pregnancy. Sci. Rep. 2022, 12. [Google Scholar] [CrossRef]
  14. Lv, X.; Li, Y.; Zhu, S.; Guo, X.; Zhang, J.; Lin, J.; Jin, P. Snapshot Spectral Polarimetric Light Field Imaging Using a Single Detector. Opt. Lett. 2020, 45, 6522. [Google Scholar] [CrossRef] [PubMed]
  15. Ono, S. Snapshot Multispectral Imaging Using a Pixel-Wise Polarization Color Image Sensor. Opt. Express 2020, 28, 34536. [Google Scholar] [CrossRef] [PubMed]
  16. Shinoda, K.; Ohtera, Y. Alignment-Free Filter Array: Snapshot Multispectral Polarization Imaging Based on a Voronoi-like Random Photonic Crystal Filter. Opt. Express 2020, 28, 38867. [Google Scholar] [CrossRef] [PubMed]
  17. Altaqui, A.; Sen, P.; Schrickx, H.; Rech, J.; Lee, J.-W.; Escuti, M.; You, W.; Kim, B.J.; Kolbas, R.; O’Connor, B.T.; et al. Mantis Shrimp–Inspired Organic Photodetector for Simultaneous Hyperspectral and Polarimetric Imaging. Sci. Adv. 2021, 7. [Google Scholar] [CrossRef]
  18. Bo, J.; Gu, Y.; Xing, W.; Ju, X.; Yan, C.; Wang, X. Spatially Modulated Snapshot Computed Tomographic Polarization Imaging Spectrometer. Appl. Opt. 2021, 60, 5860. [Google Scholar] [CrossRef]
  19. Tsai, T.-H.; Brady, D.J. Coded Aperture Snapshot Spectral Polarization Imaging. Appl. Opt. 2013, 52, 2153. [Google Scholar] [CrossRef]
  20. Chen, Z.; Zhang, C.; Mu, T.; Yan, T.; Bao, D.; Chen, Z.; He, Y. Coded Aperture Snapshot Linear-Stokes Imaging Spectropolarimeter. Opt. Commun. 2019, 450, 72–77. [Google Scholar] [CrossRef]
  21. Xu, B.; Jin, Z.; Dai, X.; Shui, C.; Zhao, Z.; Lan, Z. Pixelated polarizers array based coded aperture snapshot spectropolarimetric imaging with side information. Opt. Commun. 2022, 517, 128329. [Google Scholar] [CrossRef]
  22. Ning, J.; Xu, Z.; Wu, D.; Zhang, R.; Wang, Y.; Xie, Y.; Zhao, W.; Ren, W. Compressive Circular Polarization Snapshot Spectral Imaging. Opt. Commun. 2021, 491, 126946. [Google Scholar] [CrossRef]
  23. Wang, J.; Shi, H.; Liu, J.; Li, Y.; Fu, Q.; Wang, C.; Jiang, H. Compressive Space-Dimensional Dual-Coded Hyperspectral Polarimeter (CSDHP) and Interactive Design Method. Opt. Express 2023, 31, 9886. [Google Scholar] [CrossRef] [PubMed]
  24. Chipman, R.A.; Sze, W.; Young, G. Polarized Light and Optical Systems, 1st ed.; CRC Press: Boca Raton, FL, USA, 2018; p. 64. ISBN 9781498700573. [Google Scholar]
  25. Bioucas-Dias, J.M.; Figueiredo, M.A.T. A New TwIST: Two-Step Iterative Shrinkage/Thresholding Algorithms for Image Restoration. IEEE Trans. Image Process. 2007, 16, 2992–3004. [Google Scholar] [CrossRef]
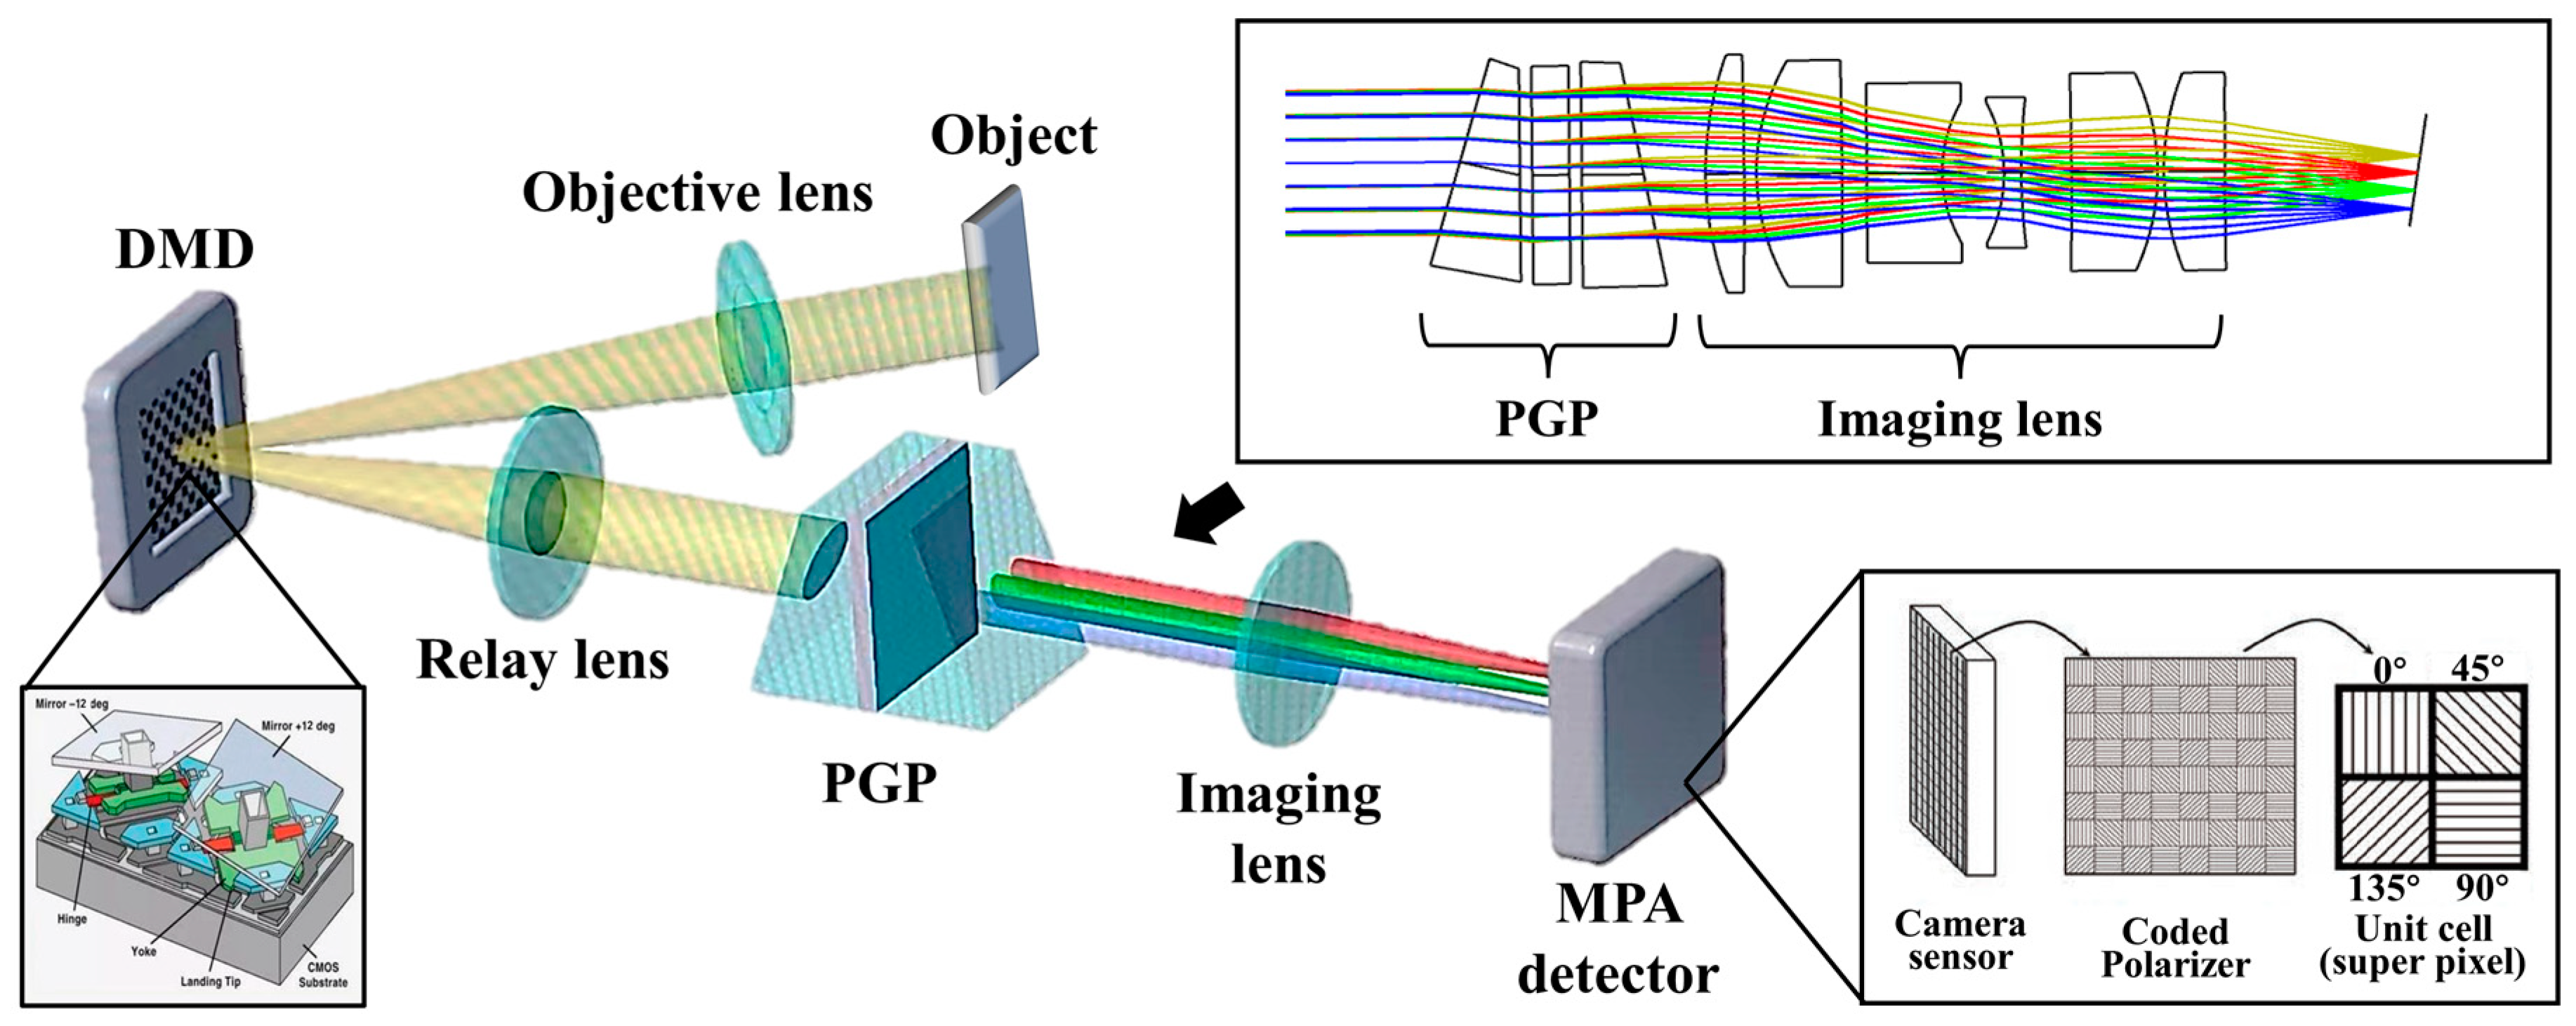
Figure 1. Schematic of SDSP.
Photonics 10 00632 g001
Figure 2. Schematic diagram of pixel matching, unmixing, and reconstruction.
Photonics 10 00632 g002
Figure 3. Optimization process of adjacent spectral spacing.
Photonics 10 00632 g003
Figure 4. Distance of linear dispersion power (a γ = 2  and (b γ = 4 .
Photonics 10 00632 g004
Figure 5. The relationships among the angular dispersion of the PGP, the focal length of the imaging lens, and  γ .
Photonics 10 00632 g005
Figure 6. System desktop experiment.
Photonics 10 00632 g006
Figure 7. Experimental preparation: (a) appearance and material introduction of “CUST” letters; (b) ground truth.
Photonics 10 00632 g007
Figure 8. Spectral polarization images of CUST letters with  γ = 4 : (a) 0°, (b) 45°, (c) 90°, (d) 135°, (e) DOLP, (f) 135° @ 539 nm, and (g) DOLP @ 539 nm.
Photonics 10 00632 g008
Figure 9. Spectral polarization images of CUST letters with  γ = 2 : (a) 0°, (b) 45°, (c) 90°, (d) 135°, (e) DOLP, (f) 135° @ 539 nm, and (g) DOLP @ 539 nm.
Photonics 10 00632 g009
Figure 10. The relationships among PSNR, wavelength, and SNR at  γ  = 4: (a) 0°, (b) 45°, (c) 90°, and (d) 135°.
Photonics 10 00632 g010
Figure 11. The relationships among PSNR, wavelength, and SNR at  γ  = 2: (a) 0°, (b) 45°, (c) 90°, and (d) 135°.
Photonics 10 00632 g011
Figure 12. The relationships among SSIM, wavelength, and SNR at  γ  = 4: (a) 0°, (b) 45°, (c) 90°, and (d) 135°.
Photonics 10 00632 g012
Figure 13. The relationships among SSIM, wavelength and SNR at  γ  = 2: (a) 0°, (b) 45°, (c) 90°, and (d) 135°.
Photonics 10 00632 g013
Table 1. Relationships among  γ  and main indicators of the system.
  γ Spatial ResolutionSpectral Channels
Theoretically
PSNR (dB)SSIM (dB)
2   512 × 496 108926.43260.8163
4   512 × 496 54528.95190.9256
6   512 × 496 36329.14490.9317
8   512 × 496 27329.24260.9343
10   512 × 496 21729.29300.9360
Disclaimer/Publisher’s Note: The statements, opinions and data contained in all publications are solely those of the individual author(s) and contributor(s) and not of MDPI and/or the editor(s). MDPI and/or the editor(s) disclaim responsibility for any injury to people or property resulting from any ideas, methods, instructions or products referred to in the content.