Article

Rapid Correction of Turbidity and CDOM Interference on Three-Dimensional Fluorescence Spectra of Live Algae Based on Deep Learning

1
Ocean College, Zhejiang University, Zhoushan 316021, China
2
Hainan Institute of Zhejiang University, Sanya 572025, China
3
The Engineering Research Center of Oceanic Sensing Technology and Equipment, Ministry of Education, Zhoushan 316021, China
*
Author to whom correspondence should be addressed.
Photonics 2023, 10(6), 627; https://doi.org/10.3390/photonics10060627
Submission received: 20 April 2023 / Revised: 23 May 2023 / Accepted: 26 May 2023 / Published: 29 May 2023

Abstract

:
In natural aquatic environments, the existence of colored dissolved organic matter (CDOM), suspended particles, and colloids can cause scattering and reflection of light and even emit fluorescence itself. Such interference negatively impacts algal fluorescence, further making it unreliable to measure the algal concentration using three-dimensional excitation–emission matrix (3D-EEM) fluorescence spectroscopy. In this study, we proposed a novel algal fluorescence anti-interference network (AFAI-Net) based on a convolutional neural network. The main procedure of this model can be divided into two parts: (1) to quickly determine if there is an interference of CDOM or turbidity in the detected algal samples; (2) to correct the interfered samples and output the fluorescent components of the algae. We trained the model using the 3D-EEMs of pure algal samples (non-interfered) and mixed samples of algae and CDOM or turbidity (interfered); as a result, the well-trained model achieved a total classification accuracy of 96.82%, and the RMSE of CDOM and turbidity removal fitting effects were 0.2274 and 0.3423, respectively. Compared with the non-negative weighted least squares (NNLS) regression analysis method, using the CNN model for CDOM correction resulted in 13.11%, 0.65%, and 5.69% reductions in the average deviation rate for PD, PG, and CM, respectively. Furthermore, the spectra corrected by the model predicted algal densities that were closer to the true algal densities. This study provides a new way to remove non-algal factors that affect algal fluorescence spectra in water bodies, which is beneficial to monitoring eutrophication and red tide in aquatic systems.

1. Introduction

Phytoplankton serves as a fundamental source of energy for the aquatic ecosystem, driving the entire biogeochemical cycle [1], and concurrently serves as an extensive biomarker of water quality [2]. The changes in phytoplankton biomass directly reflect the water quality of the upper aquatic system [3]. Therefore, the real-time monitoring of algae is of notable importance. Although traditional methods such as microscopic examination and high-performance liquid chromatography (HPLC) [4,5] guarantee a high detection accuracy, they also entail prolonged sample analyses. Fluorescence spectroscopy yields fast measurement speeds, noninvasive detection, and high sensitivity, circumventing the requirement of cell disruption or the pretreatment of samples. This enables the effective real-time measurement of fluorescence emitted by phytoplankton in water and has been extensively employed in determining the community distributions of phytoplankton [6,7,8,9].
However, in complex natural aquatic environments, apart from the target algae species, there are also other substances such as colored dissolved organic matter (CDOM), suspended particles, and colloids [10,11], which significantly affect the algal fluorescence measurements. The types of CDOM can be divided into endogenous and exogenous. Endogenous CDOM originates primarily from the derivatives of phytoplankton, submerged aquatic vegetation, and seaweed [12,13], while tannins generated by terrestrial organisms and human activities represent exogenous CDOM [14]. CDOM absorbs both UV light (280–400 nm) and visible light (400–700 nm), thereby impeding the absorption of visible light by phytoplankton [15], while also emitting fluorescence that results in overestimations of algal concentrations in water [16,17,18]. Furthermore, suspended particles and colloids present in water may impact the incident light and emitted fluorescence due to a number of factors including scattering, reflection, and absorption effects [19]. Generally, suspended particles are non-fluorescent, but can cause extinction in the fluorescent band of the excitation light, resulting in low fluorescence measurement values. These particles also scatter and reflect both incident light and emitted fluorescence, causing fluctuations in the fluorescent signal strength. These interferences are extremely strong when the algae are in relatively lower concentrations [20,21,22].
Hence, it is imperative to eliminate the intervention of non-algal components, such as CDOM and turbidity, while determining algal fluorescence spectra. Zhang et al. [23] discovered that the fluorescence domain of CDOM partially overlaps with that of algal pigments. By integrating three-dimensional fluorescence spectra with non-negative weighted least squares linear regression analysis, they established a rapid and precise technique for calculating phytoplankton concentrations, even amid CDOM interference. Li et al. [24] utilized a linear CCD as the detector and incorporated optical information from fluorescence and absorbance. They presented a turbidity compensation algorithm that relies on a CCD integration time conversion method, thereby mitigating measurement errors related to the concentration of chlorophyll-a. Recently, CNN-based deep learning has emerged as a powerful approach for processing image data. CNN facilitates the automatic extraction of deep features from images, thereby obviating the laborious task of manual feature extraction [25]. The three-dimensional fluorescence spectra (3D-EEMs) utilized for detecting algae fluorescence share similarities with the “fluorescence fingerprint” recognition of algal pigments [26]. It embodies excitation wavelength × emission wavelength × fluorescence intensity and conforms to the same architecture as gray image data (i.e., height × width × gray value). Wu et al. [27] implemented the pre-trained CNN architecture, AlexNet, to extract deep features of plant oil fluorescence contour maps. They subsequently employed the SVM and PLS algorithms to accurately identify counterfeit sesame oil. Xu et al. [28] developed the fast fluorescence identification network model (FFI-Net) based on deep learning approaches and amalgamated PARAFAC analysis results. This method only requires a single 3D-EEM spectrum input to promptly predict the quantity and spectrum of fluorescent substances in wastewater.
Therefore, we proposed a CNN-CNN structured model, namely, the algae fluorescence anti-interference network (AFAI-Net), to quickly identify and extract pure algae fluorescence components from 3D-EEM spectra of samples. Initially, three typical species of red tide algae, the HA (CDOM), and formazine (turbidity) solutions were prepared and their 3D-EEMs were scanned. These samples were then used to train the AFAI-Net model and evaluate its testing performance. Furthermore, a comparison was conducted between the AFAI-Net model and the conventional non-negative linear least squares (NNLS) method to evaluate the efficacy of the AFAI-Net model in eliminating CDOM’s influence. By employing the pre-trained AFAI-Net model, water samples with CDOM or turbidity interference can be promptly identified by uploading 3D-EEM. Furthermore, the three-dimensional fluorescence spectra of pure algae components can be accurately fitted. This study presents a novel approach for mitigating the impact of non-algal factors on algae fluorescence spectra in water bodies, which can aid in monitoring eutrophication and red tide.

2. Materials and Methods

2.1. Algal Cultivation

Three species of typical red tide algae, each of varying size, were isolated from the east China coast and cultivated in a medium at 20 °C, with a salinity of 30 ppt (Table 1). The light intensity was adjusted to 102 µmol/(m2·s), which is close to the light level in the sub-surface layer of the ocean. Cells at the exponential growth stage were collected, and the density of the cells was measured using a 100× microscope in a Sedgewick–Rafter chamber. The designed concentrations of the algal samples for the experiment ranged from 105 cells/L (102 cells/mL) to 108 cells/L (105 cells/mL).

2.2. Sample Preparation

In this study, a series of turbidity samples with different concentrations (0–50 NTU) were prepared by diluting standard formazine solution (initial turbidity: 400 NTU) with ultrapure water [29]. As the main fluorescence peak of humic acid is closer to the visible region of CDOM fluorescence and humic acid (HA) is also the main component of CDOM [23], the experimental CDOM samples were prepared through dissolving HA powder with different volumes of ultrapure water. Then, different concentrations (0–5 mg/L) of CDOM solution were obtained.
After obtaining standard turbidity samples (0–50 NTU) and CDOM samples (0–5 mg/L) with different gradients, three species of red tide algae from three different phyla, including Prorocentrum donghaiense (PD), Phaeocystis globose (PG) and Chattonella marinacm (CM), were selected from the laboratory. They were added to different concentrations of standard turbidity or CDOM samples in equal volumes under the condition that their chlorophyll-a concentrations were approximately the same. This formed mixed samples with turbidity and CDOM (the algal density was known). In addition, pure samples of the three red tide algae were also prepared. A total of 630 experimental samples were studied (Table 2).

2.3. Fluorescence Measurement and Data Pre-Processing

The 3D fluorescence spectra of all the samples were measured using a 3D fluorescence spectrophotometer (F-4600 fluorescence spectrophotometer, Hitachi, Japan). The excitation wavelength range of the algal samples was 350–600 nm with an interval of 5 nm, and the emission wavelength range was 620–750 nm with the same interval. The excitation and emission slits were both set to 10 nm, and the voltage of PMT was set to 400 V.
To suppress noise interference, each sample was measured three times in parallel, and the average of these spectral data was taken as the raw 3D fluorescence spectrum data of the experimental samples (Figure 1a). The obtained data were exported from the instrument’s software in ASCII format to a MATLAB program for further processing.
The Delaunay triangulation method [30] was used to eliminate Rayleigh and Raman scattering from the 3D fluorescence spectra of the samples (Figure 1b). Furthermore, any negative values present in the data were set to zero before any additional spectral analyses were carried out. Due to the pure algal fluorescence spectra being used as the target map for model fitting, the noise level of the 3D-EEMs was further reduced by smoothing the spectral data using a Savitzky–Golay filter to reduce random noise [31] (Figure 1c). To facilitate feature extraction for subsequent CNN models, all the 3D-EEM spectra were preprocessed into a uniform format (Figure 1d). All the 3D-EEM spectra were preprocessed by the MATLAB program to form target-sized spectra containing algal fluorescence peaks (Ex: 400–530 nm, interval: 5 nm; Em: 620–750 nm, interval: 5 nm).

2.4. AFAI-Net Model Establishment Based on Deep Convolutional Neural Network

In this study, an algal fluorescence anti-interference network (AFAI-Net) model based on deep CNN was proposed. First, a CNN classification recognition network was introduced into the model to determine whether the inputted 3D fluorescence spectra of testing samples were interfered with and to classify their types. As shown in Figure 2, it is named the convolutional neural network for quick classification (QCNN), with the output labels of 0, 1, and 2, which correspond to non-interfered, CDOM-interfered, and turbidity-interfered, respectively. In the QCNN model, we represented the excitation and emission wavelengths of the inputted 3D-EEM spectra as pixel positions, with the fluorescence intensity at each Ex/Em wavelength set as the channel value. This allowed us to treat the data of the 3D-EEM spectra as image-like, with dimensions of height × width × channel equal to 27 × 27 × 1. The QCNN architecture comprised two 2D convolutional layers and two 2D max-pooling layers. We utilized the ReLU activation function for both the convolutional and max-pooling layers, and we flattened the resulting feature maps into one dimension to facilitate their connection to the fully connected (FC) layers. To prevent overfitting, we incorporated dropout on the first two FC layers. The softmax function was employed as the activation function of the output layer for classification, while the cross-entropy function was used as the loss function of the QCNN. To optimize the model’s performance, we used the Adam optimizer.
After determining the type of testing sample by model, the second CNN model was called to obtain the interference-corrected algal fluorescence spectrum, which was named the convolutional neural network to eliminate interference (ECNN) here. The ECNN model included the ECNN-Tur model (for turbidity mixed sample) and the ECNN-CDOM model (for CDOM mixed sample), where the input was the same as that for the FCNN, and the output was a vector of length 729, which could be integrated into a matrix of size 27 × 27. The ECNN network consisted of three 2D convolutional layers, two 2D max-pooling layers, and two fully connected layers, as shown in Figure 3.
The cosine similarity index (SI) [32] was introduced to compare the corrected spectra with the interfered spectra, defined as follows
S I = 1 2 π × a r c c o s A 1 · A 2 | A 1 | · | A 2 | ,
where A 1 and A 2 represent the spectral vectors of the two algal species. In essence, the SI depends on the angle between the two matrix vectors. As such, higher spectral similarities result in smaller matrix angles, and consequently, the closer the SI value is to 1.
In conclusion, the AFAI-Net model procedure consists of three stages: pre-processing of the spectra, classification of the type of fluorescence spectrum and correction of interfered algal fluorescence spectrum. Firstly, a new 3D-EEM spectrum was input into the QCNN model to determine whether it contained turbidity or CDOM interference. Then, if the output of the QCNN model was 1, this indicated the presence of CDOM interference. Then, the 3D-EEM spectrum was input into the ECNN-CDOM model to obtain the new spectrum with CDOM interference removed. Correspondingly, if the output of the QCNN model was 2, the ECNN-Tur model would be called to obtain the EEMs after turbidity interference was removed.

3. Results and Discussion

3.1. Characteristics of the 3D-EEMs Data

All photosynthetic organisms contain chlorophyll a, which absorbs blue light, as well as additional pigments such as carotenoids, phycobiliproteins, or accessory chlorophylls (Chl b or Chl c), which absorb light of other wavelengths. Based on the composition of these pigments, different types of phytoplankton absorb light of different wavelengths, resulting in the formation of characteristic EEMs for each algal class [33].
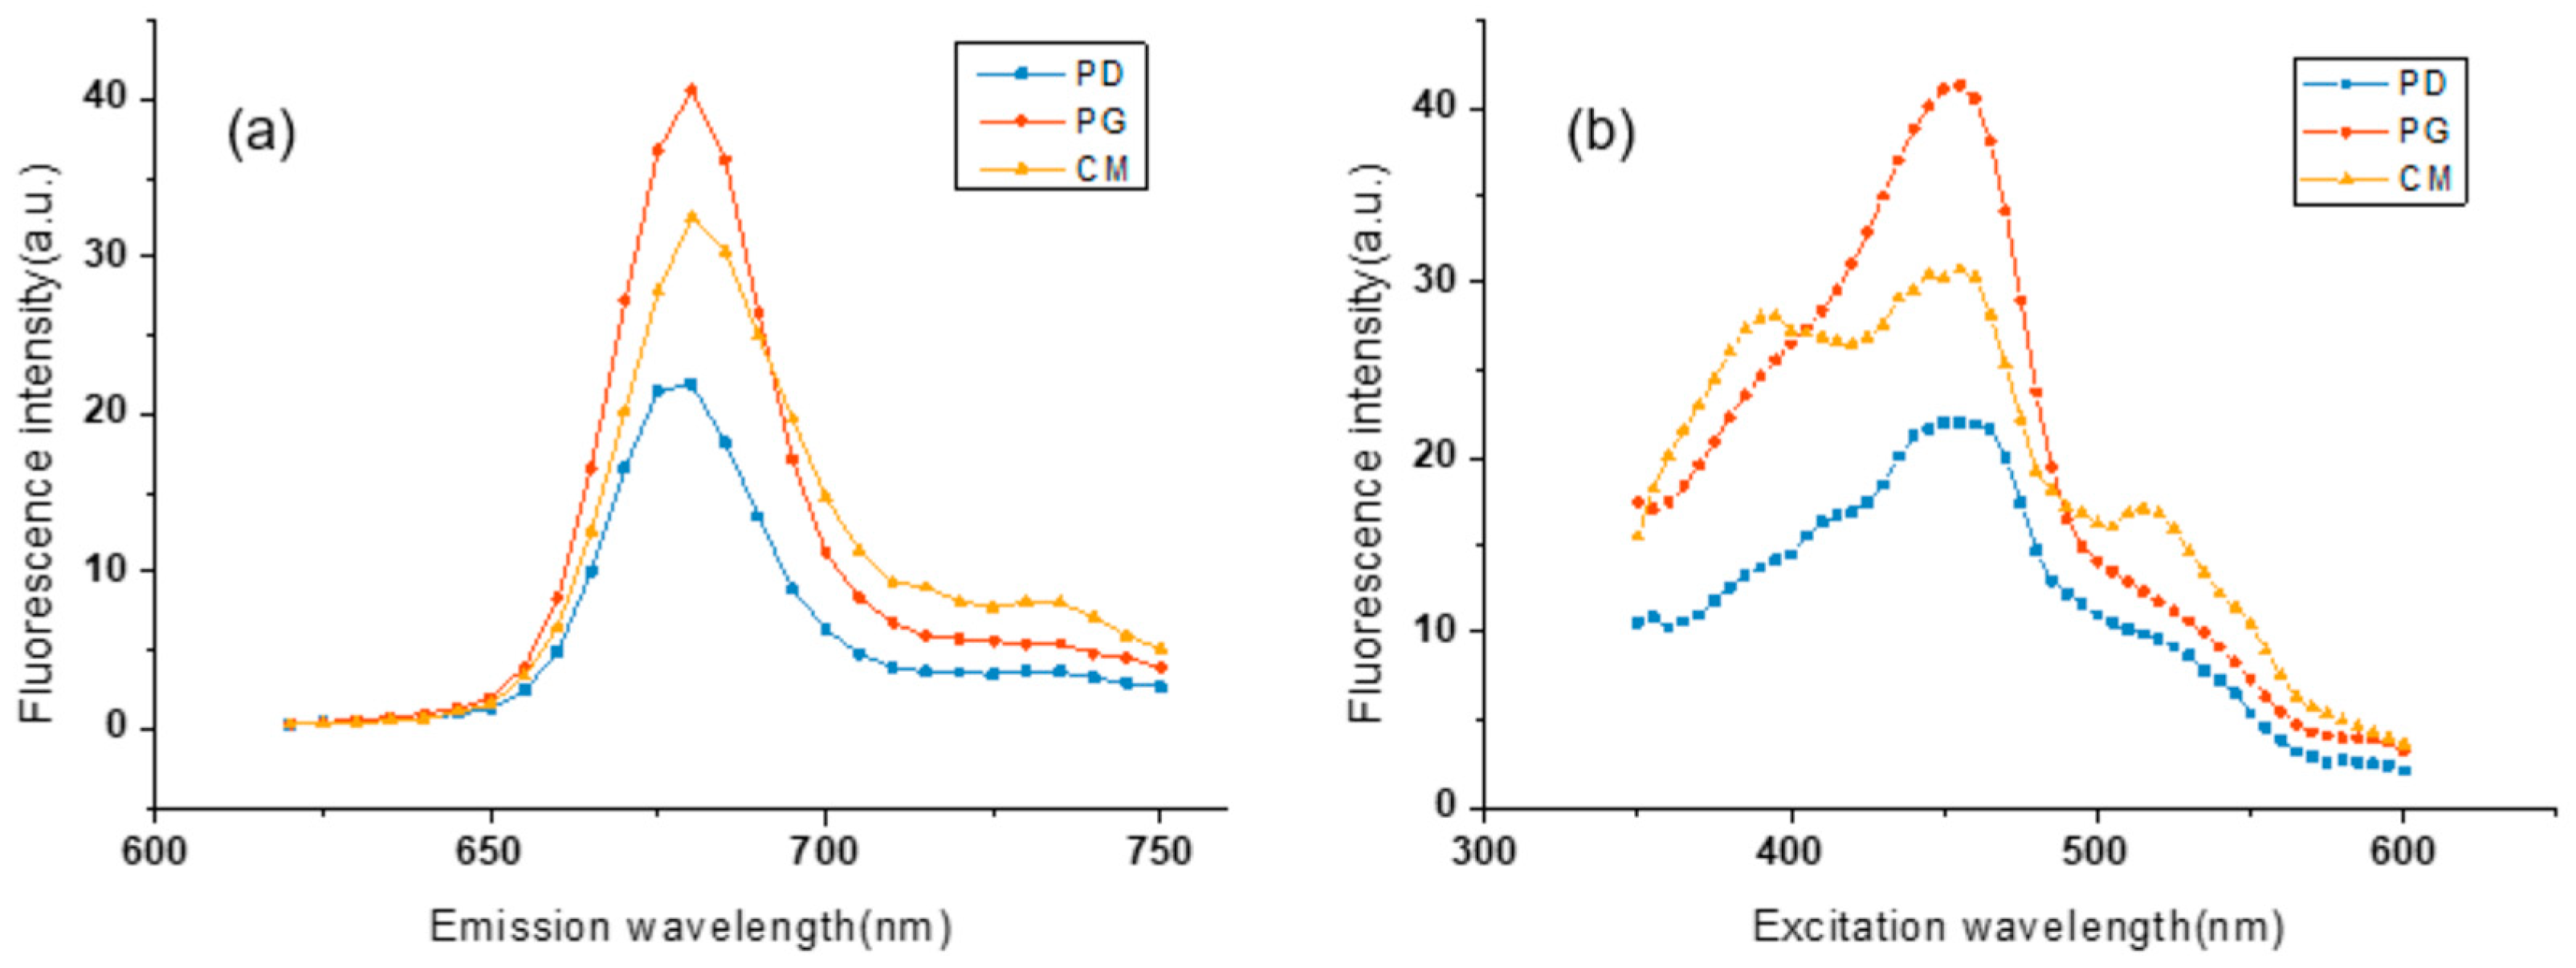
The optimal excitation and emission wavelengths for different algae depend on the type of algae and the type of pigment they contain. Figure 4a illustrates the emission spectra of three different concentrations of the red tide algae (PD, PG, and CM) at an excitation wavelength of 460 nm, and Figure 4b displays the excitation spectra of these three algae at an emission wavelength of 680 nm. The emission spectra of these algae are similar in shape and have a peak at around 680 nm, while the excitation spectra have a peak at around 460 nm, which corresponds to the optimal excitation and emission wavelengths of chlorophyll a, respectively. These results are consistent with those of previous studies on EEM measurements of algal samples [34,35]. Therefore, the EEMs in the excitation wavelength range of 400–530 nm and emission wavelength range of 620–750 nm used in our experiment can provide specific information about the photosynthetic activity of algae.
CDOM and turbidity can have a significant impact on the 3D fluorescence spectra of microalgae. As shown in Figure 5a,b, adding CDOM to the PG algal suspension altered the spectral shape and width, and significantly decreased the fluorescence peak intensity of PG. This is primarily because CDOM selectively absorbs certain fluorescence wavelengths, causing changes in the relative strength of different spectral bands and quenching the fluorescence of the algae by absorbing and dissipating the excitation light energy. Furthermore, turbidity can cause absorption and scattering of the excitation light, and as the turbidity increases, the intensity of the algal fluorescence peak diminishes substantially. By comparing Figure 5a,c, it is evident that the presence of suspended particles caused a significant reduction in the fluorescence peak intensity of PG algal samples, and this change is particularly distinct.

3.2. Training and Evaluation of the AFAI-Net Model

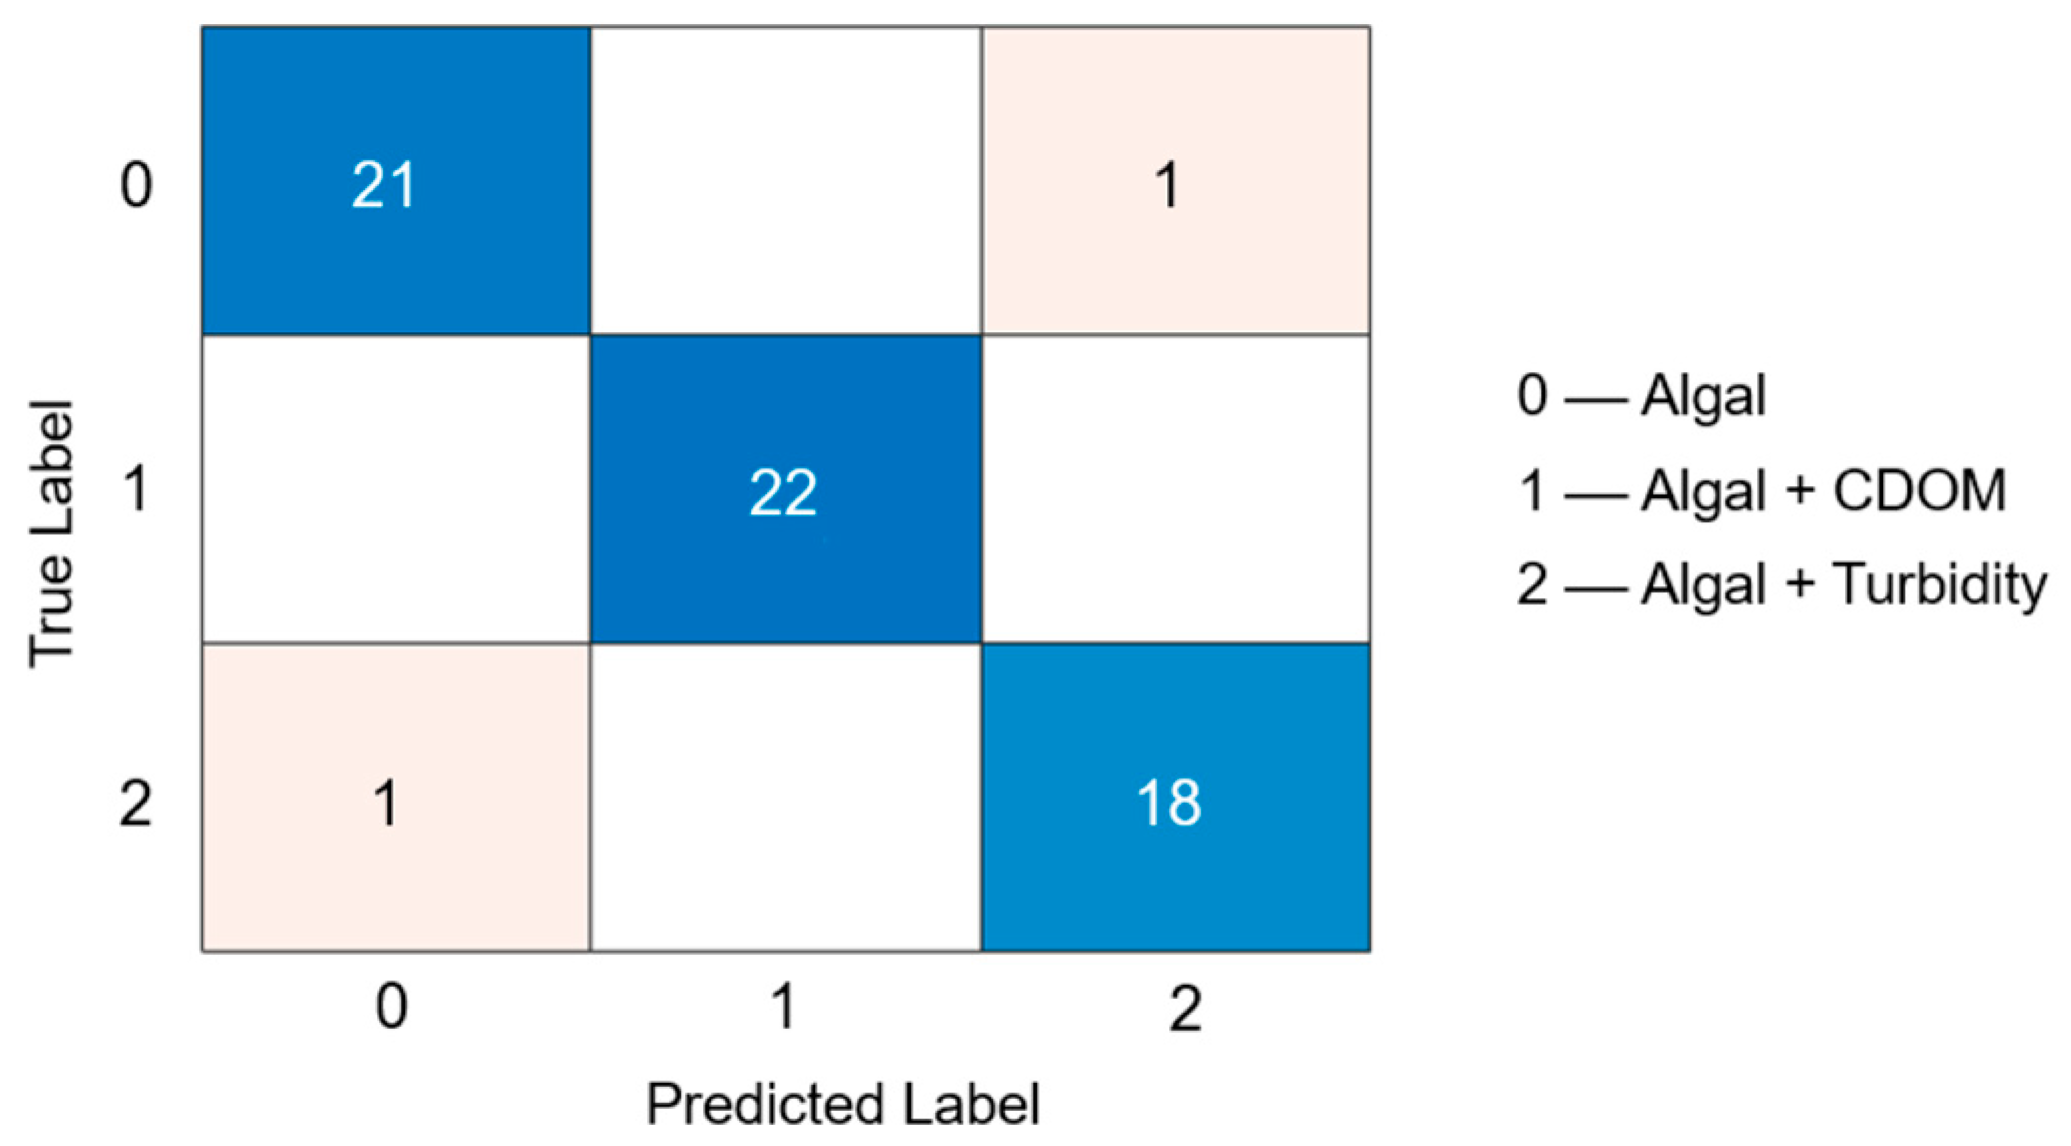
The training and validation datasets for the FCNN model consisted of 567 samples, and the test dataset contained 63 samples, with a ratio of 8:1:1. Before training, the hyperparameters were adjusted to optimize the performance of the model. The Adam optimizer was used, with an initial learning rate of 0.001. The network was trained for 90 epochs with a batch size of 24, and the learning rate was reduced by a factor of 0.1 every 20 epochs. The loss function used was categorical cross-entropy, and the accuracy and loss of the training and validation sets were monitored. Early stopping was used to prevent overfitting, with the validation accuracy monitored. If no improvement was observed after 10 epochs, training was stopped. During training, both the training loss and validation loss gradually decreased, with the training loss stabilizing after 70 epochs. The QCNN model achieved a final test accuracy of 96.82%. According to the confusion matrix shown in Figure 6, the QCNN accurately identified the presence of turbidity interference but made mistakes when differentiating the presence of CDOM interference, which may have been due to the low CDOM concentration (0.25 mg/L), resulting in minimal interference and making it difficult for the model to make accurate judgments. These results indicate that the QCNN model can learn the fluorescence characteristic information and the intrinsic relationship between interference types in 3D-EEM spectra.
We used the ECNN model to fit pure algal fluorescence spectra that were free from interference based on different 3D-EEM datasets. The ECNN model consisted of two models, the ECNN-Tur model and the ECNN-CDOM model. The ECNN-Tur model removes turbidity interference from algal 3D-EEMs, and the ECNN-CDOM model removes CDOM interference from algal 3D-EEMs. During training, the original 3D-EEM maps were normalized by the maximum value and fed into the model. The output of the model was a vector with a length of 729, which can be reshaped into a 27 × 27 matrix (3D-EEM map).
RMSE was used to calculate the error between the fluorescence intensities of the output spectra and the target spectra, but it ignored the correlation between the fluorescence intensities of consecutive excitation wavelengths and emission wavelengths, making it less sensitive to the structural information of the spectra. Therefore, in addition to the traditional root mean square error (RMSE), we introduced the structural similarity index (SSIM) and cosine similarity index (SI) to evaluate the accuracy of the model’s fitting results to the target fluorescence spectra. Both ECNN models showed a low testing RMSE and a high SI (Table 3).
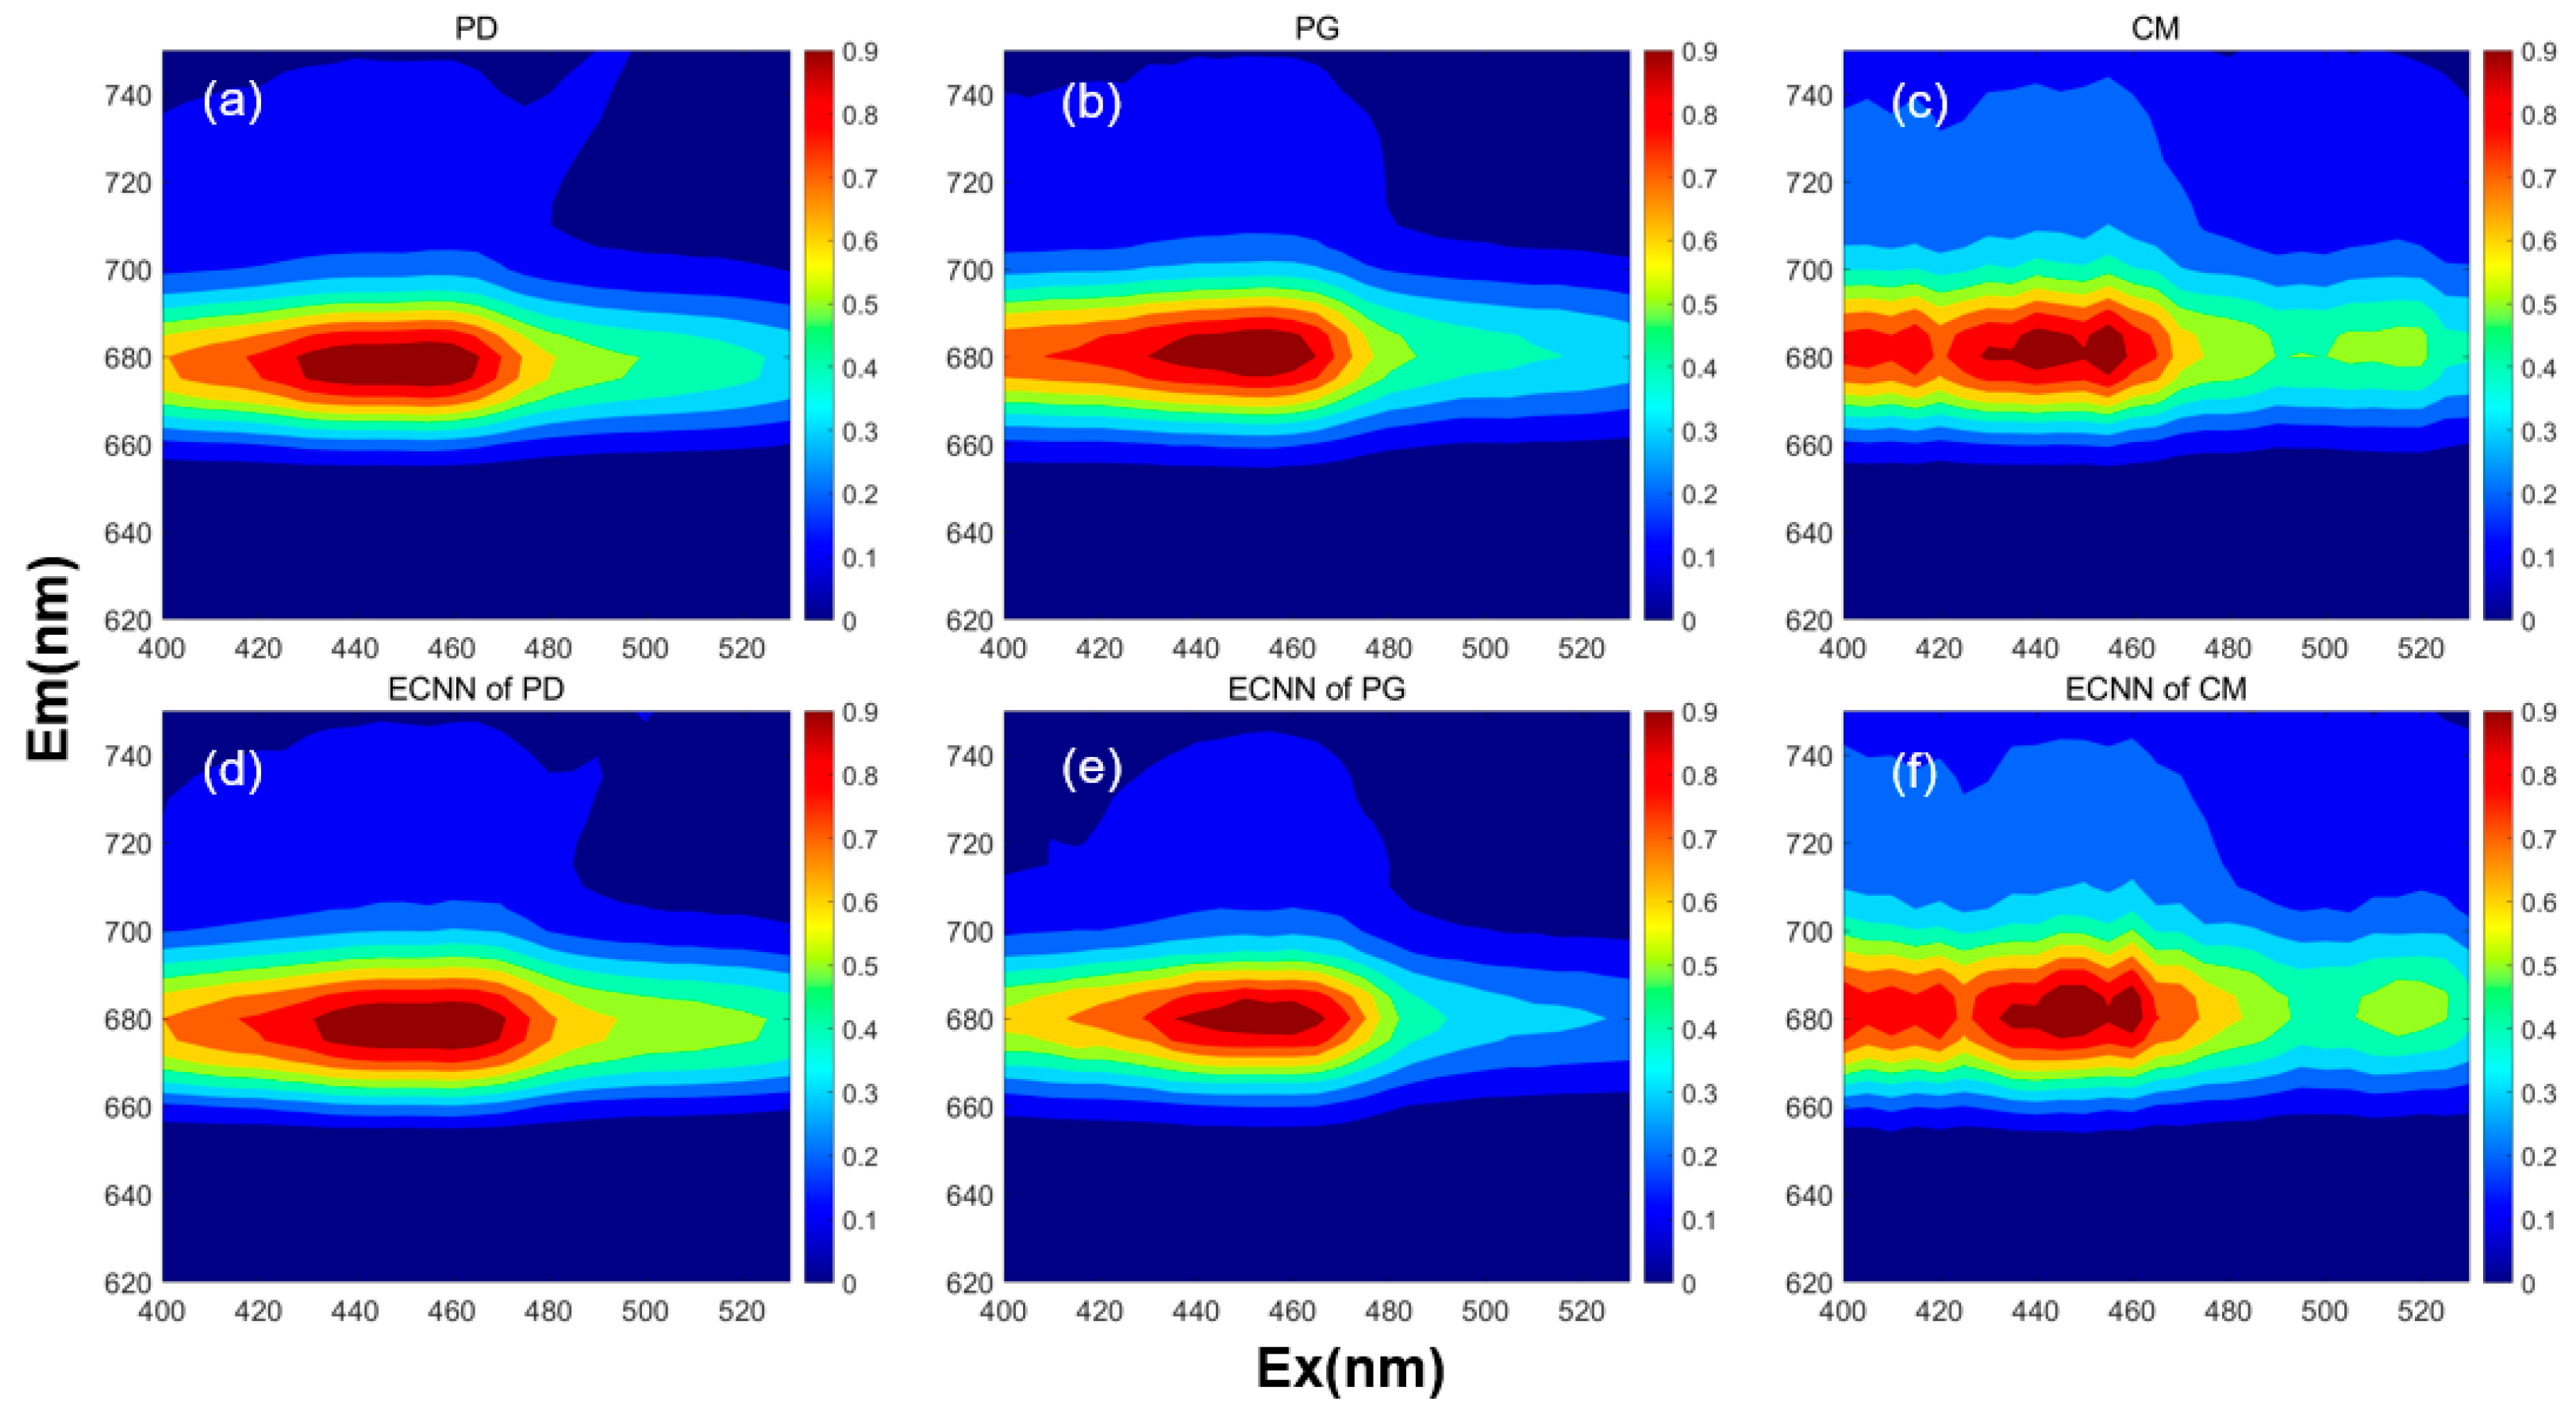
The performance of the ECNN model was further verified with new testing sets. We tested the pre-trained ECNN-CDOM model with a new set of 3D fluorescence data of mixtures of PD + CDOM, PG + CDOM, and CM + CDOM. The corrected outputs of the ECNN-CDOM model were compared with the corresponding 3D fluorescence spectra of pure algal samples. Figure 7 shows that the peaks of corrected fluorescence were adjusted to the same positions of peaks of pure spectra for all three species of algae. The only difference was that there were some deviations in the low fluorescence intensity positions of the non-fluorescence peaks, which may have been caused by background noise in the fluorescence spectrum measurement process, such as the instrument, sample matrix, solvent, etc. However, these noise points had little effect on the 3D-EEM spectra. These results demonstrated that the ECNN-CDOM model effectively eliminates the disturbing effect of CDOM on the 3D fluorescence spectra of the PD, PG, and CM algal samples.

3.3. Comparison of Correction Methods

The performance of the ECNN-CDOM model was compared with that of the non-negative linear least squares algorithm (NNLS) [23]. Figure 8a–c represents the original, interference-free 3D-EEMs of PD, PG, and CM; Figure 8d–f shows the outputs of the well-trained ECNN-CDOM model; and Figure 8g–i show the decomposed algal fluorescence spectrum using NNLS. It can be observed that both the ECNN-CDOM model and NNLS method produced results with identical fluorescence peak positions and similar shapes as the corresponding original algal fluorescence spectra; however, minor differences were observed in the fluorescence peak intensity. Among the three algal species, the performance of both methods was optimal on PG, and the results obtained using the ECNN-CDOM model were similar to the target image in the case of CM but displayed mediocre results for PD. Compared with the NNLS method, the ECNN-CDOM model performed better in fitting the fluorescence peak intensity.
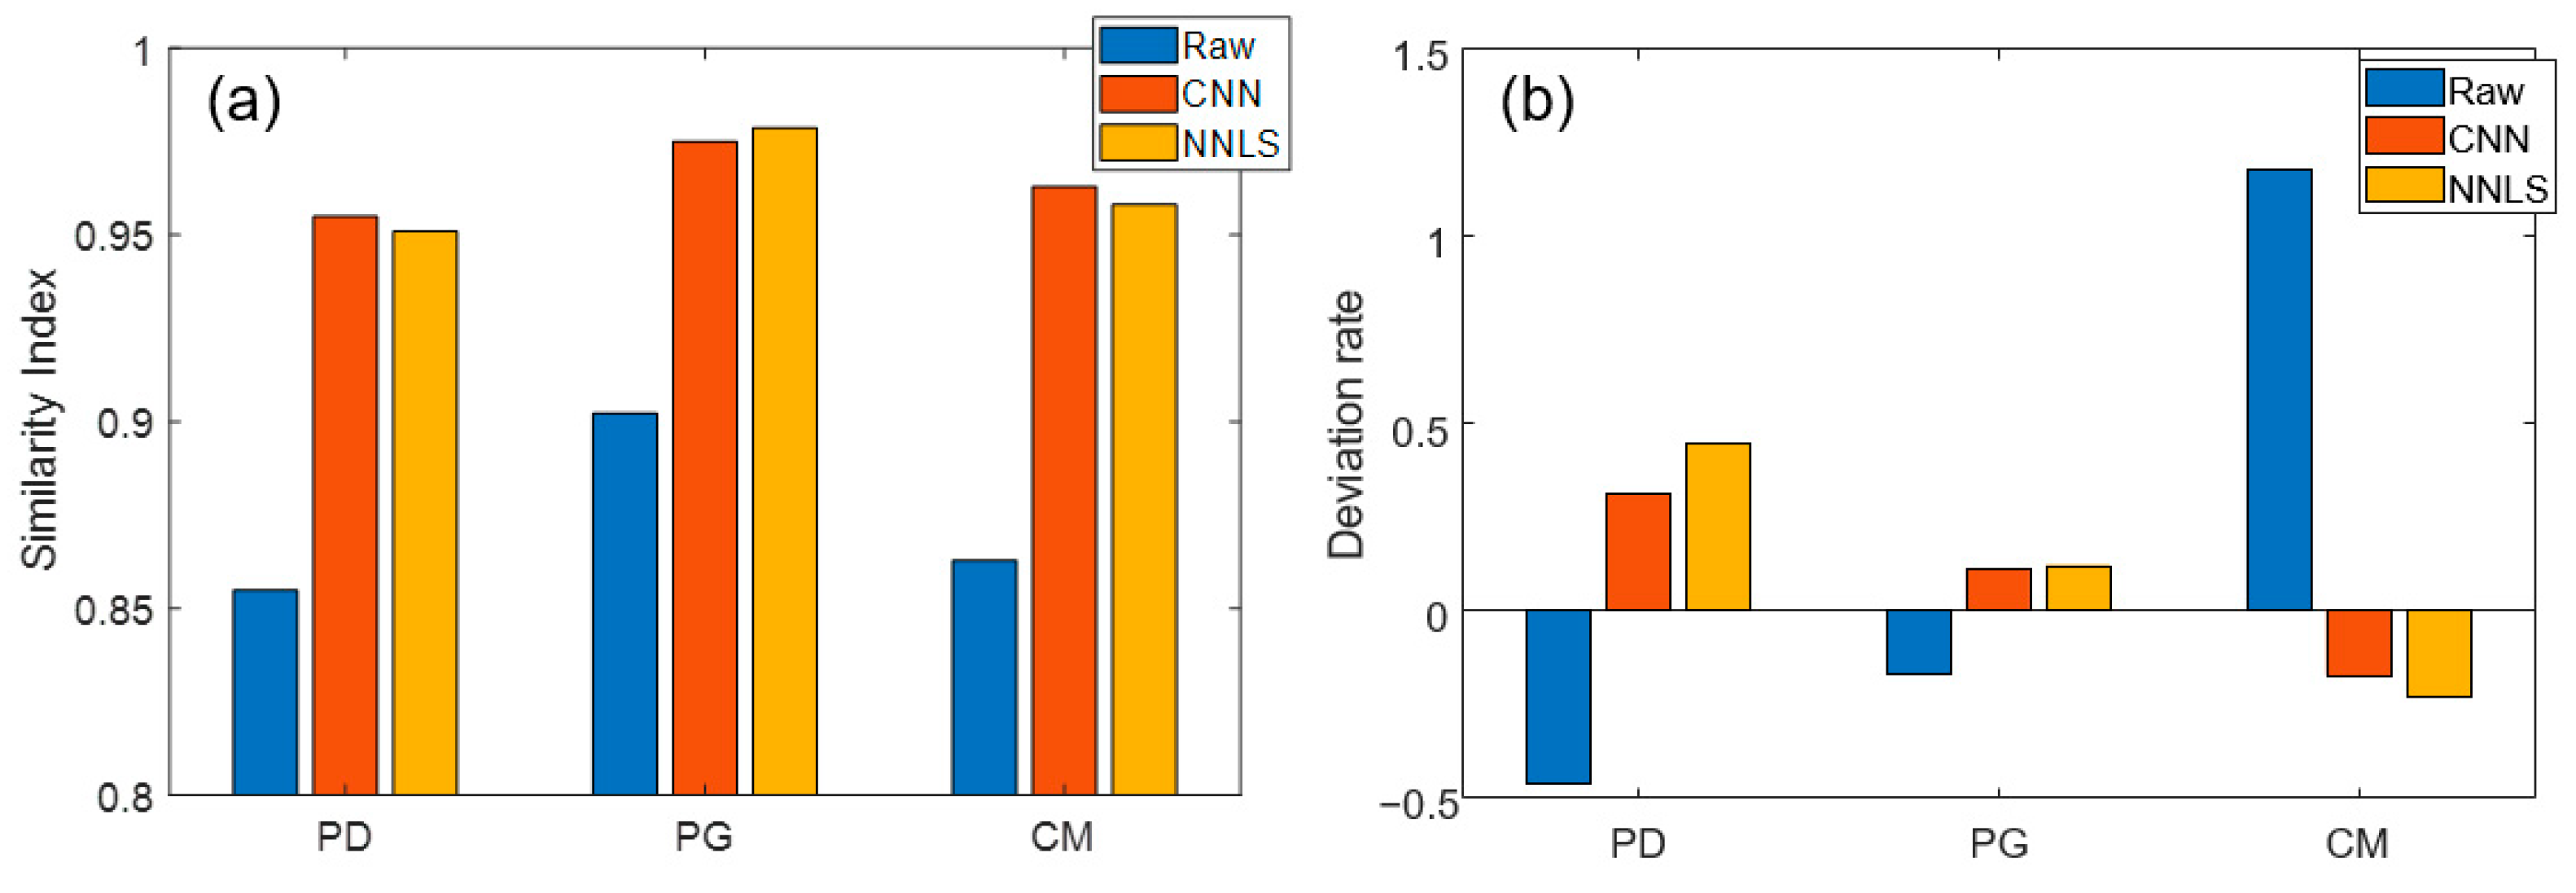
Furthermore, we employed the cosine similarity index (SI) and deviation rate (DR) to quantify the effectiveness of CDOM calibration. The DR is determined by dividing the difference between the fluorescence intensity of each algal fluorescence peak (Ex/Em = 460 nm/680 nm) and the post-calibration EEMs fluorescence peak intensity by the post-calibration EEMs fluorescence peak intensity. The closer the ratio is to 0, the better the calibration effect is.
Figure 9 shows the comparison of SI and DR obtained after calibrating CDOM using the ECNN-CDOM model and the NNLS method on 36 samples of three types of algal samples. Figure 9a displays the SI values of the three algal samples after CDOM calibration using the CNN and NNLS methods. The results indicate that both the CNN and NNLS methods significantly improved the SI values of three red tide algal samples. For the PG algal species, the NNLS method produced slightly higher SI values than the CNN method, but the deviation was not significant. Additionally, the average SI values of the three algal species after using these two methods to remove CDOM increased from the pre-calibration value of 87.33% to 96.42% and 96.25%, implying that the CNN method is slightly better than the NNLS method in correcting EEMs of the three algal samples. Figure 9b shows the DR values of the fluorescence peaks of the three types of algal samples (Ex/Em = 460 nm/680 nm) obtained by calibrating CDOM using the CNN and NNLS methods. It can be observed that the DR values of both the CNN and NNLS methods for fluorescence peak intensity changed inversely before and after CDOM calibration, indicating that both methods effectively corrected deviations of the fluorescence peaks. Specifically, before CDOM calibration, the DR values of the three algal species concentrations ranged from 16.84% to 117.63%; after CDOM calibration with the CNN method, it ranged from 11.32% to 31.64%; and after CDOM calibration with the NNLS method, it ranged from 11.97% to 44.75%. Compared to the NNLS method, using the CNN method to calibrate CDOM reduced the average DR value of PD by 13.11%, PG by 0.65%, and CM by 5.69%. These results indicate that the CNN method provides more accurate fluorescence peak intensities, close to the true algal fluorescence peak intensities after removing CDOM interference.
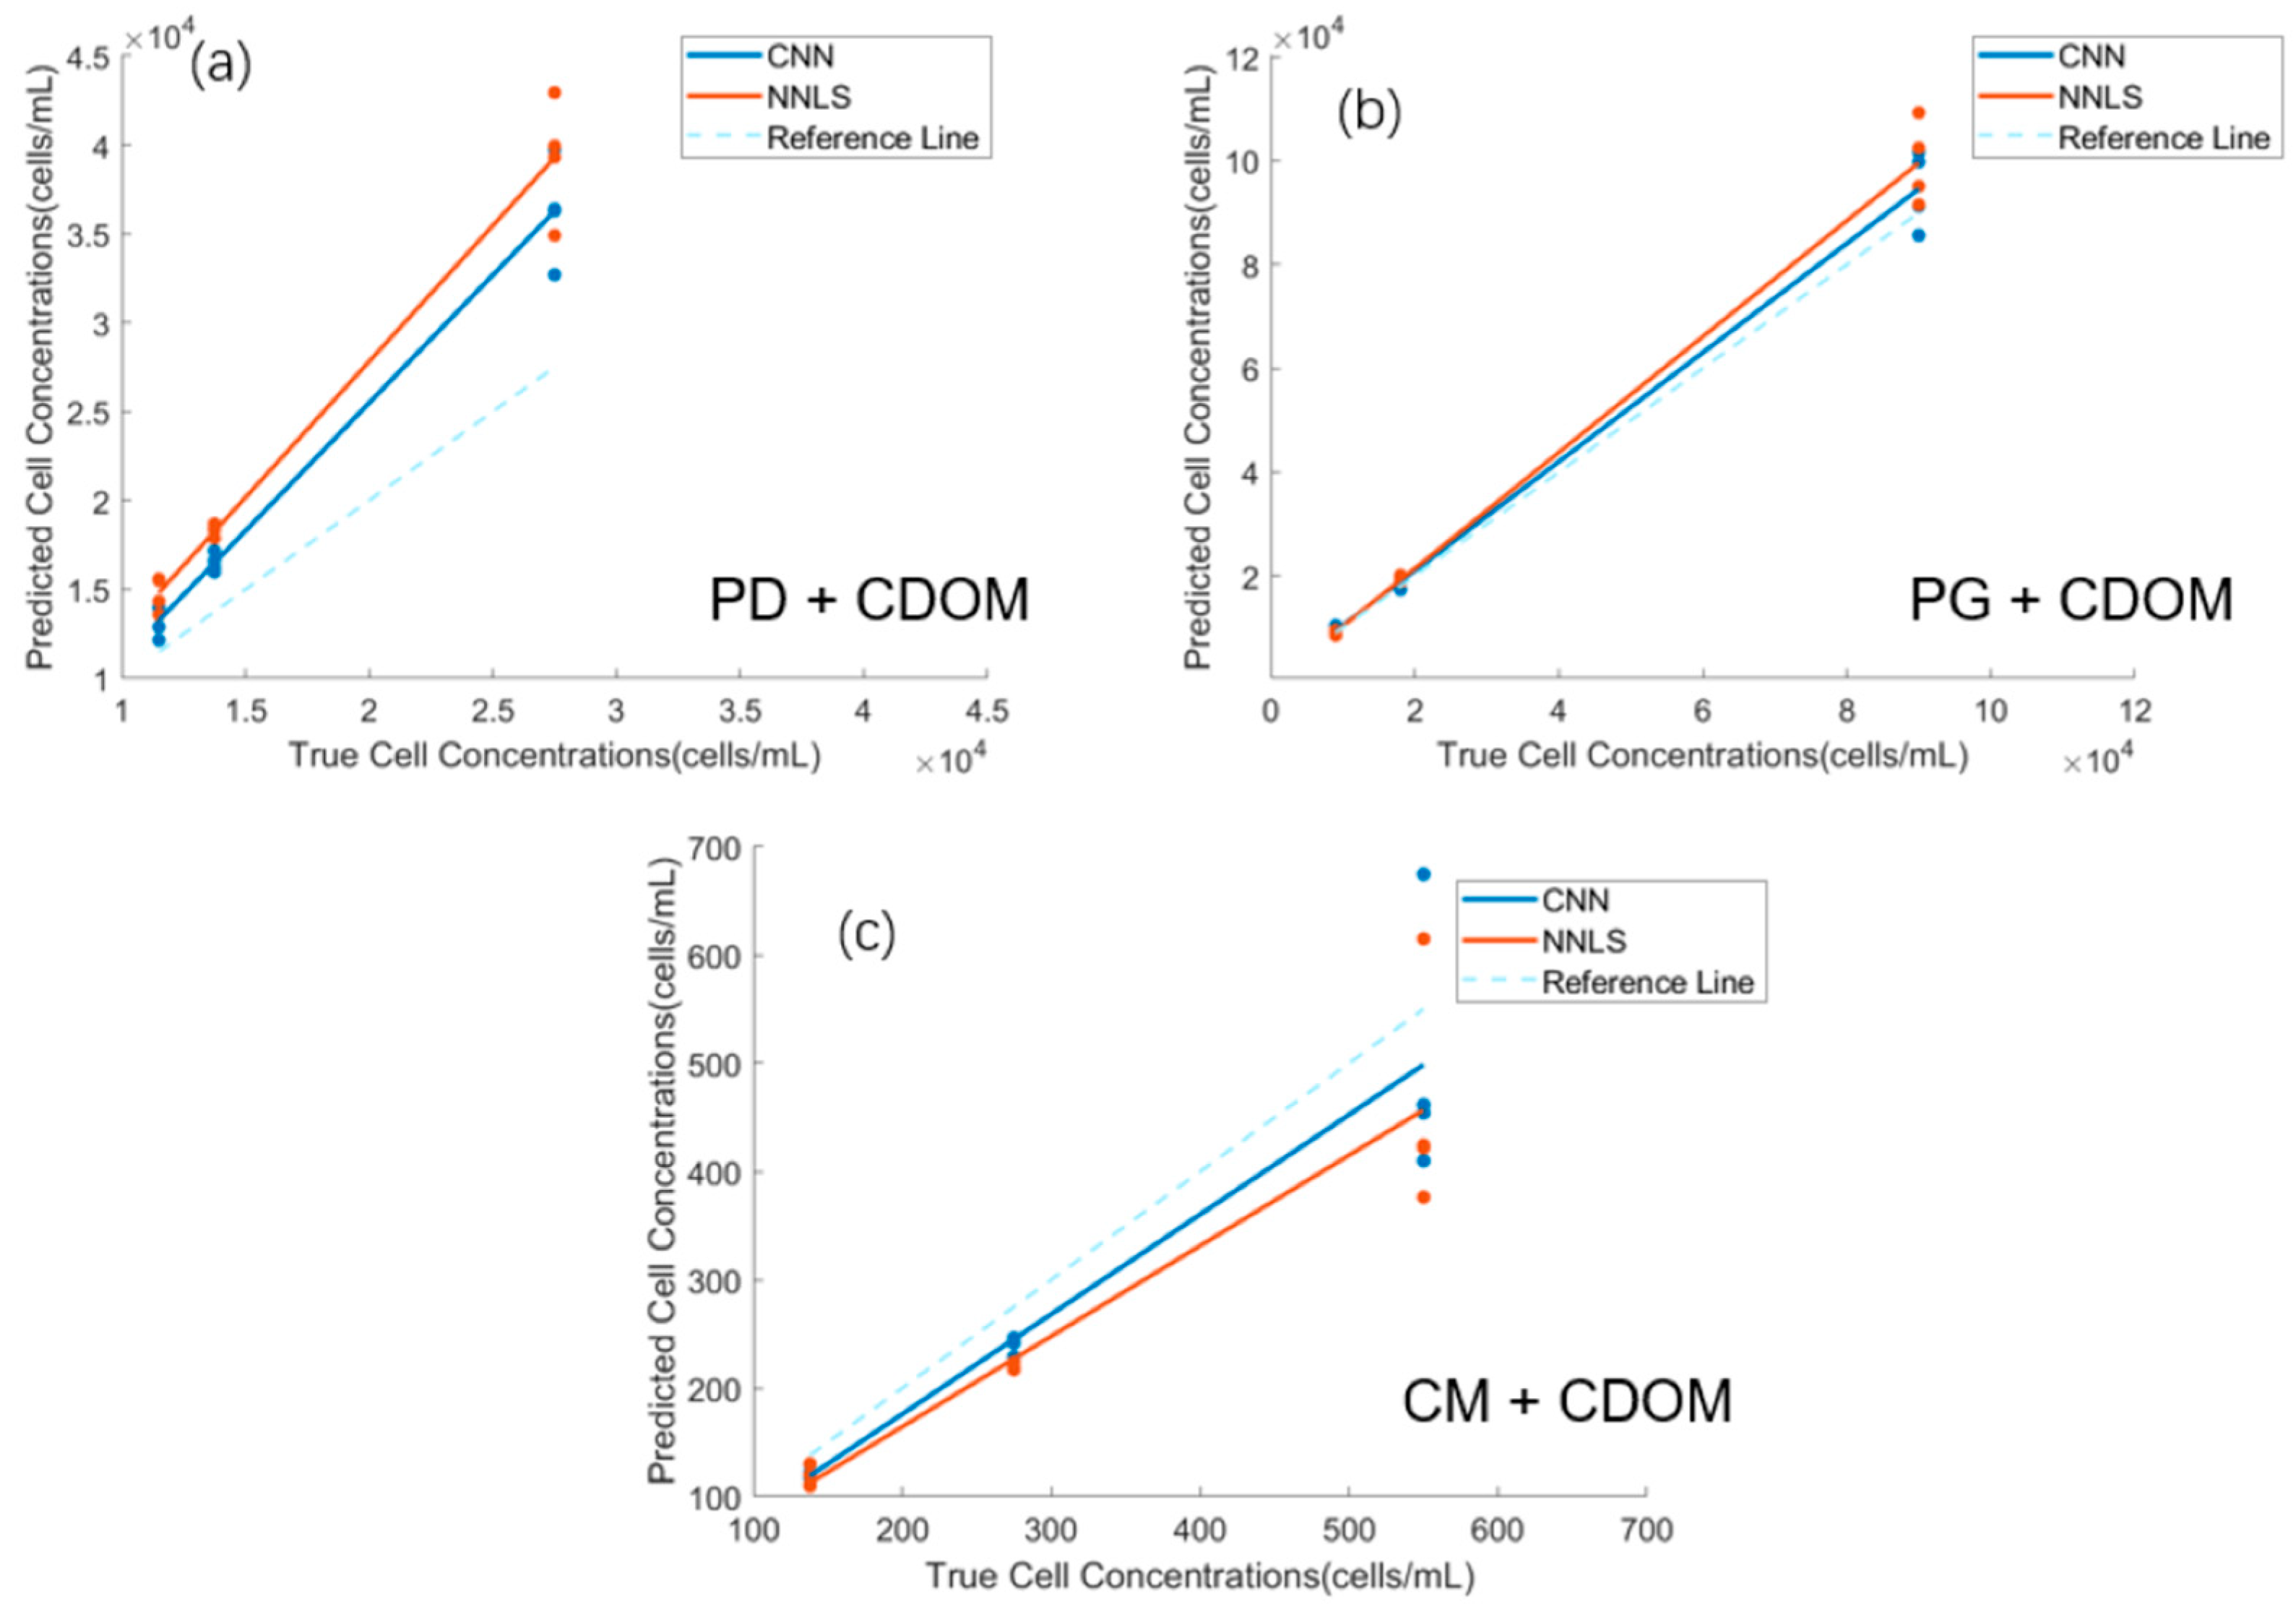
The comparison of the results obtained by both methods for predicting the algal density in the mixed algae and CDOM samples is shown in Figure 10. The solid blue line represents the linear fitting of the spectra corrected by the ECNN-CDOM model with the pure algal spectrum of unit cell concentration to obtain the corresponding algal cell density. In contrast, the solid orange line represents the related algal cell density obtained using the NNLS linear regression method. It can be observed that after being corrected by the ECNN-CDOM model, the influence of CDOM on algal fluorescence measurement was well compensated for. Compared to the direct prediction of algal density using the NNLS linear regression method for mixed samples, the algal densities predicted by the spectra after compensation by the ECNN-CDOM model were much closer to the true algal densities.

4. Conclusions

Fluorescence spectrometry is a rapid and real-time analysis method for estimating the chlorophyll-a concentration in phytoplankton. However, its application is often limited by the fluorescence interference of CDOM and attenuating effects of suspended particulate matter in natural aquatic environments, which result in overestimations of algal concentrations. In this study, we developed an AFAI-Net model to eliminate the interference of non-algal factors (CDOM and turbidity) on algal 3D fluorescence spectra, using a deep convolutional neural network (CNN). The AFAI-Net model can quickly identify the presence of CDOM or turbidity interference in aquatic samples and extract the target algal EEMs from the detected interfered EEMs. Compared with the non-negative weighted least squares linear regression analysis method, the CNN method showed better results in CDOM removal. The spectra compensated by the ECNN-CDOM model to predict algal densities were closer to the actual algal densities. Future studies can further improve the data acquisition and processing procedures and, with increased fluorescence data, enhance the AFAI-Net model’s accuracy and efficiency. In summary, this study provides a new approach to eliminate non-algal interference from phytoplankton fluorescence spectra, which is beneficial for the development of accurate real-time fluorescence-based monitoring techniques for phytoplankton classification and ecosystem health assessment, especially for eutrophication and harmful algal bloom monitoring.

Author Contributions

Conceptualization, M.W. and X.W.; methodology, M.W.; software, M.W.; validation, M.W., X.W. and T.C.; formal analysis, M.W.; investigation, X.W. and T.C.; resources, X.W.; data curation, M.W. and T.C.; writing—original draft preparation, M.W.; writing—review and editing, X.W.; visualization, M.W.; supervision, X.W.; project administration, X.W. All authors have read and agreed to the published version of the manuscript.

Funding

This research was funded by the Key Science and Technology Project of Hainan Province, China (ZDYF2021SHFZ266) and the Key R&D Program of Guangxi (Nos. Guike AB22080081).

Institutional Review Board Statement

Not applicable.

Informed Consent Statement

Not applicable.

Data Availability Statement

The data obtained in this research will be available from the corresponding author.

Conflicts of Interest

The authors declare no conflict of interest.

References

  1. Peters, F.; Marrasé, C. Effects of Turbulence on Plankton: An Overview of Experimental Evidence and Some Theoretical Considerations. Mar. Ecol. Prog. Ser. 2000, 205, 291–306. [Google Scholar] [CrossRef]
  2. Katsiapi, M.; Moustaka-Gouni, M.; Sommer, U. Assessing Ecological Water Quality of Freshwaters: PhyCoI—A New Phytoplankton Community Index. Ecol. Inform. 2016, 31, 22–29. [Google Scholar] [CrossRef]
  3. Berdalet, E.; Kudela, R.; Urban, E.; Enevoldsen, H.; Banas, N.; Bresnan, E.; Burford, M.; Davidson, K.; Gobler, C.; Karlson, B.; et al. GlobalHAB: A New Program to Promote International Research, Observations, and Modeling of Harmful Algal Blooms in Aquatic Systems. Oceanography 2017, 30, 70–81. [Google Scholar] [CrossRef]
  4. Goldman, E.A.; Smith, E.M.; Richardson, T.L. Estimation of Chromophoric Dissolved Organic Matter (CDOM) and Photosynthetic Activity of Estuarine Phytoplankton Using a Multiple-Fixed-Wavelength Spectral Fluorometer. Water Res. 2013, 47, 1616–1630. [Google Scholar] [CrossRef]
  5. Mackey, M.; Mackey, D.; Higgins, H.; Wright, S. CHEMTAX—A Program for Estimating Class Abundances from Chemical Markers:Application to HPLC Measurements of Phytoplankton. Mar. Ecol. Prog. Ser. 1996, 144, 265–283. [Google Scholar] [CrossRef]
  6. Shin, Y.H.; Barnett, J.Z.; Gutierrez-Wing, M.T.; Rusch, K.A.; Choi, J.W. A Hand-Held Fluorescent Sensor Platform for Selectively Estimating Green Algae and Cyanobacteria Biomass. Sens. Actuators B Chem. 2018, 262, 938–946. [Google Scholar] [CrossRef]
  7. Sá, M.; Ferrer-Ledo, N.; Gao, F.; Bertinetto, C.G.; Jansen, J.; Crespo, J.G.; Wijffels, R.H.; Barbosa, M.; Galinha, C.F. Perspectives of Fluorescence Spectroscopy for Online Monitoring in Microalgae Industry. Microb. Biotechnol. 2022, 15, 1824–1838. [Google Scholar] [CrossRef]
  8. Yentsch, C.S.; Phinney, D.A. Spectral Fluorescence: An Ataxonomic Tool for Studying the Structure of Phytoplankton Populations. J. Plankton Res. 1985, 7, 617–632. [Google Scholar] [CrossRef]
  9. Cadondon, J.G.; Ong, P.M.B.; Vallar, E.A.; Shiina, T.; Galvez, M.C.D. Chlorophyll-a Pigment Measurement of Spirulina in Algal Growth Monitoring Using Portable Pulsed LED Fluorescence Lidar System. Sensors 2022, 22, 2940. [Google Scholar] [CrossRef]
  10. Chegoonian, A.M.; Zolfaghari, K.; Leavitt, P.R.; Baulch, H.M.; Duguay, C.R. Improvement of Field Fluorometry Estimates of Chlorophyll a Concentration in a Cyanobacteria-Rich Eutrophic Lake. Limnol. Oceanogr. Methods 2022, 20, 193–209. [Google Scholar] [CrossRef]
  11. Brient, L.; Lengronne, M.; Bertrand, E.; Rolland, D.; Sipel, A.; Steinmann, D.; Baudin, I.; Legeas, M.; Rouzic, B.L.; Bormans, M. A Phycocyanin Probe as a Tool for Monitoring Cyanobacteria in Freshwater Bodies. J. Environ. Monit. 2008, 10, 248–255. [Google Scholar] [CrossRef]
  12. Zhang, Y.; Liu, M.; Fu, X.; Sun, J.; Xie, H. Chromophoric Dissolved Organic Matter (CDOM) Release by Dictyocha Fibula in the Central Bohai Sea. Mar. Chem. 2022, 241, 104107. [Google Scholar] [CrossRef]
  13. Zhang, Y.; van Dijk, M.A.; Liu, M.; Zhu, G.; Qin, B. The Contribution of Phytoplankton Degradation to Chromophoric Dissolved Organic Matter (CDOM) in Eutrophic Shallow Lakes: Field and Experimental Evidence. Water Res. 2009, 43, 4685–4697. [Google Scholar] [CrossRef]
  14. Trubetskaya, O.E.; Richard, C.; Patsaeva, S.V.; Trubetskoj, O.A. Evaluation of Aliphatic/Aromatic Compounds and Fluorophores in Dissolved Organic Matter of Contrasting Natural Waters by SEC-HPLC with Multi-Wavelength Absorbance and Fluorescence Detections. Spectrochim. Acta. A Mol. Biomol. Spectrosc. 2020, 238, 118450. [Google Scholar] [CrossRef]
  15. Del Vecchio, R.; Blough, N.V. Photobleaching of Chromophoric Dissolved Organic Matter in Natural Waters: Kinetics and Modeling. Mar. Chem. 2002, 78, 231–253. [Google Scholar] [CrossRef]
  16. Liu, X.; Zhang, Y.; Shi, K.; Zhu, G.; Xu, H.; Zhu, M. Absorption and Fluorescence Properties of Chromophoric Dissolved Organic Matter: Implications for the Monitoring of Water Quality in a Large Subtropical Reservoir. Environ. Sci. Pollut. Res. 2014, 21, 14078–14090. [Google Scholar] [CrossRef]
  17. Choo, F.; Zamyadi, A.; Stuetz, R.M.; Newcombe, G.; Newton, K.; Henderson, R.K. Enhanced Real-Time Cyanobacterial Fluorescence Monitoring through Chlorophyll-a Interference Compensation Corrections. Water Res. 2019, 148, 86–96. [Google Scholar] [CrossRef]
  18. Xing, X.; Claustre, H.; Boss, E.; Roesler, C.; Organelli, E.; Poteau, A.; Barbieux, M.; D’Ortenzio, F. Correction of Profiles of In-Situ Chlorophyll Fluorometry for the Contribution of Fluorescence Originating from Non-Algal Matter. Limnol. Oceanogr. Methods 2017, 15, 80–93. [Google Scholar] [CrossRef]
  19. Azil, K.; Altuncu, A.; Ferria, K.; Bouzid, S.; Sadık, Ş.A.; Durak, F.E. A Faster and Accurate Optical Water Turbidity Measurement System Using a CCD Line Sensor. Optik 2021, 231, 166412. [Google Scholar] [CrossRef]
  20. Ng, C.-L.; Ng, Y.-J.; Chen, Q.-Q.; Hemond, H.F. Corrections for Matrix Effects on Fluorescence Measurement of a Multi-Platform Optical Sensor. Water Pract. Technol. 2016, 11, 644–660. [Google Scholar] [CrossRef]
  21. Sarmanova, O.E.; Laptinskiy, K.A.; Khmeleva, M.Y.; Burikov, S.A.; Dolenko, S.A.; Tomskaya, A.E.; Dolenko, T.A. Development of the Fluorescent Carbon Nanosensor for PH and Temperature of Liquid Media with Artificial Neural Networks. Spectrochim. Acta. A Mol. Biomol. Spectrosc. 2021, 258, 119861. [Google Scholar] [CrossRef] [PubMed]
  22. Shin, Y.; Barnett, J.Z.; Song, E.; Gutierrez-Wing, M.T.; Rusch, K.A.; Choi, J.W. A Portable Fluorescent Sensor for On-Site Detection of Microalgae. Microelectron. Eng. 2015, 144, 6–11. [Google Scholar] [CrossRef]
  23. Zhang, X.; Yin, G.; Zhao, N.; Yang, R.; Liu, J.; Liu, W. Chromophoric Dissolved Organic Matter Influence Correction of Algal Concentration Measurements Using Three-Dimensional Fluorescence Spectra. Spectrochim. Acta. A Mol. Biomol. Spectrosc. 2019, 210, 405–411. [Google Scholar] [CrossRef]
  24. Li, W.; Liu, T.; Fu, Y.; Huang, M. High Sensitivity and Wide Range Chlorophyll-a Determination by Simultaneous Measurement of Absorbance and Fluorescence Using a Linear CCD. Spectrochim. Acta. A Mol. Biomol. Spectrosc. 2022, 270, 120831. [Google Scholar] [CrossRef]
  25. Li, Y.; Jia, Y.; Cai, X.; Xie, M.; Zhang, Z. Oil Pollutant Identification Based on Excitation-Emission Matrix of UV-Induced Fluorescence and Deep Convolutional Neural Network. Environ. Sci. Pollut. Res. 2022, 29, 68152–68160. [Google Scholar] [CrossRef]
  26. Ruan, K.; Zhao, S.; Jiang, X.; Li, Y.; Fei, J.; Ou, D.; Tang, Q.; Lu, Z.; Liu, T.; Xia, J. A 3D Fluorescence Classification and Component Prediction Method Based on VGG Convolutional Neural Network and PARAFAC Analysis Method. Appl. Sci. 2022, 12, 4886. [Google Scholar] [CrossRef]
  27. Wu, X.; Zhao, Z.; Tian, R.; Shang, Z.; Liu, H. Identification and Quantification of Counterfeit Sesame Oil by 3D Fluorescence Spectroscopy and Convolutional Neural Network. Food Chem. 2020, 311, 125882. [Google Scholar] [CrossRef]
  28. Xu, R.; Cao, J.; Feng, G.; Luo, J.; Feng, Q.; Ni, B.; Fang, F. Fast Identification of Fluorescent Components in Three-Dimensional Excitation-Emission Matrix Fluorescence Spectra via Deep Learning. Chem. Eng. J. 2022, 430, 132893. [Google Scholar] [CrossRef]
  29. Hu, Y.; Wen, Y.; Wang, X. Novel Method of Turbidity Compensation for Chemical Oxygen Demand Measurements by Using UV–Vis Spectrometry. Sens. Actuators B Chem. 2016, 227, 393–398. [Google Scholar] [CrossRef]
  30. Zepp, R.G.; Sheldon, W.M.; Moran, M.A. Dissolved Organic Fluorophores in Southeastern US Coastal Waters: Correction Method for Eliminating Rayleigh and Raman Scattering Peaks in Excitation–Emission Matrices. Mar. Chem. 2004, 89, 15–36. [Google Scholar] [CrossRef]
  31. Schafer, R.W. What Is a Savitzky-Golay Filter? [Lecture Notes]. IEEE Signal Process. Mag. 2011, 28, 111–117. [Google Scholar] [CrossRef]
  32. Wan, K.X.; Vidavsky, I.; Gross, M.L. Comparing Similar Spectra: From Similarity Index to Spectral Contrast Angle. J. Am. Soc. Mass Spectrom. 2002, 13, 85–88. [Google Scholar] [CrossRef]
  33. Beutler, M.; Wiltshire, K.H.; Meyer, B.; Moldaenke, C.; Lüring, C.; Meyerhöfer, M.; Hansen, U.-P.; Dau, H. A Fluorometric Method for the Differentiation of Algal Populations in Vivo and in Situ. Photosynth. Res. 2002, 72, 39–53. [Google Scholar] [CrossRef]
  34. Shan, S.; Xu, L.; Chen, K.; Tong, M.; Wang, X. A Rapid Fluorescence Approach on Differentiation of Typical Dinoflagellate of East China Sea. Spectrochim. Acta. A Mol. Biomol. Spectrosc. 2022, 276, 121216. [Google Scholar] [CrossRef]
  35. Liu, J.; Zeng, L.; Ren, Z.; Du, T.; Liu, X. Rapid in Situ Measurements of Algal Cell Concentrations Using an Artificial Neural Network and Single-Excitation Fluorescence Spectrometry. Algal Res. 2020, 45, 101739. [Google Scholar] [CrossRef]
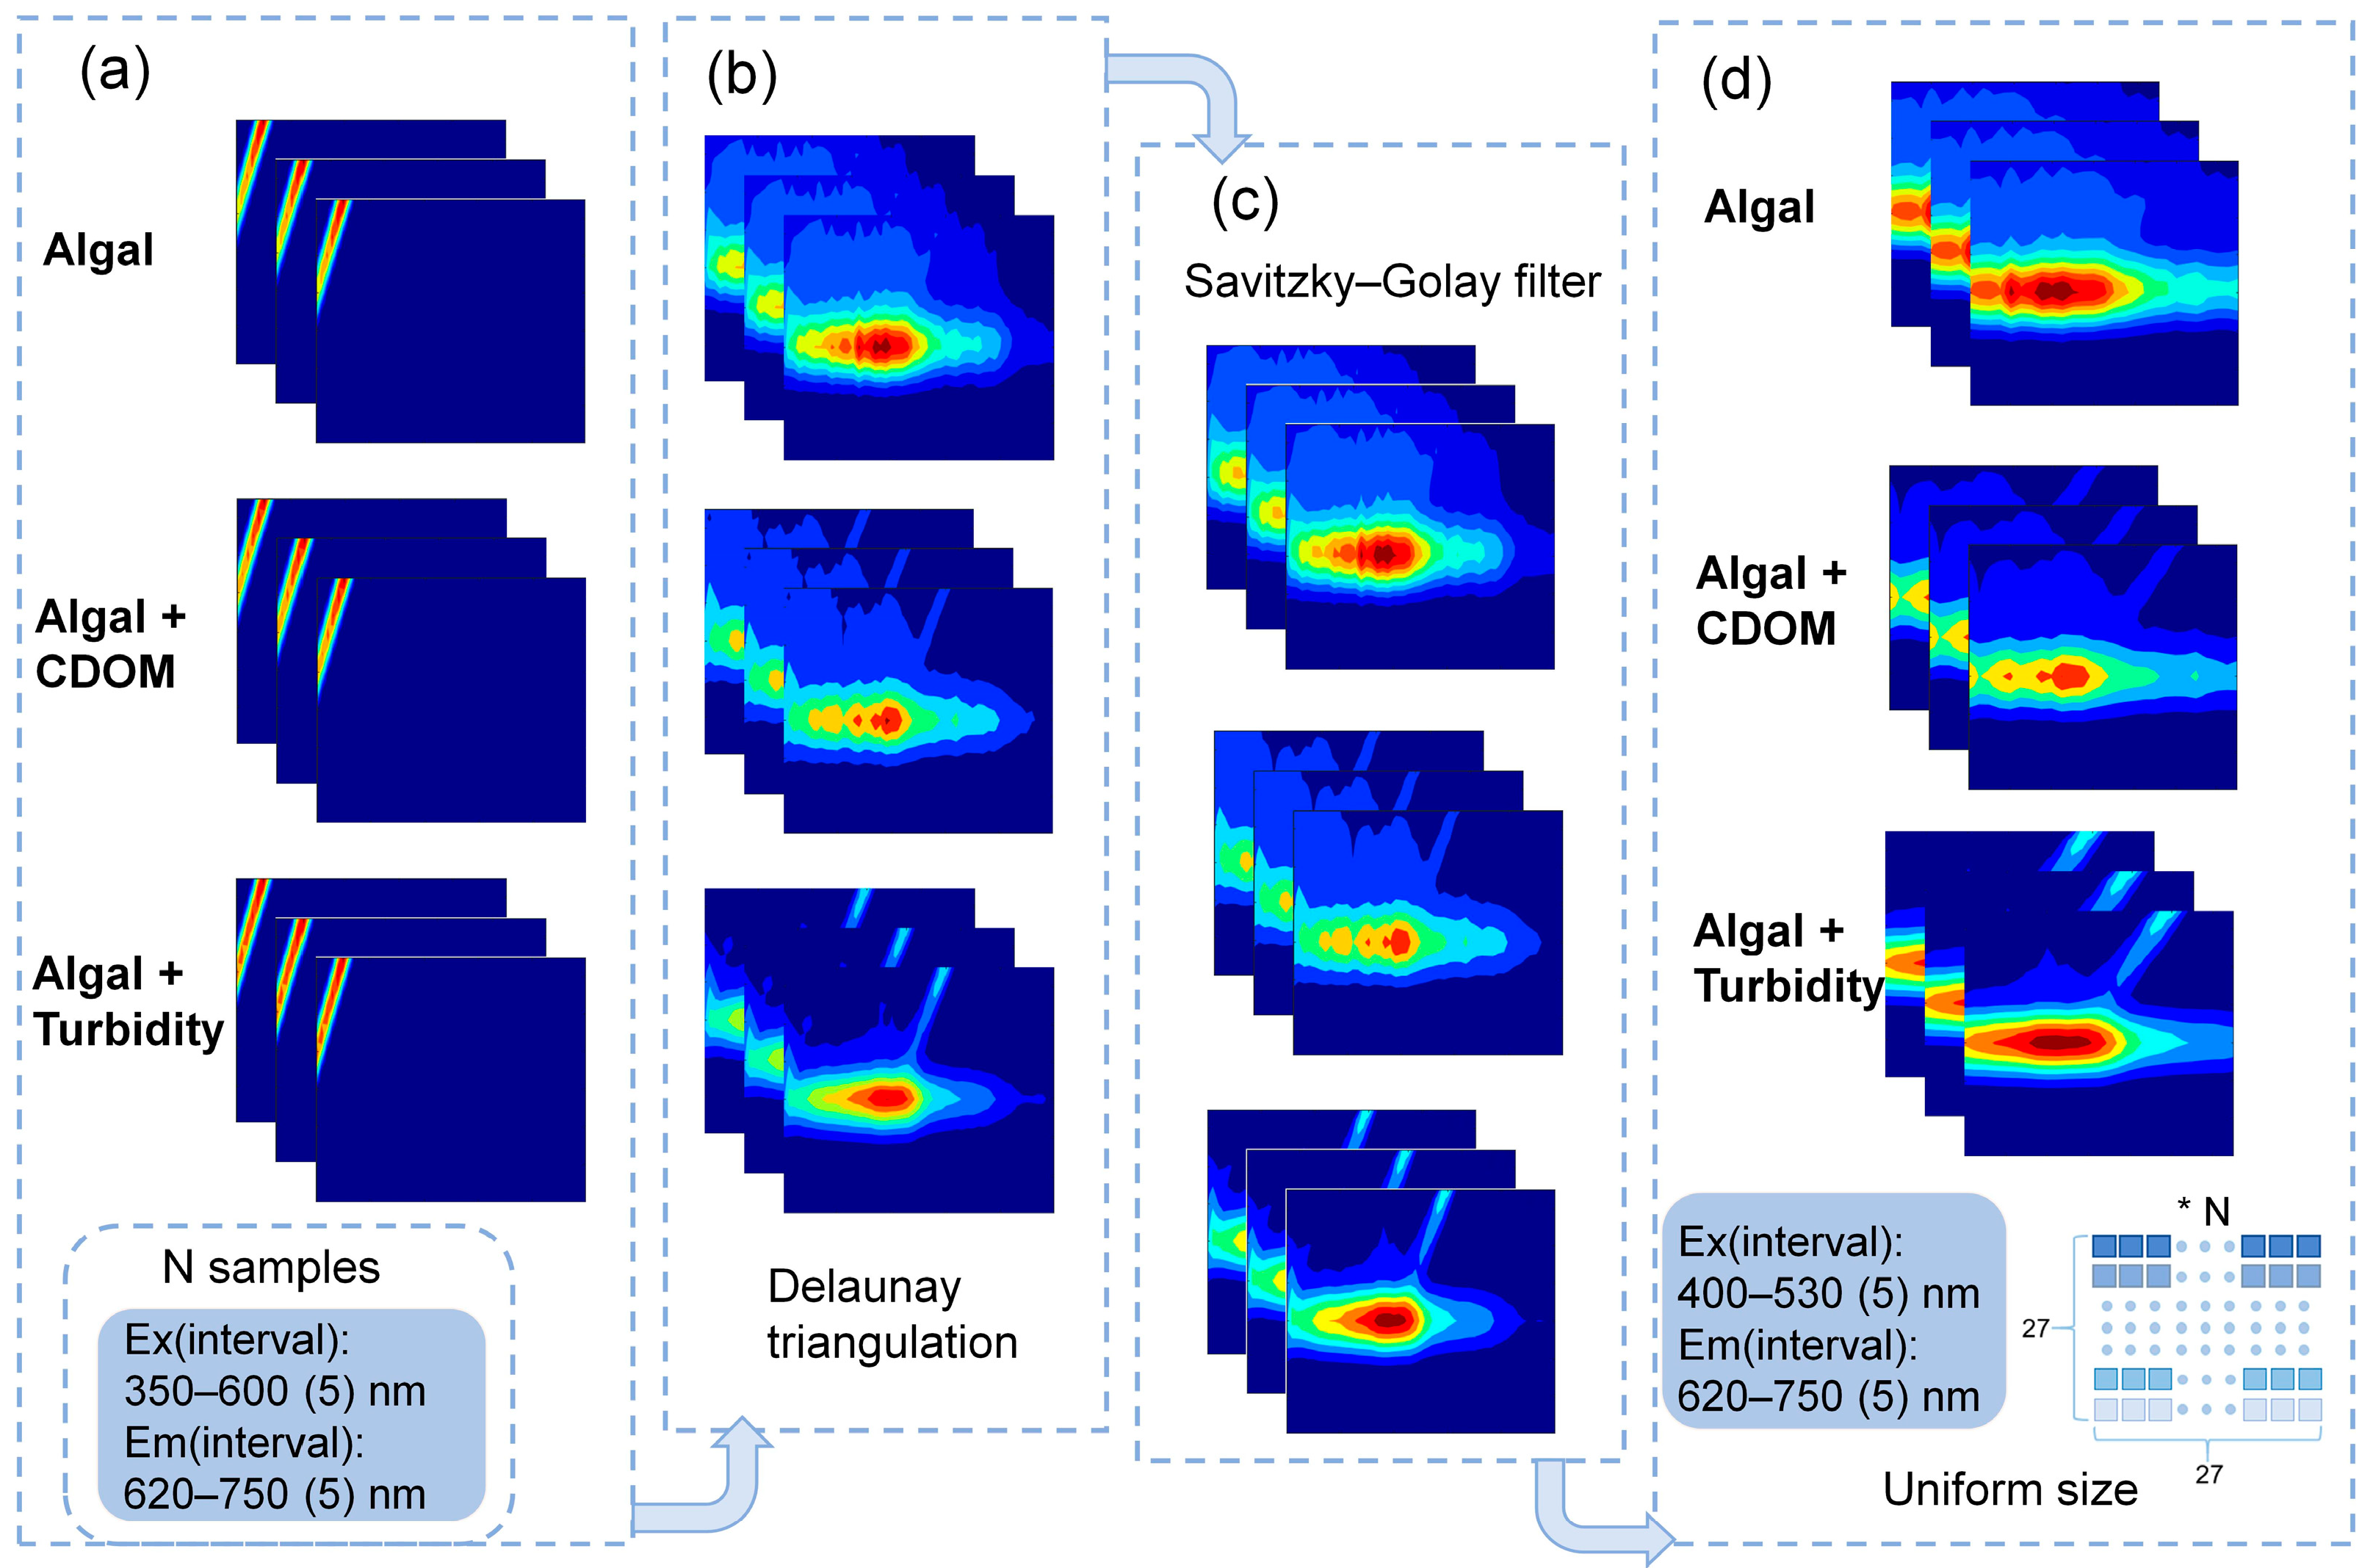
Figure 1. (a) Raw 3D fluorescence spectrum data of the experimental samples, including pure algal data, spectral data of algal mixed with CDOM, and spectral data of algae mixed with turbidity; (b) spectral data after removal of Rayleigh and Raman scattering using Delaunay triangulation; (c) spectral data after smoothing with the Savitzky–Golay filtering method. (d) Adjusted excitation wavelength range of 400–530 nm and emission wavelength range of 620–750 nm, both at an interval of 5 nm. This figure shows the data preprocessing flow of this study, which preprocesses all the 3D-EEM spectrum data into a unified format (d), facilitating the extraction of spectral features containing algal fluorescence peaks for subsequent model analysis.
Photonics 10 00627 g001
Figure 2. Structural diagram of the QCNN, where the 3D-EEMs of the mixed solution were used as input, and the interference type in the solution was set as the classification label. It consisted of two 2D convolutional layers, two 2D max-pooling layers, and two fully connected layers were concatenated to reduce feature dimensions. The softmax function was used in the output layer for classification.
Photonics 10 00627 g002
Figure 3. (a) The structure of ECNN, which uses the 3D-EEMs of the mixed solution as input and sets the 3D-EEMs of pure algal solution as the target spectral image. The MSE and RMSE of the model were calculated based on the target values and predicted values. (b) shows the process of using the trained AFAI-Net to correct for interference in a sample’s 3D-EEMs. The FCNN model determines whether there is CDOM or turbidity interference in the 3D-EEMs, and if the output is 0, no further correction is needed. If the output of the FCNN model is 1, the 3D-EEMs are input into the trained ECNN-Tur model for fitting. If the output is 2, the 3D-EEMs are input into the trained ECNN-CDOM model for fitting to obtain the interference-removed EEMs.
Photonics 10 00627 g003
Figure 4. (a) Emission spectra of three microalgal species (PD, PG, and CM) at concentrations of 1.1 × 10⁷ cells/L, 1.8 × 10⁸ cells/L and 5.5 × 10⁵ cells/L, respectively, under an excitation wavelength of 460 nm. (b) Excitation spectra of the same microalgae at identical concentrations, under an emission wavelength of 680 nm.
Photonics 10 00627 g004
Figure 5. (a) represents 3D-EEMs acquired from PG algae without any interference, while (b,c) depict 3D-EEMs acquired from PG algal samples after adding CDOM and turbidity interferers, respectively. As shown in Figure 5b,c, the spectral shape, width, and fluorescence peak intensity of PG algal samples have been altered compared to that of the pure PG algae. The x and y coordinates of these 3D-EEMs are excitation and emission wavelengths (nm), respectively.
Photonics 10 00627 g005
Figure 6. The confusion matrix of the classification results of the FCNN model, where 0 represents no interference, 1 represents turbidity interference, and 2 represents CDOM interference.
Photonics 10 00627 g006
Figure 7. (ac) The 3D-EEM spectra of PD, PG, and CM algae without interference, which are the target maps that the ECNN model aims to fit. (df) The fluorescence spectra obtained after removing interference using the pre-trained ECNN-CDOM model. The x and y axes of the figures represent the excitation and emission wavelengths (nm), and the fluorescence intensities are normalized by taking the maximum value.
Photonics 10 00627 g007
Figure 8. Comparison of the performance of different calibration methods in removing the CDOM effect from three types of algal samples, PD, PG, and CM. Panels (ac) represent the original 3D-EEMs free of interference for the three algal species; panels (df) illustrate the 3D-EEMs obtained after applying the pre-trained ECNN-CDOM model; and panels (gi) show the 3D-EEMs attained after removing CDOM interference using the NNLS method. The x and y axes in these figures correspond to the excitation wavelength and emission wavelength (nm), respectively.
Photonics 10 00627 g008
Figure 9. (a) Similarity index (SI) values of the three scenarios. The blue bar chart represents the SI between the original, uncalibrated 3D-EEMs of PD, PG, and CM mixed with CDOM, and their corresponding target pure algal 3D-EEMs. The orange bar chart shows the SI values obtained after correcting the EEMs using the pre-trained ECNN-CDOM model. The yellow bar chart represents the SI values obtained after correction using the NNLS method. (b) illustrates the DR values of the fluorescence peaks (Ex/Em = 460 nm/680 nm) for the same three scenarios as in (a).
Photonics 10 00627 g009
Figure 10. (ac) Relationships between the algal density values (blue line) calculated from the spectrograms obtained with the ECNN-CDOM model output, the algal density values (orange line) calculated with the NNLS method, and the reference values (dashed line) for the PD + CDOM, PG + CDOM, and CM + CDOM mixed samples.
Photonics 10 00627 g010
Table 1. List of algal species and cultures media.
PhylaSpeciesCultures Media
DinophytaProrocentrum donghaienseF/2
HaptophytaPhaeocystis globosaF/2
RaphidophytaChattonella marinacmF/2
Table 2. The numbers of different types of samples.
Type of SamplesNumber of Samples
PurePD60
PG96
CM36
MixedPD + Turbidity42
PG + Turbidity108
CM + Turbidity36
PD + CDOM60
PG + CDOM144
CM + CDOM48
Total 630
Table 3. Test performance of ECNN-Tur and ECNN-CDOM models.
ECNNRMSESI
ECNN-Tur0.34230.9630
ECNN-CDOM0.22740.9715
Disclaimer/Publisher’s Note: The statements, opinions and data contained in all publications are solely those of the individual author(s) and contributor(s) and not of MDPI and/or the editor(s). MDPI and/or the editor(s) disclaim responsibility for any injury to people or property resulting from any ideas, methods, instructions or products referred to in the content.