Abstract
Infrared imaging spectrometers detect and identify targets by collecting spectral and image information. However, when detecting small temperature differences and dynamic targets, the accuracy of infrared detection is reduced, the traditional scanning structure detection time is longer, the real-time performance is poor and it is easy to introduce motion artifacts. This paper proposes an infrared polarization snapshot spectral imaging system (PSIFTIS) based on a polarizer array, a lens array and a roof-shaped stepped micromirror. Polarized light can solve the problem of small-temperature-difference target recognition by characterizing the surface properties of materials. Lens arrays utilize multi-aperture imaging to achieve snapshot detection of targets. The system can obtain 4D data information, including polarization, in a single measurement cycle. This study completed the overall optical design of a PSIFTIS and an optical simulation experiment using it. Finally, a system prototype was built in the laboratory and a polarization spectrum detection experiment was carried out. The experimental results show that the PSIFTIS could accurately obtain the polarization spectrum information for the target, the spectral resolution reached 7.8 cm−1 and the Stokes measurement error was less than 5%.
1. Introduction
A snapshot spectral imaging system is an optical system that combines spectral analysis and snapshot imaging technology. It is widely used in space detection, military identification and camouflage, natural disaster accident monitoring and other fields. However, with the rapid development of many important fields, such as aerospace remote sensing, military reconnaissance, resource exploration, geological surveyance and agricultural and marine-industry remote sensing, performance requirements for infrared transient spectrum detection equipment continue to increase. Compared with the traditional snapshot spectroscopy system, the infrared polarization snapshot spectroscopy imaging system adds the concept of polarization, which makes up for the shortcoming of low target recognition rates in cases involving weak radiation targets, complex background conditions and long-distance detection [1,2,3,4,5,6].
Polarized light detection technology was initially researched and applied in the 1960s. In 1972, J. D. Halajian and H. B. Hallock first proposed polarization imaging technology in a patent [7]. In 2003, the National Aerospace Laboratory of Japan designed and produced a polarization imaging spectrometer that could collect target images, spectra and linear polarization information in the liquid crystal tunable filter (LCTF) additional motor rotation mode and detect the visible and near-infrared bands from 650 to 1100 nm. Experiments such as earth environment observations, agricultural environment observations and water pollution monitoring were carried out [8,9]. In 2008, the University of North Carolina proposed a polarization grating-based snapshot polarization imaging spectrometer with a working band of 500–700 nm [10]. In the same year, Northwestern Polytechnic University developed a polarization imaging spectrometer based on a LCTF. Its detection band is the visible band of 400–720 nm [11,12,13]. In 2018, Qingdao University of Science and Technology combined an improved Sagnac spectropolarimeter and a spectral polarization modulation system to modulate the Stokes vector of the incident light into different wavenumbers, obtain the modulated interferogram in a snapshot mode and separate and demodulate the Stokes spectrum from the interferogram component spectrum [14]. In 2019, North University of China proposed a new hyperspectral full-polarization imaging method based on a super achromat quarter-wave plate and acousto-optic tunable filter (AOTF). Its detection band is 450–950 nm [15]. In 2020, Changchun University of Science and Technology designed a polarization imaging system with a double Wollaston prism. The system uses a MgF2 Wollaston prism, 2.3–7 μm working band and four infrared detectors to receive different polarization images [16]. A spatially modulated computed tomography snapshot polarization imaging spectrometer was developed by Changchun Institute of Optics, Fine Mechanics and Physics, Chinese Academy of Sciences, in 2021. The instrument can simultaneously obtain the spatial, intensity and polarization information across different wavelengths for a target. Its detection band is 500–590 nm [17]. In 2022, the National Astronomical Observatory of Japan carried out polarization calibration for the Sunrise Chromospheric Infrared Spectropolarimeter, and its detection window wavelengths are 850 nm and 770 nm [18].
Based on the current survey findings, global research on polarization spectral imaging systems is maturing. However, most instrument work-bands are concentrated in the visible and near-infrared bands, and there is less research on the mid-infrared bands. The way these systems acquire different polarization images is time-sharing acquisition, which has poor real-time performance and requires multiple detectors to detect simultaneously, increasing the development cost.
In order to solve the above problems, a PSIFTIS based on infrared polarizer array devices, lens array devices and a roof-shaped stepped micromirror is proposed in this paper. The system can realize the acquisition of target near-infrared polarization spectrum image information in a single detection period. In contrast to the traditional time-sharing method of obtaining polarized light, the polarizer array has the advantage of obtaining information from multiple polarization directions at the same time. Moreover, this study adopted a structure with roof-shaped stepped micromirrors, which replaces the traditional design of obtaining the optical path difference through a moving mirror. This makes the overall structure of the system more stable, the error when obtaining the optical path difference smaller and the reconstructed spectrum more accurate. At the same time, the orthogonal roof-shaped stepped micromirror is matched with the polarization channel to realize the synchronous detection of the interference patterns of different polarization channels.
A PSIFTIS is proposed in this paper. The rest of this paper is organized as follows: the structure and principle of the system are given in Section 2, the overall optical design of the system is introduced in Section 3 and the paper continues with a system simulation and platform test to verify the reliability of the system in Section 4. Finally, conclusions are drawn in Section 5.
2. Principle and System Parameters
2.1. PSIFTIS Principle
The schematic diagram of the PSIFTIS is shown in Figure 1a. The PSIFTIS consists of the front imaging system, beam splitter, higher roof-shaped stepped micromirror, lower roof-shaped stepped micromirror, rear imaging system and infrared focal plane array detector. The polarizer array performs polarization modulation on the target, and the lens array realizes snapshot imaging of the target N × N array. The target is primarily imaged on the reflective surface of the roof-shaped stepped micromirror in the form of an image array. The light field of the target object is collimated by the collimator mirror and then incidented on the polarizer array in parallel, and the polarized light modulated by the polarizer array is imaged onto the roof-shaped stepped micromirror through the lens array. The static interference system, composed of two orthogonally placed high and low-stepped roof-shaped micromirrors, performs phase modulation on the imaging light field so that the imaging light fields of each lens unit have different interference orders. Finally, the image on the roof-shaped stepped micromirror enters the rear imaging system through the beam splitter and is finally imaged on the detector. From this, we can obtain the polarization interference image array for the target object and the three-dimensional polarization interference intensity datasets I0(x,y,∆(m,n)), I45(x,y,∆(m,n)), I90(x,y,∆(m,n)) and I135(x,y,∆(m,n)) for the four polarization directions of the target by segmenting and registering the polarization interference image array [19,20]. ∆(m,n) is the optical path difference modulated by the phase modulation unit (m,n): ∆(m,n) = 2(Nn−m)d. Here, m and n are the position coordinates of the corresponding phase modulation unit, taking the center of the whole modulation unit as the zero point and increasing accordingly in the horizontal and vertical directions. N is the series number for the roof-shaped stepped micromirror, and d is the height of the lowest step of the roof-shaped stepped micromirror. The inverse Fourier transform is performed on the three-dimensional polarization interference intensity dataset Iθ(x,y,∆(m,n)) to obtain the spectral information Βθ(x,y,ν) corresponding to the polarization direction.
where ν is the wavenumber and (x,y) are the coordinates of any point in the image. Each polarization channel contains 8 × 8 modulation units, and the imaging units in each modulation unit correspond to the spectral units one by one. The interference order distribution corresponding to each modulation unit is shown in Figure 1b.
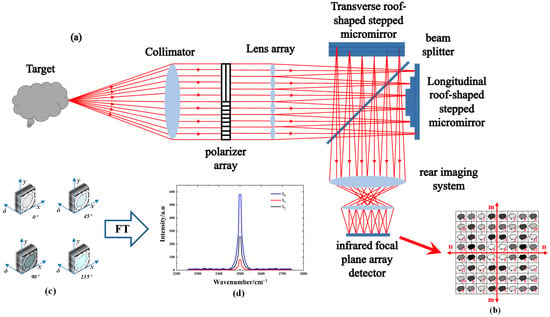
Figure 1.
Explanation of the PSIFTIS principle: (a) schematic diagram of the PSIFTIS; (b) imaging diagram; (c) different polarization interferometric data cubes; (d) spectral information.
Using the Stokes vector expression, the spectral information corresponding to each Stokes vector can be obtained:
Using the spectral information corresponding to each Stokes vector, we can also obtain the polarization state of the incident light:
In the formula, Eox and Eoy are the amplitudes of the light field in the x and y directions and δ is the phase difference. The orthogonally placed roof-shaped stepped micromirrors in the system divide the interference imaging area into four parts, with each area center-symmetrically distributed according to the interference order, corresponding to the polarization channels. The system is able to fulfill the requirement of simultaneously acquiring images and spectral information in four different polarization states.
2.2. System Parameters
The design requirements for the infrared polarization spectroscopy imaging system are shown in Table 1.

Table 1.
Main specifications of the system.
The system is a secondary imaging system, so the optical matching between the rear imaging system and each system needs to be considered during the design. In accordance with the working band of the system, we chose the mid-wave infrared cooling-type area array detector, 30 μm as the single pixel size diameter, 320 × 256 as the number of pixels and 4 as the F-number. The width a of the single-step reflective surface of the roof-shaped stepped micromirror was 4 mm, and the number of left and right steps N was 8, so the magnification of the rear imaging system was −0.12. According to the numerical aperture formula NA′ = 1/2F, the image-side numerical aperture NA′b of the rear imaging system could be obtained as 0.125. Since the object-side numerical aperture of the rear imaging system had to match with the image-side numerical aperture of the front imaging system, the image-side numerical aperture of the front imaging system was NA′f = β × NA′b = 0.015. The lens array satisfied the matching relationship with the size of the roof-shaped stepped micromirror, so the size of a single lens was 4 mm, the focal length was 95 mm, the half field of view of the front imaging system was set to ω and 2ω = 2arctan √2b/2f′ was defined according to the field of view; the full field of view was 2ω = 1.7°.
3. System Optical Design and Evaluation
3.1. Analysis and Design of Collimation System and Lens Array
The collimation system was used to modulate the light of each field of view of the target into a collimated beam. In order to better judge the design results, the collimation system adopted a reverse design; that is, the imaging system with a parallel light incident was designed first, and then the designed system was turned over to obtain the collimation system. In order to solve the problem of optical aberration correction in the collimation system, aberration balancing was carried out by using the design of the refraction–diffraction hybrid lens.
For the transmission optical system, the refractive index of the lens was a function of the wavelength. Different wavelengths of light would have different focal lengths when passing through the lens, resulting in chromatic aberration [21].
The dispersion of a transmissive material is expressed by the Abbe number:
The Abbe number expression for the diffractive optical element is:
By analyzing the dispersion characteristics of optical elements, it can be shown that those of diffractive optical elements and transmissive optical elements are just opposite. Therefore, the chromatic aberration in the system can be effectively eliminated by combining the refractive element and the diffraction element.
We used a monolithic refractive and diffractive hybrid lens design. The first surface of the lens was set as the diffraction surface, and the second surface was set as the refractive surface. According to the focal degree distribution formula for traditional refractive and diffractive hybrid lenses:
In the formula, Φ, Φr and Φd are the focal powers of the collimation system, the refraction surface and the diffraction surface. Vr and Vd are the Abbe numbers of the transmissive material and the diffractive element. For rotationally symmetrical diffractive optical elements, the phase function is expressed as follows:
In the formula, r is the semi-diameter of the component, and Ai is the phase coefficient. A1 determines the focal power of the diffractive optical element, which satisfies the following relationship:
In the formula, m is the diffraction order, and m = 1. The central wavelength of the system is λ0 = 4.0 μm, and λ is the working wavelength. The lens material is germanium. Using the focal length of the collimation system combined with Formulas (6)–(8), the initial structural parameters of the refractive and diffractive hybrid lens could be obtained.
The field of view of the collimation system was the field of view of the front imaging system and equaled 1.7°, and its aperture D = 64 × √2 = 90.5 mm. We set the focal length of the collimation system as 181 mm and used the imaging formula to determine the size of the object imaged by the collimation system as 5.34 mm.
The parameters of the collimation system are shown in Table 2.

Table 2.
Collimation system parameters.
Figure 2a shows the optimized optical path layout for the collimating mirror, which adopted the refraction and diffraction hybrid design. Compared with the traditional collimation system, the number of lenses used and the overall weight of the system were greatly reduced. It can be seen from Figure 2b that the RMS value for the wavefront error of the collimation system wavefront was <λ/10, which proved that the system had good collimation. According to the lateral color diagram in Figure 2c, the chromatic aberration distributions of each wavelength were within the Airy disk, and the chromatic aberration of the collimation system was well-corrected.
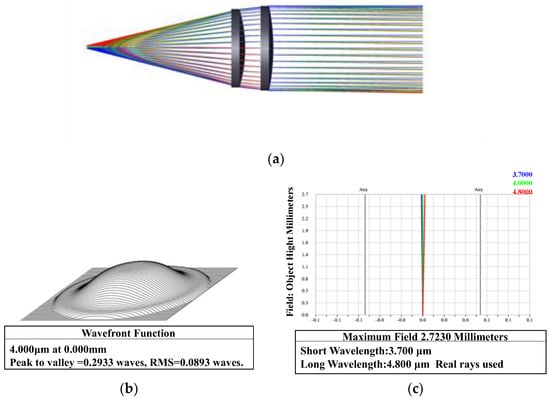
Figure 2.
Collimation system design results: (a) the collimator layout; (b) wavefront map; (c) lateral color diagram.
The imaging of the lens array onto the roof-shaped stepped micromirror surface had to meet the parallel emissions of the principal rays of each field of view to ensure that each interference channel had a fixed phase difference. An image-side telecentric optical path design was adopted and the diaphragm array was introduced to set it at the focal plane of the lens array object side to avoid imaging aliasing between channels. The size of the lens array corresponded to the size of the roof-shaped stepped micro-reflector to ensure mutual matching between the imaging unit and the interference unit. Therefore, the lens was designed as a square lens of 4 × 4 mm. Considering the problem of device spatial position conflicts in the post-assembly process, the focal length of the lens array had to be greater than the overall size of the roof-shaped stepped micromirror to avoid conflicts between the two layouts. Since the imaging surface was a stepped surface, it was also necessary to meet the requirement that the depth of focus of the lens array be greater than the depth of field of the rear imaging system.
In accordance with the mutual restrictive relationship between the size of the diaphragm and the angle of view, the design of the diaphragm was determined to be a 2 mm square aperture. The Fla number for the lens unit was determined to be 33.33 in order to effectively eliminate chromatic aberration. Using silicon as the design material for the lens array, the optimized focal length Fla for the lens unit was 94.266 mm, and its focal depth was ∆z = 4λ(Fla)2. Figure 3a shows the optical path diagram of the lens unit and the diaphragm, and Figure 3b,c show the Airy disk and the modulation transfer function of the lens unit imaging. Its image spot was within the Airy disk, and its transmission was close to the diffraction limit, so it had better imaging quality.
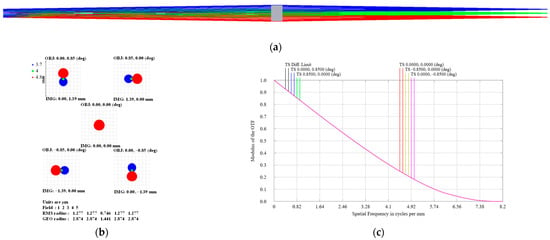
Figure 3.
Lens design results: (a) the layout of the lens unit; (b) the full-field spot diagram for the lens unit; (c) modulation transfer function.
3.2. Interference System Analysis and Design
The interference system consisted of two orthogonally placed roof-shaped stepped micromirrors and a beam splitter. Phase modulation is performed on the imaging light field of the lens array. The optical path structure is shown in Figure 4b. In accordance with the system requirements, the number of interference channels was 16 × 16, and the spectral resolution of the system was required to be less than 10 cm−1; the following design was implemented.
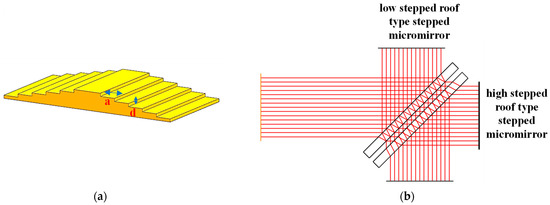
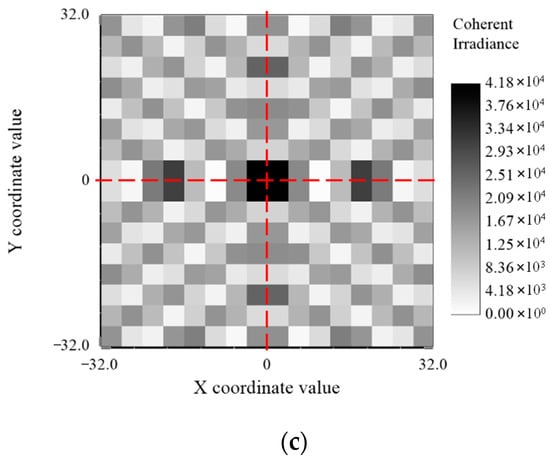
Figure 4.
Design results: (a) schematic diagram of a roof-shaped stepped micromirror; (b) the layout of the interference system; (c) interferogram.
The main parameters of the two roof-shaped stepped micromirrors were the height d of the low step, the height Nd of the high step, the width a of the step and the number of stages N in the step. The number of steps and the height of the steps determined the spectral resolution of the system. The maximum value of the optical path difference was equal to ∆(m,n)max = 2dN2. In accordance with the design requirements, the number of interference channels in the system was 16 × 16, so the number of steps used for the roof-shaped stepped micromirror was 16, there were 8 steps on the left and right sides each and the width of a single step was 4 mm to match the size of a single lens in the lens array. In order to achieve higher spectral resolution in the mid-wave infrared band, narrowband sampling was implemented in the system by adding a narrowband filter [22]. In order to ensure that the interferogram did not lose information during the sampling process, the sampling frequency of the interferometric system had to be greater than twice the bandwidth (unit: wavenumber) of the emission spectrum of the measured target; that is, Fs ≥ 2BW. Therefore, the maximum sampling interval for the interference system had to satisfy s ≤ 1/(2BW), and the step height d had to satisfy d ≤ 1/(4BW). If the low step height was 10 μm, the high step height would have to be 80 μm and the sampling interval 20 μm, while the maximum optical path difference of the system would be 1280 μm and the calculated spectral resolution ∆υ = 1/∆(m,n)max = 7.8 cm−1, making it possible to meet the design requirements. The two roof-shaped stepped micromirrors divided the image plane into four center-symmetrical interference images, as shown in Figure 4c, matching with the four polarization channels of the polarizer array and making it possible to realize the instantaneous acquisition of interference images in four polarization directions.
The parameters of the roof-shaped stepped micromirror are shown in Table 3.

Table 3.
Roof-shaped stepped micromirror design index.
3.3. Analysis and Design of Rear Imaging System
The rear imaging system was the second imaging system, and the optical parameters had to match the front imaging system. Since the front imaging system was designed for the image-space telecentric optical path, in order to reduce the field of view distortion (<0.15%) at the edge of the system and achieve accurate spectral reconstruction, the rear imaging system was designed to match the object-space telecentric optical path. In order to eliminate the chromatic aberration in the system, the rear imaging system adopted a four-chip design with a germanium-silicon material combination and a binary surface design for the second surface. After optimization, the two diffraction coefficients were A1 = −1.874 and A2= −483.174. The aberration caused by the beam splitter and the compensation plate, as well as the distribution of spatial positions, was also considered in the design. From the system parameters in Section 2.2, we obtained the design indicators for the rear imaging system shown in Table 4.

Table 4.
The design parameters for the rear imaging system.
The optical path structure diagram for the rear imaging system is shown in Figure 5a. Since the imaging target of the system was a heat source, the aperture of the system had to match the cold aperture of the detector to suppress the interference from stray light, such as the cold reflection of the system, in the system. Figure 5b shows the optical transfer function for the rear imaging system, which was greater than 0.5 at the characteristic frequency of 17 lp/mm. Figure 5c shows the imaging point diagram for the rear imaging system. It can be seen from the figure that the size of the Airy disk was 19.12 μm, which was smaller than the size of a single pixel, and the imaging spots of each field of view were all within the Airy disk. The image quality was good.
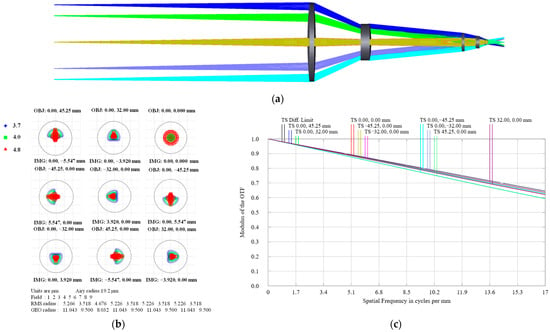
Figure 5.
Design results: (a) the layout of the rear imaging system; (b) the full-field spot diagram; (c) modulation transfer function.
The rear imaging system images the roof-shaped stepped micromirror, so the system had to have a depth of field greater than the maximum height difference caused by the roof-shaped stepped structure. According to Section 3.2, the maximum height difference N2d = 640 μm can be obtained from the high step height and the number of steps in the roof-type stepped micromirror. Therefore, the rear imaging system had to meet the system imaging requirements at 640 μm. Image quality evaluation was performed on the system at 640 μm, and the evaluation results shown in Figure 6 were obtained. The results show that the transfer function of the rear imaging system at the depth of field of 640 μm reached above 0.5 at the characteristic frequency of 17 lp, and the distortion was 0.1092%, which was less than 0.15%, meaning that it met the design requirements.
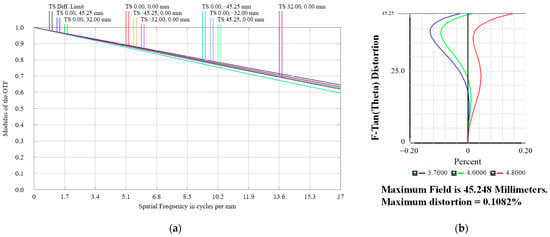
Figure 6.
Image quality evaluation at 640 μm: (a) modulation transfer function; (b) distortion curve.
3.4. Design and Error Analysis of Polarizer Array
The polarizer array was designed with a silicon substrate wire-grid polarizer, which met the working band of the system at 3.7–4.8 μm, and the extinction ratio was 1000:1. In accordance with the Stokes vector measurement principle for polarized light, the four polarization directions were set as 0°, 45°, 90° and 135°, and the polarization state of the target light field can be expressed by the Stokes vector as follows [23]:
In the formula, S0, S1, S2 and S3 are the four elements of the Stokes parameter. For I(45°, π/2), the former 45° represents the four polarization directions corresponding to the four channels of the polarizer array. The latter π/2 is the phase delay angle corresponding to the introduction of the phase compensator.
The degrees of polarization of the four elements according to the Stokes parameters are expressed as:
When light enters the system, the Mueller matrix of the linearly polarized channel can be expressed as:
where θ is the angle between the polarizing axis of the polarizer and the horizontal axis x. When the light is incident on different polarization channels of the polarization system, the relationship between the Stokes vector of the outgoing light and the Stokes vector of the incident light is [24]:
where θpi is the angle between the polarization axis of each polarizer in the polarization channel and the x-axis.
We foresaw that a polarization angle error would occur when the four different polarization channels of the polarizer array were manufactured. From Formulas (6)–(9), we knew that a polarization angle error would lead to errors in the Stokes vector measurement and then affect the polarization degree measurement error, so the polarization angle error was analyzed. We chose the method of controlling a single variable to ensure that the polarization direction angles of the other three channels were accurate. On this basis, we changed the polarization angle of the 90° polarization channel and recorded the light intensity values corresponding to the zeroth order of the target interference at intervals of 0.5 degrees of polarization error. We obtained the error values for each Stokes vector and the degree of polarization error after the error was introduced, as shown in Table 5. We processed the obtained results to obtain a diagram showing the relationship between the angle error and the measurement error (Figure 7). It can be seen from Figure 7 that the single-channel polarization angle error in the polarizer array had to be within 1.5° to ensure that the Stokes vector measurement error was less than 5% and the polarization degree measurement error was less than 1%. A detailed description of the derivation process is given in Appendix A.

Table 5.
The design parameters for the rear imaging system.
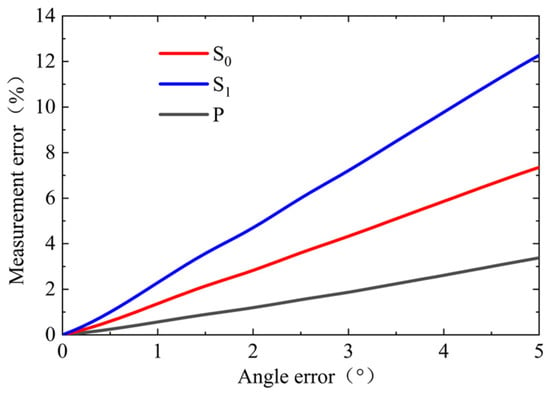
Figure 7.
Stokes vector and degree of polarization measurement error curve.
4. Experiment and Discussion
4.1. Geometric Optics Simulation Experiment
We used optical software to connect each subsystem and complete the geometric optics simulation experiment on target imaging. We obtained the optical structure distribution map for the PSIFTIS, as shown in Figure 8a. According to the imaging results shown in spot diagram in Figure 8b, the RMS radius of the image point was smaller than the Airy disk radius, meaning that the imaging requirements of the system were met.
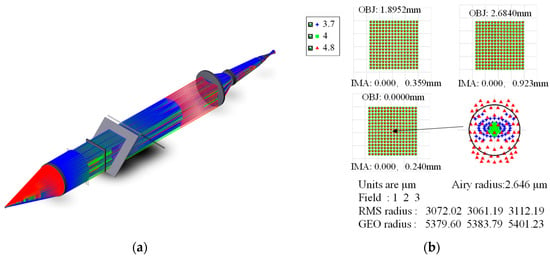
Figure 8.
PSIFTIS geometric simulation results: (a) optical system layout; (b) spot diagrams of central field of view.
4.2. Simulation Experiment of Graph Reconstruction
We conducted physical optics simulation experiments on the system to verify its polarization imaging and map reconstruction capabilities. The ray-tracing diagram of the system is shown in Figure 9a. Using the incident polarized light with a polarization direction of 63.43 degrees, the target was imaged, and the polarization interference image array for the target was obtained. Then, the polarization interference image information was segmented and registered to obtain the three-dimensional polarization interference intensity data cube Iθ(x,y,∆(m,n)), as shown in Figure 9c.
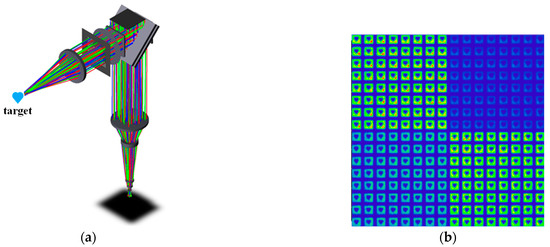

Figure 9.
Physical optics simulation: (a) ray-tracing diagram; (b) polarization interference image array; (c) polarization interference image array processing.
By selecting any pixel point (x, y) from the polarization interference three-dimensional data cube, we can obtain the corresponding interference intensity sequence diagram, as shown in Figure 10a. We used Formulas (1) and (2) to obtain the polarization spectrum information corresponding to a pixel point and the spectrum information corresponding to each Stokes vector. The reconstructed spectrum in the horizontal polarization direction is shown in Figure 10b, and the reconstructed spectral information corresponding to each polarization direction and the spectral information corresponding to each Stokes vector are shown in Figure 10c,d. It can be seen from the results that, compared to the spectral wavenumber corresponding to the target 4 μm wavelength, there was no peak position shift at the peak of the reconstructed spectrum. The simulation results prove that the system has a better ability to reconstruct the spectrum. The noise at the bottom was caused by the discrete sampling of the light source during the simulation, which resulted in crosstalk between adjacent imaging points.
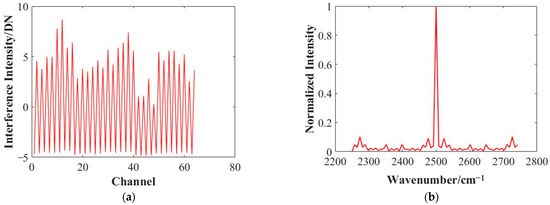
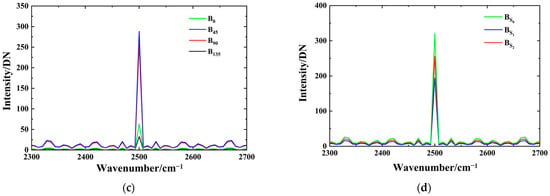
Figure 10.
Simulation map reconstruction: (a) interference intensity sequence for any pixel point; (b) reconstructed spectrum in horizontal polarization direction; (c) reconstructed spectra for each polarization direction; (d) reconstructed spectra for each Stokes vector.
4.3. Experiment Results
4.3.1. Polarization Diagram and Spectrum Detection Experiment
After processing the system, we set up an experimental platform in the laboratory environment and verified the system’s map detection performance by comparing the obtained experimental data with the ideal data. The system structure built is shown in Figure 11a.
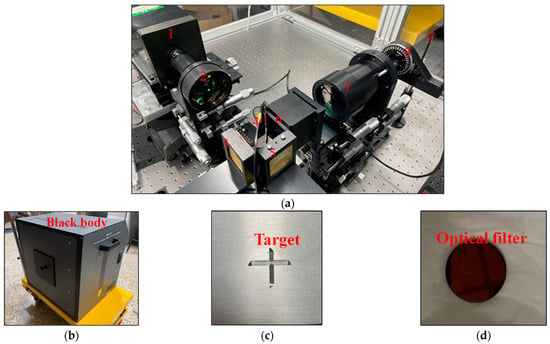
Figure 11.
Experimental platform: (a) a picture of the prototype of the PSIFTIS in a laboratory environment. 1—detector, 2—rear imaging system, 3—longitudinal roof-shaped stepped micromirror, 4—beam splitter, 5—transverse roof-shaped stepped micromirror, 6—lens array, 7—collimator, 8—polarizer array, 9—target; (b) black body; (c) experimental target; (d) optical filter.
In order to obtain the polarization spectrum information for the target, we used a black-body light source as an active light source. A polarizer was added behind the black body to simulate a linearly polarized light source with a polarization angle of 63°. The polarized image information shown in Figure 12a was finally obtained by irradiating the target with the T-shaped notch through the polarized light source. We selected a narrowband filter with center wavelengths of 3800 nm (2644.64 cm−1) and 4230 nm (2358.43 cm−1) and used the theoretical spectral information for the narrowband filter to perform spectral verification of the target.
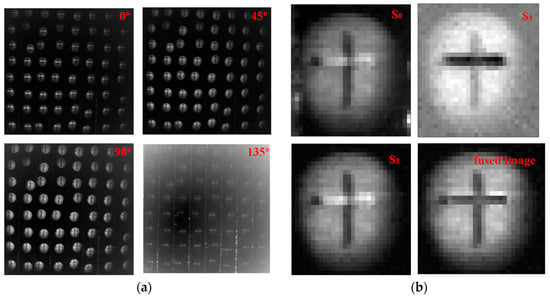
Figure 12.
Polarization image processing: (a) Four-quadrant polarized image array; (b) S0 vector image, S1 vector image, S2 vector image and fused image.
We selected the image corresponding to the zeroth interference order at a wavelength of 3800 nm, performed Stokes vector demodulation on its imaging information and obtained the Stokes vector diagrams corresponding to the targets S0, S1 and S2. It can be seen from the figure that the image corresponding to S1 had more obvious characteristics of the target in the horizontal direction, the image corresponding to S2 had obvious characteristics in the vertical direction and the overall brightness of the polarization image was more obvious than that of the total light intensity S0 image. The target eigenvalues of the Stokes vector S1 and S2 were extracted and fused to obtain the fused image, as shown in Figure 12b. The fused image could be seen, and the image recognition rate was higher. Compared with the S0 image, the introduction of polarization information helped the system to better identify the target.
Since the change in the polarization angle did not affect the shift in the peak position of the final reconstructed spectrum, the horizontal polarization image information was used. By segmenting and registering the polarization image array, the polarization interference data cube for the target was obtained, and the spectral information for the target was obtained using Formula (1). By comparing the standard spectrum and the measured spectra for narrowband filters (3800 nm, 4230 nm) with different central wavelengths, the comparison diagram shown in Figure 13a was obtained. The dotted line is the theoretical reconstruction spectrum corresponding to the narrowband filter, and the solid line is the experimental reconstruction spectrum measured by the instrument. The wavenumber corresponding to the peak position of the target’s actual measured spectrum was basically the same as the wavenumber corresponding to the peak position of the narrowband filter. The error was within one spectral resolution, and the actual spectral resolution of the system met the design requirements. Using the values for the reconstructed spectral peak of each polarization channel, we could determine the polarization state of the incident light. Figure 13b shows the reconstructed spectra corresponding to each polarization channel of the filter at 3800 nm. Figure 13c shows the spectra corresponding to each Stokes vector. The experimental results were consistent with the simulation results, and the system met the design requirements.
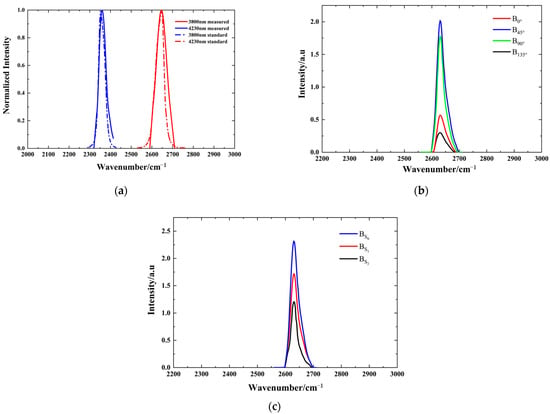
Figure 13.
Experimental map reconstruction: (a) the comparison chart showing the measured spectrum of the target in the horizontal polarization direction and the corresponding spectrum of the narrowband filter; (b) reconstructed spectra corresponding to each polarization channel; (c) the corresponding spectra of each Stokes vector.
We used Formula (2) to calculate that the polarization angle of the incident light was 62.47°, which was within one degree of the actual incident light polarization angle of 63°. The errors for the Stokes vectors S0, S1 and S2 were 2.5%, 4.6% and 3.1%, respectively, which were all less than 5% and, therefore, met the design requirements.
4.3.2. Wideband Detection Experiment and Gas Detection Experiment
As the spectrometer used narrowband sampling and the sampling bandwidth was 250 cm−1, the bandwidth had to be less than or equal to a 250 cm−1 filter; otherwise, spectral aliasing would occur. We chose a narrowband filter with central wavelengths of 4510 nm, 4628 nm and 4720 nm to reconstruct the spectrum. Then, the coinciding part of the narrowband sampling wavenumber interval (where the normalized spectral value was 0.5) was spliced to obtain the calibrated wideband spectrum for the multi-narrowband splicing, as shown in Figure 14a. The black dotted line is the theoretical radiation line of the black body at 80 °C. Figure 14c shows the two spectral residual diagrams after calibration. According to the distribution curve of the residual map, the spliced spectrum was largely consistent with the original measured spectrum.
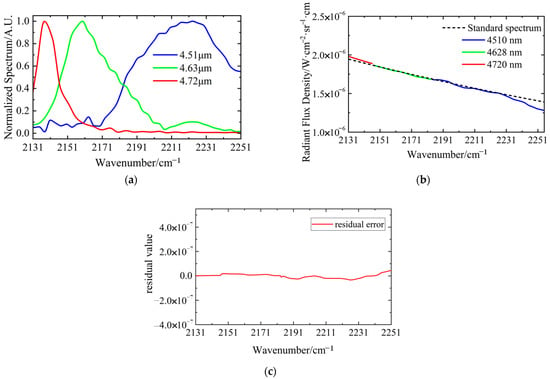
Figure 14.
Experimental results: (a) the original measured spectra for the three narrowband filters; (b) the spectra after calibration and splicing; (c) residual diagram of measured spectrum and standard spectrum.
We also carried out spectral measurement experiments with carbon monoxide gas. The experimental device is shown in Figure 15a. The concentration of carbon monoxide in the gas pool was 10%. We chose narrowband filters with central wavelengths of 4510 nm, 4628 nm and 4720 nm. The transmittance spectrum was obtained by applying data processing to the interference image. The final spectral data are shown in Figure 15b. The measured results show that the absorption spectra obtained were in good agreement with the theoretical spectra.
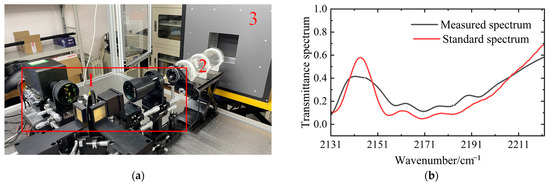
Figure 15.
Experimental results: (a) diagram of the experimental device. 1—PSIFTIS, 2—carbon monoxide gas pool, 3—black body; (b) the comparison between the measured spectrum and the actual spectrum.
The error was caused by the interference from the experimental environment, the non-uniform spectral response of the detector and the non-uniform transmittance of the anti-reflective coated lens in the spectral response range.
4.4. Discussion
We obtained the polarization image and reconstructed the spectral lines of the target through experiments. Although there was a certain eccentricity in the polarization interference image array, it did not affect the later interference sampling. It is necessary to improve the machining accuracy during the processing of lens arrays. If the eccentricity is too large, it is necessary to correct it in the later image processing. The instrument improves data collection efficiency through an infrared system structure combining a polarizer array and lens array. It makes up for the deficiency of the imaging spectrometer in realizing the polarization snapshot function in the infrared band.
In addition, regarding the polarization image, the images of each polarization direction for the target object, the images of each Stokes vector and the image fusing the Stokes vectors were given here. The polarization angle image, the image of the S3 component and the fused image of the polarization degree and polarization angle were not shown. This was because a linearly polarized light source was used in the experiment, the Stokes parameter S3 component was zero and the polarization angle was the angle between the long axis and the horizontal axis of the polarization ellipse, so the polarization angle image could not be given. At a later stage, to obtain the target polarization angle image and the fusion image of the polarization angle and polarization degree, the polarization state of the incident light can be changed and a phase retarder added in front of the polarization channel corresponding to the 45° and 135° polarization directions. This part of the work will be carried out with the further performance improvements of the system and will not be elaborated here.
5. Conclusions
This paper initially introduced a PSIFTIS based on a roof-shaped stepped micromirror as the interference core. Then, we introduced the basic working principle for the system, provided the structural parameters for each subsystem and described the design of the whole optical system. An optical simulation experiment was carried out, and the simulation results for the reconstructed spectrum without a peak shift were obtained. We verified the feasibility of the system’s spectral reconstruction principle. Finally, a spectrum reconstruction experiment for the optical system was carried out on the experimental platform. We validated the advantage of polarization imaging through the complementarity between the individual Stokes vector images. At the same time, in accordance with the corresponding reconstructed spectral lines under the filter with a wavelength of 3800 nm, we obtained experimental results showing that the polarization angle error was within 1°, the reconstructed spectrum error was within one resolution and the Stokes measurement errors were 2.5%, 4.6% and 3.1%. The experiments confirmed that the system could perform polarization spectrum detection, had a high spectral resolution of 7.8 cm−1 and had a low Stokes vector measurement error (less than 5%). We also carried out wideband detection experiments and achieved satisfactory results.
Author Contributions
Conceptualization, H.T. and J.L. (Jinguang Lv); methodology, H.T. and J.L. (Jinguang Lv); validation, H.T., J.L. (Jinguang Lv), B.Z. and Y.C.; investigation, H.T., G.L., Y.Z. and K.S.; resources, Y.C.; writing—original draft preparation, H.T.; writing—review and editing, J.L. (Jingqiu Liang) and W.W.; supervision, Y.Q. and K.Z.; funding acquisition, J.L. (Jingqiu Liang). All authors have read and agreed to the published version of the manuscript.
Funding
This research was funded by the Jilin Scientific and Technological Development Program under grants 20230201049GX, 20230508141RC and 20230508137RC; the National Natural Science Foundation of China under grants 61805239, 61627819 and 61727818; the Youth Innovation Promotion Association Foundation of the Chinese Academy of Sciences under grant 2018254; and the National Key R&D Program of China under grant 2022YFB3604702.
Institutional Review Board Statement
Not applicable.
Informed Consent Statement
Not applicable.
Data Availability Statement
Not applicable.
Acknowledgments
We gratefully acknowledge Jun Ren for useful discussion and help in the optical design and experiment.
Conflicts of Interest
The funders had no role in the design of the study; in the collection, analyses or interpretation of data; in the writing of the manuscript; or in the decision to publish the results.
Appendix A
The derivation in Table 5 was the result of simulation analysis and calculation. The detailed derivation process was as follows: Firstly, using Formula (8), we obtained the Mueller matrix parameters for each polarization channel. When the angle error θ’ occurred in a certain polarization channel, the Muller matrix was changed to:
We kept the polarization directions of the other three polarization channels unchanged and introduced θ′ error into the 90° polarization channel. In the optical simulation software, we designed the polarizer array after introducing errors and input the corresponding matrix parameters. We performed operations such as image segmentation, image registration and inverse Fourier transformation on the obtained polarization image array. Finally, the spectral peak information for each polarization channel was obtained using Formula (1).
According to the formula:
We could obtain the spectral peak information for the Stokes vector after introducing the polarization angle error. Finally, the measurement error range was obtained by comparing it with the original Stokes vector.
In the formula, n is 0,1. Similarly, the degree of polarization error could also be calculated.
References
- Zhao, Y.; Zhang, L.; Pan, Q. Spectropolarimetric imaging for pathological analysis of skin. Appl. Opt. 2009, 48, 236–246. [Google Scholar] [CrossRef] [PubMed]
- Herten, G.V.; Boer, J.D.; Rietjens, J.H.H.; Noia, A.D.; Snik, F.; Volten, H.; Smit, J.M.; Hasekamp, O.P.; Henzing, J.S.; Keller, C.U. Atmospheric aerosol characterization with a ground-based SPEX spectropolarimetric instrument. Atmos. Meas. Tech. 2014, 12, 4341–4351. [Google Scholar] [CrossRef]
- Jones, S.H.; Iannarilli, F.J.; Kebabian, P.L. Realization of quantitative-grade fieldable snapshot imaging spectropolarimeter. Opt. Express 2004, 12, 6559–6573. [Google Scholar] [CrossRef] [PubMed]
- Liu, Y.; Gu, Z.; Li, T. Method for modeling polarization characteristics of radar target. Foreign Electron. Meas. Technol. 2017, 36, 44–47. [Google Scholar]
- Snik, F.; Karalidi, T.; Keller, C.U. Spectral modulation for full linear polarimetry. Appl. Opt. 2009, 48, 1337–1346. [Google Scholar] [CrossRef] [PubMed]
- Thyparambil, A.A.; Yang, W.; Latour, R.A. Experimental characterization of adsorbed protein orientation, conformation, and bioactivity. Biointerphases 2015, 10, 019002. [Google Scholar] [CrossRef] [PubMed]
- Halajian, J.D.; Hallock, H.B. Computerized Terrain Mapping System. US3864513, 4 February 1975. [Google Scholar]
- Kohzo, H.; Hirokimi, S.; Hiromichi, Y.; Hirokimi, K.; Michio, S. Application of an Imaging spectropolarimeter to agro-environmental sciences. Proc. SPIE 2004, 5234, 638–647. [Google Scholar]
- Kohzo, H.; Hirokimi, S.; Hirohisa, K.; Hiromichi, Y. Outdoor experiments of LCTF spectropolarimeters for earth observation. Proc. SPIE 2004, 5234, 628–637. [Google Scholar]
- Kim, J.; Escuti, J.M. Snapshot imaging spectropolarimeter utilizing polarization gratings. Proc. SPIE 2008, 7086, 29–38. [Google Scholar]
- Zhao, Y.; Pan, Q.; Zhang, H. Material classification based on multi-band polarimetric images fusion. In Polarization: Measurement, Analysis, and Remote Sensing VII; International Society for Optics and Photonics: Washington, DC, USA, 2006. [Google Scholar]
- Zhao, Y.; Pan, Q.; Zhang, H. Fuse spectropolarimetric imagery by D-S reasoning. In Polarization: Measurement, Analysis, and Remote Sensing VII; International Society for Optics and Photonics: Washington, DC, USA, 2006. [Google Scholar]
- Zhao, Y.; Gong, P.; Pan, Q. Object detection by spectropolarimeteric imagery fusion. IEEE Trans. Geosci. Remote Sens. 2008, 46, 3337–3345. [Google Scholar] [CrossRef]
- Gao, P.; Hu, X.; Guo, G.; Kang, Y.; Ai, J.; Wang, X. Modified Sagnac imaging spectropolarimeter for full linear Stokes parameters. Europhys. Lett. 2018, 124, 54003. [Google Scholar] [CrossRef]
- Zhang, R.; Wang, Z.; Li, K.; Chen, Y.; Jing, N.; Qiao, Y.; Xie, K. Spectropolarimetric measurement based on a fast-axis-adjustable photoelastic modulator. Appl. Opt. 2019, 58, 325–332. [Google Scholar] [CrossRef] [PubMed]
- Qin, X. Research on Infrared Polarized Light Imaging. Master’s Thesis, Changchun University of Science and Technology, Changchun, China, 2020. [Google Scholar]
- Bo, J.; Gu, Y.; Xing, W.; Ju, X.; Yan, C.; Wang, X. Spatially modulated snapshot computed tomographic polarization imaging spectrometer. Appl. Opt. 2021, 60, 5861–5865. [Google Scholar] [CrossRef] [PubMed]
- Kawabata, Y.; Katsukawa, Y.; Kubo, M.; Shinoda, K.; Tsuzuki, T.; Uraguchi, F. Polarimetric calibration of a spectropolarimeter instrument with high precision: Sunrise chromospheric infrared spectropolarimeter (SCIP) for the SUNRISE III balloon telescope. Appl. Opt. 2022, 61, 9716–9736. [Google Scholar] [CrossRef] [PubMed]
- Gu, Y.; Lv, J.; Bo, J.; Zhao, B.; Chen, Y.; Tao, J.; Qin, Y.; Wang, W.; Liang, J. Joint Dense 3D Reconstruction Method for Endoscopic Images of Weak Texture Scenes. IEEE Access 2021, 9, 138254–138266. [Google Scholar] [CrossRef]
- Zhao, B.; Lv, J.; Ren, J.; Qin, Y.; Wang, W. Data processing and performance evaluation of a tempo-spatially mixed modulation imaging Fourier transform spectrometer based on stepped micro-mirror. Opt. Express 2020, 28, 6320–6335. [Google Scholar] [CrossRef] [PubMed]
- Wang, H. Mid-Wave Infrared Spectral Polarization Imaging Technology and System Research. Ph.D. Dissertation, Changchun Institute of Optics, Fine Mechanicsand Physics, Chinese Academy of Sciences, Changchun, China, 2018. [Google Scholar]
- Zheng, Y.; Liang, J.; Liang, Z. Design and fabrication of step mirrors used in space-modulated Fourier transform infrared spectrometer. Opt. Express 2013, 21, 884–892. [Google Scholar] [CrossRef] [PubMed]
- Luo, Y.; Chen, Z. Measuring Principle and Measuring Method Design of Polarized Stokes Parameters. Adv. Lasers Optoelectron. 2009, 6, 54–58. [Google Scholar]
- Azzam, R.M. Stokes-vector and Mueller-matrix polarimetry. J. Opt. Soc. Am. A Opt. Image Sci. Vis. 2016, 33, 396–1408. [Google Scholar] [CrossRef] [PubMed]
Disclaimer/Publisher’s Note: The statements, opinions and data contained in all publications are solely those of the individual author(s) and contributor(s) and not of MDPI and/or the editor(s). MDPI and/or the editor(s) disclaim responsibility for any injury to people or property resulting from any ideas, methods, instructions or products referred to in the content. |
© 2023 by the authors. Licensee MDPI, Basel, Switzerland. This article is an open access article distributed under the terms and conditions of the Creative Commons Attribution (CC BY) license (https://creativecommons.org/licenses/by/4.0/).