Abstract
In situ, real-time, and non-destructive monitoring of the synthesis of nanomaterials is essence crucial for the development and prospective applications of nanoscience and nanotechnology. Reflection interference spectroscopy technology was used to systematically monitor the synthesis process of a transparent (ZnCl2-ZnO)/NpAA composite film which consists of ZnCl2-ZnO nanosheets formed by ZnCl2 precursor solution on the top surface of the substrate layer of nanoporous anodic alumina. Some significant results are found, e.g., the curve of effective optical thickness with time can be divided into three stages, corresponding to the synthesis process of ZnCl2-ZnO; and more, these films generated from ZnCl2 precursor solution with different concentrations, such as 0.05 M, 0.07 M, 0.085 M, or 0.1 M, can be directly distinguished according to the characteristics of the three stages.
1. Introduction
Nano-composite thin films have excellent physical and chemical characteristics [1,2,3], such as quantum size effect, small size effect, surface effect, etc., and have been successfully applied in scientific research, life and health, aerospace industry, national defense construction, and other special fields [4,5,6,7,8]. With the development of nanotechnology and in-depth research on nanomaterials, effective technologies for preparing composite thin films have been becoming more mature [9]. Therefore, nano-composite films with various unique nanostructures (e.g., nanoparticles, nanorods, nanowires, or nanosheets) and diverse functions play an unprecedented role in practical applications and promote the unconventional development of relevant cutting-edge fields [10,11]. Currently, nanosheet-based composite films are one of the frontier research hotspots in the field of manufacturing and application [12,13]. For example, nanosheet composite films with highly specific surfaces can enhance the conversion efficiency of solar cells, which is the key to developing high-efficiency and long-life green cells [14]. The membrane with highly ordered nanosheets can be served as an impactful platform for biomedical sensors [15,16], which might be a breakthrough for the development of clinical medical sensors with high sensitivity and accuracy.
The characteristics of a piece of nanosheet, such as the size, physical and chemical properties, and spatial location and distribution, depend heavily on the precursor, manufacturing conditions, processes, etc. In order to prepare nanosheet composite films that meet the practical applications, on the one hand, it is necessary to understand and quantitatively master various factors affecting film preparation. On the other hand, real-time monitoring and feedback on film growth are required so that the relevant parameters can be regulated timely [17]. In recent years, monitoring techniques, such as electron microscopy and atomic force microscopy, are commonly used to monitor the film preparation process. These technologies are accurate and visual but may directly contact and damage samples. Moreover, the instruments are large and costly, which is not available for real-time monitoring. Therefore, it is still an outstanding and open challenge in the field of nano-manufacturing to develop monitoring technologies and devices with advantages like increased accuracy, sensitivity, real-time responsiveness, and non-destructive capabilities.
Reflection interference spectroscopy (RIfS) is a highly sensitive, non-destructive, real-time optical detection and analysis method based on white light interference [18]. When a beam of light strikes the sample surface, it will be reflected from the upper and lower surfaces. These reflected beams will interfere, and then the interference spectrum will carry the structural characteristics of the material obtained [19,20]. Very small changes in the physical thickness and/or refractive index of the measured thin film can be accurately recorded by the interference spectra and displayed through the effective optical thickness (EOT). Therefore, RIfS technology has been widely used in the fields of food safety [21,22], biomedical sensing [23,24,25], single molecule interactions [26,27], pharmaceutical analysis [28,29,30], and environmental safety [31,32,33]. Recently, Kumeria and Losic reported that the gold ions in the aqueous environment were successfully detected without labeling using the RIfS method [34]. Pacholski et al. distinguished two-layer porous silicon structures with different inner diameter channels by continuously monitoring the changes of EOT at a specific location [35].
It is a widely used and effective method to synthesize various nanomaterials using nanoporous anodic alumina (NpAA) membranes as templates [36,37]. Not only the morphology (pore size, hole depth) of NpAA can be controlled, but also the physical and chemical properties are very stable. In our previous research [38,39], a kind of nanosheet composite films of metal chlorides grown on the top surface of NpAA [40,41] (such as (ZnCl2-ZnO)/NpAA, (CuCl2-CuO)/NpAA) have been utilized as solid-stated substrates for SERS technology, playing an important role in studying the properties of single molecules and demonstrating broad application prospects. In order to manufacture these composite films with uniform and stable structures in a large area and in large batches, and to understand factors affecting morphology and spatial structure. This paper will develop RIfS technology and try to establish a monitoring and analysis model that can feedback and directly reveal the synthesis process of the nanocomposite films.
2. Materials and Methods
2.1. Materials
Ultra-high purity aluminum foils (99.999%) were purchased from the General Research Institute for Nonferrous Metals, Beijing, China. Acetones (CH3COCH3), ethanol (CH3CH2OH), and sulfuric acid (H2SO4) were purchased from the Sanpu Chemical Reagent Company, Xi’an, China. Phosphoric acid (H3PO4) was purchased from the Gaolong Phosphorus Chemical Company, Xiangyang, China. Chromium trioxides (Cr2O3), sodium hydroxide (NaOH), copper chloride (CuCl2), oxalic acid (C2H2O4·2H2O) and zinc chloride (ZnCl2) were purchased from the Damao Chemical Reagent Company, Tianjin, China. All chemical reagents were of analytical grade purity and used as received without further purification.
2.2. Synthesis of (ZnCl2-ZnO)/NpAA Film
The fabrication of NpAA substrates was completed by using the standard two-step anodic oxidation method in a self-made electrolyte reactor as previously described [42]. The production of ZnCl2-ZnO nanosheets on the substrate NpAA mainly includes removing the back aluminum layer, then the prepared NpAA membrane was suspended into a glass container with 2.48 M CuCl2 solution, the back aluminum layer was removed by replacement reaction, and finally, the NpAA substrate with proper thickness and good light transmittance was created. Then, prepared the precursor solution, ZnCl2 powder with the appropriate amount was dissolved into various precursors solutions of different concentrations, i.e., 0.03 M, 0.05 M, 0.07 M, 0.085 M, and 0.1 M. After that, using a pipette to take a certain amount of precursor solution and drop it onto the surface of NpAA substrate, kept about 3 h, then carefully cleaned the solution with test paper, subsequently placed these films on the objective table of RIfS system and the spectrometer automatically and continuously recorded. During experiments, the samples were placed in a clean environment and maintained at a temperature of 25 °C and a humidity of 40%RH.
2.3. Characterization
The morphologies of the surface and cross-section of the substrate NpAA and the surface of (ZnCl2-ZnO)/NpAA composite films were characterized by scanning electron microscopy (SEM, Thermo Fisher, Apreo S, Waltham, MA, USA). The elemental composition and crystal structure of the film were carried out by X-ray spectrometry (EDX, Thermo Fisher, Apreo S, Waltham, MA, USA) and X-ray diffractometer (XRD, Bruker, D8 Advance, Karlsruhe, Germany).
2.4. RIfS Experimental Setup
Figure 1 is the schematic diagram of the experimental setup.
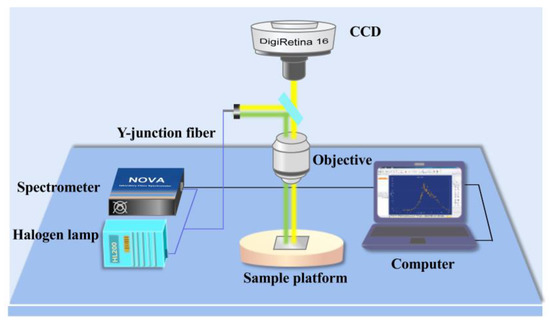
Figure 1.
Schematic diagram of the experimental setup.
As shown in Figure 1, the light beams from white light source passed through one branch of the Y-type optical fiber and were focused by an object lens (20×, Olympus, Tokyo, Japan) to illuminate the sample. The reflected signals from the test object were collected by the other branch of the Y-type optical fiber and fed back to the spectrometer (NOVA, Idea Optical, Shanghai, China). All data were eventually collected and processed by a computer, where the interference spectra are converted into the effective optical thickness (EOT) with film characteristics by the fast Fourier transform (FFT). The EOT is defined as
where n and L are the refractive index and the thickness of the film, respectively, it directly indicates some characteristics of the detected sample. CCD (Evolve 512, Pooher, Shanghai, China) was used to determine the position of the testing sample. During experiments, the light spot size was kept at about 2 mm, and all reflected interference data in the spectral range of 325 nm to 1200 nm are collected.
EOT = n × L
3. Results and Discussion
3.1. Morphology, Structure, and Composition of the Film
The SEM images of the (ZnCl2-ZnO)/NpAA composite film are plotted in Figure 2. Figure 2a displays a typical SEM image of the top surface of the (ZnCl2-ZnO)/NpAA composite film. It can be clearly found that the prepared (ZnCl2-ZnO)/NpAA composite film has a double-layer structure. The upper layer was a thin film composed of upright nanosheets. The lower layer was the NpAA substrate (marked with yellow ellipses). These nanosheets were synthesized from a 0.05 M ZnCl2 precursor solution on the surface of the NpAA substrate. The size of the individual nanosheet was different, with the average thickness being ~35 nm and the average length being <2 μm. The nanosheets were positioned in an irregular arrangement, such as being parallel or interlaced with each other. It is worth pointing out that the (ZnCl2-ZnO)/NpAA composite film has been placed in a normal indoor environment for about 1 year, and it can be clearly seen that the nanosheet structure was still almost intact, indicating that the structure of (ZnCl2-ZnO)/NpAA composite film is stable, durable, and easy to preserve without the necessity of special protective environment.
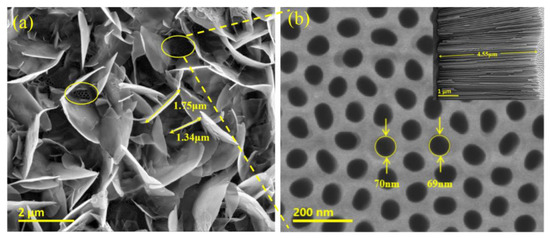
Figure 2.
SEM images of (a) the top surface of (ZnCl2-ZnO)/NpAA composite film; (b) the top surface of NpAA substrate, the insert shows the cross-section feature of the NpAA substrate.
Figure 2b shows the surface morphology of the NpAA membrane. It can be seen that a large number of regular circular pores were closely arranged in the form of hexagonal cells, parallel to each other and perpendicular to the bottom (as shown in the insert). The sample was prepared with about 2 h for the secondary anodic oxidation and 1.5 h for pore expansion, the average diameter, and depth of the nanopores were about 70 nm and 4.5 μm, respectively.
Figure 3 shows the X-ray diffraction pattern and energy dispersive X-ray spectra of the elemental composition of (ZnCl2-ZnO)/NpAA composite films. The main diffraction peaks shown in Figure 3a, such as the 34.901°, 38.341°, 43.360°, and 54.500° correspond to the monoclinic ZnCl2 (JCPDF No.72-0537), and the 68.995° and 78.080° match the hexagonal crystal system of ZnO (JCPDF No. 80-0074). The above data indicate that the upper layer of (ZnCl2-ZnO)/NpAA composite film consists of ZnCl2 and ZnO, where the ZnO was formed by the reaction of Zn2+ with oxygen atoms in the air and solution. Figure 3b is the EDX spectrum of (ZnCl2-ZnO)/NpAA composite film, elements such as Zn, O, Cl, Al, and C were detected from the samples (C was caused by the detection instrument and the work environment), which were consistent with the conclusion of XRD.
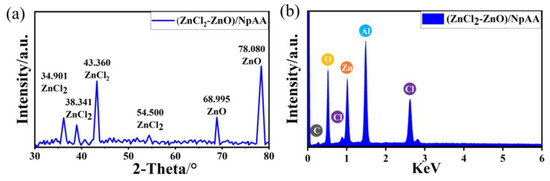
Figure 3.
Elemental composition of (ZnCl2-ZnO)/NpAA film. (a) X-ray diffraction pattern, (b) energy dispersive X-ray spectra.
3.2. Factors Affecting the Configuration of (ZnCl2-ZnO)/NpAA Composite Film
The main factors affecting the (ZnCl2-ZnO)/NpAA composite film include precursor concentration, synthesis time, NpAA substrate structure (pore depth, pore diameter), and so on. Using RIfS technology, the processes of forming ZnCl2-ZnO nanosheets from ZnCl2 precursor solutions with different concentrations were continuously monitored, and the characteristics of the production process of (ZnCl2-ZnO)/NpAA composite film were systematically investigated and analyzed. The analytical model to be established mainly includes three characteristic curves and their variation rules and tendencies, that is, the original interference spectrum at a certain moment; the EOT spectrum processed by FFT; and the EOT value of the whole composite film with time, the EOT − t curve.
3.2.1. Synthesis Time
The production process of ZnCl2-ZnO nanosheets growing on the NpAA substrate with 0.1 M precursor ZnCl2 solution and forming a composite film, which was investigated by RifS technology was shown in Figure 4. During experiments, the interference spectrum at a certain moment was recorded non-destructively by the RIfS system (Figure 4a); and then, the corresponding EOT value was calculated through FFT (Figure 4b), there were two peaks because the (ZnCl2-ZnO)/NpAA film was composed of two layers; subsequently, sorting and grouping the EOT values monitored at different moments, the characteristic curves of EOT values over time for the entire composite film (Figure 4c) was accomplished.
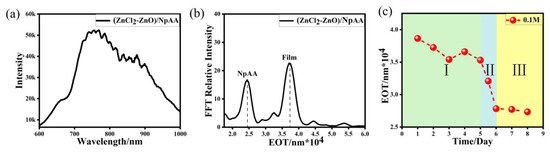
Figure 4.
(ZnCl2-ZnO)/NpAA composite film prepared with 0.1 M ZnCl2 precursor solution. (a) interference spectrum at 72 h. (b) Effective optical thickness spectrum dealt with fast Fourier transform. (c) Effective optical thickness over time curve.
As shown in Figure 4a, the interference spectrum was obtained at 72 h, which carried the characteristic information about the nanocomposite film, but it cannot be analyzed directly and distinguished clearly. Figure 4b is the corresponding EOT characteristic spectrum of the nanocomposite film. It can be clearly observed that two distinct peaks with the abscissa of 2.40 and 3.79. After comparing with the initial EOT value of NpAA, the peaks can be identified as representing the EOT values of the NpAA lower layer and the entire nanocomposite film, respectively. Figure 4c is the EOT0.1 M − t curves, it can be found that the EOT0.1 M value changing with time can be divided into three distinct stages: stage I, the EOT0.1 M values slightly fluctuate around 3.65 over a period of time, and overall there was a small decrease; stage II, in a short period of time, the EOT0.1 M decreased rapidly to a lower value, changing from 3.53 to 2.78; stage III, the EOT0.1 M values kept a constant, about 2.73, without obvious change. There were differences in the duration of the three stages, e.g., stage I lasts for 5 days, stage II only has one day, and then it was maintained in stage III.
In order to accurately analyze and understand the corresponding relationship between the EOT0.1 M − t curve (as shown in Figure 4c) and the production characteristics of (ZnCl2-ZnO)/NpAA composite film, the morphologies of films (prepared with 0.1 M ZnCl2 precursor solution) grown at different times were characterized with SEM imaging as shown in Figure 5. Figure 5a–c corresponds to the composite film grown after 3, 5, and 7 days, respectively.
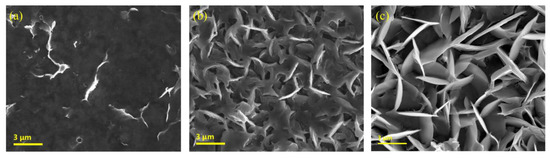
Figure 5.
SEM images of the (ZnCl2-ZnO)/NpAA composite film grown at (a) 3rd day, (b) 5th day, and (c) 7th day.
As shown in Figure 5a, the synthesis time was 3 days, it can be observed that the surface exhibits a layer of mucous film, only a few sporadic nanosheets, the upper thin-film composited of the nanosheet was not formed, and the substrate pores were completely covered. When the synthesis time was 5 days (Figure 5b), ZnCl2-ZnO nanosheets began taking shape; however, the composite film has not yet fully formed. The completely vertical sheet structure has not been formed, the size of the nanosheets was relatively smaller, the spacing between nanosheets was also very small, the bottom part of the nanosheets seemed to be gel-like shape and the pores of the substrate were still almost completely covered. When the synthesis time continues to 7 days (Figure 5c), the ZnCl2-ZnO nanosheets have been completely formed. These nanosheets were perpendicular to the substrate surface and intersect with each other, the (ZnCl2-ZnO)/NpAA composite film has been accomplished, and several pores in the substrate can be seen occasionally.
Comparing the structural configuration of ZnCl2-ZnO nanosheets grown after 5 days (Figure 5b) with that grown after 3 days (Figure 5a), it can be found that the number of nanosheets increased significantly, the number was rare on the 3rd day while it was already much more on the 5th day, although the sheet-like structure on the 5th day was still not perfect. Comparing the film on 5th day (Figure 5b) with on the 7th day (Figure 5c), the nanosheets have been completely formed and the synthesis process has been completed, the number of nanosheets has further increased. Because of the different synthesis times experienced, the morphology and structural configuration of the (ZnCl2-ZnO)/NpAA composite membranes shown in Figure 5a–c are clearly different, which correspond to the three stages of the EOT0.1M − t curve shown in Figure 4c.
3.2.2. Concentrations of ZnCl2 Precursor Solution
Figure 6 shows the EOT − t characteristic curves of composite films synthesized from ZnCl2 precursor solution of different concentrations such as 0.05 M, 0.07 M, and 0.085 M. From Figure 6a–c, it can be clearly found that the variation EOT − t curves were all the same as the changing trend of the 0.1 M precursor solution curves as shown in Figure 4c; that is, there were three distinct stages as follows: stage I, EOT value fluctuates around a constant and overall has a downward trend over a period of time; stage II, EOT value drops to a relatively small value; stage III, EOT value has stabilized without obvious change. However, after careful analysis, it can be easily discovered that there were obvious differences between the characteristic EOT − t curves of different precursor concentrations. For example, the moment at which the fast decrease begins (i.e., the starting moment of stage II) was different when the concentration of the precursor solution was different. When the precursor concentration was 0.05 M, the curve entered stage II after 3 days (Figure 6a), while the starting time was about 3.5 days (Figure 6b) and 4.5 days (Figure 6c) as the precursor concentrations were 0.07 M and 0.085 M, respectively. Additionally, on the 5th day, the precursor concentration was 0.1 M (Figure 4c). It is thus clear that the higher the concentration of precursor ZnCl2, the longer the duration of stage I, i.e., the later the beginning time of stage II.
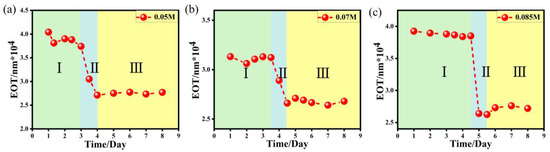
Figure 6.
Effective optical thickness over time curves of (ZnCl2-ZnO)/NpAA composite films prepared with various concentrations of ZnCl2 precursor solution: (a) 0.05 M, (b) 0.07 M, and (c) 0.085 M.
Comparing EOT − t characteristic curves as shown in Figure 4c and Figure 6, it is obvious that the higher the concentration of ZnCl2 precursor, the longer the duration required to completely synthesize the nanocomposite film (i.e., the time for the end of stage II and the beginning of stage III). The main reason for this phenomenon may be that the higher the concentration of precursor solution, the larger the size of the ZnCl2-ZnO nanosheet formed (shown in Figure 7).
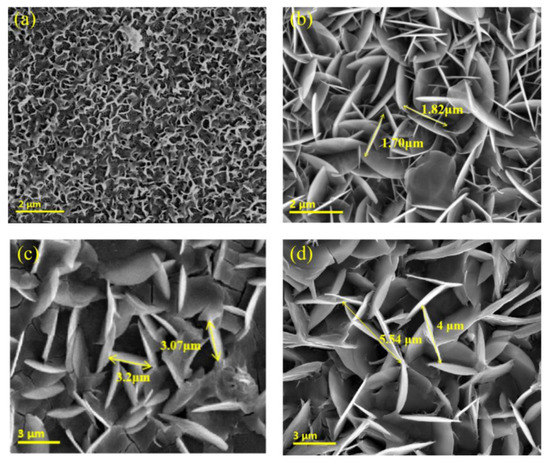
Figure 7.
SEM images of (ZnCl2-ZnO)/NpAA prepared with various concentrations of ZnCl2 precursor solution: (a) 0.03 M, (b) 0.05 M, (c) 0.07 M, and (d) 0.1 M.
Figure 7 is the (ZnCl2-ZnO)/NpAA composite films prepared with various concentrations of ZnCl2 precursor solutions, such as 0.03 M, 0.05 M, 0.07 M, and 0.1 M. All samples were detected after about 7 days of preparation. As shown in Figure 7a, it is the SEM image of the (ZnCl2-ZnO)/NpAA composite film produced with a precursor concentration of 0.03 M. It can be clearly observed that there were sparse nanosheet-like structures on the top surface of NpAA substrate, most sheet-like structures were not completely formed. Figure 7b–d are nanosheets synthesized with precursor concentrations of 0.05 M, 0.07 M, and 0.1 M, respectively. These nanosheets were perfectly accomplished and perpendicular to the substrate surface, densely interlaced.
It can also be observed from Figure 7 that the nanosheets grown with different precursor concentrations have different structural shapes, sizes, and thicknesses. Corresponding to the precursor concentration of 0.05 M, 0.07 M, and 0.1 M, the average length was 1.5 μm, 3.2 μm, and 4.5 μm, and the thicknesses were 35 nm, 90 nm, and 130 nm, respectively. That is, the size of the nanosheets enlarges as the concentration of the ZnCl2 precursor solution increases. Further, the number of nanosheets in an equal area will decrease as the precursor concentration increases. Comparing the number of nanosheets synthesized from precursor concentrations of 0.05 M and 0.07 M, it is obvious that the number of the former (Figure 7b) was more than that of the latter (Figure 7c); similarly, the number of nanosheets formed from 0.07 M precursor solution (Figure 7c) was more than that from 0.1 M precursor solution (Figure 7d).
Based on the EOT − t characteristic curves of RIfS technology, without interrupting the synthesis process or destroying the structure, it is not only possible to distinguish the concentration of the ZnCl2 precursor solution used to synthesize the (ZnCl2-ZnO)/NpAA nanocomposite film, but also forecast the completion time. In fact, before the experiment of preparing (ZnCl2-ZnO)/NpAA composite film using 0.085 M ZnCl2 precursor solution, according to the tendencies of EOT − t curves of composite films produced with 0.07 M (Figure 6b) and 0.1 M precursor solution (Figure 4c), it can be speculated that the phase transformation of ZnCl2 precursor should happen before the 5th day, and the nanosheets should achieve a relatively regular structure on the 6th day. Subsequently, the result is in agreement with our previous assumption.
4. Conclusions
In summary, the work fully demonstrates the characteristics of reflection interference spectroscopy technology, both in real-time and non-destructive, when it is used to monitor the process properties of the transparent (ZnCl2-ZnO)/NpAA composite films. Based on the real-time online data collected by the spectrometer, the original interference spectrum at a certain moment is generated. Then, the characteristic curve EOT − t is obtained after calculated by the fast Fourier transform. After comparing and analyzing the EOT − t curves, we came to the following conclusions:
- (1)
- The EOT − t curve can be divided into three stages as follows: slow decrease, fast decrease, and steady, which correspond to the three growth states of the film.
- (2)
- According to the characteristic curves, the end time of film synthesis can be judged, generally, as follows: the smaller the concentration, the shorter the forming time.
- (3)
- There are significant differences in the trends of EOT − t curves of the films synthesized with different concentrations of precursor solutions, such as 0.05 M, 0.07 M, 0.085 M, or 0.1 M. Then, the concentration ranges of the precursor solutions can be sensitively distinguished based on the curve trends.
RIfS is a practical and effective method for monitoring the synthesis of transparent composite films, which is of great help to the study of the growth mechanism and characteristics of thin films, and it can be extended to the field of transducer and sensors for the detection of biomolecule interactions.
Author Contributions
Conceptualization, K.W. and Z.G.; methodology, K.W. and Z.G.; software, J.Z. (Jiming Zheng); validation, Z.G., J.Z. (Jie Zhu), Y.D. and K.W.; formal analysis, Z.G., J.Z. (Jie Zhu), Y.D. and K.W.; investigation, Z.G., J.Z. (Jie Zhu) and Y.D.; resources, Z.G., J.Z. (Jie Zhu), Y.D. and K.W.; data curation, K.W. and Z.G.; writing—original draft preparation, Z.G. and K.W.; writing—review and editing, Z.G. and K.W.; supervision, W.Z., C.Z., J.Z. (Jiming Zheng) and K.W. All authors have read and agreed to the published version of the manuscript.
Funding
This research was funded by the National Natural Science Foundation of China (Grant No: 62275216, 61775181), the Natural Science Basic Research Program of Shaanxi Province-Major Basic Research Project (Grant Nos. S2018-ZC-TD-0061, TZ0393), and the National Key Scientific Instrument and Equipment Development Projects of China (Grant No.51927804).
Institutional Review Board Statement
Not applicable.
Informed Consent Statement
Not applicable.
Data Availability Statement
The raw data supporting the conclusions of this article will be made available by the authors, without undue reservation.
Conflicts of Interest
The authors declare no conflict of interest.
References
- Hermans, S.; Marien, H.; Van Goethem, C.; Vankelecom, I. Recent developments in thin film (nano)composite membranes for solvent resistant nanofiltration. Curr. Opin. Chem. Eng. 2015, 8, 45–54. [Google Scholar] [CrossRef]
- Ibrahim, Y.; Mohamed, A.; Abdelgawad, A.M.; Eid, K.; Abdullah, A.M.; Elzatahry, A. The Recent Advances in the Mechanical Properties of Self-Standing Two-Dimensional MXene-Based Nanostructures: Deep Insights into the Supercapacitor. Nanomaterials 2020, 10, 1916. [Google Scholar] [CrossRef] [PubMed]
- He, H.R.; Wang, X.; Xu, P.; Ma, S.Q.; Peng, H.N.; Wang, D.M.; Zhou, H.W.; Chen, C.H. Flower-like MnO2 nanoparticles modified thin film nanocomposite membranes for efficient organic solvent nanofiltration. Comp. Commun. 2023, 38, 101515. [Google Scholar] [CrossRef]
- Yang, Z.; Huang, X.Y.; Ma, X.H.; Zhou, Z.W.; Guo, H.; Yao, Z.K.; Feng, S.P.; Tang, C. Fabrication of a novel and green thin-film composite membrane containing nanovoids for water purification. J. Membrane Sci. 2019, 570, 314–321. [Google Scholar] [CrossRef]
- Khlyustova, A.; Cheng, Y.F.; Yang, R. Vapor-deposited functional polymer thin films in biological applications. J. Mater. Chem. B 2020, 8, 6588–6609. [Google Scholar] [CrossRef]
- Vidakis, N.; Petousis, M.; Velidakis, E.; Tzounis, L.; Mountakis, N.; Boura, O.; Grammatikos, S.A. Multi-functional polyamide 12 (PA12)/multiwall carbon nanotube 3D printed nanocomposites with enhanced mechanical and electrical properties. Adv. Compos. Mater. 2022, 31, 630–654. [Google Scholar] [CrossRef]
- Ali, A.H.; Hassan, A.S.; Ahmed, A.M.; Abdel-Khaliek, A.A.; Abd El Khalik, S.; Abass, S.M.; Shaban, M.; Alzahrani, F.M.; Rabia, M. Preparation and Characterization of Nanostructured Inorganic Copper Zinc Tin Sulfide-Delafossite Nano/Micro Composite as a Novel Photodetector with High Efficiency. Photonics 2022, 9, 979. [Google Scholar] [CrossRef]
- Yadav, H.M.; Park, J.D.; Kang, H.C.; Lee, J.J. Recent Development in Nanomaterial-Based Electrochemical Sensors for Cholesterol Detection. Chemosensors 2021, 9, 98. [Google Scholar] [CrossRef]
- Kononova, S.V.; Gubanova, G.N.; Korytkova, E.N.; Sapegin, D.A.; Setnickova, K.; Petrychkovych, R.; Uchytil, P. Polymer Nanocomposite Membranes. Appl. Sci. 2018, 8, 1181. [Google Scholar] [CrossRef]
- Park, H.B.; Kamcev, J.; Robeson, L.M.; Elimelech, M.; Freeman, B.D. Maximizing the right stuff: The trade-off between membrane permeability and selectivity. Science 2017, 356, aab0530. [Google Scholar] [CrossRef]
- Sun, C.; Zhao, L.Y.; Hao, T.T.; Liang, R.R.; Ye, H.T.; Li, J.J.; Gu, C.Z. Three-dimensional vertical ZnO transistors with suspended top electrodes fabricated by focused ion beam technology. Chin. Phys. B 2022, 31, 016801. [Google Scholar] [CrossRef]
- Najma, B.; Kasi, A.K.; Kasi, J.K.; Akbar, A.; Bokhari, S.; Stroe, I. ZnO/AAO photocatalytic membranes for efficient water disinfection: Synthesis, characterization and antibacterial assay. Appl. Surf. Sci. 2018, 448, 104–114. [Google Scholar] [CrossRef]
- Dumee, L.F.; Maina, J.W.; Merenda, A.; Reis, R.; He, L.; Kong, L.X. Hybrid thin film nano-composite membrane reactors for simultaneous separation and degradation of pesticides. J. Membrane Sci. 2017, 528, 217–224. [Google Scholar] [CrossRef]
- Zhang, X.H.; Li, Z.Q.; Ding, Y.; Hu, L.H.; Ye, J.J.; Pan, X.; Dai, S.Y. Highly efficient and stable perovskite solar cell prepared from an in situ pre-wetted PbI2 nano-sheet array film. Sustain. Energ. Fuels 2017, 1, 1056–1064. [Google Scholar] [CrossRef]
- Zakaria, A.; Leszczynska, D. Electrochemically Prepared Unzipped Single Walled Carbon Nanotubes-MnO2 Nanostructure Composites for Hydrogen Peroxide and Glucose Sensing. Chemosensors 2019, 7, 1. [Google Scholar] [CrossRef]
- Song, H.Y.; Ni, Y.N.; Kokot, S. A novel electrochemical biosensor based on the hemin-graphene nano-sheets and gold nano-particles hybrid film for the analysis of hydrogen peroxide. Anal. Chim. Acta 2013, 788, 24–31. [Google Scholar] [CrossRef]
- Kometani, R.; Ishihara, S.; Kaito, T.; Matsui, S. In-situ observation of the three-dimensional nano-structure growth on focused-lon-beam chemical vapor deposition by scanning electron microscope. Appl. Phys. Express 2008, 1, 055001. [Google Scholar] [CrossRef]
- Janovak, L.; Dekany, I.; Sebok, D. The Theoretical Concept of Polarization Reflectometric Interference Spectroscopy (PRIFS): An Optical Method to Monitor Molecule Adsorption and Nanoparticle Adhesion on the Surface of Thin Films. Photonics 2019, 6, 76. [Google Scholar] [CrossRef]
- Fechner, P.; Gauglitz, G.; Proll, G. Through the looking-glass- Recent developments in reflectometry open new possibilities for biosensor applications. Trac-Trend Anal. Chem. 2022, 156, 116708. [Google Scholar] [CrossRef]
- Chu, B.Y.; Chui, H.C.; Hsu, C.R.; Chung, C.K. Characteristic Resonance Reflection Spectra of Nanoporous Alumina Films and Its Application to Precise Thickness Measurement. Ecs J. Solid State Sci. Technol. 2017, 6, N92–N96. [Google Scholar] [CrossRef]
- Kumar, D.N.; Pinker, N.; Shtenberg, G. Inflammatory biomarker detection in milk using label-free porous SiO2 interferometer. Talanta 2020, 220, 121439. [Google Scholar] [CrossRef] [PubMed]
- Tang, Y.Y.; Li, Z.; Luo, Q.H.; Liu, J.Q.; Wu, J.M. Bacteria detection based on its blockage effect on silicon nanopore array. Biosens. Bioelectron 2016, 79, 715–720. [Google Scholar] [CrossRef] [PubMed]
- Tabrizi, M.A.; Ferre-Borrull, J.; Marsal, L.F. Highly sensitive aptasensor based on interferometric reflectance spectroscopy for the determination of amyloid beta as an Alzheimer’s disease biomarkers using nanoporous anodic alumina. Biosens. Bioelectron 2019, 137, 279–286. [Google Scholar] [CrossRef] [PubMed]
- Mariani, S.; Robbiano, V.; Strambini, L.M.; Debrassi, A.; Egri, G.; Dahne, L.; Barillaro, G. Layer-by-layer biofunctionalization of nanostructured porous silicon for high-sensitivity and high-selectivity label-free affinity biosensing. Nat. Commun. 2018, 9, 5256. [Google Scholar] [CrossRef]
- Schafer, J.; Forster, L.; Mey, I.; Papadopoulos, T.; Brose, N.; Steinem, C. Neuroligin-2 dependent conformational activation of collybistin reconstituted in supported hybrid membranes. J. Biol. Chem. 2020, 295, 18604–18613. [Google Scholar] [CrossRef]
- Wu, Q.Q.; Wang, K.G.; Sun, D.; Wang, S.; Zhang, C.; Zhao, W. Pairing Mismatched ssDNA to dsDNA Studied with Reflectometric Interference Spectroscopy Sensor. Chin. Phys. Lett. 2016, 33, 088701. [Google Scholar] [CrossRef]
- Lu, Y.; Sun, D.; Wang, K.G.; Bai, X.H.; Zhang, C.; Zhao, W.; Feng, X.Q.; Bai, J.T. Label-free detecting oligonucleotide hybridization melting temperature in real-time with a reflectometric interference spectroscopy-based nanosensor system. Optik 2019, 192, 162903. [Google Scholar] [CrossRef]
- Sedighi, M.; Rahimi, F.; Rezayan, A.H.; Shahbazi, M.A.; Witzigmann, D.; Huwyler, J. Combined cerium oxide nanocapping and layer-by-layer coating of porous silicon containers for controlled drug release. J. Mater. Sci. 2018, 53, 14975–14988. [Google Scholar] [CrossRef]
- Heuer, C.; Leonard, H.; Nitzan, N.; Lavy-Alperovitch, A.; Massad-Ivanir, N.; Scheper, T.; Segal, E. Antifungal Susceptibility Testing of Aspergillus niger on Silicon Microwells by Intensity-Based Reflectometric Interference Spectroscopy. Acs Infect. Dis. 2020, 6, 2560–2566. [Google Scholar] [CrossRef]
- Koukouvinos, G.; Petrou, P.; Misiakos, K.; Drygiannakis, D.; Raptis, I.; Stefanitsis, G.; Martini, S.; Nikita, D.; Goustouridis, D.; Moser, I.; et al. Simultaneous determination of CRP and D-dimer in human blood plasma samples with White Light Reflectance Spectroscopy. Biosens. Bioelectron. 2016, 84, 89–96. [Google Scholar] [CrossRef]
- Kaur, S.; Law, C.S.; Williamson, N.H.; Kempson, I.; Popat, A.; Kumeria, T.; Santos, A. Environmental Copper Sensor Based on Polyethylenimine-Functionalized Nanoporous Anodic Alumina Interferometers. Anal. Chem. 2019, 91, 5011–5020. [Google Scholar] [CrossRef] [PubMed]
- Kumeria, T.; Parkinson, L.; Losic, D. A nanoporous interferometric micro-sensor for biomedical detection of volatile sulphur compounds. Nanoscale Res. Lett. 2011, 6, 634. [Google Scholar] [CrossRef]
- Kumeria, T.; Losic, D. Reflective interferometric gas sensing using nanoporous anodic aluminium oxide (AAO). Phys. Status Solidi-R 2011, 5, 406–408. [Google Scholar] [CrossRef]
- Kumeria, T.; Santos, A.; Losic, D. Ultrasensitive Nanoporous Interferornetric Sensor for Label-Free Detection of Gold(III) Ions. Acs Appl. Mater. Inter. 2013, 5, 11783–11790. [Google Scholar] [CrossRef]
- Pacholski, C.; Sartor, M.; Sailor, M.J.; Cunin, F.; Miskelly, G.M. Biosensing using porous silicon double-layer interferometers: Reflective interferometric Fourier transform spectroscopy. J. Am. Chem. Soc. 2005, 127, 11636–11645. [Google Scholar] [CrossRef] [PubMed]
- Kaur, A.; Bajaj, B.; Kaushik, A.; Saini, A.; Sud, D. A review on template assisted synthesis of multi-functional metal oxide nanostructures: Status and prospects. Mater. Sci. Eng. B-Adv. 2022, 286, 116005. [Google Scholar] [CrossRef]
- Pligovka, A.; Hoha, A.; Turavets, U.; Poznyak, A.; Zakharau, Y. Formation features, morphology and optical properties of nanostructures via anodizing Al/Nb on Si and glass. Mater. Today: Proc. 2021, 37, A8–A15. [Google Scholar] [CrossRef]
- Hao, B.J.; Wang, K.G.; Zhou, Y.K.; Sui, C.F.; Wang, L.; Bai, R.; Yang, Z.J. Label-Free Detecting of the Compaction and Decompaction of ctDNA Molecules Induced by Surfactants with SERS Based on a nanoPAA-ZnCl2-AuLs Solid Substrate. Acs Omega 2020, 5, 1109–1119. [Google Scholar] [CrossRef]
- Sui, C.F.; Wang, K.G.; Wang, S.; Ren, J.Y.; Bai, X.H.; Bai, J.T. SERS activity with tenfold detection limit optimization on a type of nanoporous AAO-based complex multilayer substrate. Nanoscale 2016, 8, 5920–5927. [Google Scholar] [CrossRef]
- Cheng, Y.; Wang, K.G.; Zhou, Y.K.; Sun, D.; Zhang, C.; Zhao, W.; Bai, J.T. Enhanced degradation effect of nano-PAA-CuCl2 with controllable 3D structure as heterogeneous Fenton-like catalyst over a wide pH range. J. Mater. Sci. 2019, 54, 7850–7866. [Google Scholar] [CrossRef]
- Poznyak, A.; Pligovka, A.; Turavets, U.; Norek, M. On-Aluminum and Barrier Anodic Oxide: Meeting the Challenges of Chemical Dissolution Rate in Various Acids and Solutions. Coatings 2020, 10, 875. [Google Scholar] [CrossRef]
- Zhou, Y.K.; Dang, Y.; Wang, K.G.; Zhao, W.; Zhang, C.; Jiao, Y.; Feng, X.Q.; Wang, G.R.; Shen, T.H. A Stable NanoPAA-ZnO/ZnCl2 Composite with Variable 3D Structured Morphology and Sustained Superhydrophilicity. Langmuir 2021, 37, 5457–5463. [Google Scholar] [CrossRef] [PubMed]


Disclaimer/Publisher’s Note: The statements, opinions and data contained in all publications are solely those of the individual author(s) and contributor(s) and not of MDPI and/or the editor(s). MDPI and/or the editor(s) disclaim responsibility for any injury to people or property resulting from any ideas, methods, instructions or products referred to in the content. |
© 2023 by the authors. Licensee MDPI, Basel, Switzerland. This article is an open access article distributed under the terms and conditions of the Creative Commons Attribution (CC BY) license (https://creativecommons.org/licenses/by/4.0/).