Communication

Near-Field Evolution of Optical Vortices and Their Spatial Ordering behind a Fork-Shaped Grating

by
Denis A. Ikonnikov
1,*,
Sergey A. Myslivets
1,2,
Vasily G. Arkhipkin
1,2 and
Andrey M. Vyunishev
1,2,*
1
Kirensky Institute of Physics, Federal Research Center KSC SB RAS, 660036 Krasnoyarsk, Russia
2
Department of Photonics and Laser Technology, Siberian Federal University, 660079 Krasnoyarsk, Russia
*
Authors to whom correspondence should be addressed.
Photonics 2023, 10(4), 469; https://doi.org/10.3390/photonics10040469
Submission received: 18 February 2023 / Revised: 20 March 2023 / Accepted: 18 April 2023 / Published: 20 April 2023
(This article belongs to the Special Issue Light Focusing and Optical Vortices)

Abstract

:
Fork-shaped gratings are periodic structures containing a spatial dislocation known to be used for the production of optical vortices in a far field. Spatial overlapping of diffraction orders in a near field results in complex spatial evolution of optical vortices. In this paper, we report the results of near-field diffraction on fork-shaped gratings with different topological charges and analyze the evolution of specific optical vortices during propagation. Optical vortices have been shown to form two-dimensional well-ordered spatial configurations in specific transverse planes. The locus of points of optical singularities has been shown to form two helical lines twisted around the ± 1 diffraction order directions. Our results demonstrate that the spatial behaviour of optical vortices is in close connection with the spatial ordering arising from the Talbot effect. The quantity of optical vortices demonstrates complex spatial dynamics, which includes spatial oscillations and decreasing along the propagation direction. These results provide a foundation towards a deeper understanding of near-field singular optics phenomena.

1. Introduction

Optical vortices (OVs) represent a special kind of structured optical field [1,2,3] with its helicoidal wavefronts described by the phase term exp ( i l ϕ ) , where l is the topological charge (TC) and ϕ is the azimuthal angle [4,5,6,7]. The helicoidal wavefront results in a doughnut intensity distribution and optical (phase) singularity (OS) at the center of the OV, where the optical phase is undetermined and its intensity goes to zero. Optical vortices have been intensively studied (see, e.g., [1,2,3,4,5,6,7,8,9]) and have found plenty of applications, ranging from optical communications to high-resolved optical microscopy and optical manipulations [10,11,12,13], the detection of defects in nano-structures [14] and spinning objects [15], etc. Fork-shaped gratings (FSGs) are commonly used for producing optical vortices, among others [16,17]. FSGs have a point defect disturbing the periodicity of a regular structure, which results in OV beams in the diffraction orders in a far field of diffraction [18]. The topological charges of OVs depend on the diffraction order and TC of the incident beam. Recently, it has been shown that optical singularities produced by FSG may form complex spatial structures in a near field of the grating [19], which is caused by spatial overlapping of diffraction orders [19,20,21]. A previous study [19] revealed an analogue of the Talbot effect [22] for FSG grating and self-healing for regular intensity distributions. It was shown that optical singularities demonstrate complex spatial distributions near the grating, which breaks the regularity of spatial intensity distributions known as Talbot carpets, and, then, fit into intensity minima in integer Talbot carpets. It indicates the coexistence of spatial ordering and optical singularities, which is somehow the opposite of the diffraction of OVs on a periodic grating [18,23,24,25,26,27,28]. In [29], a singular optical field was demonstrated to evolve into two spatially separated first-order diffraction patterns with opposite integer topological charges under near-field diffraction on a fork-shaped grating.
The current study is devoted to a detailed analysis of the evolution of optical vortices behind fork-shaped gratings. These results allow us to understand the physical reason for the coexistence of the spatially ordered intensity distribution and locations of optical singularities, which is important for near-field singular optics.

2. Basic Formulas

Let us consider the near-field diffraction of a Gaussian beam with a waist radius w 0 on a fork-shaped grating with a period of structure Λ and a topological charge p. The FSG transmission function in the plane ( x 0 , y 0 ) is given by T ( x 0 , y 0 ) = { 1 + sgn [ cos ( 2 π x 0 / Λ + p ϕ ) ] } / 2 , where ϕ = arctan ( y 0 / x 0 ) is the azimuthal angle and sgn  Ψ = Ψ / | Ψ | is the sign function. The diffracted field in the plane ( x , y ) near the grating at distance z can be numerically calculated using the Fresnel diffraction integral [30]
E ( x , y , z ) = exp ( i k z ) i λ z E ( x 0 , y 0 , 0 ) exp i k 2 z [ ( x x 0 ) 2 + ( y y 0 ) 2 ] d x 0 d y 0 .
where E ( x 0 , y 0 , 0 ) = T ( x 0 , y 0 ) E 0 exp [ ( x 0 2 + y 0 2 ) / w 0 2 ] is the field distribution in the grating plane. It is convenient to represent integral (1) as [30,31]
E ( x , y , z ) = F 1 F { E ( x 0 , y 0 , 0 ) } H ( f x , f y ) ,
where the transfer function H is given by
H ( f x , f y ) = e i k z exp [ i λ z ( f x 2 + f y 2 ) ]
with the spatial frequencies f x = x / λ z , f y = y / λ z . F (or F 1 ) is the notation for the Fourier (or inverse Fourier) transform.
In the far field, the diffracted field represents a spatially separated set of optical vortices propagating in the diffraction order directions, with the TC of each vortex defined as [6]
l m = l 0 + m p ,
where l 0 is the TC of the incident beam ( l 0 = 0 for further consideration) and m is the diffraction order.

3. Experimental Setup

In the experiment, a fork-shaped grating with a period of Λ = 10 μm for the structures, with the characteristic dimensions of the entire structure being  3 × 3 mm2, was photolithographically imprinted on a chromium-coated glass substrate. This mask was illuminated by a He–Ne laser beam with a wavelength of 632.8 nm and a radius of 1.5 mm (Figure 1). The experimental studies were carried out for a set of FSG masks with topological charges of ± 1 , + 2 , + 3 , and + 4 . Using the objective with an optical magnification of × 50 and a numerical aperture of 0.55, located behind the mask, the image obtained near the grating was projected onto the beam profiler (LBP-1, Newport, pixel sizes 9.05 × 8.3 μm2). By moving the objective along the beam propagation axis, the experimental near-field intensity distribution patterns at different distances from the FSG mask were obtained, allowing one to reconstruct the spatial distribution of intensity in 3D behind the mask by analyzing the 2D intensity profiles at specific coordinates.

4. Results and Discussion

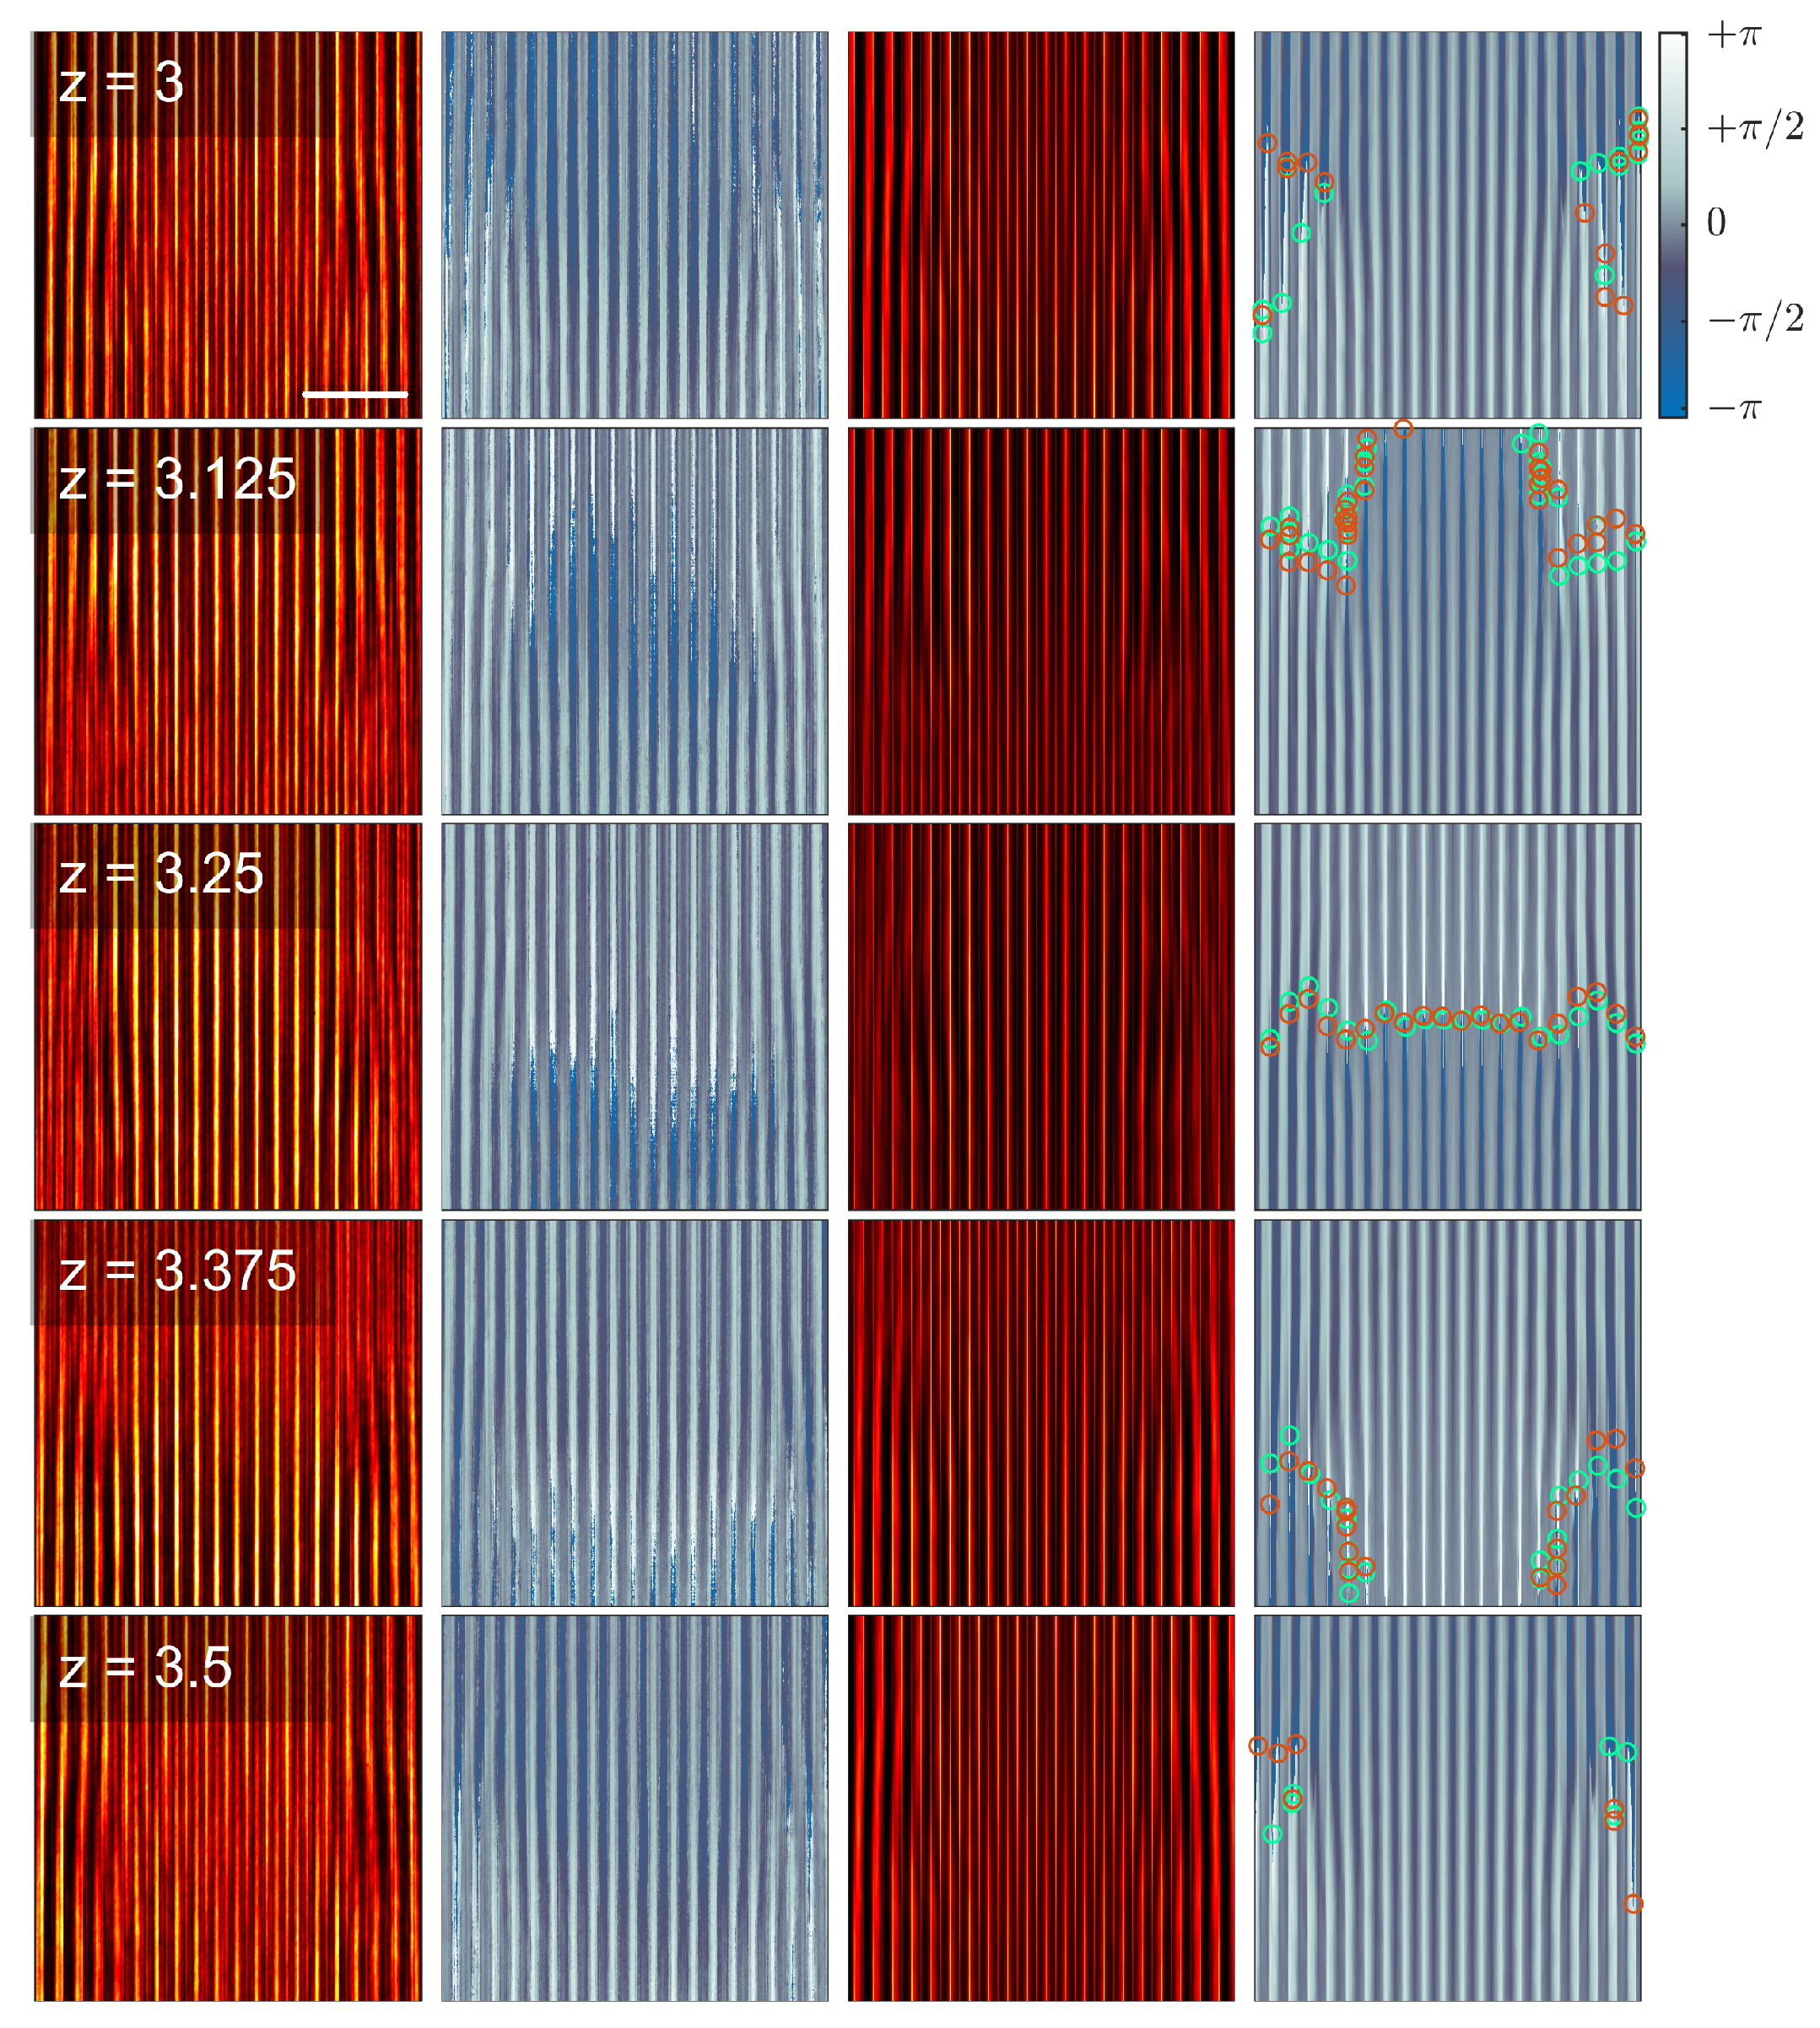
An analogue of the Talbot effect has been recently revealed to take place for fork-shaped gratings [19]. Figure 2 shows the experimentally obtained intensity distribution under diffraction on a fork-shaped grating with topological charge p = + 1 for different planes z / z T , where z T = 2 Λ 2 / λ is the Talbot length [22]. The Gerchberg–Saxton method [32] has been applied for retrieving the phase distributions from experimental intensity profiles (Figure 2). The five planes presented in the figure have been used for the phase retrieval. The bandwidth and the number of spatial harmonics used for phase restoration are defined by the geometric sizes of the intensity profile and pixels, which complicate extraction of the optical singularities from the experimental data due to low spatial resolution. It is more reliable to determine the positions and magnitudes of singularities from numerical calculations. Figure 2 shows some intensity and phase profiles calculated using Formula (2), which take into account the calculation area, with a size of 3 × 3 mm2 and 50 sample points per period Λ. A good agreement between the measured and calculated intensity profiles is evident and proves the calculated model used. At the same time, the calculated phase distributions and retrieved ones are close together. The calculated phase distributions represent sets of vertical stripes of two types alternating with each other. The phase along the stripes of the first type does not change, and on the stripes of the second type, it is possible to see quite accurately the presence of a phase discontinuity. While observing the phase change depending on the coordinate along the propagation axis z, these discontinuities are seen to line up along two sets of rotating lines. The number of lines in each set is equal to the topological charge | p | of the grating. Each of the sets rotates around its center of rotation; both of the sets rotate in opposite directions to each other. At the boundaries of these phase, discontinuities singular points are formed. The positions of these singular points were numerically calculated from the condition Re E ( x , y , z ) = Im E ( x , y , z ) = 0 , and their respective charges were calculated as the number of phase jumps by 2 π when going around the singularity in a closed loop. In each transverse plane, OS ensembles occur, the locus of points of which forms two helical traces twisted around the ± 1 order direction (Figure 3).
It is known that diffraction on a fork-shaped grating in the far field results in the formation of a set of optical vortices; consequently, near-field diffraction will be the result of a superposition of this set of vortices, being essentially spatial harmonics. Since the amplitudes of the spatial harmonics associated with the respective-order m decrease quadratically with increasing order, we should expect that the harmonics with lower orders will make a determining contribution. In this case, we can assume that the lines along which the phase discontinuities line up are the manifestation of ± 1 -order spatial harmonics. Indeed, if we consider only the first-order harmonics in the plane perpendicular to the harmonic propagation direction, we can observe the presence of the phase discontinuity lines.
Since the topological charge of the first spatial harmonic is equal to the topological charge of the grating in the case of an incident Gaussian beam, the number of phase break lines is also equal to the topological charge p of FSG. During propagation, these break lines rotate around the propagation axis of a specific harmonic in the theoretical model. However, there is a significant difference between propagation of a single spatial harmonic and propagation of the field superimposed by all spatial harmonics. While a single harmonic has a spatial period along the propagation axis equal m p λ , according to the Talbot effect, the superimposed field has a spatial period equal to z T . It implies that each harmonic rotates several hundred times at a distance of z T / 2 , while the helical traces of OS ensembles rotate only by the angle of ± 2 π / p at the same distance. These results demonstrate that the spatial behaviour of OVs produced by FSG is in close connection with the spatial ordering arising from the Talbot effect. To note, the experimental value of the Talbot length was about 321 μm, which is in good agreement with the calculated one, at 316 μm.
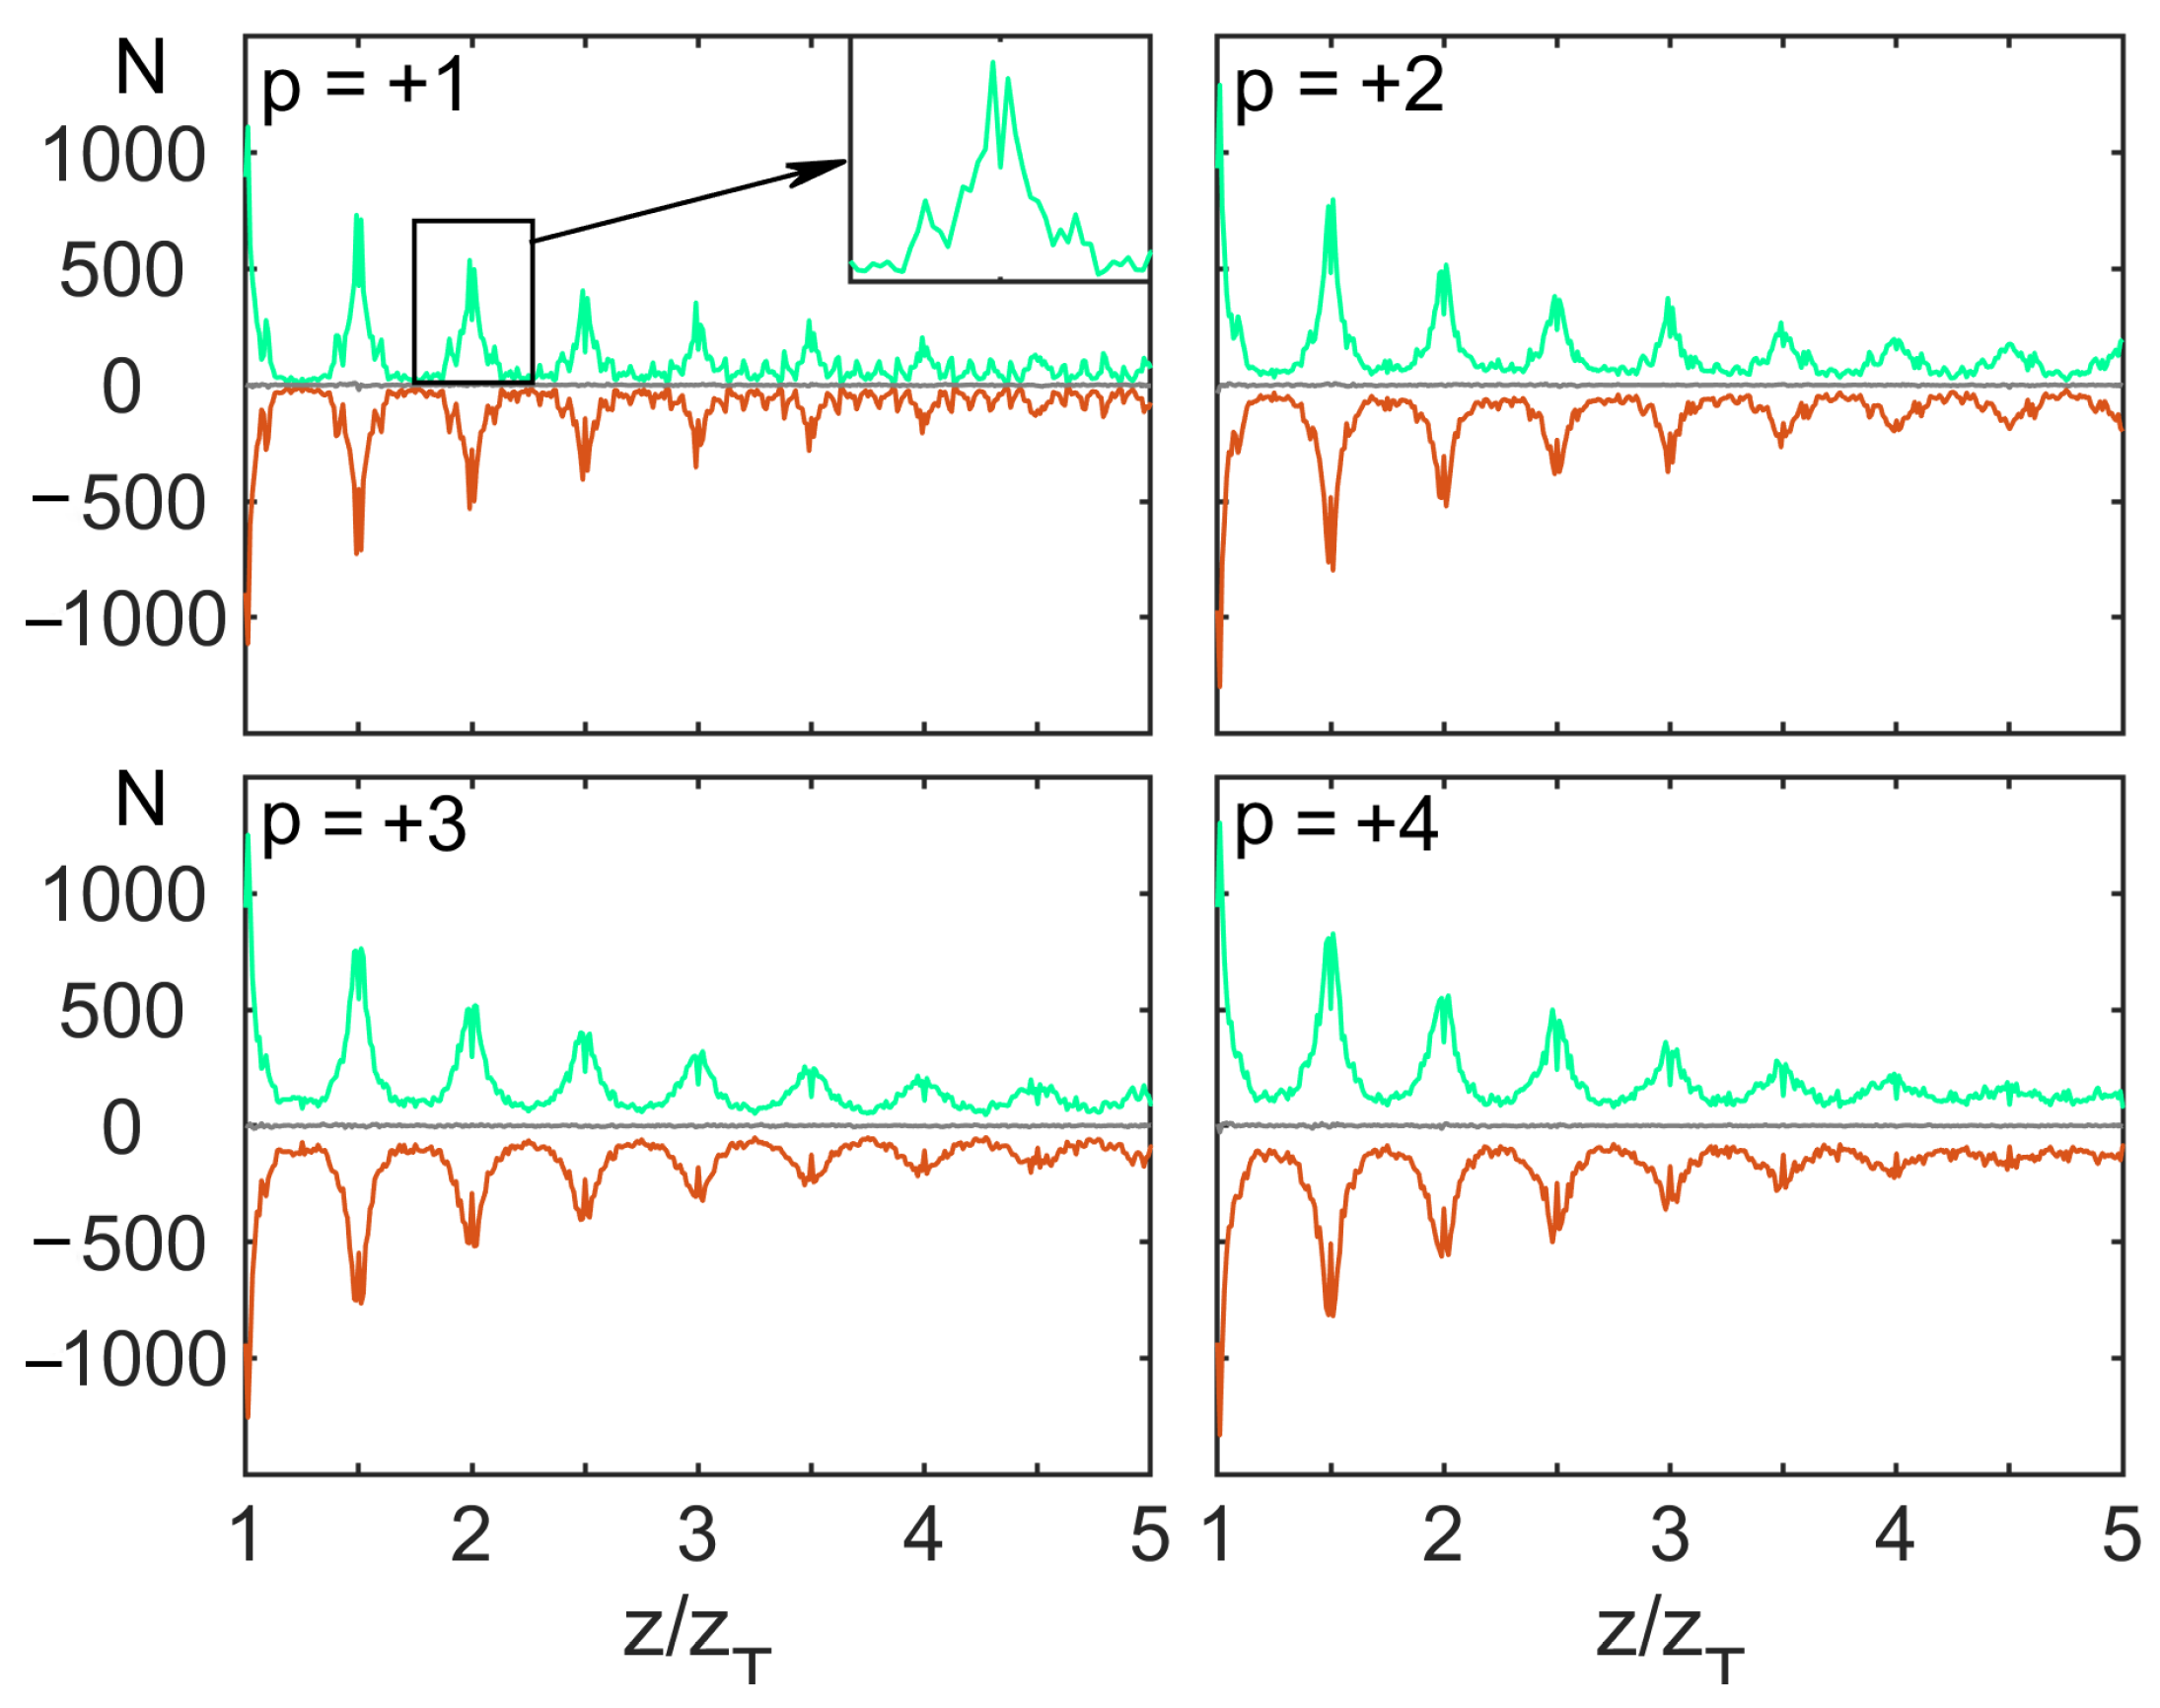
In addition, we analyzed the dependence of the quantity of optical singularities N on the distance along the propagation axis. The corresponding graphs are shown in Figure 4. We see that, in each plane, the quantity of positive and negative singularities is approximately equal and, consequently, the total aggregate charge is approximately equal to 0. Indeed, one can expect that the total topological charge behind the grating is equal to the topological charge of the incident beam. The difference from zero is probably caused by the limited region of the calculation, and a part of singularities is outside the calculated region. This dependence shows that the total quantity of singularities decreases with distance along the propagation axis z. This is due to the fact that the spatial harmonics gradually diverge with distance from the grating and, consequently, the field distribution simplifies. The periodicity of the shown dependence can be explained by the Talbot effect: since the self-reproducing pattern of diffraction occurs, the position and quantity of singularities should also repeat with the same periodicity. To note, a drastic reduction in OS quantity corresponds to the integer and semi-integer Talbot planes (see inset in Figure 4), where the transverse intensity distribution reproduces the grating and becomes the most ordered. This means that the OVs are annihilated right before the integer and semi-integer Talbot planes and are born immediately after these planes.

5. Conclusions

The near-field diffraction of a Gaussian beam on fork-shaped gratings with the topological charge p has been studied. The proposed theoretical model has been proved, with a good agreement between the calculated and measured intensity distributions in specific transverse planes. It has allowed us to study the evolution of optical vortices in a near field of diffraction. These results have shown that the locus of points of optical singularities forms two helical lines twisted around the ± 1 diffraction order directions. These helical lines have been found to have a spatial period equal to | p | z T / 2 . These results demonstrate that the spatial behaviour of OVs produced by FSG is in close connection with the spatial ordering arising from the Talbot effect. The quantity of optical vortices demonstrates complex spatial dynamics, which includes spatial oscillations and decreasing along the propagation direction. These results pave the way to understanding near-field singular optics phenomena.

Author Contributions

Conceptualization, A.M.V. and V.G.A.; methodology, S.A.M. and V.G.A.; software, S.A.M.; validation, D.A.I., S.A.M., V.G.A. and A.M.V.; formal analysis, D.A.I., S.A.M., V.G.A. and A.M.V.; investigation, D.A.I., S.A.M., V.G.A. and A.M.V.; data curation, D.A.I. and S.A.M.; writing—original draft preparation, D.A.I. and A.M.V.; writing—review and editing, D.A.I., S.A.M., V.G.A. and A.M.V.; visualization, D.A.I. and S.A.M.; supervision, V.G.A.; project administration, A.M.V.; funding acquisition, A.M.V. All authors have read and agreed to the published version of the manuscript.

Funding

The work is supported by the Russian Science Foundation (grant No. 19-12-00203).

Institutional Review Board Statement

Not applicable.

Informed Consent Statement

Not applicable.

Data Availability Statement

The data are contained within the article.

Acknowledgments

The authors thank N. Davletshin for the graphical illustration of the experimental configuration.

Conflicts of Interest

The authors declare no conflict of interest.

References

  1. Rubinsztein-Dunlop, H.; Forbes, A.; Berry, M.V.; Dennis, M.R.; Andrews, D.L.; Mansuripur, M.; Denz, C.; Alpmann, C.; Banzer, P.; Bauer, T.; et al. Roadmap on structured light. J. Opt. 2016, 19, 013001. [Google Scholar] [CrossRef]
  2. Forbes, A.; de Oliveira, M.; Dennis, M.R. Structured light. Nat. Photon. 2021, 15, 253–262. [Google Scholar] [CrossRef]
  3. Ikonnikov, D.A.; Kotlyar, V.V.; Kovalev, A.A.; Vyunishev, A.M. Optical Vortices with A Quadratic Azimuthal Phase Dependence. Ann. Der Phys. 2022, 534, 2200276. [Google Scholar] [CrossRef]
  4. Allen, L.; Beijersbergen, M.W.; Spreeuw, R.J.C.; Woerdman, J.P. Orbital angular momentum of light and the transformation of Laguerre-Gaussian laser modes. Phys. Rev. A 1992, 45, 8185–8189. [Google Scholar] [CrossRef]
  5. Soskin, M.S.; Gorshkov, V.N.; Vasnetsov, M.V.; Malos, J.T.; Heckenberg, N.R. Topological charge and angular momentum of light beams carrying optical vortices. Phys. Rev. A 1997, 56, 4064–4075. [Google Scholar] [CrossRef]
  6. Knyazev, B.A.; Serbo, V.G. Beams of photons with nonzero projections of orbital angular momenta: New results. Phys. Usp. 2018, 61, 449–479. [Google Scholar] [CrossRef]
  7. Porfirev, A.P.; Kuchmizhak, A.A.; Gurbatov, S.O.; Juodkazis, S.; Khonina, S.N.; Kul’chin, Y.N. Phase singularities and optical vortices in photonics. Phys. Usp. 2021, 192, 841–866. [Google Scholar] [CrossRef]
  8. Kotlyar, V.V.; Kovalev, A.A.; Volyar, A.V. Topological charge of a linear combination of optical vortices: Topological competition. Opt. Express 2020, 28, 8266–8281. [Google Scholar] [CrossRef]
  9. Kotlyar, V.; Kovalev, A.; Kozlova, E.; Savelyeva, A.; Stafeev, S. Geometric Progression of Optical Vortices. Photonics 2022, 9, 407. [Google Scholar] [CrossRef]
  10. Mirhosseini, M.; Magaña-Loaiza, O.S.; O’Sullivan, M.N.; Rodenburg, B.; Malik, M.; Lavery, M.P.J.; Padgett, M.J.; Gauthier, D.J.; Boyd, R.W. High-dimensional quantum cryptography with twisted light. N. J. Phys. 2015, 17, 033033. [Google Scholar] [CrossRef]
  11. Sit, A.; Bouchard, F.; Fickler, R.; Gagnon-Bischoff, J.; Larocque, H.; Heshami, K.; Elser, D.; Peuntinger, C.; Günthner, K.; Heim, B.; et al. High-dimensional intracity quantum cryptography with structured photons. Optica 2017, 4, 1006–1010. [Google Scholar] [CrossRef]
  12. Willig, K.I.; Rizzoli, S.O.; Westphal, V.; Jahn, R.; Hell, S.W. STED microscopy reveals that synaptotagmin remains clustered after synaptic vesicle exocytosis. Nature 2006, 440, 935–939. [Google Scholar] [CrossRef]
  13. Gahagan, K.T.; Swartzlander, G.A. Optical vortex trapping of particles. Opt. Lett. 1996, 21, 827–829. [Google Scholar] [CrossRef]
  14. Wang, B.; Tanksalvala, M.; Zhang, Z.; Esashi, Y.; Jenkins, N.W.; Murnane, M.M.; Kapteyn, H.C.; Liao, C.T. Coherent Fourier scatterometry using orbital angular momentum beams for defect detection. Opt. Express 2021, 29, 3342–3358. [Google Scholar] [CrossRef]
  15. Li, Z.; Liu, T.; Ren, Y.; Qiu, S.; Wang, C.; Wang, H. Direction-sensitive detection of a spinning object using dual-frequency vortex light. Opt. Express 2021, 29, 7453–7463. [Google Scholar] [CrossRef]
  16. Bazhenov, V.Y.; Vasnetsov, M.V.; Soskin, M.S. Laser beams with screw dislocations in their wavefronts. JETP Lett. 1991, 52, 429–431. [Google Scholar]
  17. Heckenberg, N.; McDuff, R.; Smith, C.; Rubinsztein-Dunlop, H.; Wegener, M. Laser-beams with phase singularities. Opt. Qunt. Electron. 1992, 24, S951–S962. [Google Scholar] [CrossRef]
  18. Ikonnikov, D.A.; Fokin, V.A.; Vyunishev, A.M. Synthesizing Structured Optical Vortices. Ann. Der Phys. 2022, 534, 2200041. [Google Scholar] [CrossRef]
  19. Ikonnikov, D.A.; Myslivets, S.A.; Davletshin, N.N.; Baron, F.A.; Arkhipkin, V.G.; Vyunishev, A.M. Unveiling Talbot Effect under Fresnel Diffraction at a Fork-Shaped Grating. Ann. Der Phys. 2023, 535, 2200480. [Google Scholar] [CrossRef]
  20. Janicijevic, L.; Topuzoski, S. Fresnel and Fraunhofer diffraction of a Gaussian laser beam by fork-shaped gratings. J. Opt. Soc. Am. A 2008, 25, 2659. [Google Scholar] [CrossRef]
  21. Topuzoski, S.; Janicijevic, L. Fraunhofer diffraction of a Laguerre–Gaussian laser beam by fork-shaped grating. J. Mod. Opt. 2011, 58, 138–145. [Google Scholar] [CrossRef]
  22. Wen, J.; Zhang, Y.; Xiao, M. The Talbot effect: Recent advances in classical optics, nonlinear optics, and quantum optics. Adv. Opt. Photon. 2013, 5, 83–130. [Google Scholar] [CrossRef]
  23. Knyazev, B.; Kameshkov, O.; Vinokurov, N.; Cherkassky, V.; Choporova, Y.; Pavelyev, V. Quasi-Talbot effect with vortex beams and formation of vortex beamlet arrays. Opt. Express 2018, 26, 14174–14185. [Google Scholar] [CrossRef]
  24. Rasouli, S.; Hebri, D. Theory of diffraction of vortex beams from 2D orthogonal periodic structures and Talbot self-healing under vortex beam illumination. J. Opt. Soc. Am. A 2019, 36, 800–808. [Google Scholar] [CrossRef]
  25. Kotelnikov, I.A.; Kameshkov, O.E.; Knyazev, B.A. Diffraction of bessel beams on 2D amplitude gratings—a new branch in the talbot effect study. J. Opt. 2020, 22, 065603. [Google Scholar] [CrossRef]
  26. Ikonnikov, D.A.; Myslivets, S.A.; Volochaev, M.N.; Arkhipkin, V.G.; Vyunishev, A.M. Two-dimensional Talbot effect of the optical vortices and their spatial evolution. Sci. Rep. 2020, 10, 20315. [Google Scholar] [CrossRef]
  27. Arkhipkin, V.G.; Myslivets, S.A. Diffraction of vortex Gaussian beams from a two-dimensional Raman-induced grating. Las. Phys. 2021, 31, 065401. [Google Scholar] [CrossRef]
  28. Choporova, Y.; Knyazev, B.; Pavelyev, V. Holography with high-power CW coherent terahertz source: Optical components, imaging, and applications. Light. Adv. Manuf. 2022, 3, 1. [Google Scholar] [CrossRef]
  29. Matta, S.; Vayalamkuzhi, P.; Naik, D.N.; Viswanathan, N.K. Evolution of phase singularities from fork-shaped phase grating in the near-field. J. Opt. 2018, 20, 075604. [Google Scholar] [CrossRef]
  30. Goodman, J. Introduction to Fourier Optics; McGraw-Hill physical and quantum electronics series; W. H. Freeman: New York, NY, USA, 2005. [Google Scholar]
  31. Voelz, D.G. Computational Fourier Optics: A MATLAB Tutorial; SPIE: St Bellingham, WA, USA, 2011. [Google Scholar] [CrossRef]
  32. Gerchberg, R.W.; Saxton, W.O. A practical algorithm for the determination of phasefrom image and diffraction plane pictures. Optik 1972, 35, 237–246. [Google Scholar]
Figure 1. Illustration of the experiment. Ensembles of OVs of the opposite-sign form helical lines behind the FSG. Intensity distribution of the diffracted light is projected by the objective onto the CCD for analysis.
Photonics 10 00469 g001
Figure 2. Experimental (the first column) and calculated (the third column) intensity profiles, and retrieved (the second column) and calculated (the fourth column) phases of diffracted field at different distances (in units of z T ) from FSG with p = + 1 . Circles mark positive (green) and negative (red) optical singularities. Scale bar corresponds to 50 μm.
Photonics 10 00469 g002
Figure 3. Calculated positions of positive (green) and negative (red) optical singularities behind FSG with topological charges p = + 1 (a,b) and p = + 2 (c,d). Solid curves show approximated helical traces of locus of points corresponding to the OS ensembles.
Photonics 10 00469 g003
Figure 4. The quantity of positive (green) and negative (red) optical singularities N on the distance along the propagation axis z, calculated in the region 40 × 10 Λ 2 .
Photonics 10 00469 g004
Disclaimer/Publisher’s Note: The statements, opinions and data contained in all publications are solely those of the individual author(s) and contributor(s) and not of MDPI and/or the editor(s). MDPI and/or the editor(s) disclaim responsibility for any injury to people or property resulting from any ideas, methods, instructions or products referred to in the content.