Article

Optical Attenuation Coefficient Optimization Algorithm for Deep Tissue Signals in Optical Coherence Tomography Based on Kalman Filter

1
School of Control Engineering, Northeastern University at Qinhuangdao, No. 143 Taishan Road, Economic and Technological Development Zone, Qinhuangdao 066004, China
2
Hebei Key Laboratory of Micro-Nano Precision Optical Sensing and Measurement Technology, No. 143 Taishan Road, Economic and Technological Development Zone, Qinhuangdao 066004, China
3
Department of Ophthalmology, The First Hospital of Qinhuangdao, No. 258 Wenhua Road, Qinhuangdao 066000, China
4
Department of Hand, Foot and Micro-Surgery, The First Hospital of Qinhuangdao, No. 258 Wenhua Road, Qinhuangdao 066000, China
*
Author to whom correspondence should be addressed.
Photonics 2023, 10(4), 460; https://doi.org/10.3390/photonics10040460
Submission received: 23 February 2023 / Revised: 9 April 2023 / Accepted: 13 April 2023 / Published: 16 April 2023

Abstract

:
Optical coherence tomography (OCT) attenuation imaging is a technique that uses the optical attenuation coefficient (OAC) to distinguish the types or pathological states of tissues and has been increasingly used in basic research and clinical diagnosis. With the increasing application of swept-source OCT, scholars are increasingly inclined to explore deep tissues. Unfortunately, the accuracy of OAC calculation when exploring deep tissues has yet to be improved. Existing methods generally have the following problems: overestimation error, underestimation error, severe fluctuation, or stripe artifacts in the OAC calculation of the OCT tail signal. The main reason for this is that the influence of the noise floor on the OCT weak signal at the tail-end is not paid enough attention. The noise floor can change the attenuation pattern of the OCT tail signal, which can lead to severe errors in the OAC. In this paper, we proposed a Kalman filter-based OAC optimal algorithm to solve this problem. This algorithm can not only eliminate the influence of the noise floor, but can also effectively protect the weak signal at the tail-end from being lost. The OAC of deep tissues can be calculated accurately and stably. Numerical simulation, phantom, and in vivo experiments were tested to verify the algorithm’s effectiveness in this paper. This technology is expected to play an essential role in disease diagnosis and in the evaluation of the effectiveness of treatment methods.

1. Introduction

Optical coherence tomography (OCT) is a valuable technique that provides noninvasive, volumetric, and real-time in vivo images of tissue microstructures [1]. Over the past two decades, a variety of OCT-based imaging technologies have sprung up, such as Doppler OCT [2,3], OCT-based angiography (OCTA) [4,5], OCT-based elastography (OCE) [6,7], Magnetomotive OCT (MMOCT) [8] and so on. These technologies have taken the development of OCT to new heights, and bring significant benefits to basic research and clinical applications, such as ophthalmology [9], dermatology [10], and neuroscience [11].
Currently, another OCT-based imaging technology, OCT attenuation imaging (OCT-ai), is becoming increasingly popular. The basic principle of this technology is that the power of an incident light beam passing through a biological tissue decays along its path due to scattering and absorption. Therefore, the closer to the tail, the weaker the OCT signals. The optical attenuation coefficient (OAC) reflects the rate at which the incident light is attenuated. It is only related to the optical properties of the tissue and does not diminish with increasing depth theoretically (within the effective OCT imaging depth range). Therefore, the OAC can be used as an indicator of tissue characteristics. By measuring the OAC, OCT-ai can distinguish between the various types of tissue affected by the disease and can be used to detect and quantify multiple diseases [12], such as via the imaging of atherosclerotic plaques [13], the assessment of glaucoma [14], the identification of axillary lymph nodes [15], the differentiation between normal and cancerous tissue in the bladder [16] and colon [17], and the imaging of the cerebral cortex after stroke [18,19].
Swept-source optical coherence tomography (SS-OCT) has recently become more widely used in clinical studies to investigate deep tissues due to its deeper penetration than spectral domain OCT. Unfortunately, the OAC calculation accuracy of the OCT tail-end signal has not been improved, which affects the accurate quantification of the attenuation properties of deep tissues. The Depth-Resolved (DR) method [20] proposed by Vermeer et al. produces a significant error in the tail end of the signal. This is mainly due to the use of finite data ( i = z + 1 N I [ i ] ) to approximate infinite data ( i = z + 1 I [ i ] ). The two are roughly equal in the superficial tissues (where z is small); however, there is a vast difference between the two in deep tissues, where z is large and close to N. The Depth-Resolved Confocal (DRC) method [21] improves the calculation accuracy of the OAC by introducing confocal function and sensitivity fall-off, but the tail error problem has not been fundamentally solved. In previous work, we proposed an Optimized Depth-Resolved Estimation (ODRE) method [22], which almost solved the tail error problem by compensating for the residual light intensity. However, the OCT signal contains the noise floor, an additive noise that is uniformly distributed over all depth ranges of the OCT signal. The proportion of the noise floor increases with depth. The noise floor’s presence changes the OCT signal’s attenuation pattern to y = y 0 · e 2 μ · z + b , where b is the noise floor. We call this phenomenon the noise floor effect (NFE). In this case, when the signal has decayed to a certain level, it is no longer significantly attenuated. Then, the OAC calculated by the ODRE method is severely underestimated. Li et al. proposed an overestimation-free depth-resolved attenuation estimation [23] method. This algorithm truncates the tail OCT signal and then uses the compensation algorithm to calculate the OAC of the remaining signal accurately. However, the attenuation information of the deep tissue is lost. If the tail signal is not truncated, the method produces unstable factors, resulting in light and dark stripe artifacts deep in the image. If one chooses to directly subtract the mean of the noise floor from the OCT signal, its attenuation pattern changes back to the Beer–Lambert law y = y 0 · e 2 μ · z [24]. This method can only improve the accuracy of the OAC in shallow tissue. In deep tissue, where the optical signal is about to be exhausted, the intensity of the noise is much greater than that of the signal, resulting influctuations in the range of the OAC increasing rapidly with the depth. This seriously affects the detection accuracy of the OAC in the deep tissue, thereby affecting the diagnosis of diseases. Although some traditional denoising algorithms (such as Gaussian filtering, median filtering, or restoration filter [21], etc.) can smooth the amplitude of part of the noise, they often also lose the information of the weak signal at the tail end. Determining the the way in which to effectively eliminate the noise floor and protect the tail-end weak signal from loss is the key to accurately calculating the OAC in deep tissue.
The Kalman filter is a highly efficient recursive that uses a series of measurements observed over time and systematic predictions to generate optimal state estimates that tend to be more accurate compared to those based on a single measurement alone [25]. At present, the Kalman filter has been applied to OCT by some scholars. Igor Gurov et al. applied the Kalman filter to dynamic evaluate layer borders of multilayer tissues in Optical Coherence Tomography (OCT), and improved the resolution of the layer boundary [26]. Amir Tofighi Zavareh et al. proposed an unscented Kalman filter and used it in the context of SS-OCT spectral calibration. This technology can alleviate the image quality degradation caused by non-linear spectral sweeps, phase instability, and the increased noise levels of swept lasers [27]. The application of the Kalman filter to OAC calculation in OCT has not been reported. The intensity of the OCT signal decays exponentially along the depth direction. Therefore, by establishing an exponential decay prediction model, we can apply the Kalman filter to the OAC estimation.
In general, the existing algorithms mainly suffer from the following problems in calculating the OAC in deep tissues: overestimation error, underestimation error, drastic fluctuation, and streaklike artifacts. In this paper, we proposed a Kalman filter-based OAC optimization algorithm to solve the above problems. The proposed algorithm can effectively eliminate the noise floor and protect the weak signal in the tail from loss. The resulting OAC is more accurate and stable. Compared with the existing methods, the proposed method can significantly improve the accuracy of OAC calculation in deep tissues, thereby enhancing the disease diagnosis capabilities of OCT-ai technology. Numerical simulation, phantom, and in vivo experiments were used to verify the effectiveness of the algorithm in this paper.

2. Method

2.1. Optical Attenuation Coefficient (OAC) Calculation

OAC calculation methods are mainly divided into curve-fitting and depth resolution estimation. The curve-fitting method is suitable for homogeneous media. It is highly accurate and can be used as the gold standard. However, if the sample structure is too complex, this method may lose parts of the depth resolution information. The depth-resolved estimation method was proposed by Vermeer et al. Because it is suitable for the OAC calculation of multi-layer media, this method has been widely used and improved. The model in the discrete domain is transcribed as follows:
μ z = I [ z ] 2 i = z + 1 N I [ i ]
I[z] is the OCT signal of a pixel at depth z, Δ is the pixel size, and μ[z] (expressed in mm−1) is the current OAC value. Factor 2 is due to the light propagating through the tissue twice. However, this method violates the assumption that “almost all light is attenuated” and thus produces errors that increase with depth.
In our previous work, we proposed an optimized depth-resolved estimation (ODRE) method. The ODRE method adds the sum of the signal beyond the boundary back to the denominator, thus guaranteeing the assumption of “almost all light is attenuated”. Equation (1) was rewritten as follows [22]:
μ z = I [ z ] 2 i = z + 1 N I i + I [ N ] μ [ N ]
where I[N] is the OCT signal for the last point N. μ[N] is the last OAC that can be obtained via the exponential fitting of the last piece of data. This method allows the accurate extraction of the OAC from thinner tissues, accounting for the possibility of light being incompletely attenuated in tissue. However, the NFE cannot be overcome by the ODRE algorithm. To solve this problem, the statistical characteristics of the noise contained in the OCT signal need to be analyzed; this not only explains the cause of the error, but also provides parameters for the subsequent Kalman filter algorithm.

2.2. The Noise Analysis of OCT

The OCT signal contains two kinds of noise, multiplicative noise and additive noise. Speckle noise, as a major multiplicative noise, is influenced by the optical properties of the target object, the size and temporal coherence of the light source, the multiple scattering and phase aberrations of the propagating beam, and the aperture of the detector [28]. The OCT signal intensity follows an exponential distribution. In this case, the speckle contrast (C) is 1 [29]. This means that the standard deviation of speckle noise is equal to the intensity of the OCT signal.
Additive noise, independent of the backscattered light intensity of the sample, is distributed over the entire depth range of the OCT image, forming what we call the noise floor. The noise floor includes the electrical noise of the photo detector, hte shot noise, and the relative intensity noise (RIN) produced by the reference arm light [30]. The existence of the noise floor can greatly affect the estimation of the attenuation coefficient. To clarify this problem, we conducted two sets of numerical simulation experiments. In the first experiment, we simulated a light beam passing through a noise-free, uniform medium. Two sets of OACs (0.5 and 1) were preset. The simulated observation depth was 3 mm, and the pixel size Δ was 0.005 mm. For ease of calculation, we assumed that the initial light intensity was 1, as shown in Figure 1a. Using Equation (2), we could obtain very accurate OACs, as shown in Figure 1b. Figure 1c is obtained by adding a constant b to the signal in Figure 1a, where the value of b is 5% of the maximum intensity, as shown by the solid yellow line in Figure 1c. The same method was used to calculate the OAC, and the results are shown in Figure 1d.
It can be seen from Figure 1 that, for attenuation models in the form of y = y 0 · e 2 μ · z , whose limit is 0 as z approaches infinity, the OAC can be accurately calculated. However, the noise floor is included in all the original OCT signals, and in this case, the signal does not continue to decay when the signal is attenuated to a certain level; thus, its attenuation model should be in the form of y = y 0 · e 2 μ · z + b . It can be seen from Figure 1d that the OACs are seriously underestimated in most of the depth ranges, and the faster the signal decays, the more underestimated it is. This is because a lot of noise (noise floor) is accumulated in the denominator of Equation (2) ( i = z + 1 N I i ). When z approaches the maximum depth N, the accumulated noise is also reduced, so the OAC gradually recovers.
Considering that the real OCT signal is noisy, we next simulated a signal with multiplicative noise and additive noise, as shown in Figure 2. As mentioned earlier, the standard deviation of speckle noise is equal to the intensity of the OCT signal. Speckle noise can be offset by multiple averages. For example, if each B-scan is collected 5 times repeatedly, the speckle noise decreases to 1 / 5 of the original. As a result, C = 0.447, and the standard deviation of speckle noise is C × y, y = [y1, y2, …, yN]. Meanwhile, its variance is [C × y]2. Therefore, we added Gaussian distribution multiplicative noise with zero mean and a variance of [C × y]2. The additive noise we added here obeys a Gaussian distribution with a mean of 0.025 and a variance of 1. The selection of additive noise parameters is based on experience. In actual OCT signals, the mean value of the noise floor is about 2.5% of the initial OCT intensity, as shown in Figure 2.
In Figure 2a, under the influence of the noise floor, the signal-to-noise ratio (SNR) of the signal decreases with the increase in depth, and the tail-end signal is almost submerged in the noise. Signal fluctuations here no longer reflect real structural information, but high-frequency noise. The calculated OAC was not surprisingly underestimated (Figure 2b). Subtracting the mean of the noise floor from all signals raises new questions (Figure 2c). The statistical properties of the additive noise follow a Gaussian distribution with a zero-mean. The sum of the tail-end data ( i = z + 1 N I i ) becomes close to 0, which is much smaller than the numerator part (I[z]). As a result, the corresponding OAC was very sensitive to noise (the fluctuation range in the tail OAC increases rapidly with the depth, as shown in Figure 2d). This phenomenon affects the identification of the tissue attenuation characteristics. This is the noise floor effect (NFE) described in this article. In order to effectively reduce the NFE without affecting the image details, we introduced the Kalman filter method.

2.3. Classic Kalman Filter

The Kalman filter works in two steps: prediction and update. In the prediction phase, the Kalman filter uses the information in the previous time step to produce a state estimate and its uncertainties at the current time step. In the update phase, a more accurate “state estimate” is refined using the predicted state estimate, the current measurement, and a weighting factor. The Kalman filter assigns more weight to the greater certainty side. The update of the estimated error covariance is also completed at this stage [31].
For ease of understanding, the following descriptions are based on one-dimensional signals. The Kalman filter model assumes that the true state at time step z evolves from the state at z − 1, according to the following:
x z = A x z 1 + B u z 1 + w z 1
where xz is an a priori state estimate at time step z, A is the state transition matrix applied to the previous state vector xz−1. B is the control–input matrix applied to the control vector uz−1, and wz−1 is the process noise vector that is assumed to be a zero-mean Gaussian with the covariance Q, i.e., wz–1N(0,Q). If there is no control vector u, the formula can be simplified to x z = A x z 1 + w z 1 . At time step z, a measurement yz of the true state xz is made according to the following:
y z = H x z + v z
where H is the measurement matrix, which is equal to 1 here. νz is the measurement noise vector that is assumed to be the zero-mean Gaussian with the covariance R. Now, given the initial estimate of x0, the series of measurement y and the information of the system described by A, B, H, Q, R, the Kalman filter can be operated according to the procedure in Table 1.
In the equations in Table 1, the hat operator, ˆ, represents an estimate of a variable. The superscripts, -, denote the predicted estimate. The new term P representsthe estimate error covariance. P z = E e z e z T is an a priori estimate error covariance and P z = E e z e z T is an a posteriori estimate error covariance. e z x z x ^ z and e z x z x ^ z are a priori and posteriori estimate errors, respectively. In practical application, an initial P0 should be set first, and then the p value will stabilize quickly as the calculation goes on.

2.4. Kalman Filter for OCT Signals

The proposed method was based on the time-varying Kalman filter. The intensity of the OCT signal varies with depth, so the “time step” in this section should be called the “depth step”. To process OCT signals using the Kalman filter, a linear prediction model with exponential attenuation is required. In OCT, the linear relationship between the amount of attenuated irradiance and the irradiance of the incident light beam is determined by the following equation:
x z = x 0 · e 2 i = 0 z 1 μ [ i ]
The linear prediction model of exponential decay can be derived by dividing xz by xz−1.
x z x z 1 = e 2 i = 0 z 1 μ [ i ] e 2 i = 0 z 2 μ [ i ] = e 2 μ z 1
x z = e 2 μ z 1 · x z 1
The above formula can be rewritten into the form of the Kalman filter, expressed as follows:
x ^ z = e 2 μ z 1 · x ^ z 1
where e 2 μ z 1 corresponds to the system parameter A shown in Equation (3). There is no control vector, so the system parameter B = 0.
In this linear predictive equation, speckle noise and sharp changes in the organizational structure are the main factors that affect the prediction accuracy. Speckle noise constitutes the process noise, the covariance of which is indicated by Q. P is the estimate error covariance. Speckle noise varies with signal intensity, so Q varies with depth too. The estimated error covariance can be rewritten as follows:
P z = e 2 μ z 1 · P z 1 · e 2 μ z 1 + Q z 1
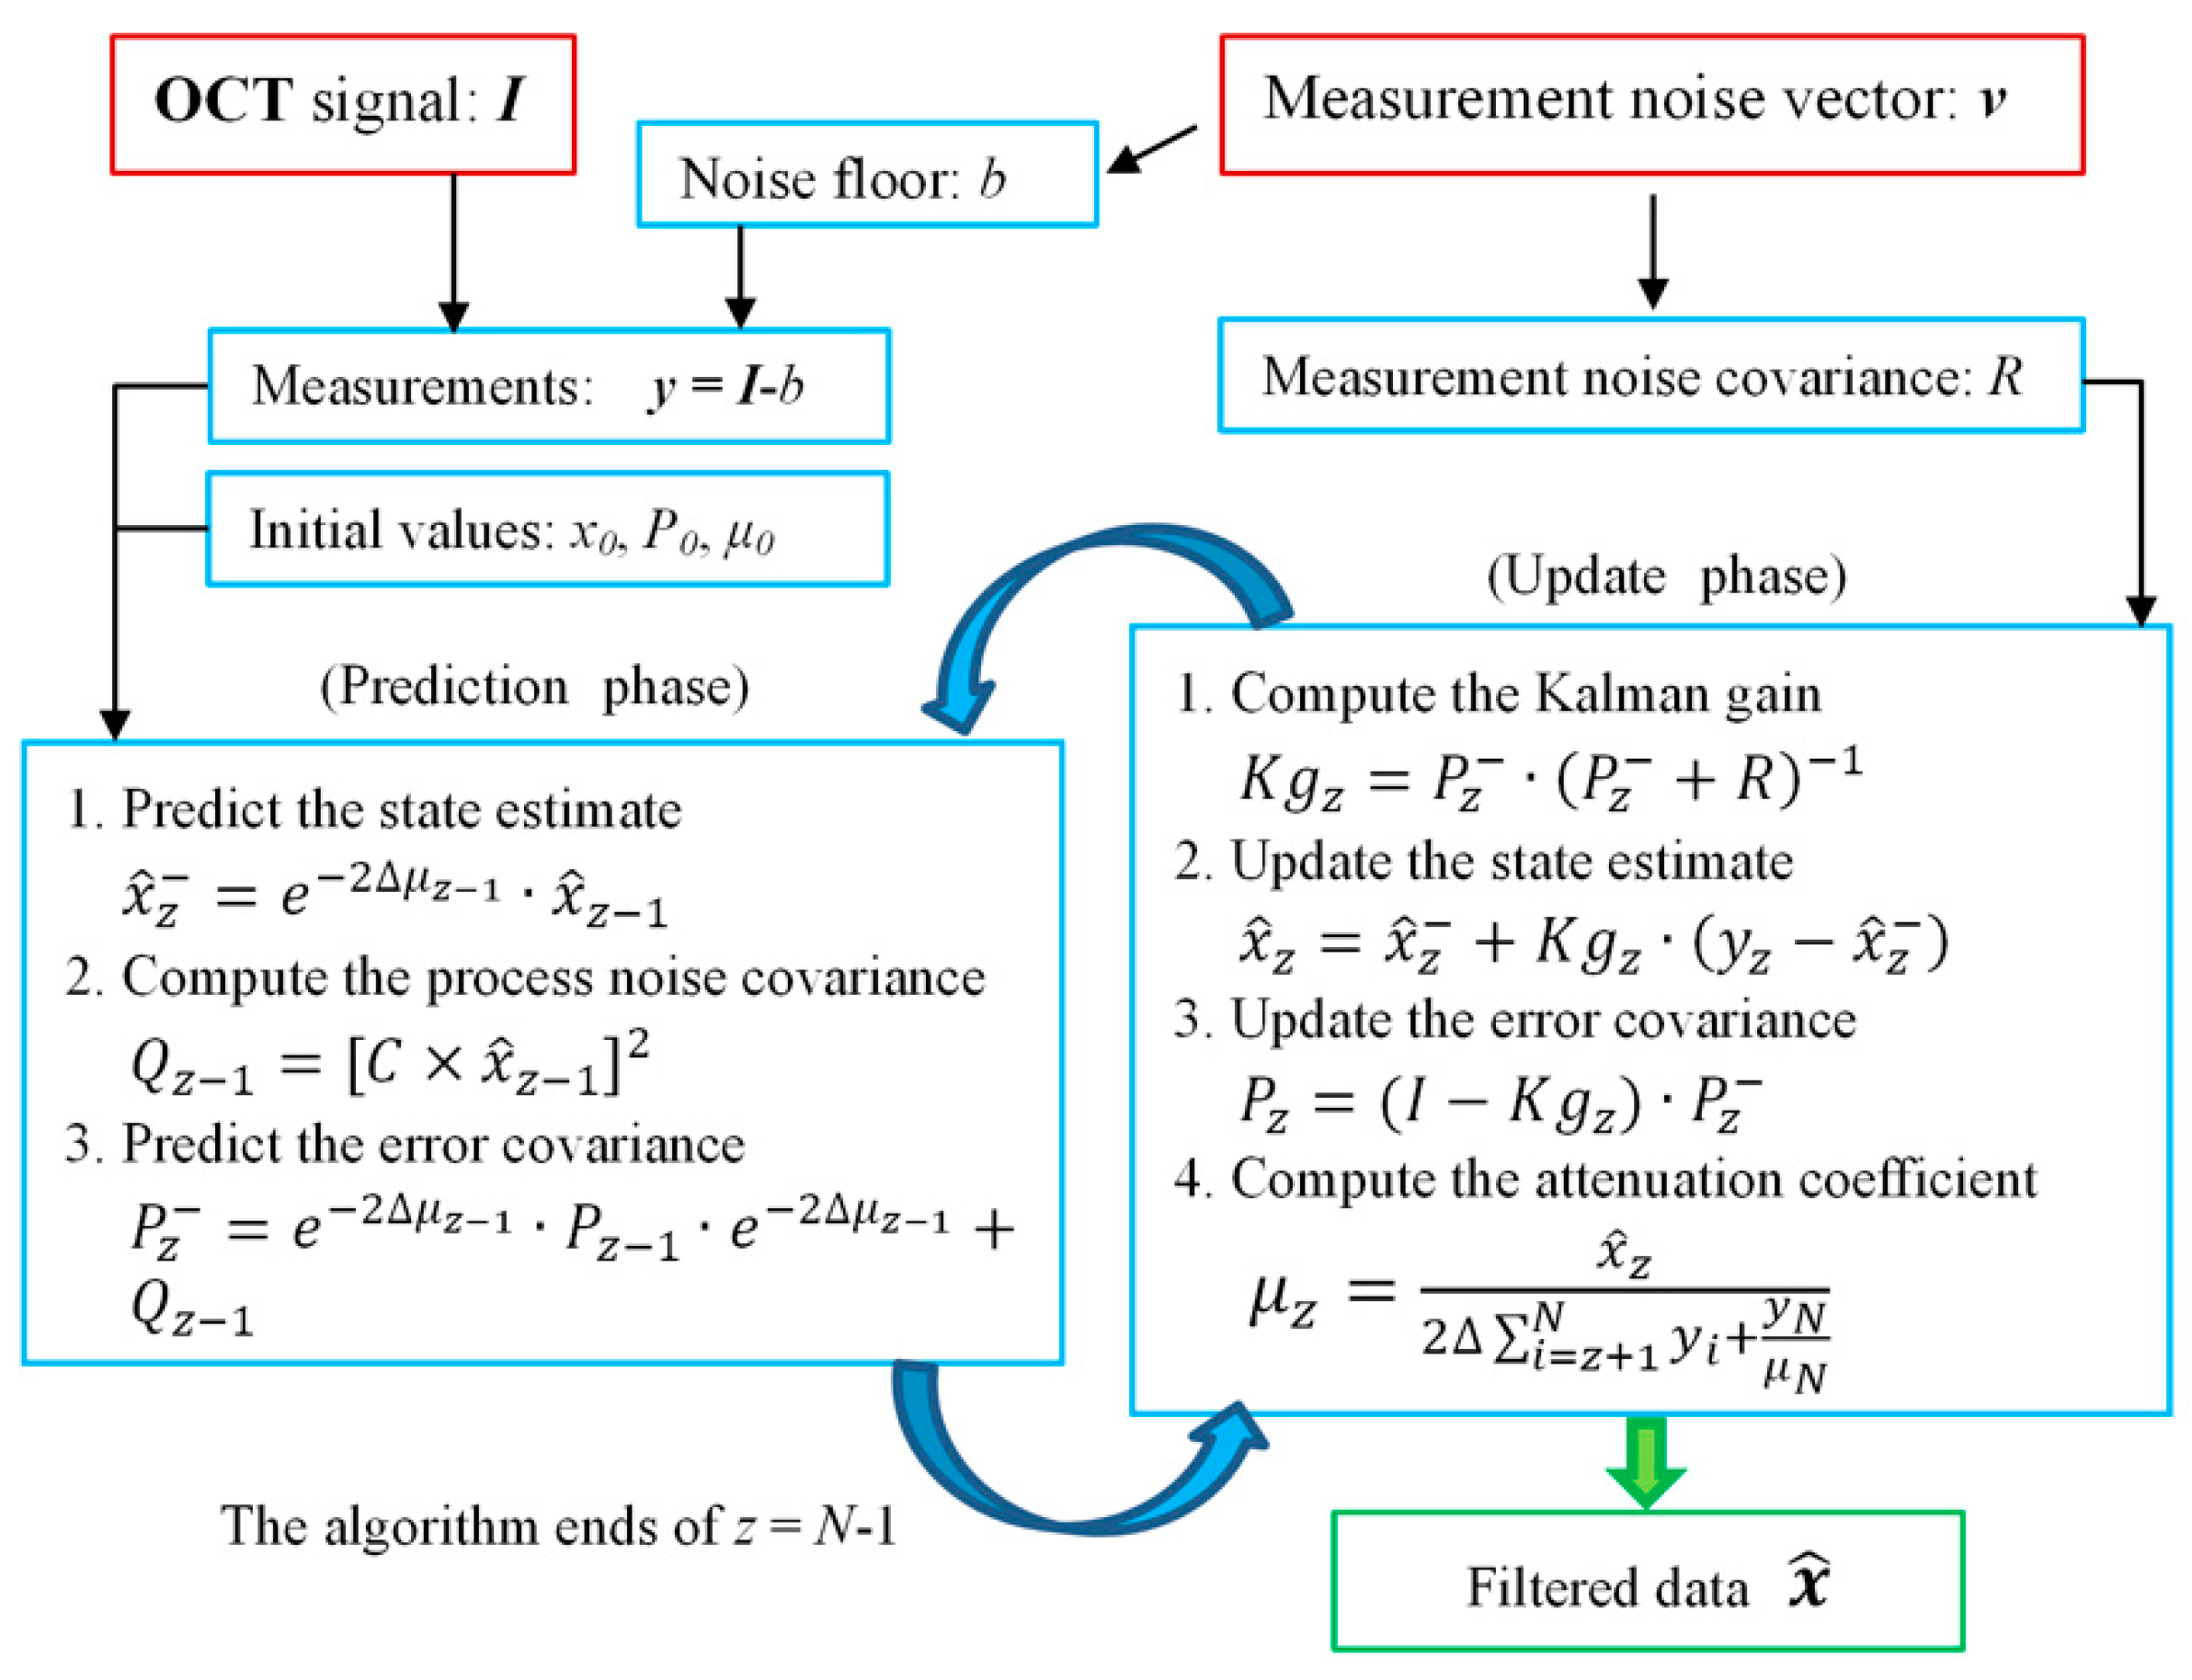
According to Section 2.2, the variance of speckle noise is [C × y]2, C = 0.447. For a one-dimensional signal, the covariance is equal to the variance, that is, Qz = [C × yz]2. However, the measurement yz already involves the measurement noise vz. The speckle noise, in theory, should not be affected by the measurement noise v. Therefore, we let Qz–1 = [C × x ^ z−1]2. On the other hand, the measurement noise is mainly caused by additive noise (i.e., the noise floor), so the measurement noise covariance R is equal to the covariance of the noise floor. The noise floor can be obtained by shielding the sample arm and collecting the reference arm signal separately. Since the OAC μ has been included in the linear prediction model, the Kalman filter requires an additional equation to calculate the current depth step of the OAC to predict the state estimate of the next depth step. In this study, Equation (2) was used to calculate the OAC at the current depth step. The entire algorithm process is shown in Figure 3:
In Figure 3, the red boxes are the inputs, the green box is the output, and the blue boxes are the process variables. I is the original OCT signal. v is the noise vector obtained by recording the reference arm spectrum. b is the mean of the noise vectors. y is the OCT signal after subtracting b. The initial value x0 = y0, μ0 can be calculated using Formula (2). The initial value P0 is set to 1. P0 has little effect on the result. In general, it cannot be set to 0. Finally, the OAC at any depth can be accurately obtained by applying Formula (2) again to the output x ^ .

3. Result

3.1. Numerical Simulations

Firstly, the proposed method was used to process the numerical simulation shown in Figure 2. The results are shown in Figure 4.
Figure 4 shows the Kalman filter result and the corresponding OAC calculated from the filtered data. The blue curve in Figure 4a represents the OCT signal after subtracting the mean of the noise floor. The red curve represents the filtered signal.
It can be seen that the filtering scale of the shallow signal is small, but with the increase in depth, the filtering scale becomes larger and larger. Figure 4b is the OAC calculated from the filtered data; the accuracy and stability of the OAC have been greatly improved compared to Figure 2d.
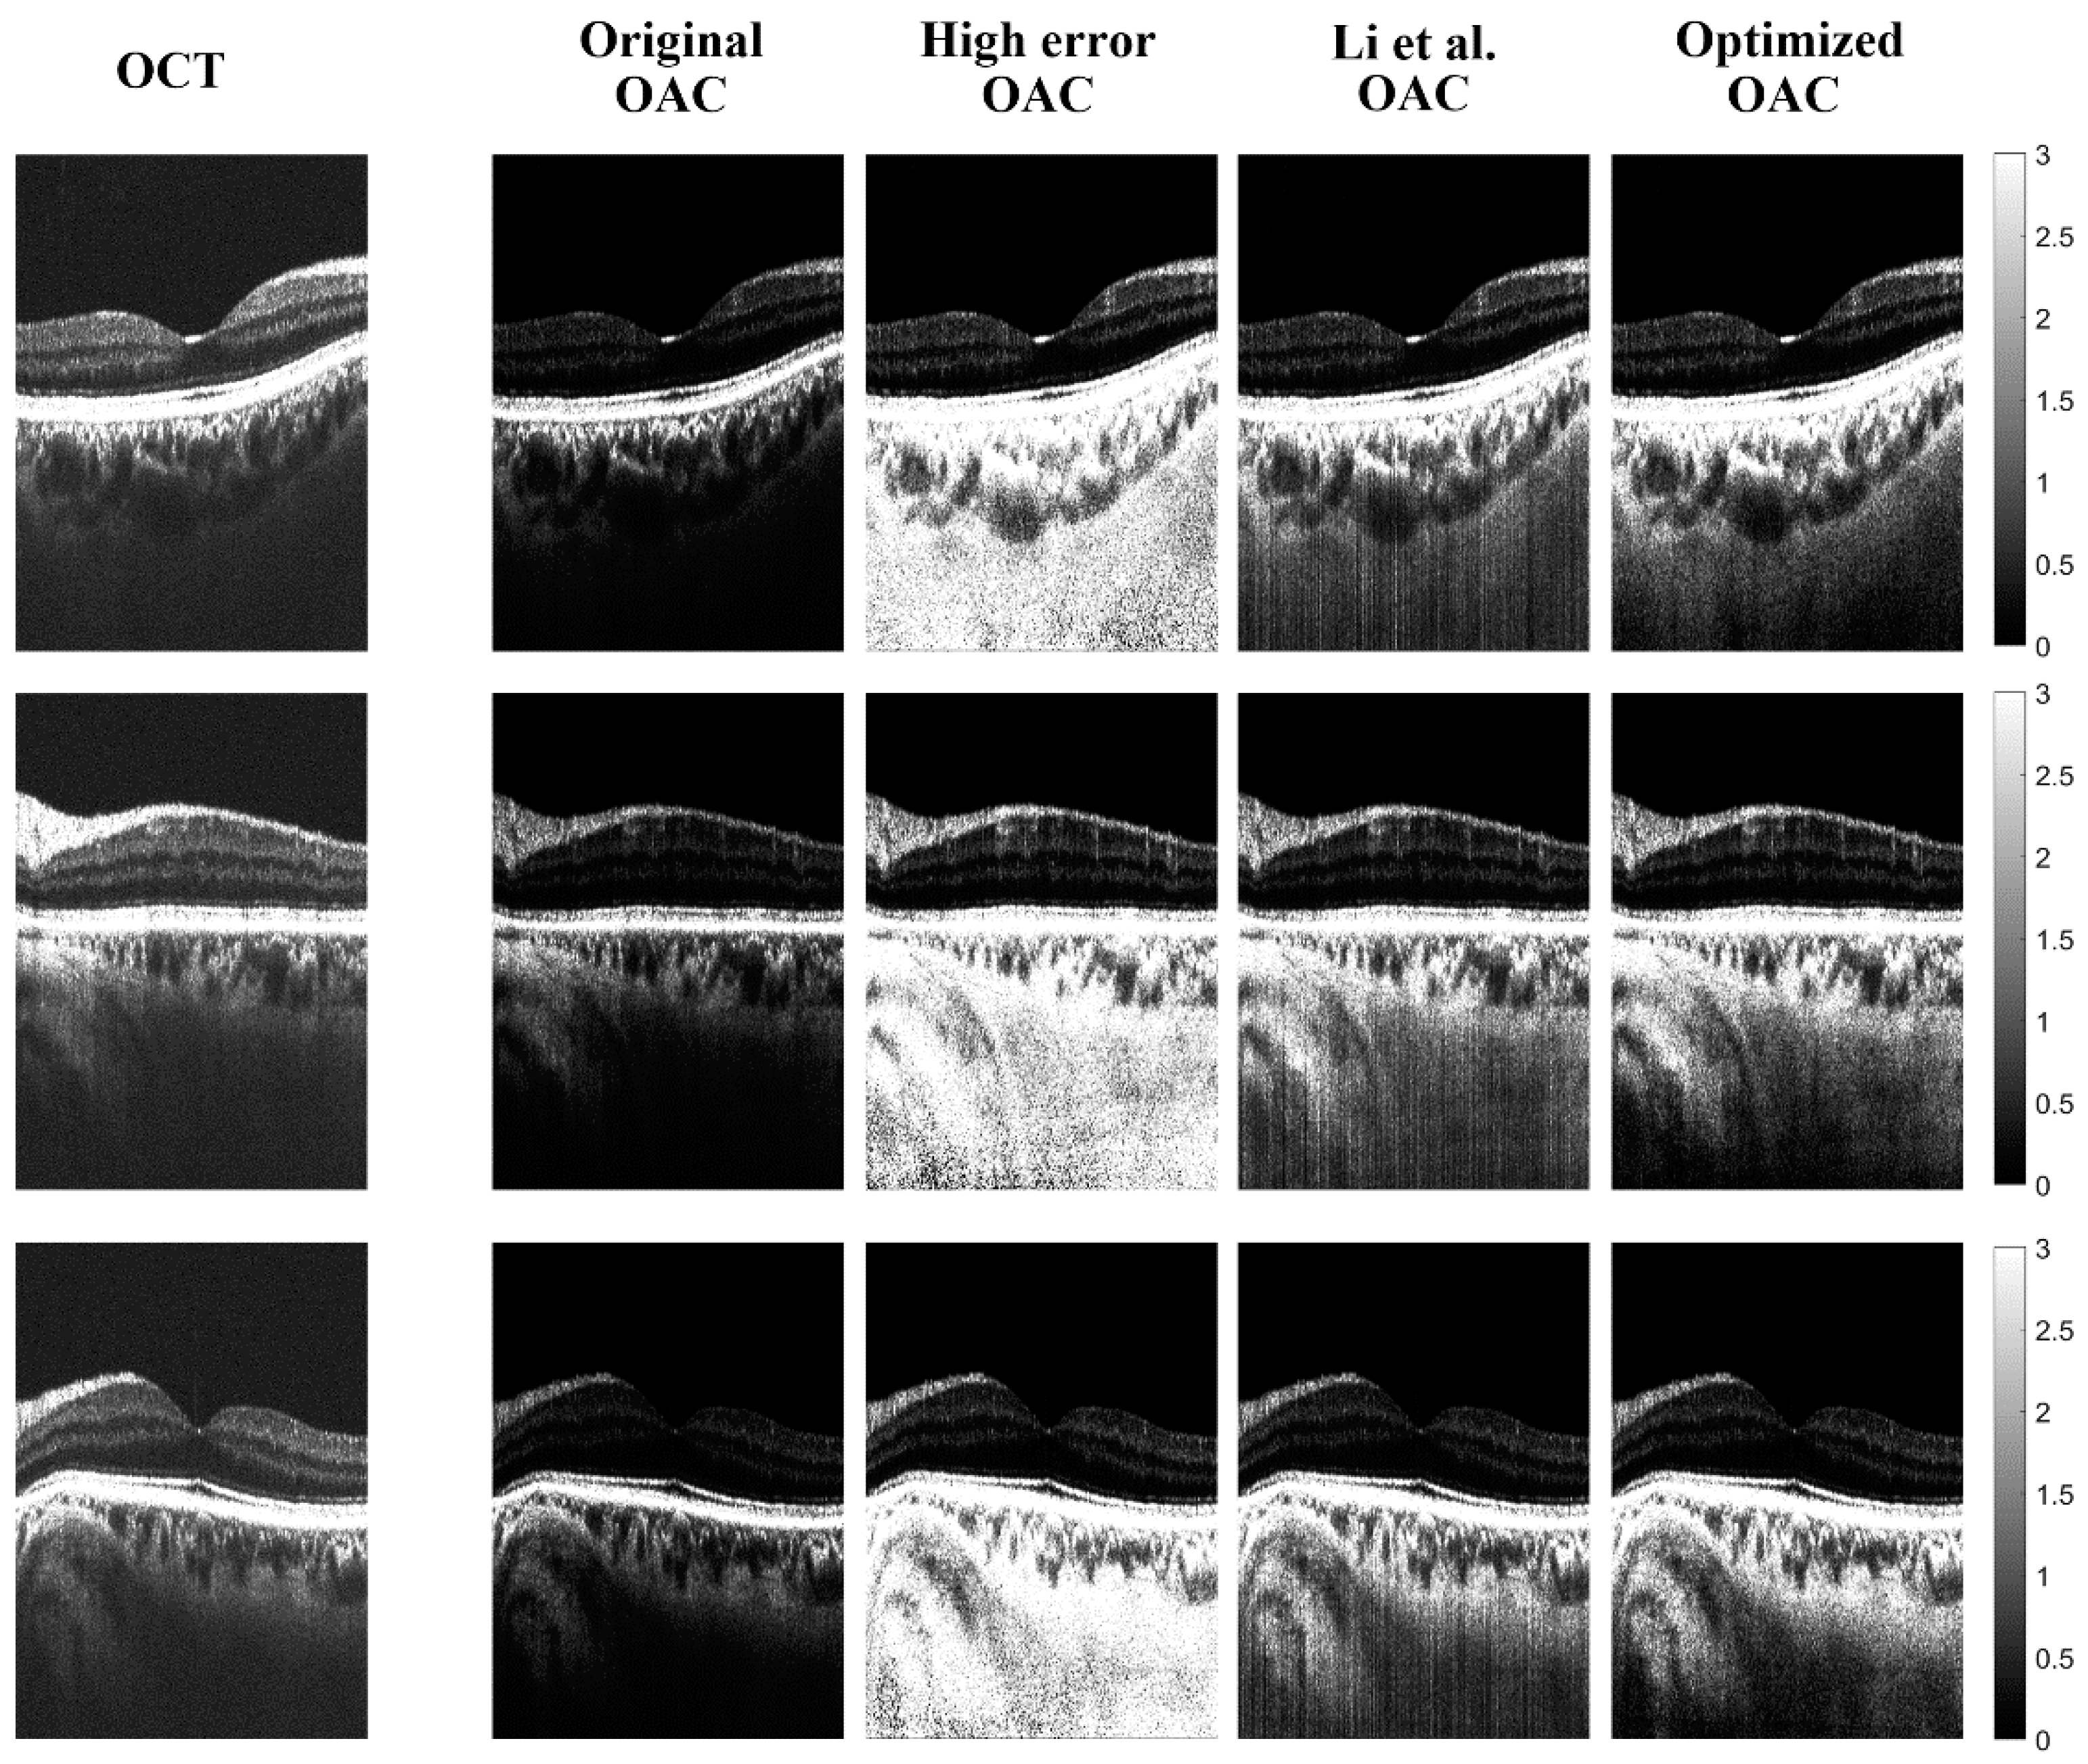
In order to facilitate subsequent comparative studies, we renamed the OACs obtained by different methods. The OAC shown in Figure 2b is calculated based on the original OCT data containing noisy floors; we call this the “original OAC”. The OAC shown in Figure 2d is calculated using OCT data and subtracting the mean value of the noise floor, but does not suppress the noise intensity. The fluctuation range in the OAC increases rapidly with the depth, in other words, the error increases significantly. Therefore, we call it the “high-error OAC”. The OAC calculated using Li et al.’s algorithm [23] is referred to as the “Li et al. OAC” for short. We call the OAC shown in Figure 4b and obtained using Kalman filter optimizationthe “optimized OAC”.

3.2. Phantom Experiments

A swept-source OCT (SS-OCT) system that was set up in our previous work [32] was used in this paper. The light source employed was an akinetic swept source (MEMS-VCSEL, Thorlabs Inc., Newton, NJ, USA), which operated at a 200 kHz swept rate and at a central wavelength of 1300 nm with a 100 nm bandwidth in order to provide an axial resolution of ∼7.5 μm and a lateral resolution of ∼16 μm in air. The beam emitted by the swept source was split into the sample arm and the reference arm by a 90:10 ratio coupler (TW1300R2A2, Thorlabs Inc., Newton, NJ, USA). In the sample arm, an aiming beam was combined with another 99:1 coupler to guide the OCT imaging.
An optical phantom with 0.1 wt % concentrations of TiO2 particles was fabricated and used. Since the phantoms are homogeneous, the exponential fitting method can be applied to the entire depth range, and the results are credible and can be used as a standard for evaluating other methods. The confocal axial point spread function (PSF) proposed by Faber et al. [33] was used to remove the influence of confocal characteristics, which is described as follows:
I ( z ) h ( z ) e 2 μ z
h ( z ) = z z c f z R 2 + 1 1
where μ is the OAC, z is the signal depth, the function h(z) is the axial PSF, and zcf is the position of the confocal gate, which was recorded during the experiment. zR is the ‘apparent’ Rayleigh length used to characterize the axial PSF.
z R = α π n w 0 2 / λ
where w0 is the minimum beam radius, λ is the center wavelength of the light source, n is the refractive index (we used n = 1.353), and α is used to distinguish specular reflection (α = 1) from diffuse reflection (α = 2). The influence of the confocal characteristics could be removed by dividing the intensity of OCT signals by the axial PSF h(z).
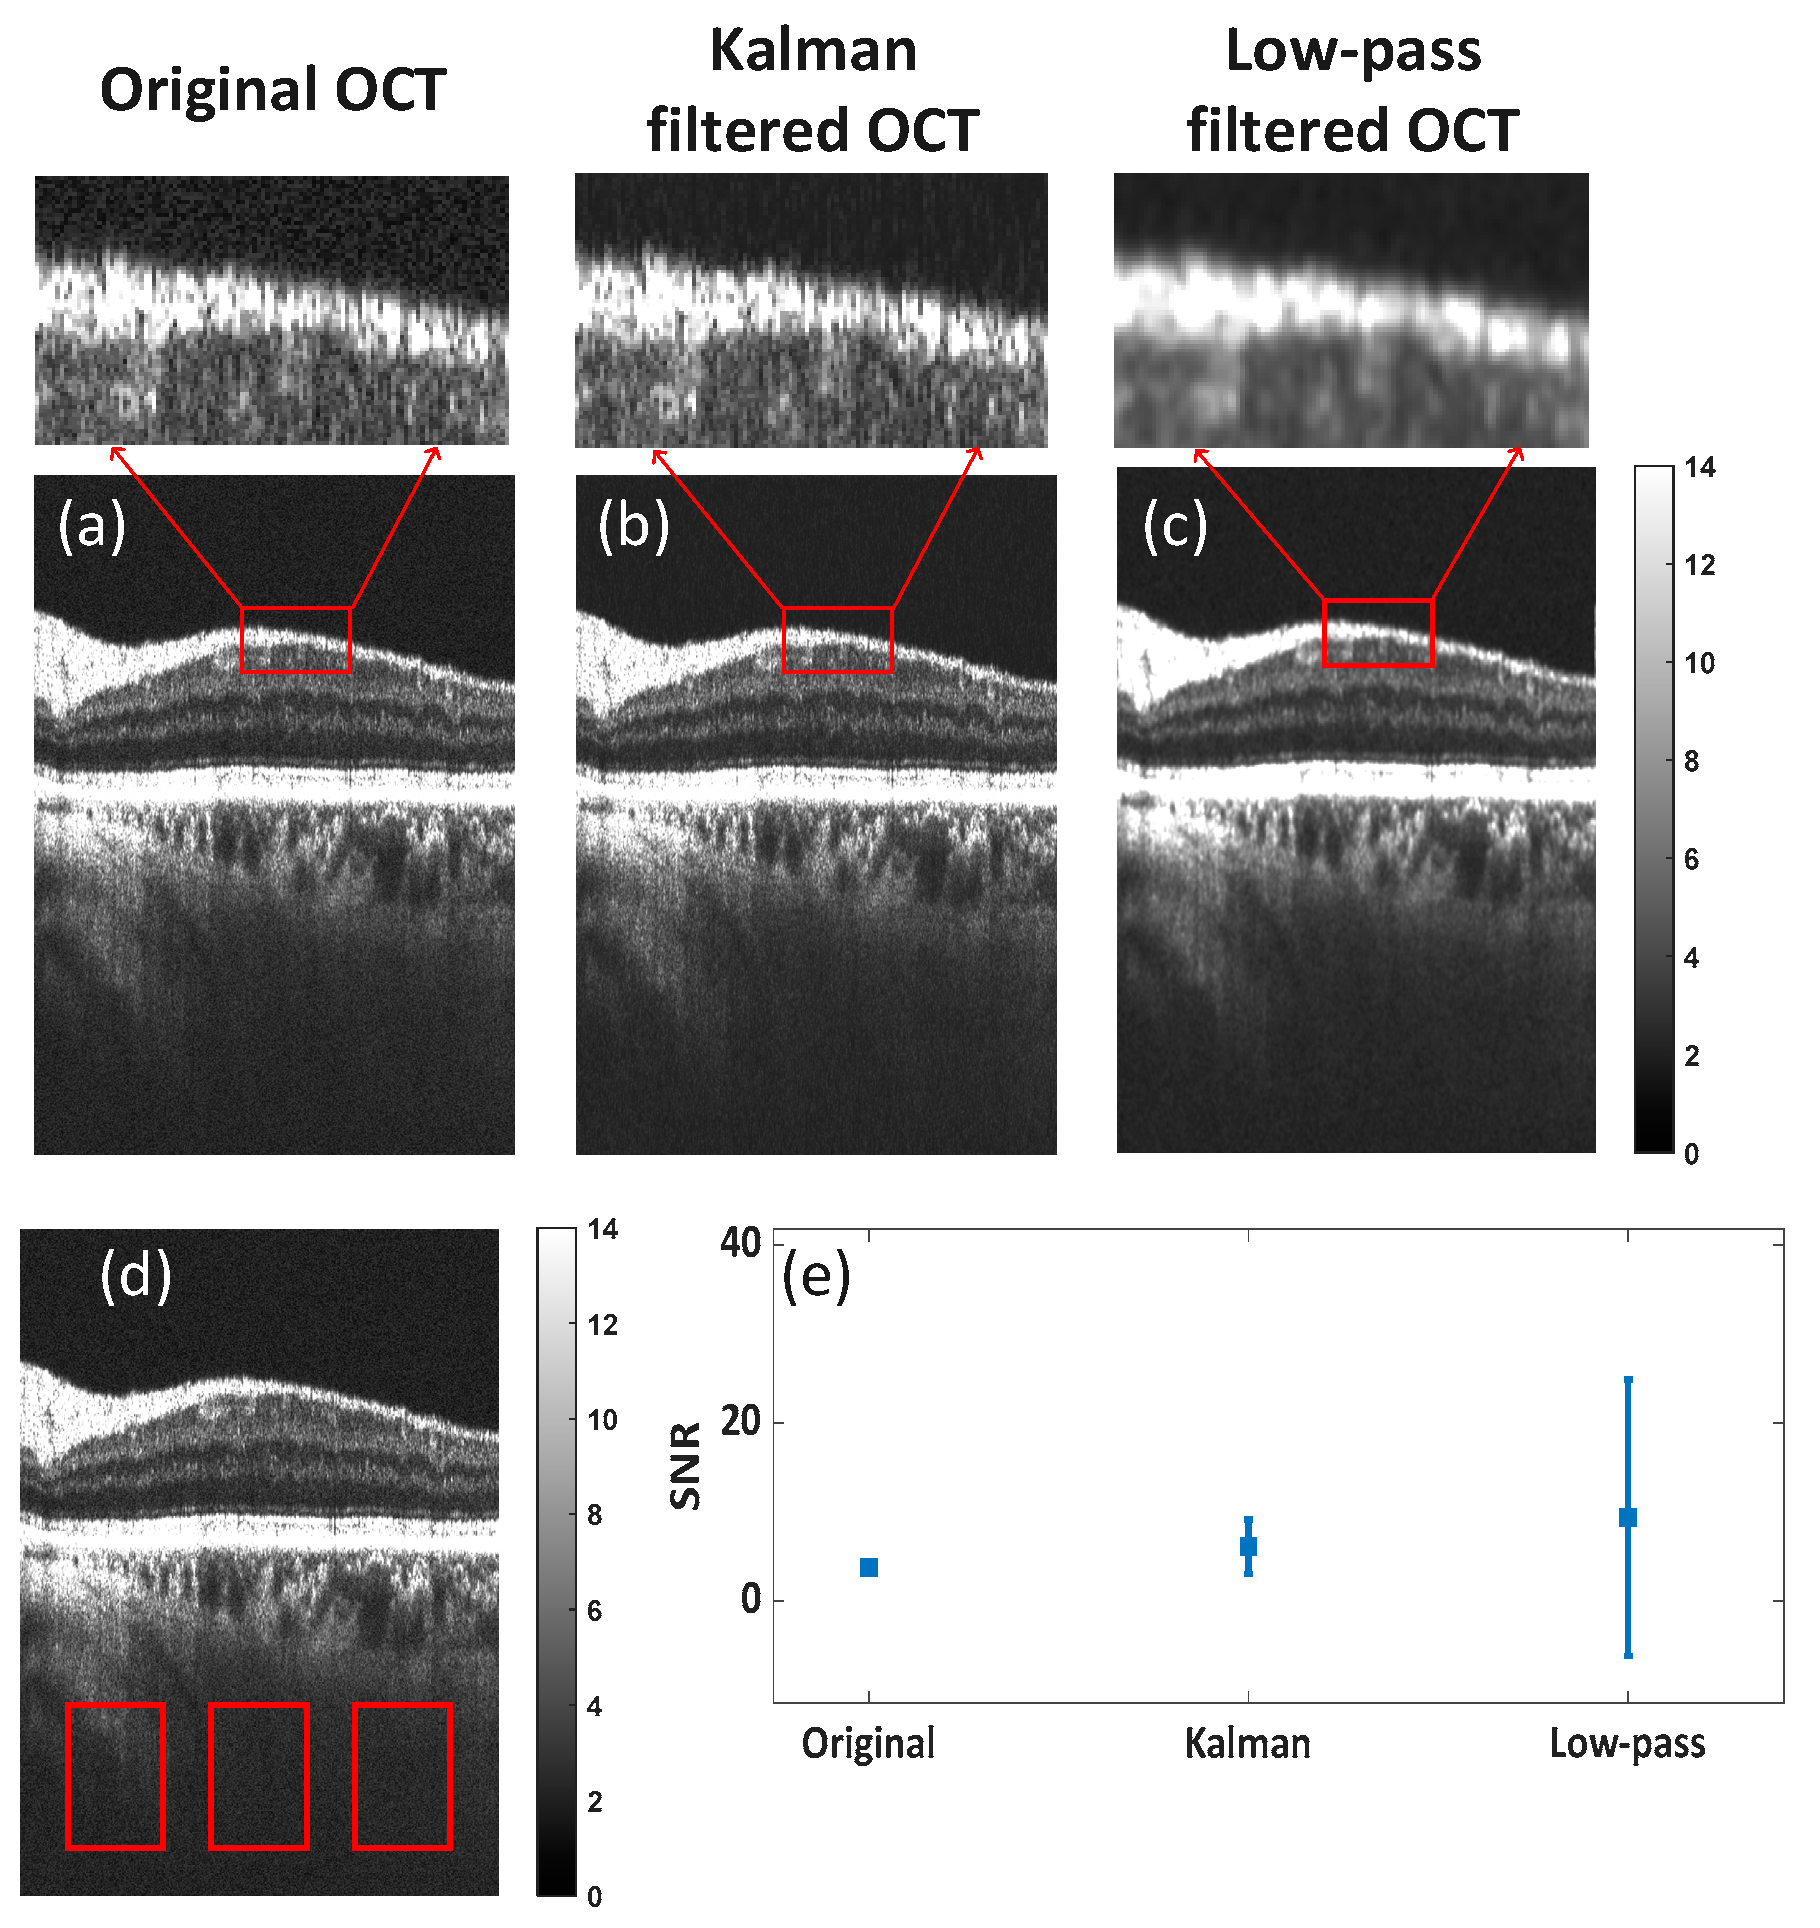
Comparing the quality of the OCT images obtained using different filters is the most direct way to verify the performance of various algorithms. Here, we compared the quality of the OCT images obtained using Kalman filtering with those obtained using low-pass filtering. Figure 5 shows a comparison of the OCT image processing results using a Kalman filter and a 5 × 5 Gaussian low-pass filter. a–c are the original OCT images, the Kalman-filtered OCT images and the low-pass-filtered OCT images, respectively. The upper subimages are locally magnified images from a to c, respectively. We extracted three regions from the deep positions of a to c, respectively, as shown in d. The SNR of these three regions was calculated, and the mean and standard deviation of the SNR of the three regions were plotted in figure e. We found that the SNR of the deep signal of the original image was the lowest, and that both the Kalman filter and low-pass filter can improve the SNR. However, the variance in the results obtained using the Kalman filter is smaller, indicating that the stability is stronger. On the other hand, we can see from the local magnification that the low-pass filter blurred the shallow image, while the Kalman filter did not.
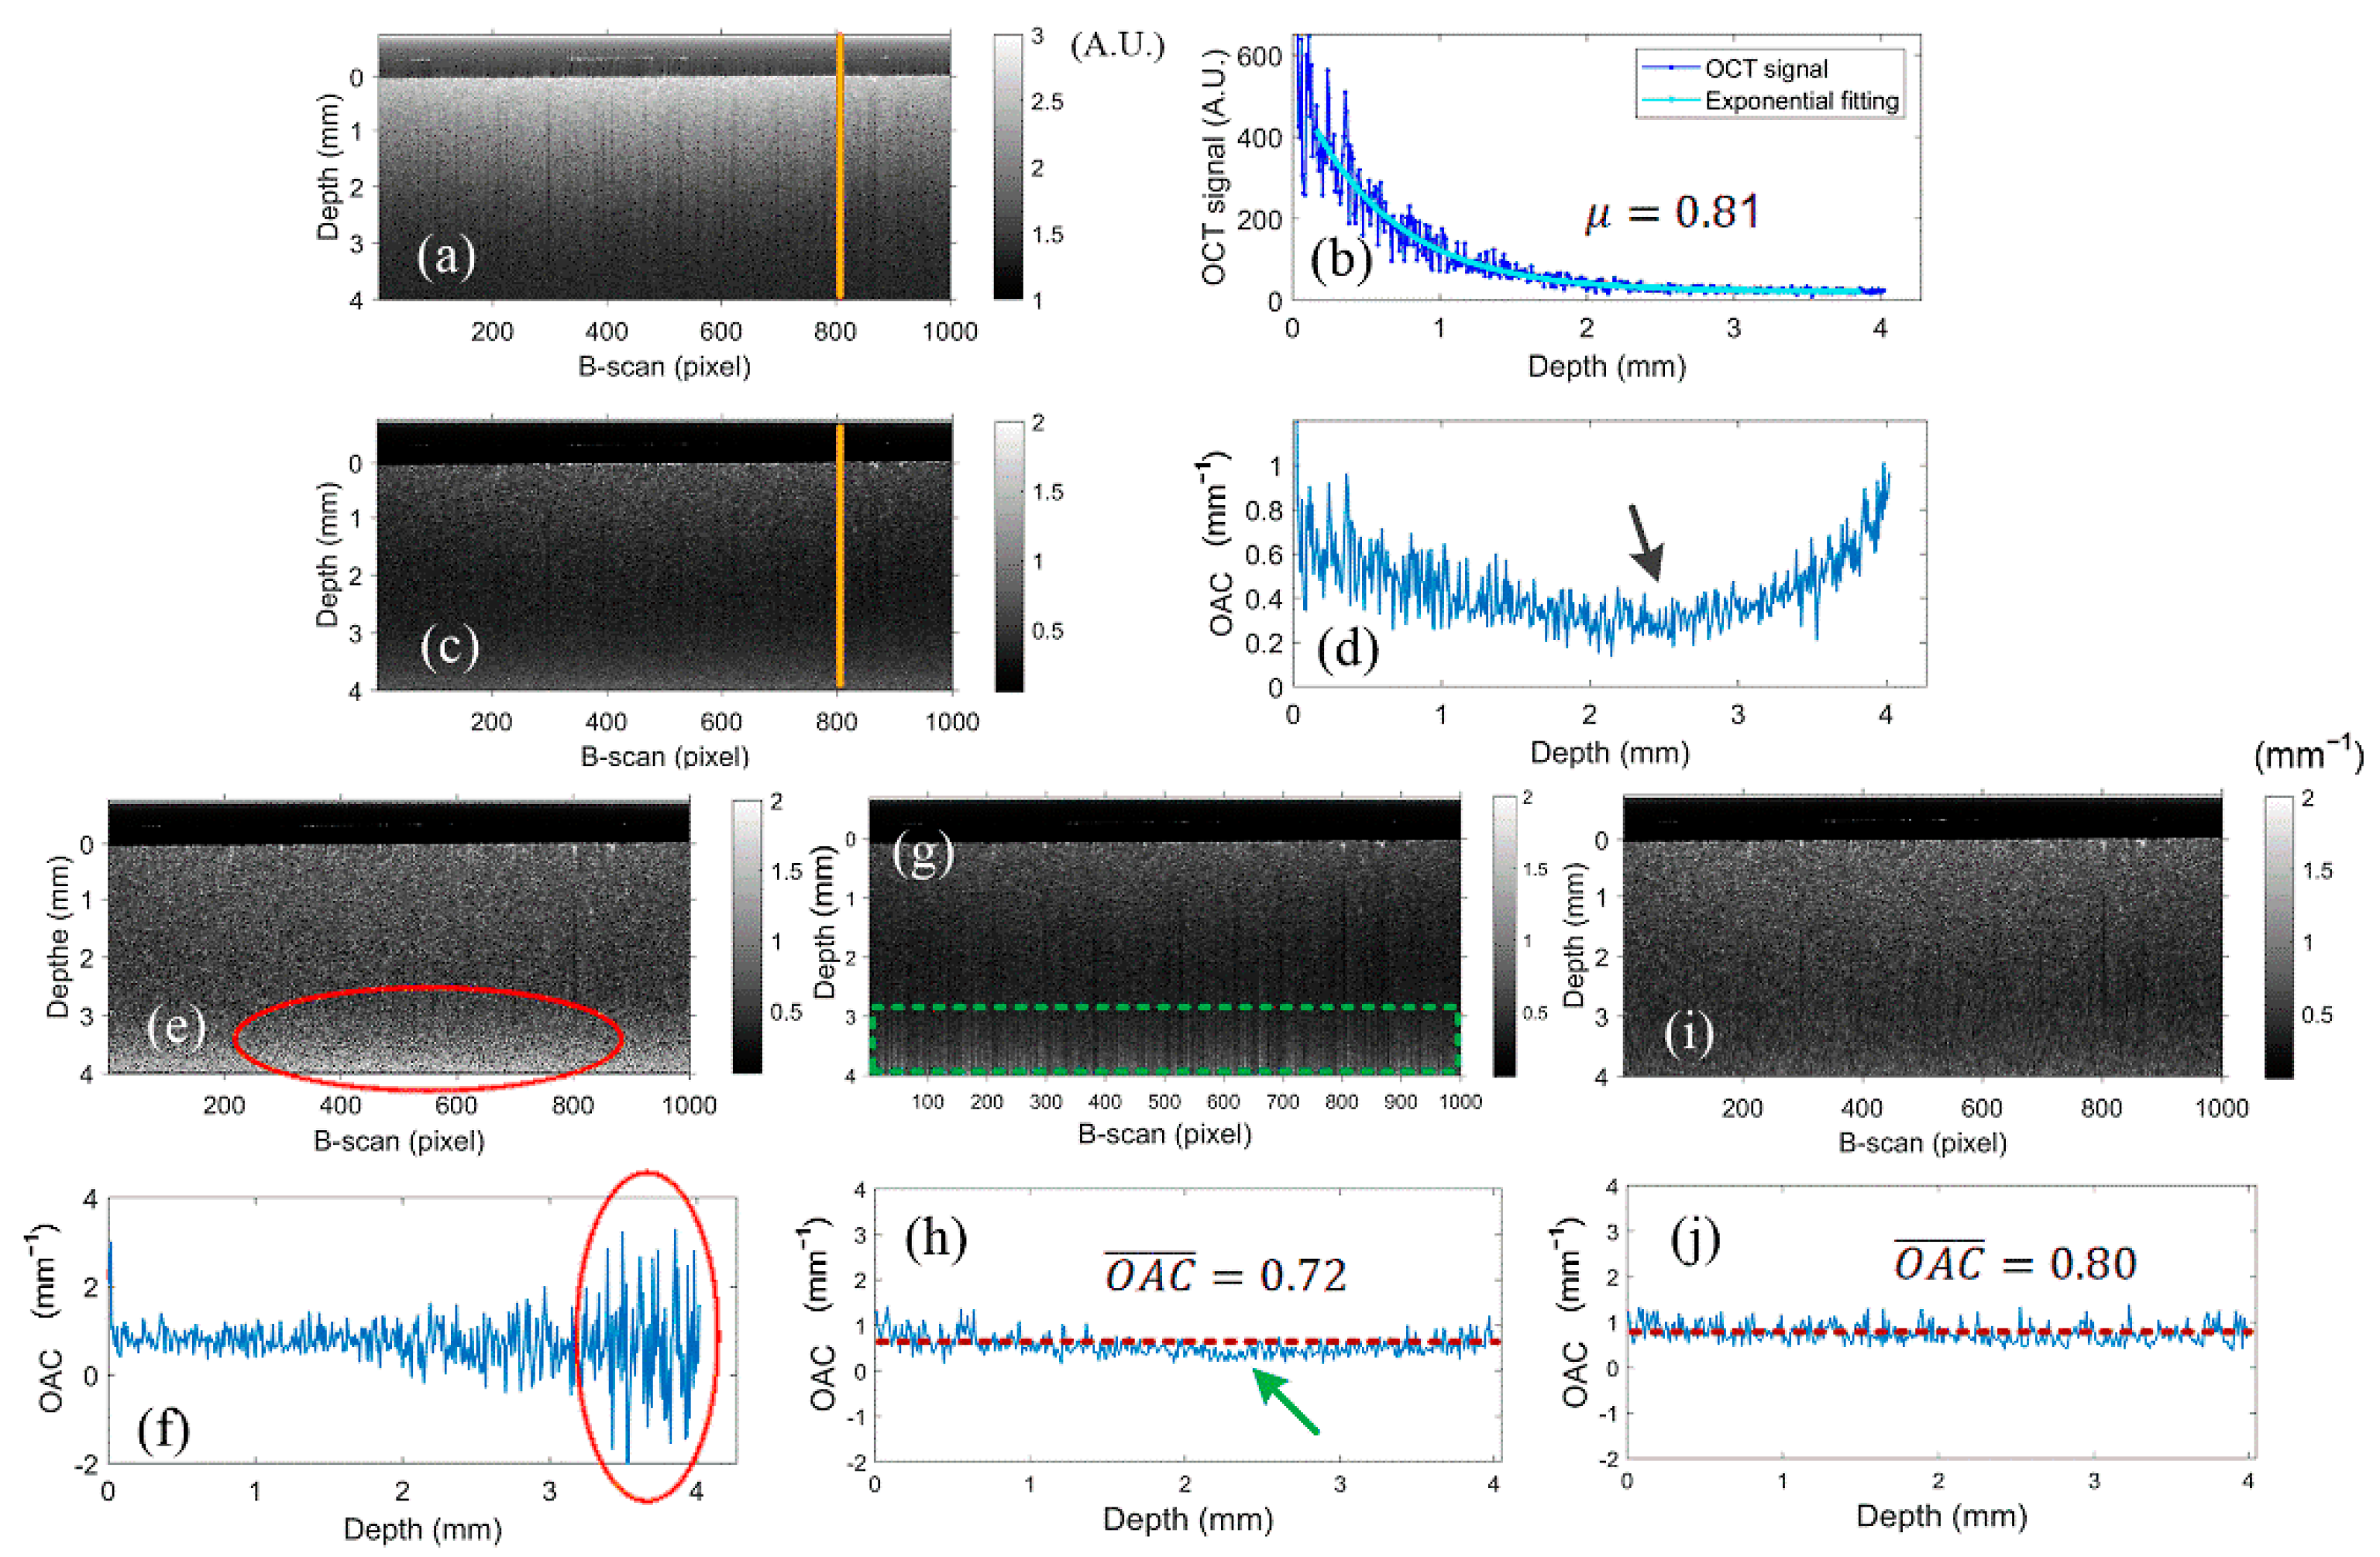
The logarithmic OCT intensity image of the phantom is shown in Figure 6a. Figure 6b is the result of exponential fitting. The dark blue curve is a typical A-scan data (shown by the yellow solid line in Figure 6a. The light blue curve is the exponential fitting result. The fitting model is y = a · e 2 μ x + b ,  b = 10 (A.U.). The result of the OAC (μ) is 0.81 mm−1. Figure 6c is the original OAC image calculated using the original image, and Figure 6d is the original OAC curve at the position of the yellow line in c. The underestimation of the OAC can be seen more significantly from Figure 6d. The OAC at the position shown by the black arrow is even lower than 0.4 mm−1, which is only half of the real OAC value. Figure 6e is the high-error OAC image calculated using the image after the subtraction of the mean of the noise floor. It can be seen that the brightness of Figure 6c is significantly lower than that of Figure 6e. Figure 6f is the high-error OAC curve. The fluctuation range in the tail OAC can be seen to have increased significantly (Red oval). Figure 5g is the OAC image calculated by Li et al.’s algorithm. This algorithm needs to cut off the tail OCT signal with a low SNR, and then use the compensation algorithm to accurately calculate the OAC of the remaining signals. If the tail signal is retained, as in Figure 5a, the algorithm generates instability factors, causing bright (dark) streak artifacts to appear in the deep regions of the image (shown in the green box in Figure 5g). Figure 5h is the OAC curve obtained using Li et al.’s algorithm, with an average value of 0.72. There is a slight underestimation of the OAC in the middle region (green arrow). Figure 5i is the final optimized OAC image. The OAC values of all the pixels within the imaging depth range are very uniform and accurate. Figure 5j is the optimized OAC curve calculated using the filtered data. The average OAC value is 0.8, which is very close to the exponential fitting result.
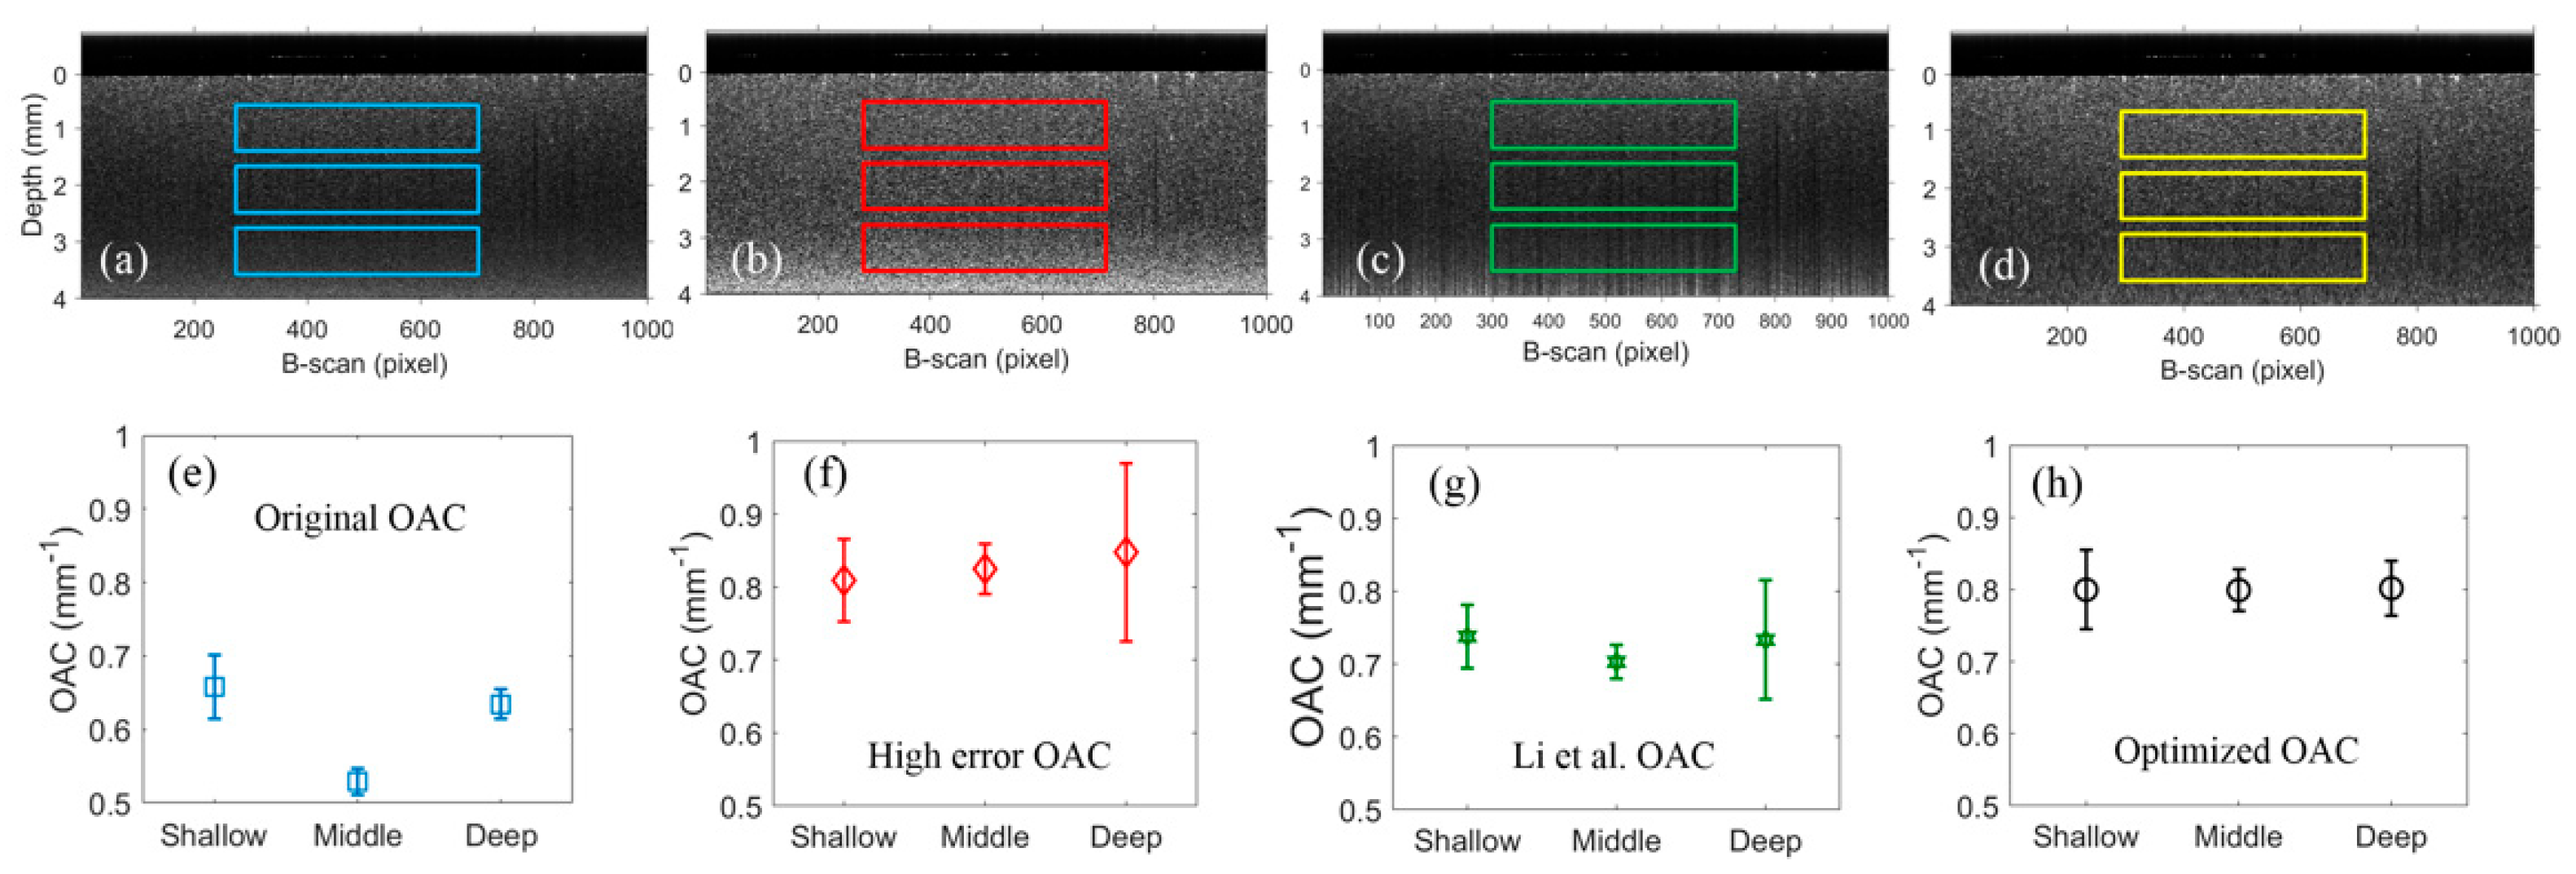
In order to show the accuracy and stability of the algorithm more intuitively, we extract rectangular regions from the shallow, middle, and deep layers of the image, and calculate the mean and standard deviation of the OAC within the region. Figure 7a–d shows the OAC images obtained using four methods and the regions to be detected. Since phantom is a homogeneous medium, the OAC of the three regions should have been close (approximately equal to 0.81), and the standard deviation should have been within an appropriate range. However, Figure 7e shows that the OAC values of the three regions are all much less than 0.81. In Figure 7f, although the average values of the three regions are close to 0.81, the standard deviation of the OAC in deep tissue can be seen to have increased significantly. The OACs in Figure 7g are slightly underestimated, but are significantly better than those in Figure 7e. The variance in the OACs of the deep tissues increased slightly, but were much lower than those in Figure 7f. Figure 7h shows that the OAC mean and standard deviation of the three regions of the optimized OAC image are very close. This shows that the method in this paper can significantly improve the accuracy and stability of the OAC.

3.3. In Vivo Experiments

In this section, we show a group of in vivo experiments and human fundus images. Five healthy subjects aged 25 to 38 years were recruited. The subjects were recruited from Northeastern University and had no anterior or posterior segment disease, systemic disease, history of laser treatment, trauma, or eye surgery. The Northeastern University Ethics Committee approved this human eye imaging study based on the principles of the Declaration of Helsinki. In this experiment, we employed an SS-OCT system with a central wavelength of 1060 nm and a bandwidth of 100 nm (MEMS-VCSEL, Thorlabs Inc., Newton, NJ, USA). This can provide an axial resolution of 11μm and a lateral resolution of 13 μm.
A comparative experiment similar to that in Figure 5 was also performed in this section, and the results are shown Figure 8. Similar to the phantom experiment, the Kalman filter can not only improve the SNR of the deep images, but can also prevent the shallow images from blurring.
Figure 9a shows a typical fundus OCT B-scan image. Because SS-OCT has a stronger penetrating ability, we can clearly distinguish the choroid part. Figure 9b–d show the original OAC image, high-error OAC image, and Li et al. OAC image, respectively. The signal intensity of the original OAC image is significantly lower than the other two, while the fluctuation range in the OAC at the deep position of the high-error OAC image increases significantly. Streak artifacts exist in Figure 9d. Figure 9e shows the optimized OAC image obtained using the algorithm in this paper. Figure 9f compares the four OAC curves at the position of the solid orange line in a. Figure 10 shows the OAC calculation results of the ocular fundus tissues obtained from other subjects.

4. Discussion

OCT technology has been widely used in many fields since it was proposed in 1991. However, the OCT signal is influenced by many factors, such as the incident light intensity, focal plane position and sample placement angle, etc.. Meanwhile, the OAC reflects the unique optical properties of biological tissues, and is not interfered with by the above factors, so it can provide a more valuable reference for disease diagnosis and quantitative analysis [34]. Therefore, it is important to obtain an accurate OAC.
Spectral Domain OCT (SD-OCT) is limited by the spectral resolution, and its sensitivity decreases rapidly as the imaging depth increases. The SS-OCT developed in recent years has proven to have significant advantages, including a faster scanning speed, stronger light intensity and higher spectral resolution. Due to these advantages, the sensitivity and penetration depth of the SS-OCT system have been significantly improved. A study has shown that the sensitivity of the SS-OCT system can remain stable within 30 mm, and it is only decreases by 10 dB in the range of 30–60 mm [35]. With the help of SS-OCT, we can study the attenuation characteristics of deep tissues. However, the existing methods have many shortcomings regarding the calculation of deep tissue OAC.
In this paper, we proposed an optimization algorithm based on the Kalman filter in order to calculate the OAC of deep tissue. In Equation (3), ‘u’ is an optional control input. If the system is stable, and its output is only related to its inputs and system function, then the control input ‘u’ can be ignored. If the system is unstable, the output of the system is affected by the environment (humidity, temperature, magnetic field strength, etc.). Then, the system needs to introduce ‘u’ to correct it. Alternatively, if the system needs to switch modes according to the situation, then an additional control input ‘u’ needs to be introduced in order to adjust the system. The OCT system is a stable system. It is not affected by external factors and does not need to switch modes during operation. Therefore, the control input ‘u’ can be ignored. The initial value P0 has little impact on the result. In this article, P0 is set to 1, and during the first calculation, the estimate error covariance P z is approximately equal to the process noise covariance Q. Because Q is much larger than R when calculating the Kalman gain, the system still trusts the measurement. After several iterations, the P z adjusts to the appropriate value and stabilizes. In addition to P0, the algorithm in this paper does not require any artificial parameters. Therefore, the algorithm is very objective. This enables the method to be applied to a wider range of fields and more complex situations.
A unified phantom was used to test algorithm performance. For homogeneous media, both the average value and standard deviation of the OAC should be similar, regardless of any position within the detection depth range. However, few existing methods can achieve such results. The main problem is that the impact of NFE increases significantly as SNR decreases. Since multiplicative noises (speckle noise) are considered to be fixed components of the signal, their ratio is constant. The negative effect of directly subtracting the mean of the noise floor is that the vibration fluctuation range in the tail OAC increased significantly. Although this method can obtain a relatively accurate OAC value in shallow and middle tissues, in deep tissues, the accuracy and recognizability of the OAC are very low. The main idea of Li et al.’s method is to subtract part of the tail signal (the tail signal contains a lot of noise and the SNR is very low), and then use a compensation algorithm to accurately calculate the OAC of the remaining part. This method is similar to our previous proposal [22]. Although the performance is improved, the disadvantage is that the OAC of deep tissues is sacrificed. In addition, this method recursively calculates the OAC from the boundary value μ[N]. If the tail signal is not cut off, the inaccurate μ[N] will affect the accuracy of μ[N − 1], μ[N − 2] and so on. As such, all subsequent OACs are affected. This is why the striped pattern appears in the deep region of the OAC image. Fortunately, this effect gradually diminishes as the SNR increases.
The numerical simulation experiments show that the proposed algorithm has high accuracy. The proposed method’s accuracy and stability have been verified through the phantom experiment. In human eye imaging experiments, the results of the proposed algorithm show high clarity and recognizability, which not only eliminate the various errors found in deep tissue OAC, but also retain the image details to the greatest extent. These results fully demonstrate the great potential of the proposed algorithm in actual OCT clinical diagnosis.

5. Conclusions

OCT-ai is a promising imaging technology. The Kalman filter-based depth-resolved method proposed in this paper can suppress NFE well and accurately calculate the OAC of deep tissues. From the phantom and in vivo experiments, we can see that the deep signals of the OAC images of fundus tissue obtained using the algorithm proposed in this paper have no underestimation error, no overestimation error, and no sharp fluctuations or striation artifacts. The obtained OAC images are clear, accurate, and highly identifiable, which can provide a reliable basis for quantifying and diagnosing fundus deep tissue. This technology is expected to play an important role in the diagnosis of deep tissue diseases and the evaluation of the effectiveness of treatment methods.

Author Contributions

Conceptualization, J.L., Y.W. and Z.M.; Method ology, J.L., Y.C., D.Y., Y.W. and Z.M.; Software, J.L., Y.C. and Y.H.; Validation, J.L., N.L. and Y.Z.; Formal analysis, Y.C., Y.T. and Y.Y. All authors have read and agreed to the published version of the manuscript.

Funding

This work was supported in part by National Natural Science Foundation of China (61901100 and 62075037), Hebei Provincial Natural Science Foundation of China (E2020501029, F2020501040).

Institutional Review Board Statement

The research followed the tenets of the Declaration of Helsinki and was approved by the Ethics committee of Northeastern University (No. Neu-ec2020a009s).

Informed Consent Statement

Informed consent was obtained from all subjects involved in the study.

Data Availability Statement

Data underlying the results presented in this paper are not publicly available at this time but may be obtained from the authors upon reasonable request.

Conflicts of Interest

The authors declare that there are no conflict of interest related to this article.

References

  1. Huang, D.; Swanson, E.A.; Lin, C.P.; Schuman, J.S.; Stinson, W.G.; Chang, W.; Hee, M.R.; Flotte, T.; Gregory, K.; Puliafito, C.A.; et al. Optical coherence tomography. Science 1991, 254, 1178–1181. [Google Scholar] [CrossRef]
  2. Chen, Z.; Milner, T.E.; Srinivas, S.; Wang, X.; Malekafzali, A.; Van Gemert, M.J.C.; Nelson, J.S. Noninvasive imaging of in vivo blood flow velocity using optical Doppler tomography. Opt. Lett. 1997, 22, 1119–1121. [Google Scholar] [CrossRef] [PubMed]
  3. Leitgeb, R.A.; Schmetterer, L.; Drexler, W.; Fercher, A.F.; Zawadzki, R.J.; Bajraszewski, T. Real-time assessment of retinal blood flow with ultrafast acquisition by color Doppler Fourier domain optical coherence tomography. Opt. Express 2003, 11, 3116–3121. [Google Scholar] [CrossRef]
  4. Wang, R.K. Optical Microangiography: A Label Free 3D Imaging Technology to Visualize and Quantify Blood Circulations within Tissue Beds in vivo. IEEE J. Sel. Top. Quantum Electron. 2010, 16, 545–554. [Google Scholar] [CrossRef]
  5. Wang, R.K.; An, L.; Saunders, S.; Wilson, D.J. Optical microangiography provides depth-resolved images of directional ocular blood perfusion in posterior eye segment. J. Biomed. Opt. 2010, 15, 020502. [Google Scholar] [CrossRef] [PubMed]
  6. Schmitt, J.M. OCT elastography: Imaging microscopic deformation and strain of tissue. Opt. Express 1998, 3, 199–211. [Google Scholar] [CrossRef]
  7. Larin, K.V.; Sampson, D.D. Optical coherence elastography-OCT at work in tissue biomechanics. Biomed. Opt. Express 2017, 8, 1172–1202. [Google Scholar] [CrossRef] [PubMed]
  8. Oldenburg, A.L.; Wu, G.; Spivak, D.; Tsui, F.; Wolberg, A.S.; Fischer, T.H. Imaging and Elastometry of Blood Clots Using Magnetomotive Optical Coherence Tomography and Labeled Platelets. IEEE J. Sel. Top. Quantum Electron. 2011, 18, 1100–1109. [Google Scholar] [CrossRef]
  9. Grulkowski, I.; Liu, J.J.; Potsaid, B.; Jayaraman, V.; Lu, C.D.; Jiang, J.; Cable, A.E.; Duker, J.S.; Fujimoto, J.G. Retinal, anterior segment and full eye imaging using ultrahigh speed swept source OCT with vertical-cavity surface emitting lasers. Biomed. Opt. Express 2012, 3, 2733–2751. [Google Scholar] [CrossRef]
  10. MMogensen, M.; Thrane, L.; Jørgensen, T.M.; Andersen, P.E.; Jemec, G.B. OCT. OCT imaging of skin cancer and other dermato-logical diseases. J. Biophotonics 2009, 2, 442–451. [Google Scholar] [CrossRef] [PubMed]
  11. Qin, J.; Shi, L.; Wang, H.; Reif, R.; Wang, R.K. Functional evaluation of hemodynamic response during neural activation using optical microangiography integrated with dual-wavelength laser speckle imaging. J. Biomed. Opt. 2014, 19, 026013. [Google Scholar] [CrossRef] [PubMed]
  12. Liu, S.; Sotomi, Y.; Eggermont, J.; Nakazawa, G.; Torii, S.; Ijichi, T.; Onuma, Y.; Serruys, P.W.; Lelieveldt, B.P.F.; Dijkstra, J. Tissue characterization with depth-resolved attenuation coefficient and backscatter term in intravascular optical coherence tomography images. J. Biomed. Opt. 2017, 22, 096004. [Google Scholar] [CrossRef]
  13. Xu, C.; Schmitt, J.M.; Carlier, S.G.; Virmani, R. Characterization of atherosclerosis plaques by measuring both backscattering and attenuation coefficients in optical coherence tomography. J. Biomed. Opt. 2008, 13, 034003. [Google Scholar] [CrossRef] [PubMed]
  14. Van Der Schoot, J.; Vermeer, K.A.; de Boer, J.F.; Lemij, H.G. The effect of glaucoma on the optical attenuation coefficient of the retinal nerve fiber layer in spectral domain optical coherence tomography images. Investig. Ophthalmol. Vis. Sci. 2012, 53, 2424–2430. [Google Scholar] [CrossRef] [PubMed]
  15. Scolaro, L.; McLaughlin, R.A.; Klyen, B.R.; Wood, B.A.; Robbins, P.D.; Saunders, C.M.; Jacques, S.L.; Sampson, D.D. Parametric imaging of the local attenuation coefficient in human axillary lymph nodes assessed using optical coherence tomography. Biomed. Opt. Express 2012, 3, 366–379. [Google Scholar] [CrossRef] [PubMed]
  16. Cauberg, E.C.; de Bruin, D.M.; Faber, D.J.; de Reijke, T.M.; Visser, M.; de La Rosette, J.J.; van Leeuwen, T.G. Quantitative measurement of attenuation coefficients of bladder biopsies using optical coherence tomography for grading urothelial carcinoma of the bladder. J. Biomed. Opt. 2010, 15, 066013. [Google Scholar] [CrossRef]
  17. Zhao, Q.; Zhou, C.; Wei, H.; He, Y.; Chai, X.; Ren, Q. Ex vivo determination of glucose permeability and optical attenuation coefficient in normal and adenomatous human colon tissues using spectral domain optical coherence tomography. J. Biomed. Opt. 2012, 17, 105004. [Google Scholar] [CrossRef]
  18. Baran, U.; Zhu, W.; Choi, W.J.; Omori, M.; Zhang, W.; Alkayed, N.J.; Wang, R.K. Automated segmentation and enhancement of optical coherence tomography-acquired images of rodent brain. J. Neurosci. Methods 2016, 270, 132–137. [Google Scholar] [CrossRef]
  19. Baran, U.; Li, Y.; Wang, R.K. In vivo tissue injury mapping using optical coherence tomography based methods. Appl. Opt. 2015, 54, 6448–6453. [Google Scholar] [CrossRef]
  20. Vermeer, K.A.; Mo, J.; Weda, J.J.A.; Lemij, H.G.; de Boer, J.F. Depth-resolved model-based reconstruction of attenuation coefficients in optical coherence tomography. Biomed. Opt. Express 2014, 5, 322–337. [Google Scholar] [CrossRef]
  21. Smith, G.T.; Dwork, N.; O’Connor, D.; Sikora, U.; Lurie, K.L.; Pauly, J.M.; Ellerbee, A.K. Automated, Depth-Resolved Estimation of the Attenuation Coefficient From Optical Coherence Tomography Data. IEEE Trans. Med. Imaging 2015, 34, 2592–2602. [Google Scholar] [CrossRef] [PubMed]
  22. Liu, J.; Ding, N.; Yu, Y.; Yuan, X.; Luo, S.; Luan, J.; Zhao, Y.; Wang, Y.; Ma, Z. Optimized depth-resolved estimation to measure optical at-tenuation coefficients from optical coherence tomography and its application in cerebral damage determination. J. Biomed. Opt. 2019, 24, 035002. [Google Scholar] [CrossRef]
  23. Li, K.; Liang, W.; Yang, Z.; Liang, Y.; Wan, S. Robust, accurate depth-resolved attenuation characterization in optical co-herence tomography. Biomed. Opt. Express 2020, 11, 672–687. [Google Scholar] [CrossRef] [PubMed]
  24. Schmitt, J.M.; Knuttel, A.; Yadlowsky, M.; Eckhaus, M.A. Optical-coherence tomography of a dense tissue: Statistics of attenuation and backscattering. Phys. Med. Biol. 1994, 39, 1705. [Google Scholar] [CrossRef] [PubMed]
  25. Kalman, R.E. A New Approach to Linear Filtering and Prediction Problems. Trans. ASME J. Basic Eng. 1960, 82, 35–45. [Google Scholar] [CrossRef]
  26. Gurov, I.; Volynsky, M.; Zakharov, A. Evaluation of multilayer tissues in optical coherence tomography by the extended Kalman filtering method. In International Conference on Lasers, Applications, and Technologies 2007: Laser Technologies for Medicine; International Society for Optics and Photonics: Bellingham, WA, USA, 2007; Volume, 6734, pp. 217–224. [Google Scholar]
  27. Zavareh, A.T.; Hoyos, S. The spectral calibration of swept-source optical coherence tomography systems using unscented Kalman filter. In Proceedings of the 2018 IEEE Biomedical Circuits and Systems Conference (BioCAS), Cleveland, OH, USA, 17–19 October 2018; IEEE: Piscataway, NJ, USA, 2018; pp. 1–4. [Google Scholar]
  28. Karamata, B.; Hassler, K.; Laubscher, M.; Lasser, T. Speckle statistics in optical coherence tomography. J. Opt. Soc. Am. A 2005, 22, 593–596. [Google Scholar] [CrossRef]
  29. Kirkpatrick, S.J.; Duncan, N.D.; Wang, R.K.; Hinds, M.T. Quantitative temporal speckle contrast imaging for tissue mechanics. J. Opt. Soc. Am. A 2007, 24, 3728–3734. [Google Scholar] [CrossRef]
  30. Yun, S.H.; Tearney, G.J.; EBouma, B.; Park, B.H.; De Boer, J. High-speed spectral-domain optical coherence tomography at 13 μm wavelength. Opt. Express 2003, 11, 3598–3604. [Google Scholar] [CrossRef]
  31. Zarchan, P.; Musoff, H. (Eds.) Fundamentals of Kalman Filtering: A Practical Approach; American Institute of Aeronautics and Astronautics, Inc.: Reston, VA, USA, 2013. [Google Scholar]
  32. Liu, J.; Ding, N.; Yu, Y.; Liu, L.; Yuan, X.; Lv, H.; Zhao, Y.; Ma, Z. Whole-brain microcirculation detection after ischemic stroke based on swept-source optical coherence tomography. J. Biophotonics 2019, 12, e201900122. [Google Scholar] [CrossRef]
  33. Van Leeuwen, T.; Faber, D.; Aalders, M. Measurement of the axial point spread function in scattering media using single-mode fiber-based optical coherence tomography. IEEE J. Sel. Top. Quantum Electron. 2003, 9, 227–233. [Google Scholar] [CrossRef]
  34. Chang, S.; Bowden, A.K. Review of methods and applications of attenuation coefficient measurements with optical coherence tomography. J. Biomed. Opt. 2019, 24, 090901. [Google Scholar] [CrossRef] [PubMed]
  35. Song, S.; Xu, J.; Wang, R.K. Long-range and wide field of view optical coherence tomography for in vivo 3D imaging of large volume object based on akinetic programmable swept source. Biomed. Opt. Express 2016, 7, 4734–4748. [Google Scholar] [CrossRef] [PubMed]
Figure 1. Two numerical simulations that feature exponential decay, with OACs set to 0.5 and 1, and in which the initial light intensity is 1; the attenuation models are y = y 0 · e 2 μ · z (a) and y = y 0 · e 2 μ · z + b (c), respectively, b = 0.05. (b,d) are the corresponding OACs obtained by using Equation (2).
Photonics 10 00460 g001
Figure 2. (a) Simulated signal that contains multiplicative noise (Gaussian distribution with zero mean and a variance of [C × y]2, C = 0.447) and additive noise (Gaussian distribution with a mean of 0.025 and a variance of 1). (b) The corresponding OAC obtained by using Equation (2), the yellow dotted line is the OAC of the ideal OCT signal; the OAC of noisy OCT signals is seriously underestimated. (c) The mean of noise floor b (the yellow dotted line) is subtracted from the simulated signal. (d) The corresponding OAC of (c), the fluctuations range in the OAC increases rapidly with the depth.
Photonics 10 00460 g002
Figure 3. The entire algorithm process of the Kalman filter applied to the OCT signals.
Photonics 10 00460 g003
Figure 4. (a) The Kalman filter result of the numerical simulation in Figure 2c; the blue curve represents the signal after subtracting the mean of the noise floor and the red curve represents the filtered signal. (b) The corresponding OAC calculated from the filtered data.
Photonics 10 00460 g004
Figure 5. Comparison between using Kalman filter and using low-pass filter in phantom experiments. (ac) The original OCT images, the Kalman-filtered OCT images and the low-pass-filtered OCT images, respectively. The upper subimages are locally magnified images from (ac), respectively. Three regions extracted from the deep positions of (ac) are shown in (d). (e) The mean and standard deviation of the SNR of the three regions.
Photonics 10 00460 g005
Figure 6. Phantom experiment results. (a) Logarithmic OCT B-scan image of the phantom. (b) Exponential fitting result of a typical A-scan (shown by the orange solid line in (a)). (c) Original OAC image calculated from (a). (d) Original OAC curve at the position of the yellow line. (e) High-error OAC image. The fluctuations range of the tail OAC has increased significantly (Red oval). (f) High-error OAC curve. (g) OAC image calculated using Li et al.’s algorithm. Bright (dark) streak artifacts appear in deep regions of the image (shown in the green box). (h) The OAC curve obtained using Li et al.’s algorithm, with an average value of 0.72. There is a slight underestimation of the OAC in the middle region (green arrow). (i) The optimized OAC image. (j) The optimized OAC curve.
Photonics 10 00460 g006
Figure 7. Comparison of OAC obtained using different methods. (a) Original OAC image, (b) High-error OAC image, (c) the OAC image calculated using Li et al.’s algorithm. (d) Optimized OAC image. Three rectangular areas are taken out from the shallow, middle and deep positions, respectively. (eh) The mean and standard deviation of the OAC in the rectangular regions of the four OAC images.
Photonics 10 00460 g007
Figure 8. Comparison between using the Kalman filter and using the low-pass filter in in vivo experiments. (ac) The original OCT images, the Kalman-filtered OCT images and the low-pass-filtered OCT images, respectively. The upper subimages are locally magnified images from (ac), respectively. Three regions extracted from the deep positions of (ac) are shown in (d). (e) The mean and standard deviation of the SNR of the three regions.
Photonics 10 00460 g008
Figure 9. OAC calculation results using a different method. (a) A typical fundus OCT B-scan image. (bd) The original OAC image, high-error OAC image, and Li et al. OAC image, respectively. (e) The optimized OAC image obtained using the algorithm in this paper. The unit of the colorbar is mm−1. (f) The comparison of the four OAC curves at the position of the solid orange line in (a).
Photonics 10 00460 g009
Figure 10. OAC calculation results of human fundus tissues. The unit of the colorbar is mm−1.
Photonics 10 00460 g010
Table 1. Kalman filter iterative equation.
Prediction:Predict the state estimate x ^ z = A · x ^ z 1 (5)
Predict the error covariance P z = A P z 1 A T + Q (6)
Update:Calculate the Kalman gain K g z = P z · ( P z + R ) 1 (7)
Update the state estimate x ^ z = x ^ z + K g z · ( y z x ^ z ) (8)
Update the error covariance P z = ( I K g z ) · P z (9)
Disclaimer/Publisher’s Note: The statements, opinions and data contained in all publications are solely those of the individual author(s) and contributor(s) and not of MDPI and/or the editor(s). MDPI and/or the editor(s) disclaim responsibility for any injury to people or property resulting from any ideas, methods, instructions or products referred to in the content.