Article

Dispersion-Oriented Inverse Design of Photonic-Crystal Fiber for Four-Wave Mixing Application

1
School of Physics and Optoelectronic Engineering, Hangzhou Institute for Advanced Study, University of Chinese Academy of Sciences, Hangzhou 310024, China
2
Key Laboratory of Materials for High Power Laser, Shanghai Institute of Optics and Fine Mechanics, Chinese Academy of Sciences, Shanghai 201800, China
*
Author to whom correspondence should be addressed.
Photonics 2023, 10(3), 294; https://doi.org/10.3390/photonics10030294
Submission received: 15 January 2023 / Revised: 7 March 2023 / Accepted: 8 March 2023 / Published: 10 March 2023

Abstract

:
In this paper, we demonstrate the application of a deep learning neural network (DNN) in the dispersion-oriented inverse design of photonic-crystal fiber (PCF) for the fine-tuning of four-wave mixing (FWM). The empirical formula of PCF dispersion is applied instead of numerical simulation to generate a large dataset of phase-matching curves of various PCF designs, which significantly improves the accuracy of the DNN prediction. The accuracies of DNNs’ predicted PCF structure parameters are all above 95%. The simulations of the DNN-predicted PCFs structure demonstrate that the FWM wavelength has an average numerical mean square error (MAE) of 1.92 nm from the design target. With the help of DNN, we designed and fabricated a specific PCF for wavelength conversion via FWM from 1064 nm to 770 nm for biomedical imaging applications. Pumped by a microchip laser at 1064 nm, the signal wavelength is measured at 770.2 nm.

1. Introduction

Photonic crystal fiber (PCF) provides tight confinement of light and dispersion design flexibility [1]. By designing the air hole diameter (d) and hole pitch (Λ), as shown in Figure 1, we can precisely control the mode properties [2]. PCFs with ultra-flattened dispersion [3] and tunable zero-group-dispersion wavelength in the visible region [4] have been studied. Therefore, PCF is a desirable medium for sensors, e.g., designing two elliptical channels on either side of the PCF’s core, each with a distinct coating film, to achieve a response to the magnetic field and temperature using SPR [5,6]. Moreover, PCF is a favorable medium for efficiently acquiring various nonlinear optical effects, such as four-wave-mixing (FWM) [7].
FWM in PCF enables a wide range of nonlinear wavelength conversion by delicately designing the dispersion of PCF [8]. Y. Chen reported an ultraviolet (U.V.) signal as short as 342 nm generated by pumping a well-designed photonic crystal fiber with a 532 nm microchip laser [9]. Using a dispersion-engineered tapered photonic crystal fiber, Sidi-Ely et al. numerically demonstrated a parametric gain of around 2 μm in the mid-infrared region [10]. R. Jiang et al. presented a WDM system employing a single-pump parametric process in a PCF with two ZDWs. The 1550 nm band is translated to the visible 500 nm spectral window [11]. Developing efficient methods of PCF dispersion design is essential for generating an arbitrary wavelength light source in FWM, which has more applications in wavelength division multiplexing in future high-capacity all-optical networks [12], constructing excitation light sources used in micro spectroscopy and gas lasers [13].
Currently, the design of PCF for FWM mostly relies on manual trying-and-testing iteration, which is heavily time-exhausting and experience-dependent [14]. The finite element method (FEM) is typically used to calculate the modal properties of photonic crystal fiber with high accuracy. However, the calculation process takes several tens of minutes depending on the grid accuracy and complexity of the structure. Moreover, the test and trial approach for PCF design becomes impractical for fine-tuning wavelength conversion.
Computer-aided fiber design (CAFD) has been widely applied to dispersion-oriented inverse PCF design and optimization instead of manual trying and testing. Reported computer-aided fiber design methods are based on optimization algorithms of deep learning neural networks (DNN) [15] and traditional optimizers, e.g., genetic algorithms (G.A.) [16], particle swarm optimization (PSO) [17], and simulated annealing (S.A.) [18]. The traditional optimizer uses forward design algorithms and often takes several days to design. DNN, which is bi-directionally applicable in the inverse fiber design, would take only a few seconds to obtain results.
F. Poletti et al. employed G.A. for the dispersion optimization of PCF, and a dispersion of 0 ± 0.1 ps/nm/km in the wavelength range between 1.5 and 1.6 μm was achieved [19]. However, it took between 12 and 20 h to obtain convergence results. Wang et al. proposed substituting the FEM simulation with an empirical dispersion formula [2] in the design of dispersion-oriented fiber. They employed a differential evolution (D.E.) genetic algorithm to complete the inverse EGI-PCF design process [20]. The computation time has been reduced to the second level. While the number of parameters increases, the optimization time increases dramatically.
To overcome these obstacles, we propose applying a deep learning neural network (DNN) in the computer-aided inverse design of PCF for FWM. DNN uses multiple layers of nonlinear processing units for highly accurate feature extraction and transformation [21]. Thus, it has been demonstrated in broad applications in photonics, e.g., optical image reconstruction [22] and signal analysis in optical communication [23] due to its universality and high accuracy. DNN maps the FWM wavelength conversion to its corresponding PCF structure in our work. First, to accelerate the training dataset generation, we adopt the method from previous work [2]. We applied the finite element method (FEM) to simulate PCF dispersions with various transverse structures in a spectrum from 0.5 μm to 5 μm and provided a simulation-based empirical formula for PCF dispersion only dependent on the two structural parameters. Next, we calculated phase-matching curves with momentum and energy conservations and labeled them with various PCF structures as training data for DNN. The trained DNN would take a laptop only 0.2 s in average to obtain a predicted PCF structure. The predictive accuracies of Λ and d/Λ are all above 95%. The simulations of the DNN-predicted PCFs structure demonstrate that the FWM wavelength has an average numerical mean square error (MAE) of 1.92 nm from the design target. Using our method, we designed and fabricated a PCF for wavelength conversion via FWM from 1064 nm to 770 nm, which finds application in two-photon absorption spectroscopy in biomedical imaging. Pumped by a microchip laser at 1064 nm, the signal is measured at 770.2 nm, which is 0.2 nm offset from the target.

2. Principle of DNN-Based Inverse PCF Design for FWM

2.1. Principle of Phase-Matching in FWM

The nonlinear wavelength conversion of FMW is determined by the phase-matching curve, which satisfies the energy and momentum conservation [24]. Equations (1) and (2) represent the energy and momentum conservation formulas, respectively. The phase-matching curves comprise a series of calculated signal and idler wavelengths spanning the pump wavelength range.
2 ω p = ω s + ω i
2 π 2 n p u m p λ p u m p n s i g n a l λ s i g n a l n i d l e r λ i d l e r + 2 γ P = 0
A e f f = E 2 d x d y 2 E 4 d x d y
where λ j is the wavelength, ω j is the angular frequency, and n j is the effective refractive index ( j = p , s and i , representing pump, signal, and idler, respectively). 2 γ P is the nonlinear phase mismatch term, where P is the pump power and γ   =   2 π n 2 / λ j A e f f is the nonlinear coefficient. n 2 is the nonlinear refractive index [25]. A e f f is the effective area of the fundamental mode, which is defined by Equation (3) [24].

2.2. Empirical Formula of PCF Dispersion

Usually, PCF is numerically simulated to obtain the dependence of the effective index on wavelength, defined as the dispersion curve. Then, the signal and idler wavelengths are calculated according to Equations (1) and (2). However, it often takes a laptop tens of minutes to obtain the effective index at a single wavelength using FEM software, e.g., COMSOL. To obtain a large enough dispersion dataset of various PCF designs to train DNN, we use the method of building an empirical formula represented by Equations (3)–(5) as reported in [2] instead. To obtain the fitting data for the empirical formula, COMSOL was used to numerically calculate the effective indices of the fundamental mode of PCF with 8 layers of uniformed air holes in a hexagonal lattice at wavelengths λ = 0.5 μm to 5 μm (by a step of 50 nm). The pitch range is set as Λ = 2 μm to 5 μm (by a step of 0.1 μm), and the ratio range is set as d/Λ = 0.25 to 0.45 (by a step of 0.05), matching the single-mode PCF designs reported in practical applications. Next, we apply the universal conjugate gradient algorithm [26]·to search for fitting parameters ( a i 1 to a i 7 , b i 1 to b i 7 , i = 1–4), which are summarized in Table 1. It is noteworthy that the n c o is calculated according to the Sellmeier Equation of silica glass [19] rather than a constant of 1.45. Thus, the variation of material refractive index with wavelength is included to improve the prediction accuracy of FWM by DNN. Compared with [2], the average error between empirical formulas and FEM simulations is reduced from 4.42 × 10 2 to 1.44 × 10 3 . The maximum and minimum errors of the effective index are 7.63 × 10 3 and 3.26 × 10 8 , respectively. The empirical formula calculates that 1 effective index costs 0.006 s on average. Compared to FEM approaches in COMSOL, the computation time is at least six orders of magnitude faster.
n e f f 2 = n c o 2 ( V 2 W 2 ) ( λ 2 π a e f f ) 2
V λ Λ , d Λ = A 1 + A 2 1 + A 3 exp ( A 4 λ / Λ ) W λ Λ , d Λ = B 1 + B 2 1 + B 3 exp ( B 4 λ / Λ )
A i = a i 1 + a i 2 ( d Λ ) a i 3 + a i 4 ( d Λ ) a i 5 + a i 6 ( d Λ ) a i 7 B i = b i 1 + b i 2 ( d Λ ) b i 3 + b i 4 ( d Λ ) b i 5 + b i 6 ( d Λ ) b i 7
where n e f f is the effective index of the fundamental guided mode; n c o is the refractive index of silica glass core calculated according to the Sellmeier equation; V and W are normalized frequency and transverse attenuation constants, respectively; λ is the operating wavelength; and a e f f is the effective core radius that is here assumed to be Λ / 3 [2]. A i and B i are coefficients representing the normalized frequency (V) and attenuation constants (W) with λ / Λ and d / Λ . Parameters of a i 1 to a i 7 , b i 1 to b i 7 , (i = 1–4) are used to represent the functional relation of A i and B i with d / Λ [2].

2.3. The Calculation of Effective Modal Area

The A e f f is the effective area of the fundamental mode, defined by Equation (3) [24]. The integrations of E 2 | and E 4 are simulated using COMSOL. The dependence of A e f f on wavelength and PCF structural parameters is much less sensitive than the effective index, which has little impact on the phase-matching calculation. As a result, a total of 2635 effective modal areas are calculated after the scanning steps are readjusted, where the steps of wavelength, pitch, and d/Λ are 50 nm, 0.1 μm, and 0.05, respectively. The wavelength range is set as 0.8 μm to 1.6 μm, which is the pump wavelength range discussed in this article.

2.4. Inverse Design Based on Deep Learning Neural Network

2.4.1. Data Preparation for the DNN Model

As shown in Figure 2, 5 groups of labeled data, corresponding to 5 pump power configurations (i.e., 0.1 kW, 1 kW, 10 kW, 100 kW, and 1000 kW), are prepared for the DNN models. Accordingly, five separate DNNs are trained to verify our proposed method’s universality. In detail, each data group of power configurations contains 12,621 phase-matching curves linked with PCF structural parameters of Λ and d/Λ ratio (defined as d/Λ). The parameter Λ varies from 2 to 5 μm (a step of 5 nm), and the ratio changes from 0.25 to 0.45 (a step of 0.01)—the effective index in Equation (2) is represented by the empirical formula in Equations (3)–(5). Using the empirical dispersion formula in Equation (2), phase-matched curves are computed via scanning pump wavelengths from 0.8 to 1.6 μm by an interval of 1 nm. The labeled 12,621 data points are divided into the training, validation, and testing sets of 10,000, 2000, and 621, respectively.
All values of A e f f in the 5 training datasets are generated from the 2635 simulated results in Section 2.3. More details are referred to in the data processing methods in [27].

2.4.2. Implementation of the DNN Algorithm

The diagram of our DNN architecture is plotted in Figure 3. The neural network is connected by the input of featuring wavelength sequences and the output of the PCF parameters (d and Λ).
The diagram of our inverse design architecture is plotted in Figure 3. The inverse design is connected by the input of feature wavelengths ( λ p u m p and λ c o n v e r t e d ) and the output of the PCF parameters (d and Λ ). On the left side of Figure 3, we modify the input data to characterize the represented PCF precisely. The data modification starts by locating the closest phase-matching curve at the targeted λ p u m p and λ c o n v e r t e d position. Then, a new curve could be generated by shifting this original nearest curve across the targeted λ p u m p and λ c o n v e r t e d position. Lastly, the vertical axis values of the new line are abstracted and fed into the DNN.
In the middle of Figure 3, DNN first adopts batch normalization to reduce the influence of network initialization and further speed up the training process. The following Relu-activated functions are used for the purpose of de-linearization. The next are four sub-layer-groups sharing the same structures. Each sub-group comprises a fully connected layer, a Relu-activated functions layer, and a batch-normalization layer. The neuron sizes to connect the four sub-layer-groups are 20, 13, 13, and 13, respectively. Before the last output, a fully connected layer is placed to decrease the nodes from 13 to 2. The 5 DNNs were trained with the same structure shown in the middle part of Figure 3.
The model training can be generally described to find the best-fit network parameters (i.e., weight ( ζ ) and bias (b)) utilizing decreasing loss function. The loss function of our DNN is expressed in Equation (7) [21] and represents the error between actual and predicted values. Gradient descent and back-propagation (B.P.) algorithms [28] are employed to minimize the value discrepancy. In every epoch, chain derivation operations can update the network parameters of ζ and b (see Equation (7)). After appropriate iterations, the loss function gradually converges, indicating that the DNN eventually gains high-dimensional relationships from the input to the output. The average training time for our DNN model is 2′24″. The corresponding formulas for DNN models are presented as follows.
L ζ , b = 1 2 m i = 1 m L ( Λ ( i ) ^ , Λ ( i ) ) + L ( r ( i ) ^ , r ( i ) ) + κ 2 m ξ 2 2
ξ = ξ α L ( ζ ) ζ b = b α L ( b ) b
where ξ and b correspond to weights and bias, respectively. L is the multi-processing layer, and m is the number of the layers. Λ ( i ) , r ( i ) are the actual output of Λ and d / Λ , while Λ ( i ) ^ , ζ ( i ) ^ are the predicted values. The ratio of r is referred to as d / Λ and κ is the regularization parameter.

3. Results

3.1. Evaluation of Trained DNN for FWM

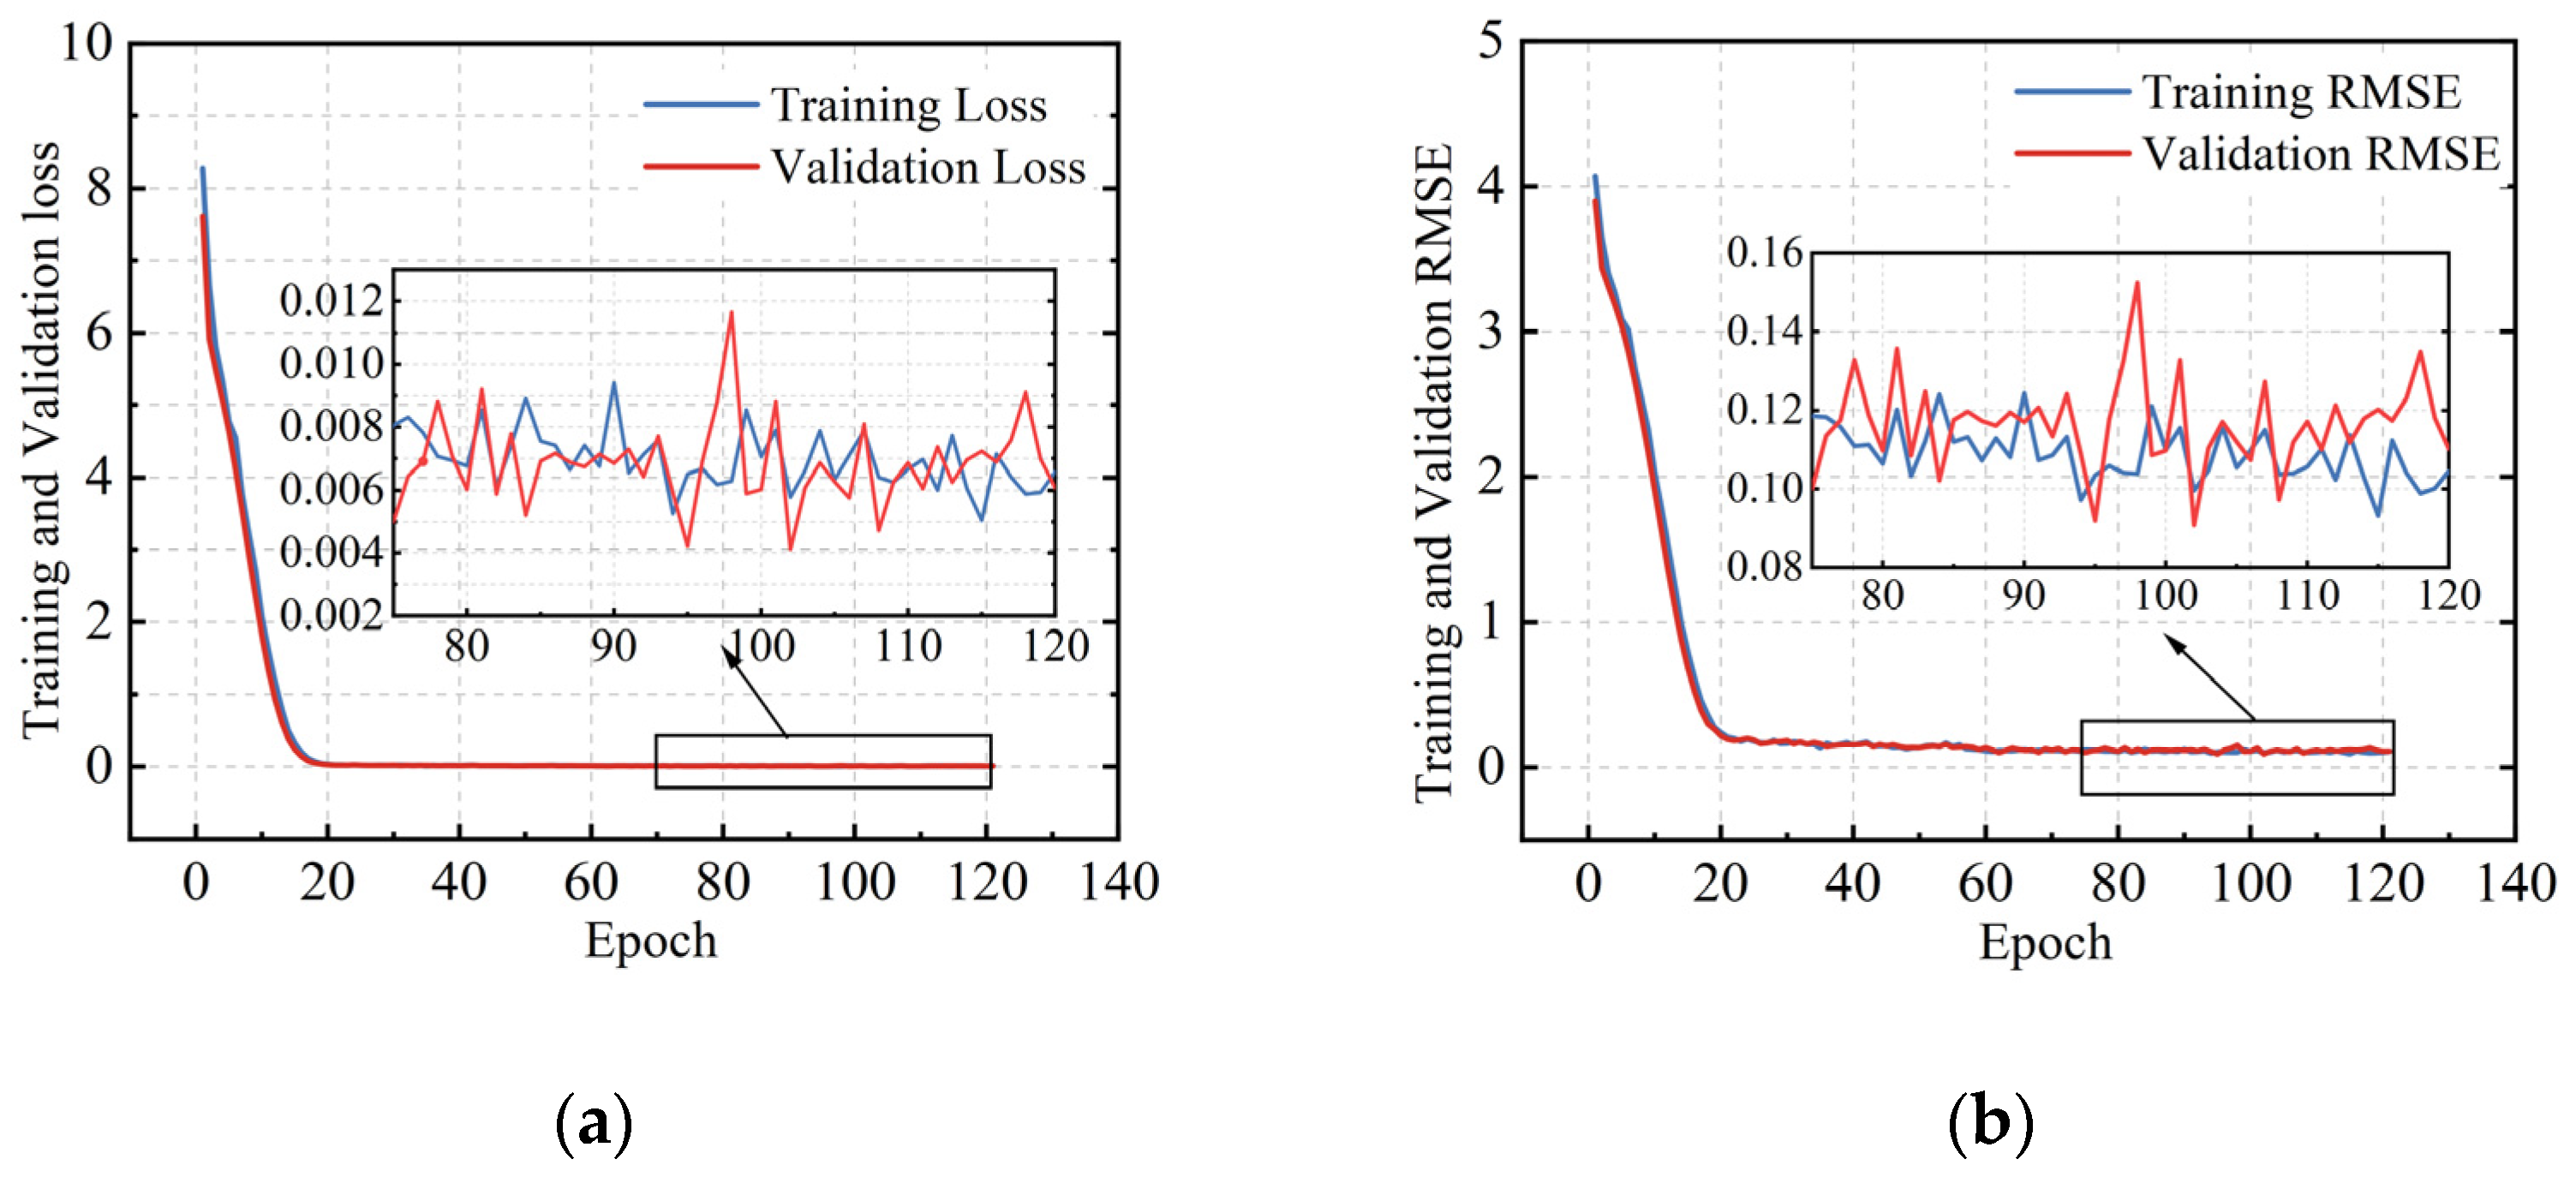
Overall, to evaluate the DNN performance, the following three aspects have been examined. Firstly, we estimate the DNN stability by analyzing the training progression. As previously discussed, 5 DNNs have been established in the same method using 5 varied pump power data (i.e., 0.1 kW, 1 kW, 10 kW, 100 kW, and 1000 kW). Here, we provide the training process using the dataset of 100 W. Figure 4 displays the detailed progression of this model’s training and validations, where the left and right graphs showcase loss and root mean square error (RMSE), respectively. After about 20 epochs, the solid lines of training loss reach close to 0, and they remain at this level for the leftover procedures (see the solid blue lines in the diagrams below). The later validation values (see the solid red lines in the two diagrams) approximate the previous training loss curves. All these line shapes solidly confirm that our network has converged, and that the model is stable. The other 4 DNN models trained with pump powers of 1 kW, 10 kW, 100 kW, and 1000 kW undergo the same examinations and exhibit similar loss and RMSE behaviors.
Next, we test our five trained DNNs using the unused test datasets (621). Table 2 compares the DNN-predicted PCF structure parameters (PDNN) and the ground truth values in the test dataset (PTEST). Random functions are applied to choose 6 data sets out of 621 sets in each of the 5 trained DNNs.
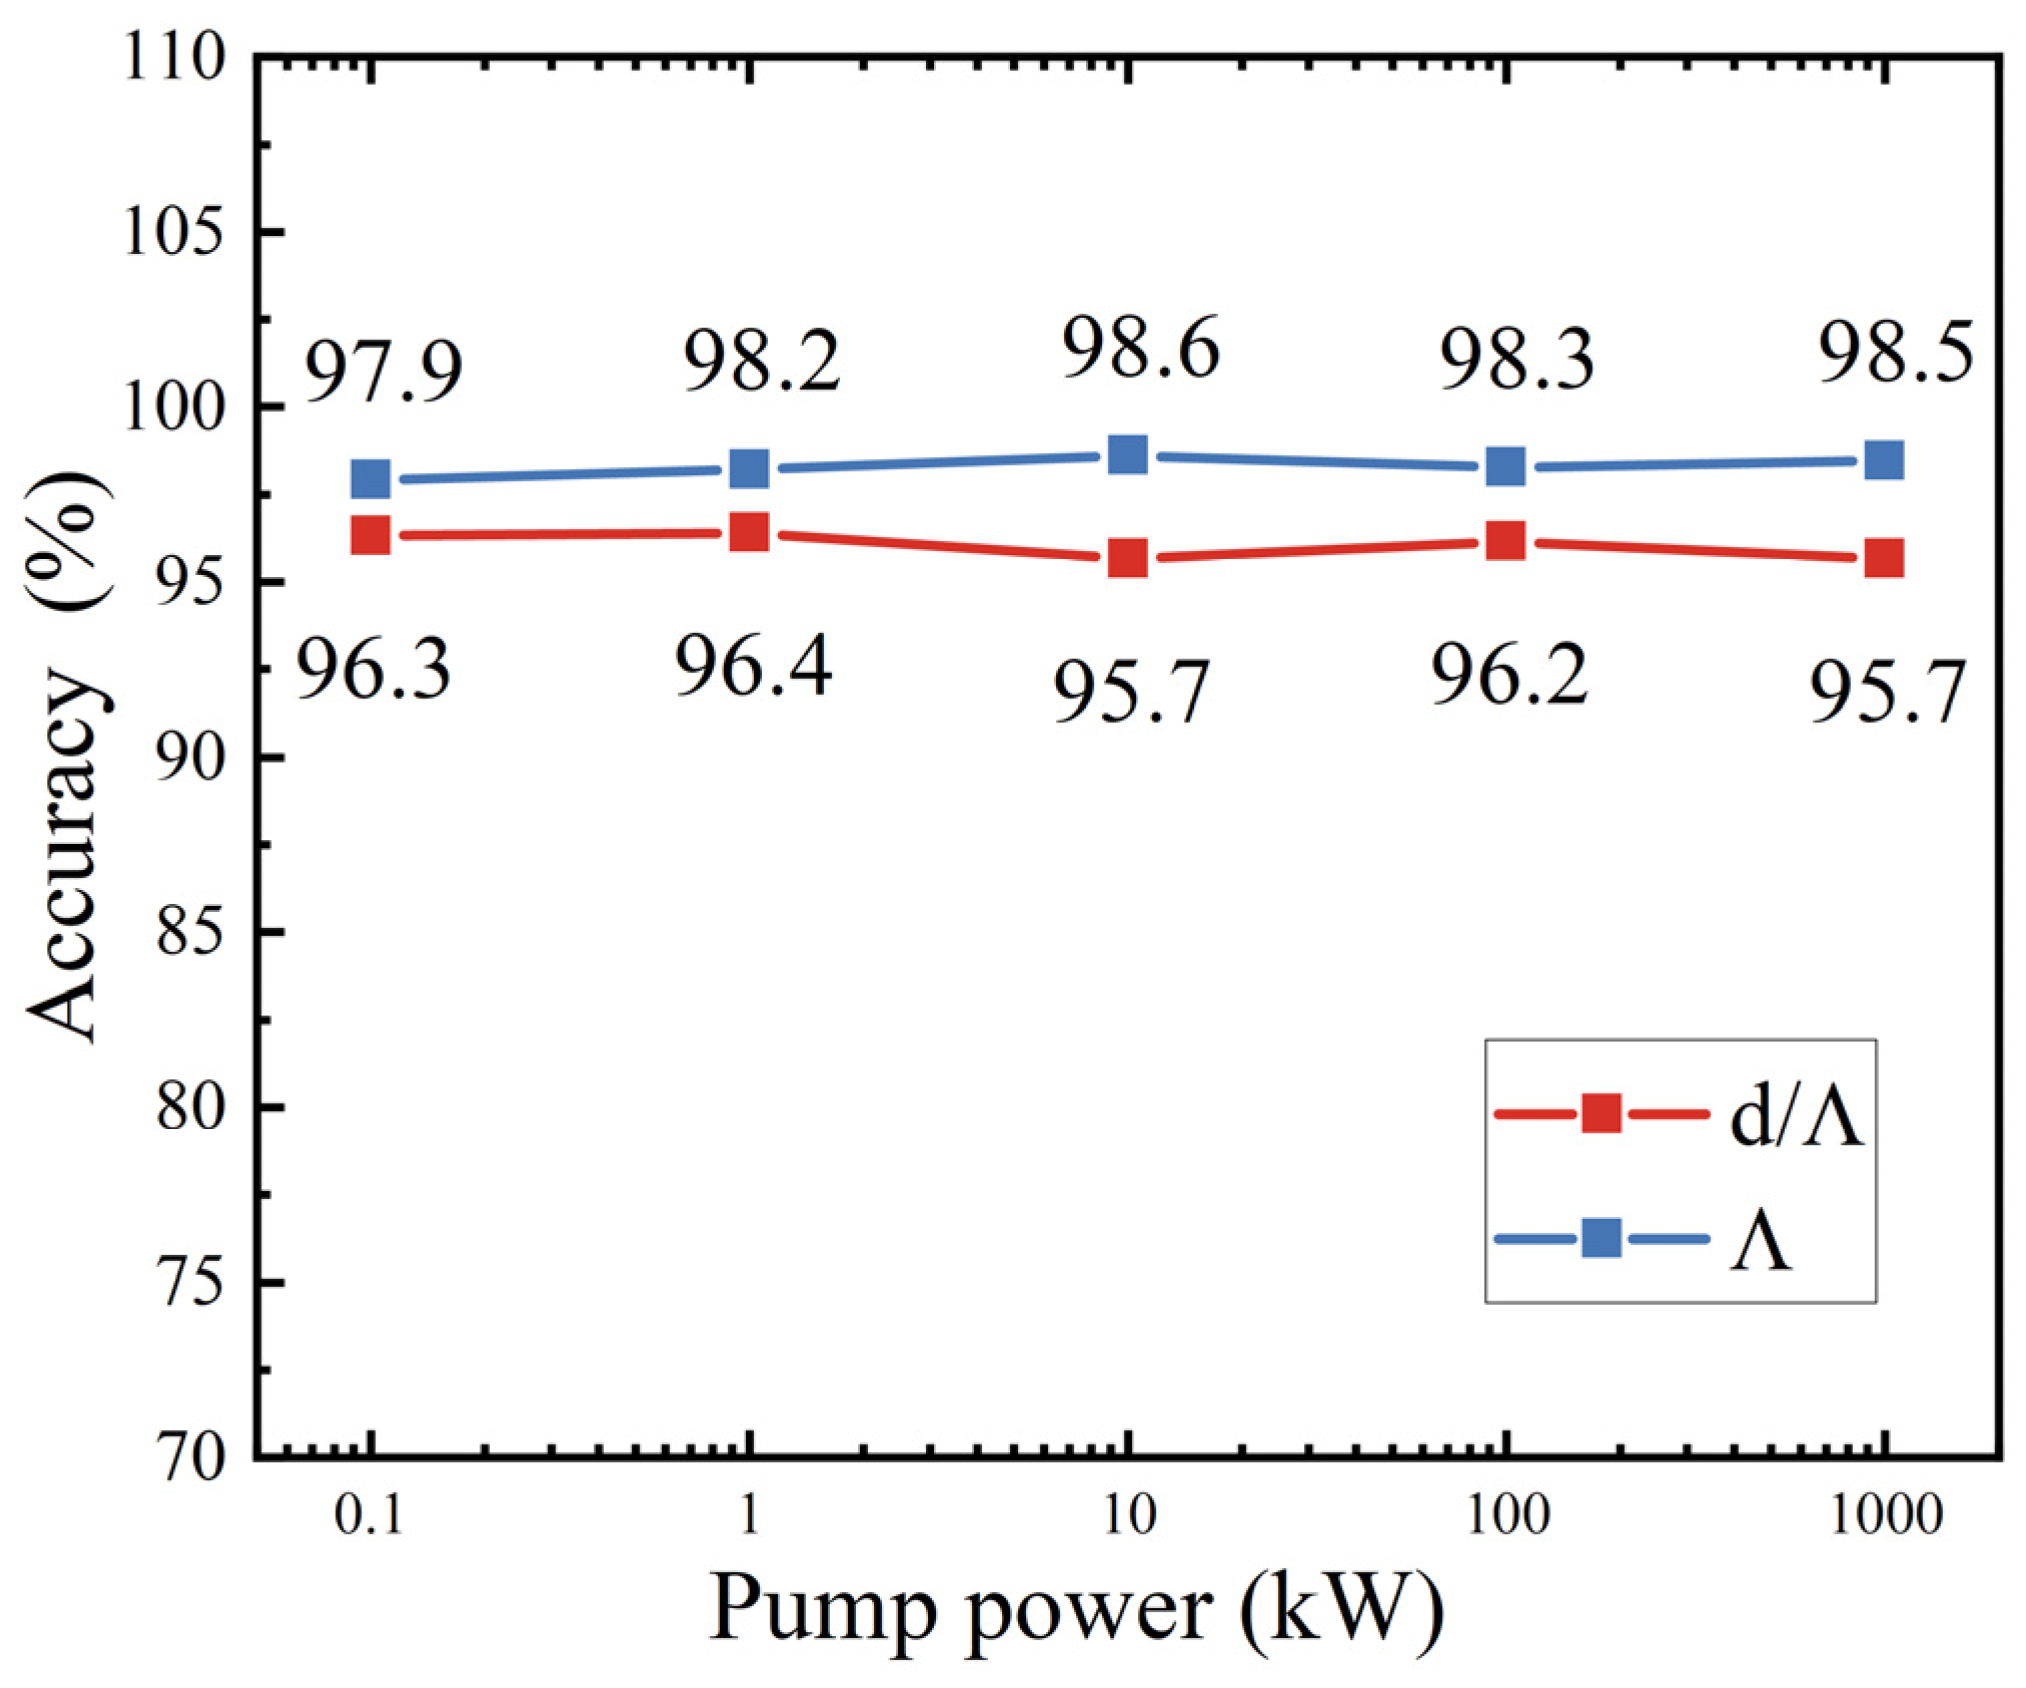
We calculate the accuracy rates by comparing DNN-predicted PCF structural values with the prepared test dataset (i.e., 5 groups of 621 data points). The performance accuracy is defined by Equation (9), where the Λ- and d/Λ-related counterparts are plotted in Figure 5.
a c c u r a c y = 1 P D N N P t e s t P t e s t × 100 %
where P D N N is the DNN-predicted value, and P test is the ground truth in the test dataset. In general, the 5 DNN accuracy rates of Λ (blue square dots) and d/Λ (red square dots) are all above 95%, showing that our method could precisely output the demanded PCF geometries in spite of varied pump power.
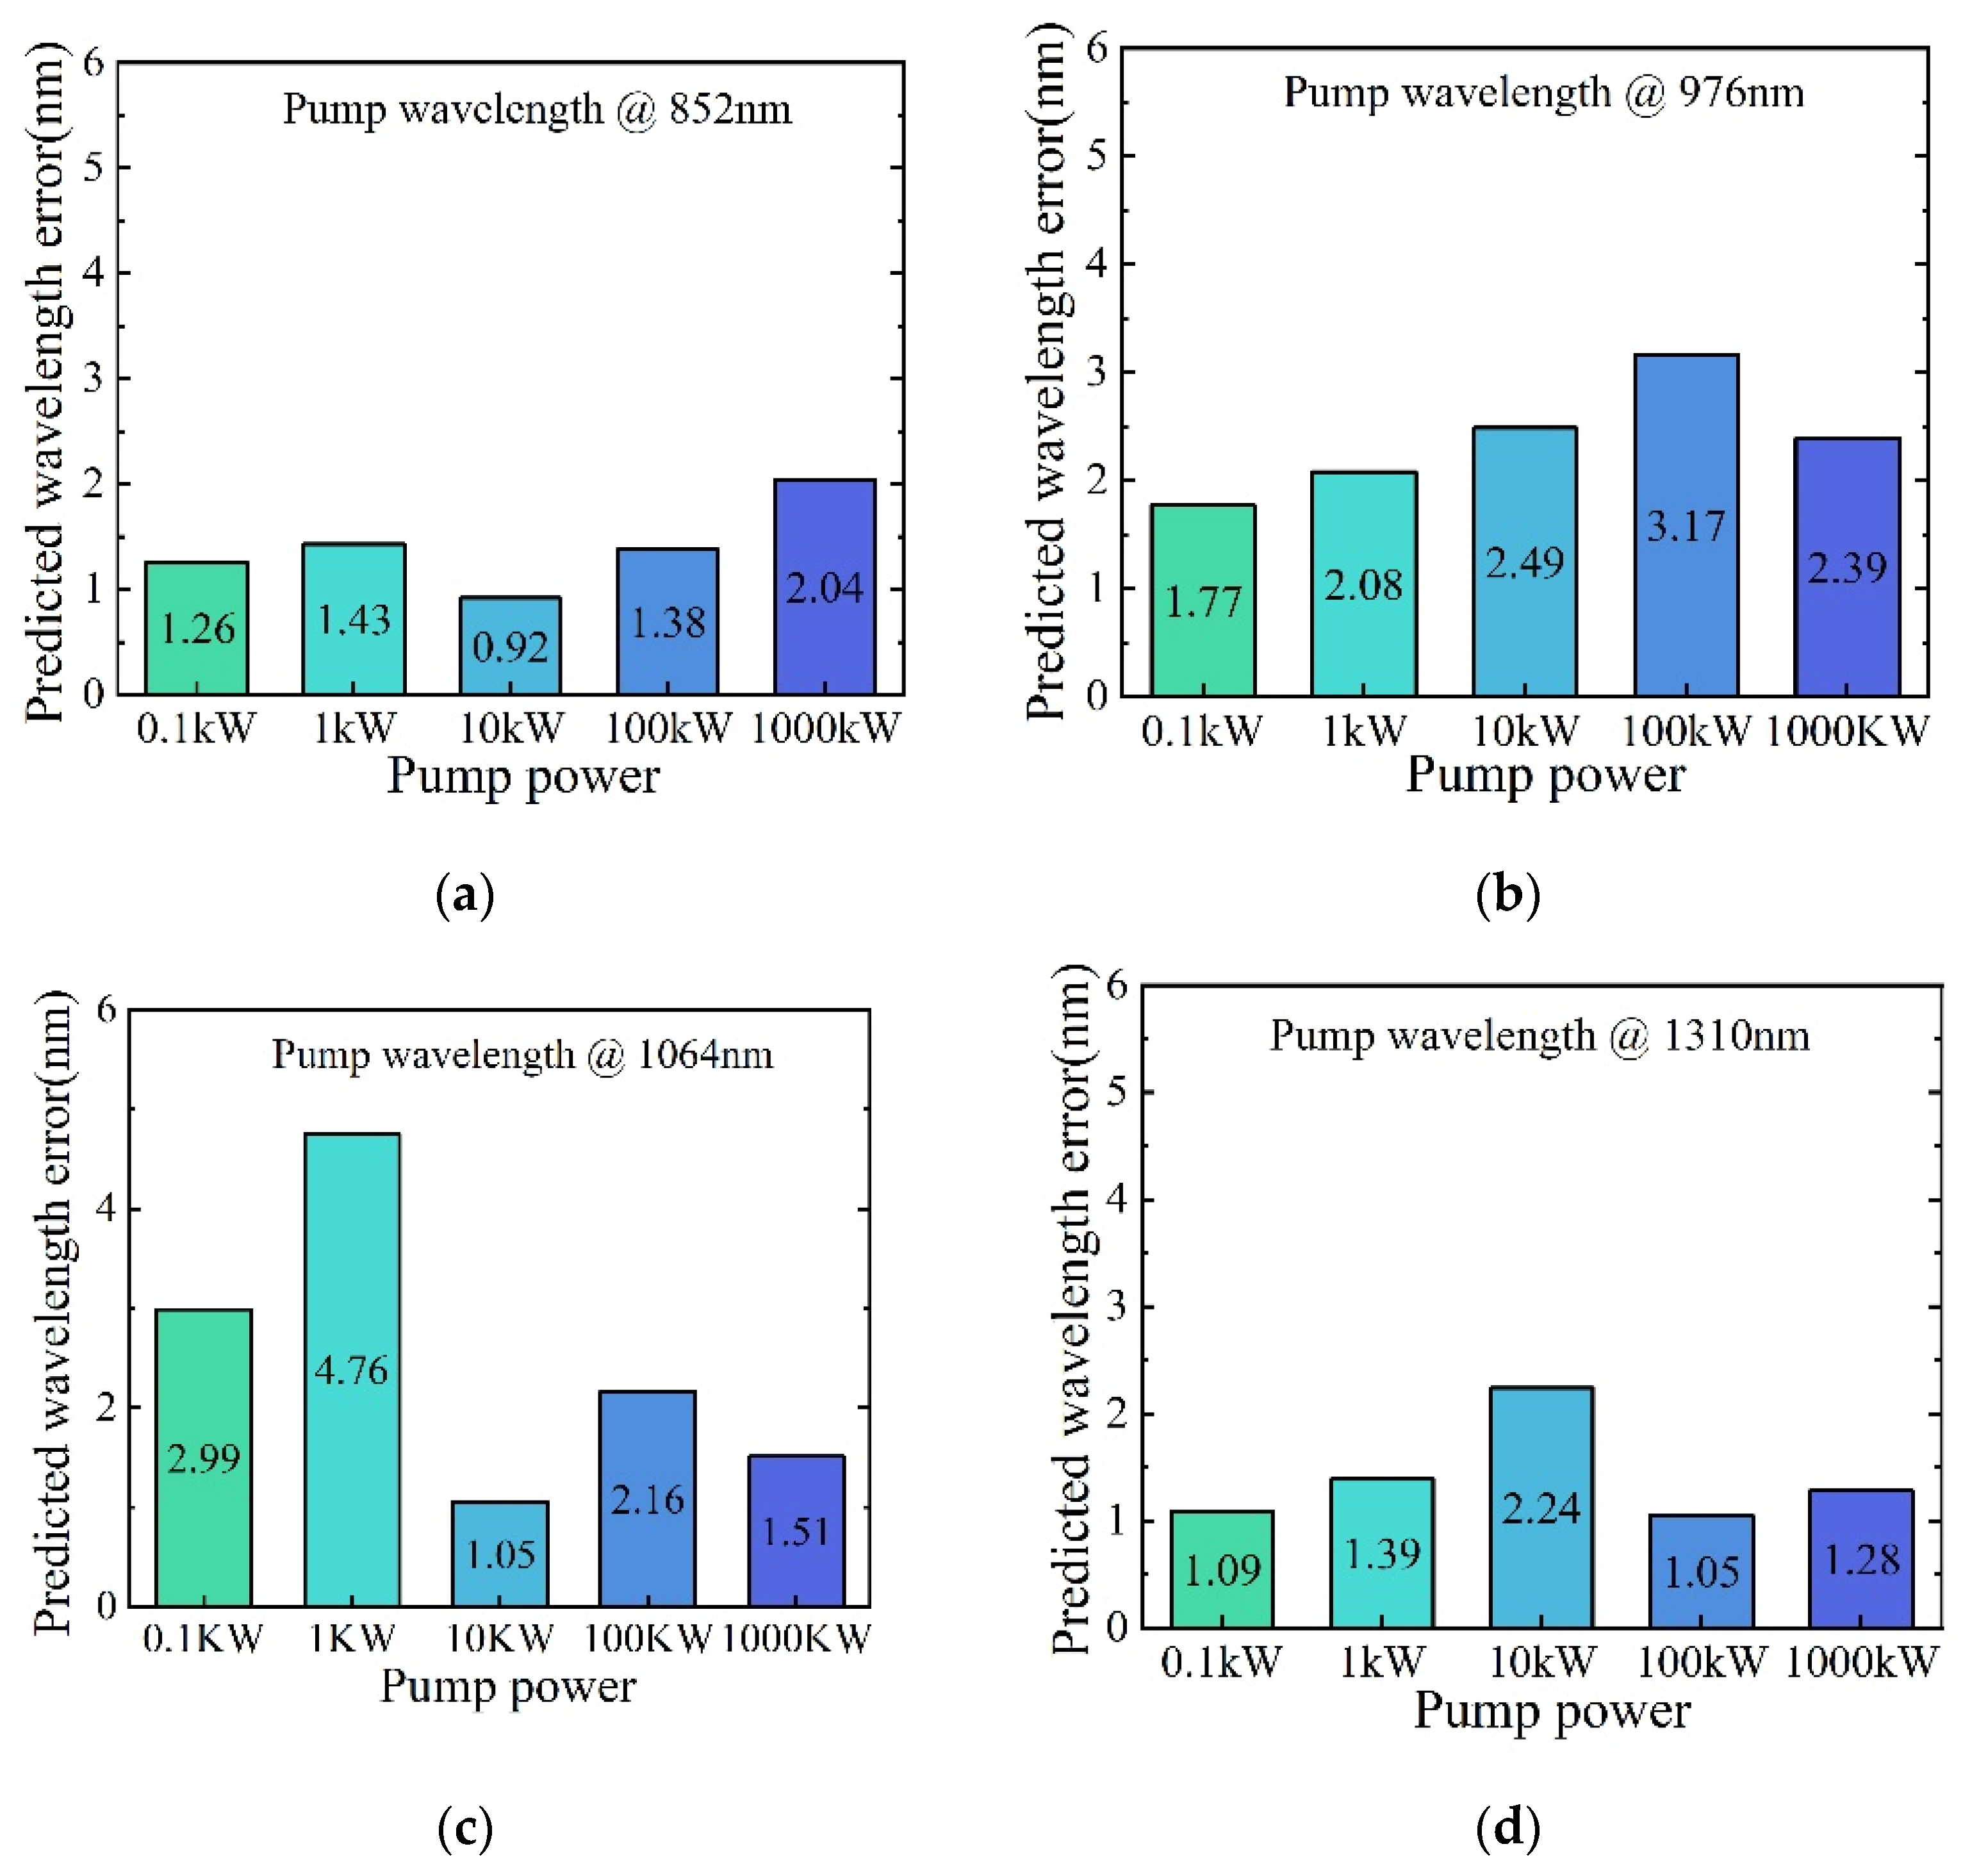
The wavelength error of FWM conversion using DNN-estimated fiber structures is defined as the absolute deviation between the DNN-predicted, FWM-converted, and target wavelengths. The results are shown in Figure 6a–d for different pump wavelengths at 852 nm, 976 nm, 1064 nm, and 1310 nm, respectively. In each diagram, the horizontal axis corresponds to the 5 trained DNNs (see tick labels of 0.1 kW, 1 kW, 10 kW, 100 kW, and 1000 kW). For 7 targeted wavelengths randomly chosen for each pump wavelength, the offsets from the converted wavelengths predicted by DNNs are averaged, which are 1.406 nm, 2.38 nm, 2.494 nm, and 1.41 nm, respectively, leading to a 5 DNN-averaged error of 1.92 nm. These data represent that our DNN models reach high accuracy levels since a slight systematic distortion could yield a different profile of phase-matching.
Above all, three sets of results demonstrate that DNNs are capable of “learning” the inverse mapping between wavelength characteristic sequence and PCF structure.

3.2. Experimental Demonstration

We apply our inverse design method to a PCF to generate coherent light at 770 nm by pumping it with a 1064 nm pump via FWM. At 770 nm, it is a fluorescent excitation wavelength commonly used in two-photon imaging systems [29].
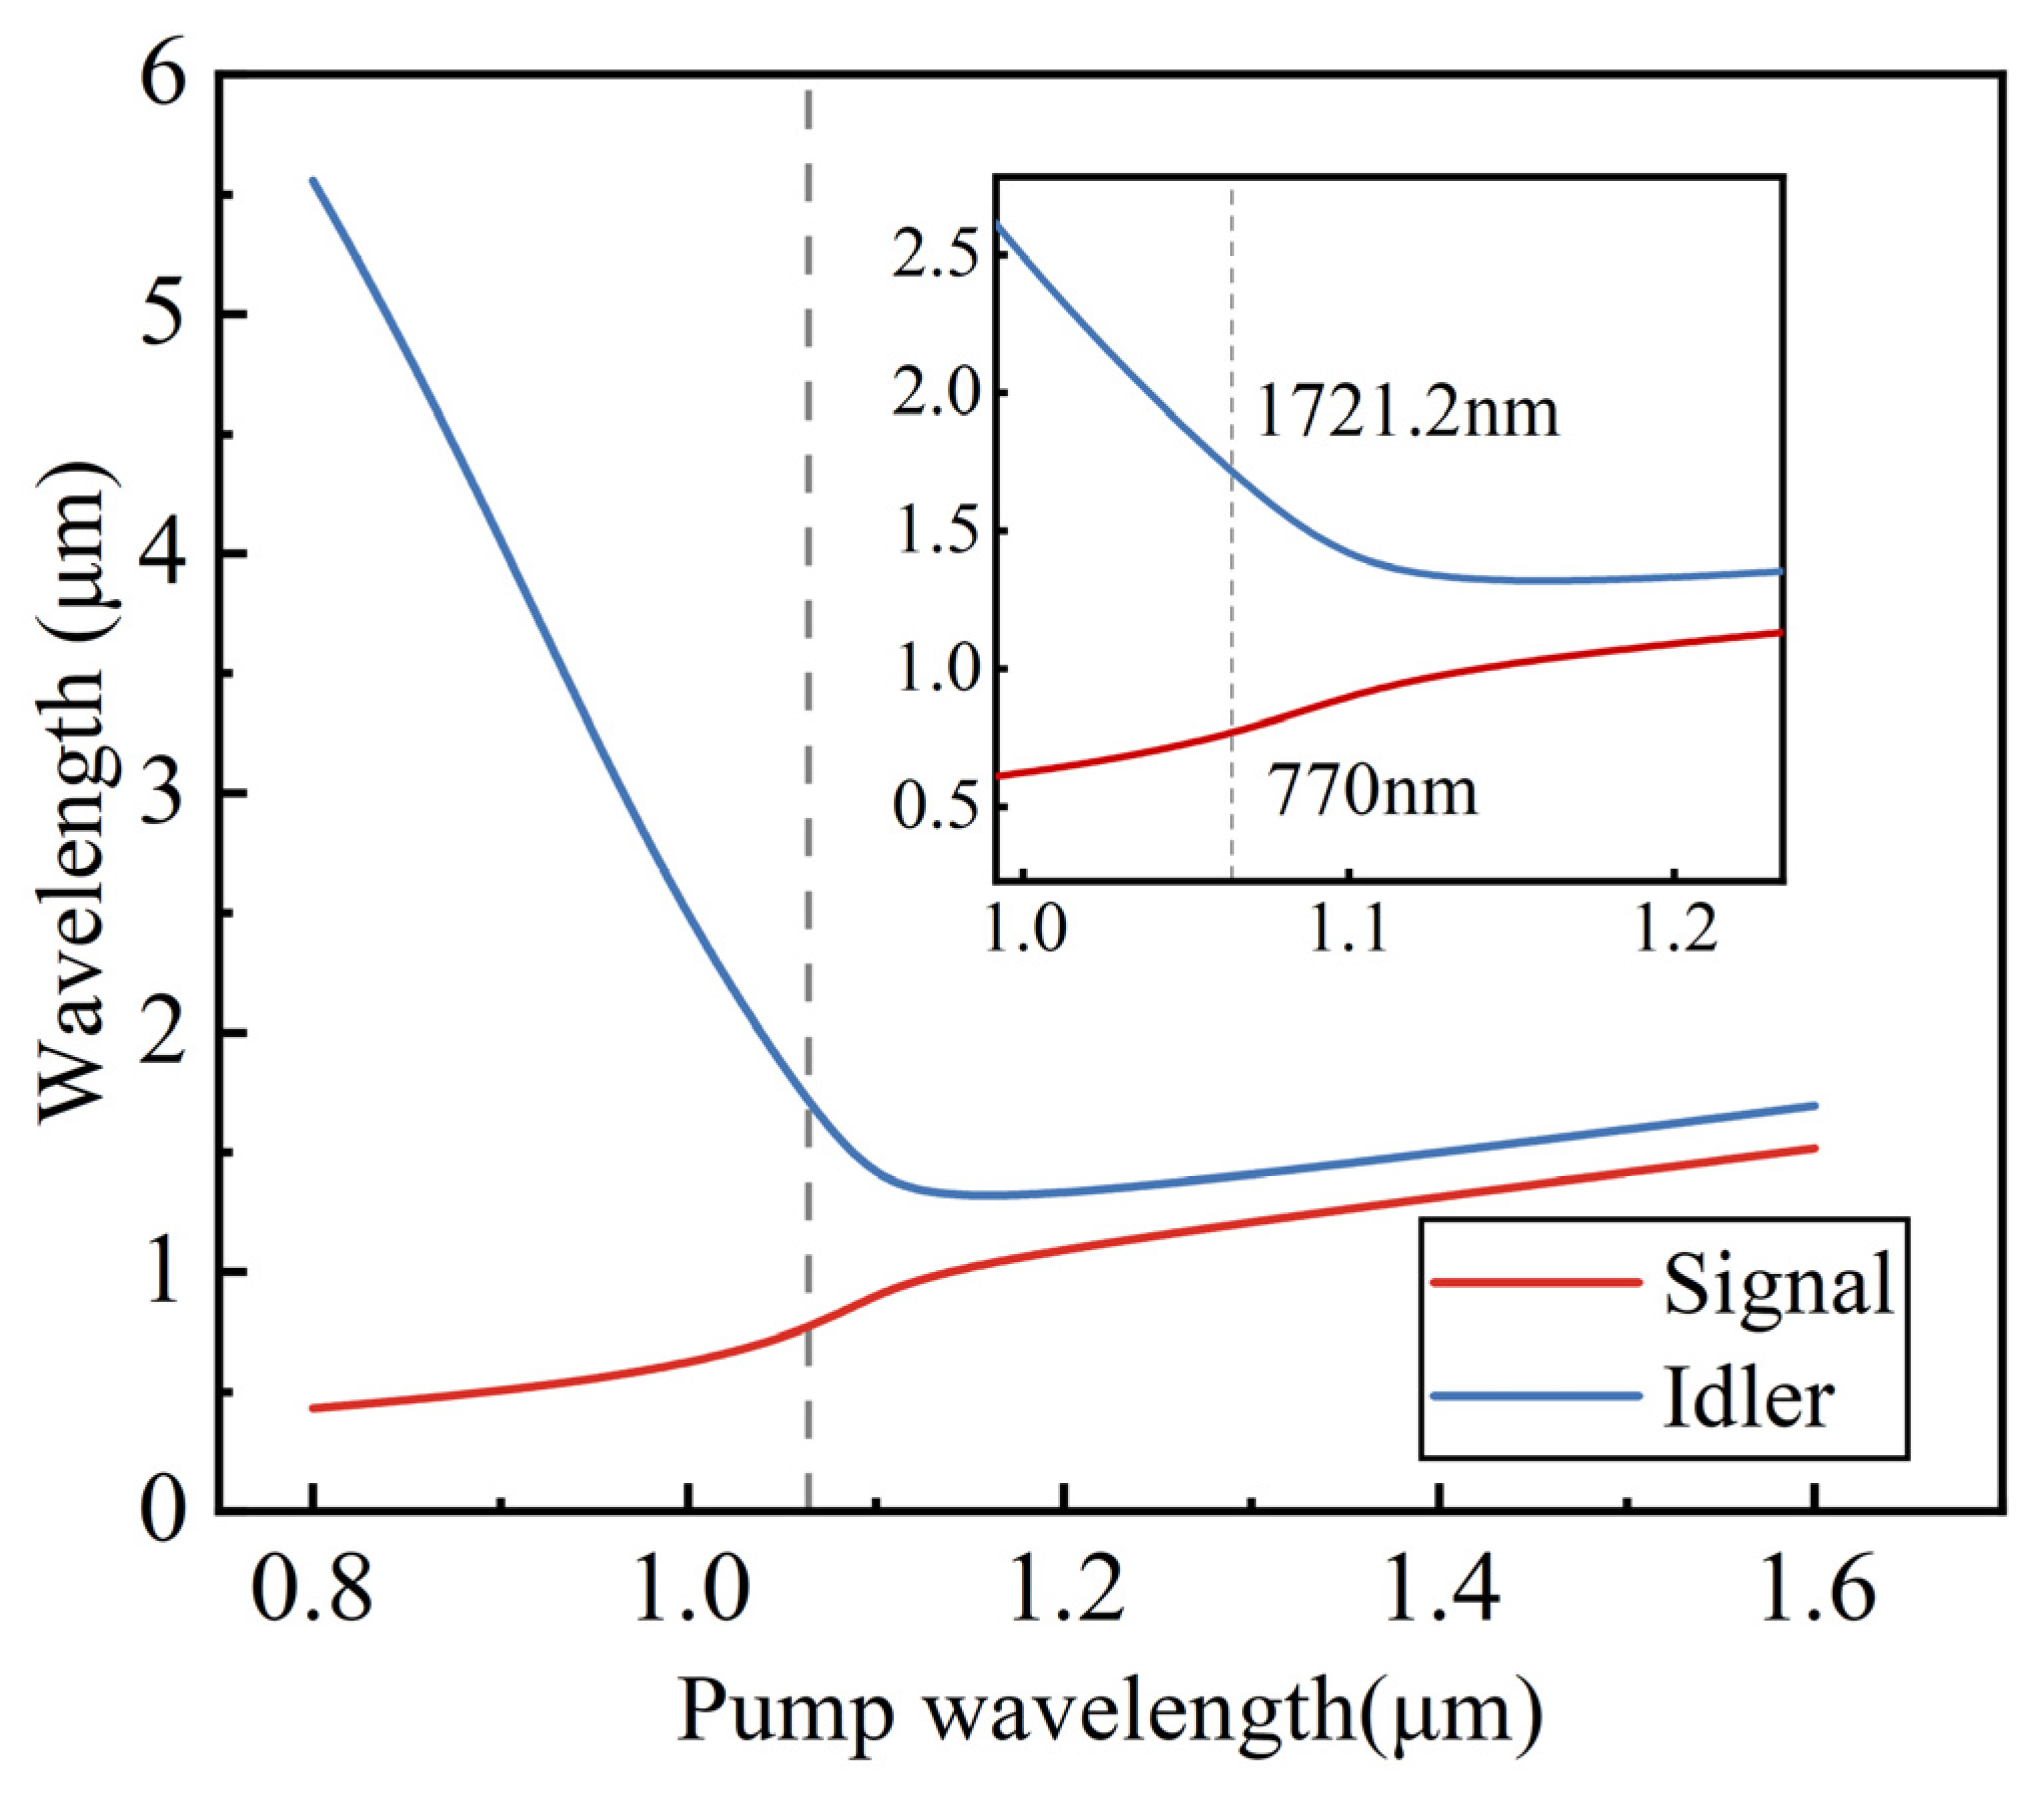
We assume the pump power was set to 6 kW and subsequently obtained the optimal fiber structure parameter Λ = 3.93 μm and ratio (d/Λ) = 0.37 predicted by a trained DNN. We performed numerical simulations using COMSOL to verify the predicted structure parameters. By calculating the corresponding phase-matching curve, the FWM in PCF generates signal and idler wavelengths at 770 nm and 1721.2 nm, respectively, under 1064 pumping, as shown in Figure 7, satisfying our design target accurately.
According to the structural parameters predicted by the neural network, we fabricated a PCF with five layers of homogeneous hexagonal air holes using the stack-and-draw method. As discussed in [19,30], the PCF dispersion is most affected by the three innermost rings of air holes, while the contribution from the sixth and beyond is almost negligible. Therefore, a PCF of five layers of cladding is fabricated. The structural parameters of the fabricated PCF were measured by an optical microscope, where Λ = 3.82 μm, ratio(d/Λ) = 0.41. The scanning electron micrograph (SEM) of manufactured fiber is shown in the insert of Figure 8a.
We set up the FWM experiment as shown in Figure 8a. The experiment was conducted at a room temperature of 25 degrees Celsius (°C). The pump source is a microchip laser (pulse power SNP-20F-100, 600 ps pulse duration at 1064 nm, 19 kHz repetition rate, 140 mW average power). The pump was coupled into the PCF of 2.38 m via a pair of mirrors and a lens (focal length: 7 mm). The FWM wavelengths were measured at the output end of the fiber. Output spectra were recorded with an optical spectrum analyzer (OSA) (Yokogawa, AQ6374). Figure 8b shows that the signal wavelength is 770.2 nm, and the idler wavelength is 1724.9 nm. Compared with the target signal 770 nm and idler 1721.2 nm, the errors of the signal and idler are 0.2 nm and 3.7 nm, respectively. Table 3 displays the most important PCF structure and wavelength data.
The temperature control of PCF is often used in the tuning of the FWM wavelength offset in experiments. Grzegorz et al. have demonstrated that the ZDW thermal shift for fused silica fibers is +0.020 nm/°C. The four-wave-mixing phase-matching condition changed when the ZDW of the fiber moved farther away from the pump pulse wavelength with rising temperature [31]. We set up the experiment as illustrated in Figure 8 and increased the PCF temperature from 30 °C to 100 °C (by a step of 10 °C). Table 4 summarizes the measured FMW wavelengths at different temperatures. The FWM tuning rate is about 0.1 nm per 10 °C on average.

4. Conclusions

In this work, we propose the application of DNN in the dispersion-oriented inverse fiber design to achieve high-accuracy nonlinear wavelength conversion in FWM. A newly fit empirical formula for PCF dispersion is utilized instead of FEM simulation to generate the phase-matching curve. The computation time for one effective index is at least six orders of magnitude shorter than that of FEM. Thus, the labeled phase-matching curves with PCF structure for training have been extended to the 10,000 level, improving DNN prediction accuracy. We demonstrate the practicality of inverse design using five trained DNNs. The accuracy of DNN-predicted PCF structural parameters is above 95%. The 5 DNN-averaged mean square error (MAE) of the simulated FWM wavelength utilizing the DNN-predicted PCF structure is 1.92 nm. A trained DNN takes only 0.2 s on average to output an optimal PCF structure. Following the DNN-predicted PCF structure, we designed and fabricated a specific PCF for wavelength conversion via FWM from 1064 nm to 770 nm for a biological imaging application. The signal error is 0.2 nm from the spectrum output and target. To compensate for the minor error in the signal and idler wavelengths, we experimentally tuned the operating temperature of PCF to fine-tune the signal and idler wavelength peaks. The successful demonstration of our method shows promising potential for application in PCF structure design with highly controllable nonlinear wavelength transformation.

Author Contributions

Methodology, L.G. and F.Y.; Software, L.G., Y.W. and N.W.; Validation, L.G. and F.Y.; Investigation, L.G., F.Y. and C.Y.; Resources, L.G. and Y.W.; Data curation, L.G. and X.Z.; Writing—original draft preparation, L.G.; Writing—review and editing, F.Y and N.W.; Supervision, L.H. and F.Y. All authors have read and agreed to the published version of the manuscript.

Funding

This work was supported by the National Key Research and Development Program of China (2020YFB1312802); the Natural Science Foundation of Hebei Province (F2021203002); the Chinese Academy of Sciences (Pioneer Hundred Talents Program, ZDBS-LY JSC020); the National Natural Science Foundation of China (61935002); the International Science and Technology Cooperation Program (2018YFE0115600); and the Natural Science Foundation of China under grant number (62005224).

Institutional Review Board Statement

Not applicable.

Informed Consent Statement

Not applicable.

Data Availability Statement

All the data in the diagram can be found in Gan, L. Dispersion-Oriented Inverse Design of Photonic-Crystal Fiber for Four-Wave Mixing Application. Science Data Bank 2023 (accessed on 30 January 2023), https://cstr.cn/31253.11.sciencedb.07147. CSTR:31253.11.sciencedb.07147.

Conflicts of Interest

The authors declare no conflict of interest.

References

  1. Wadsworth, W.J.; Joly, N.; Knight, J.C.; Birks, T.A.; Biancalana, F.; Russell, P.S.J. Supercontinuum and Four-Wave Mixing with Q-Switched Pulses in Endlessly Single-Mode Photonic Crystal Fibres. Opt. Express 2004, 12, 299. [Google Scholar] [CrossRef] [PubMed]
  2. Saitoh, K.; Koshiba, M. Empirical Relations for Simple Design of Photonic Crystal Fibers. Opt. Express 2005, 13, 267. [Google Scholar] [CrossRef] [PubMed]
  3. Abdelaziz, I.; AbdelMalek, F.; Haxha, S.; Ademgil, H.; Bouchriha, H. Photonic Crystal Fiber With an Ultrahigh Birefringence and Flattened Dispersion by Using Genetic Algorithms. J. Light. Technol. 2013, 31, 343–348. [Google Scholar] [CrossRef]
  4. Knight, J.C.; Arriaga, J.; Birks, T.A.; Ortigosa-Blanch, A.; Wadsworth, W.J.; Russell, P.S.J. Anomalous Dispersion in Photonic Crystal Fiber. IEEE Photonics Technol. Lett. 2000, 12, 807–809. [Google Scholar] [CrossRef]
  5. Wang, D.; Yi, Z.; Ma, G.; Dai, B.; Yang, J.; Zhang, J.; Yu, Y.; Liu, C.; Wu, X.; Bian, Q. Two-Channel Photonic Crystal Fiber Based on Surface Plasmon Resonance for Magnetic Field and Temperature Dual-Parameter Sensing. Phys. Chem. Chem. Phys. 2022, 24, 21233–21241. [Google Scholar] [CrossRef]
  6. Wang, D.; Zhu, W.; Yi, Z.; Ma, G.; Gao, X.; Dai, B.; Yu, Y.; Zhou, G.; Wu, P.; Liu, C. Highly Sensitive Sensing of a Magnetic Field and Temperature Based on Two Open Ring Channels SPR-PCF. Opt. Express 2022, 30, 39055–39067. [Google Scholar] [CrossRef]
  7. Garay-Palmett, K.; McGuinness, H.J.; Cohen, O.; Lundeen, J.S.; Rangel-Rojo, R.; U’Ren, A.B.; Raymer, M.G.; McKinstrie, C.J.; Radic, S.; Walmsley, I.A. Photon Pair-State Preparation with Tailored Spectral Properties by Spontaneous Four-Wave Mixing in Photonic-Crystal Fiber. Opt. Express 2007, 15, 14870–14886. [Google Scholar] [CrossRef] [Green Version]
  8. Reeves, W.H.; Skryabin, D.V.; Biancalana, F.; Knight, J.C.; Russell, P.S.J.; Omenetto, F.G.; Efimov, A.; Taylor, A.J. Transformation and Control of Ultra-Short Pulses in Dispersion-Engineered Photonic Crystal Fibres. Nature 2003, 424, 511–515. [Google Scholar] [CrossRef]
  9. Chen, Y.; Wadsworth, W.J.; Birks, T.A. Ultraviolet Four-Wave Mixing in the LP_02 Fiber Mode. Opt. Lett. 2013, 38, 3747. [Google Scholar] [CrossRef] [Green Version]
  10. Ahmedou, S.-E.; Dauliat, R.; Février, S.; Walter, G.; Delagnes, J.-C.; Labonte, L.; Tanzilli, S.; Gérôme, F.; Debord, B.; Benabid, F.; et al. Dispersion Engineered Tapered Photonic Crystal Fiber for Broadband and Tuned 2 Μm Emission Using Degenerate Four-Wave Mixing. In Proceedings of the Optica Advanced Photonics Congress 2022 (2022), Maastricht, The Netherlands, 24 July 2022; Optica Publishing Group: Washington, DC, USA, 2022; p. SoW5G.5. [Google Scholar]
  11. Jiang, R.; Saperstein, R.; Alic, N.; Nezhad, M.; McKinstrie, C.; Ford, J.; Fainman, Y.; Radic, S. 375 THz Parametric Translation of Modulated Signal from 1550 nm to Visible Band. In Proceedings of the 2006 Optical Fiber Communication Conference, and the 2006 National Fiber Optic Engineers Conference, Anaheim, CA, USA, 5–10 March 2006. [Google Scholar] [CrossRef]
  12. Andrekson, P.A.; Hansryd, J. Fiber-Based Optical Parametric Amplifiers and Their Applications. Eur. Conf. Opt. Commun. 2002, 2, 506–520. [Google Scholar]
  13. Yuan, J.; Zhou, G.; Xia, C.; Sang, X.; Li, F.; Yu, C.; Wang, K.; Yan, B.; Tam, H.Y.; Wai, P.K.A. Degenerate Four-Wave Mixing-Based Light Source for CARS Microspectroscopy. IEEE Photonics Technol. Lett. 2016, 28, 763–766. [Google Scholar] [CrossRef]
  14. Hameed, M.F.O.; Hassan, A.S.O.; Elqenawy, A.E.; Obayya, S.S.A. Modified Trust Region Algorithm for Dispersion Optimization of Photonic Crystal Fibers. J. Light. Technol. 2017, 35, 3810–3818. [Google Scholar] [CrossRef]
  15. Wang, N.; Yan, W.; Qu, Y.; Ma, S.; Li, S.Z.; Qiu, M. Intelligent Designs in Nanophotonics: From Optimization towards Inverse Creation. PhotoniX 2021, 2, 22. [Google Scholar] [CrossRef]
  16. Liu, C.; Maier, S.; Li, G. Genetic-Algorithm-Aided Meta-Atom Multiplication for Improved Absorption and Coloration in Nanophotonics. ACS Photonics 2020, 7, 1716–1722. [Google Scholar] [CrossRef]
  17. Mirjalili, S.M.; Abedi, K.; Mirjalili, S. Optical Buffer Performance Enhancement Using Particle Swarm Optimization in Ring-Shape-Hole Photonic Crystal Waveguide. Optik 2013, 124, 5989–5993. [Google Scholar] [CrossRef]
  18. Zhao, R.; Wei, Y.; Xu, H.; He, X. Process optimization of contact hole patterns via a simulated annealing algorithm in extreme ultraviolet lithography. Appl. Opt. 2023, 62, 927–932. [Google Scholar] [CrossRef]
  19. Poletti, F.; Finazzi, V.; Monro, T.M.; Broderick, N.G.R.; Tse, V.; Richardson, D.J. Inverse design and fabrication tolerances of ultra-flattened dispersion holey fibers. Opt. Express 2005, 13, 3728–3736. [Google Scholar] [CrossRef] [Green Version]
  20. Wang, Y.; Yu, F.; Hu, L. Inverse Design of Equivalent-Graded-Index Photonic-Crystal Fiber Based on Empirical Dispersion Formula. J. Light. Technol. 2021, 39, 5598–5603. [Google Scholar] [CrossRef]
  21. Lecun, Y.; Bengio, Y.; Hinton, G. Deep Learning. Nature 2015, 521, 436–444. [Google Scholar] [CrossRef]
  22. Zheng, S.; Wang, H.; Dong, S.; Wang, F.; Situ, G. Incoherent Imaging through Highly Nonstatic and Optically Thick Turbid Media Based on Neural Network. Photonics Res. 2021, 9, B220. [Google Scholar] [CrossRef]
  23. Information, E. Multi-Task Deep Neural Network (MT-DNN) Enabled Optical Performance Monitoring from Directly Detected PDM-QAM Signals. Opt. Express 2019, 27, 19062–19074. [Google Scholar]
  24. Agrawal, G.P. Nonlinear Fiber Optics, 5th ed.; Elsevier: Amsterdam, The Netherlands, 2013. [Google Scholar]
  25. Milam, D.; Weber, M.J.; Glass, A.J. Nonlinear refractive index of fluoride crystals. Appl. Phys. Lett. 1977, 31, 822–825. [Google Scholar] [CrossRef]
  26. Fletcher, R.; Reeves, C.M. Function Minimization by Conjugate Gradients. Comput. J. 1964, 7, 149–154. [Google Scholar] [CrossRef] [Green Version]
  27. Gan, L. Dispersion-Oriented Inverse Design of Photonic-Crystal Fiber for Four-Wave Mixing Application. Sci. Data Bank 2023. [Google Scholar] [CrossRef]
  28. Karanov, B.; Chagnon, M.; Thouin, F.; Eriksson, T.A.; Bulow, H.; Lavery, D.; Bayvel, P.; Schmalen, L. End-to-End Deep Learning of Optical Fiber Communications. J. Light. Technol. 2018, 36, 4843–4855. [Google Scholar] [CrossRef]
  29. Juvekar, V.; Su Lim, C.; Joon Lee, D.; Jun Park, S.; Ok Song, G.; Kang, H.; Myung Kim, H. An Azo Dye for Photodynamic Therapy That Is Activated Selectively by Two-Photon Excitation. Chem. Sci. 2021, 12, 427–434. [Google Scholar] [CrossRef]
  30. Xu, H.; Wu, J.; Dai, Y.; Xu, C.; Lin, J. Design Procedure for Photonic Crystal Fibers with Ultra-Flattened Chromatic Dispersion. Chin. Opt. Lett. 2011, 9, 050603. [Google Scholar] [CrossRef]
  31. Stepniewski, G.; Kasztelanic, R.; Pysz, D.; Stepien, R.; Klimczak, M.; Buczynski, R. Temperature Sensitivity of Chromatic Dispersion in Nonlinear Silica and Heavy Metal Oxide Glass Photonic Crystal Fibers. Opt. Mater. Express 2016, 6, 2689. [Google Scholar] [CrossRef]
Figure 1. Scheme of PCF inverse design. Forward: The principle of PCF structure determines phase-matching calculation. A one-to-one correspondence between PCF structure (Λ, d) and PCF index profile. For fixed pump power, one specific phase-matching curve is determined. Training data are 12,621 phase-matching curves labeled with various PCF structures. Inverse: PCF design for wavelength conversion based on the DNN algorithm.
Photonics 10 00294 g001
Figure 2. The construction diagram of the labeled data for training.
Photonics 10 00294 g002
Figure 3. The flow chart of inverse design is based on the DNN algorithm. The input is set as the scalar of the pump and target wavelength, and the output of DNN is the predicted PCF structure on demand.
Photonics 10 00294 g003
Figure 4. The loss (a) and RMSE (b) plots by training (red lines) and validation (blue curves) datasets.
Photonics 10 00294 g004
Figure 5. The average accuracy rate of DNN-predicted PCF structure parameters Λ, d/Λ under five different pump powers.
Photonics 10 00294 g005
Figure 6. (ad) The simulated converted wavelength error under different pump powers with pump wavelengths of 852 nm, 976 nm, 1064 nm, and 1310 nm, respectively.
Photonics 10 00294 g006
Figure 7. Calculated phase-matching curve of DNN-predicted PCF.
Photonics 10 00294 g007
Figure 8. (a) The diagram of the experimental setup utilizing four-wave-mixing with the fabricated PCF. The insert chart is a scanning electron micrograph (SEM) of the fabricated PCF in this work. (b) The output spectrum is 2.38 m of fabricated PCF. The signal wavelength is 770.2 nm; the idler wavelength is 1724.9 nm.
Photonics 10 00294 g008
Table 1. Fitting coefficients in Equation (5).
i = 1i = 2i = 3i = 4 i = 1i = 2i = 3i = 4
a i 1 −0.4783−0.0511−0.01922.6930 b i 1 0.02591.6916−0.00821.4322
a i 2 1.3702−0.533100.16907.2702 b i 2 −4.0257−0.06750.0101−3.0778
a i 3 2.94900.31140.45326.1010 b i 3 −1.10831.8010−1.0497−0.5835
a i 4 0.61492.04770.7288−0.2080 b i 4 1.4085−0.2888−4.7 × 10⁻⁵−1.2964
a i 5 −0.3761−1.1588−4.16043.2312 b i 5 −1.23571.0219−0.02421.7864
a i 6 1.40811.58460.6462−2.4868 b i 6 0.6089−1.701051.75500.8151
a i 7 1.1698−2.33282.86510.6660 b i 7 −0.89730.80854.39710.5550
Table 2. The ground truth values in the test dataset (PTEST) and DNN-predicted PCF structure parameters (PDNN) values.
PTEST PDNN PTEST PDNN 
d/ΛΛ (μm)d/ΛΛ (μm)d/ΛΛ (μm)d/ΛΛ (μm)
0.1 kW0.333.0950.333.0710.262.8750.262.812
0.283.6550.293.5890.394.510.394.459
0.274.1100.284.0410.382.4000.3812.411
1 kW0.372.5450.372.5530.323.8700.333.908
0.333.0950.343.1090.363.8550.363.891
0.324.4750.334.5160.274.3350.274.375
10 kW0.274.3350.274.3600.404.5350.414.529
0.333.0950.333.0760.293.6800.293.695
0.294.7800.294.7670.323.7300.323.791
100 kW0.323.8700.3283.8710.3204.4750.3224.491
0.363.8550.3613.8780.4004.5350.4024.594
0.372.5450.333.0950.3712.5950.3333.105
1000 kW0.283.630.283.6460.363.8550.363.967
0.344.7050.354.7720.324.4750.334.586
0.394.1250.394.1560.32.0950.312.105
Table 3. Target (Tar.) and fabricated (Fab.) of fiber parameters. Tar. and experimental (Exp.) of FWM Peaks.
ZDW (nm)PCF Λ (μm)PCF d/ΛSignal (nm)Idler (nm)
1140DNNFab.DNNFab.Tar.Exp.Tar.Exp.
3.933.820.370.41770770.21721.21724.9
Table 4. FWM in PCF at different temperatures.
Signal (nm)Idler (nm) Signal (nm)Idler (nm)
30 °C770.91725.070 °C767.3 1734.2
40 °C769.31728.180 °C765.6 1738.7
50 °C768.11725.590 °C765.8 1741.5
60 °C767.41733.2100 °C762.21737.7
Disclaimer/Publisher’s Note: The statements, opinions and data contained in all publications are solely those of the individual author(s) and contributor(s) and not of MDPI and/or the editor(s). MDPI and/or the editor(s) disclaim responsibility for any injury to people or property resulting from any ideas, methods, instructions or products referred to in the content.