Communication

FPGA-Based Hardware Implementation of Homodyne Demodulation for Optical Fiber Sensors

1
Applied Science and Technology Research Center, Instituto de Ingeniería y Tecnología, Universidad Autónoma de Ciudad Juárez, 450 Avenida del Charro, Ciudad Juárez 32310, Chihuahua, Mexico
2
Electrical and Computer Engineering Department, Instituto de Ingeniería y Tecnología, Universidad Autónoma de Ciudad Juárez, 450 Avenida del Charro, Ciudad Juárez 32310, Chihuahua, Mexico
3
Engineering Department, Centro Universitario de la Costa Sur, Universidad de Guadalajara, 151 Independencia Nacional, Autlán 48900, Jalisco, Mexico
*
Author to whom correspondence should be addressed.
Photonics 2023, 10(3), 258; https://doi.org/10.3390/photonics10030258
Submission received: 13 January 2023 / Revised: 22 February 2023 / Accepted: 23 February 2023 / Published: 28 February 2023
(This article belongs to the Topic Advance and Applications of Fiber Optic Measurement)

Abstract

:
Homodyne demodulation is a convenient technique for signal detection in interferometric sensors. The demodulation process is typically developed using analog circuits. However, to improve the performance of the demodulator, a digital system must be employed. In this study, we developed an optical fiber sensor by combining: (a) a Michelson interferometer, (b) a micro-electro-mechanical system (MEMS) device, and (c) a field-programmable gate array (FPGA)-based interrogator. Signal processing was integrated into the FPGA-embedded system. The homodyne demodulation algorithm was implemented with hardware modules developed in the hardware description language (HDL) to provide a portable, low-cost, and scalable digital system. The present study successfully demonstrates the development and validation of an FPGA-based interrogator capable of processing interferograms through a homodyne demodulation scheme. The experimental results reveal proper displacement measurements of the proof-mass MEMS and the low amount of hardware resources used. The displacement measurements obtained from the system matched those obtained from a certified characterization system. As the system can be easily reconfigured to the required measured signal, a similar measurement methodology can be developed using other demodulation schemes and optical fiber sensors.

1. Introduction

Constant progress in manufacturing techniques and precision engineering requires more precise measurement of displacements with a sub-nanometer resolution scale. In recent years, several works have attempted to develop mechanical displacement measurement using optical interferometers [1,2,3,4]. In addition, interferometers benefit from the inherent advantages of fiber optics, including their fast response even under rough environment variations (such as electromagnetic interferences), wide bandwidth, and low power consumption.
Optical fiber interferometers are well known for their ability to perform high-precision measurements, due to their prominent advantages such as non-contact measurement, compactness, light weight, immunity to electromagnetic interference, multiplexing capability, high resolution, and low cost [5,6,7,8]. Four interferometer configurations are usually cited in the literature: Fabry–Pérot, Mach–Zehnder, Michelson, and Sagnac, as they provide good sensitivity, accuracy, large dynamic ranges, and may cover long distances of monitored points [9,10]. In this proposal, we use the Michelson configuration.
These kinds of interferometers are suitable for assembling optical fiber sensor devices, in which the transducer of the physical magnitude to measure is the optical fiber itself [11]. This technology has some advantages with respect to entirely electronic transducers, such as immunity to electromagnetic interference, small size, and the possibility of using the same optical fiber to transmit the optical information to an electronic system [12].
The basic principle of an interferometric optical fiber sensor is that an applied stimulus causes a phase shift between two light beams. An incident light beam is split into two parts, the reference beam and the sensing beam, where the latter is affected by the variable of interest that we want to measure. The two beams are then recombined to create an interference pattern. This waveform, called an interferogram, has a nonlinear relationship with the phase shift; thus, relatively complex signal processing techniques need to be applied to obtain an output signal that is proportional to the stimulus. Common techniques include pseudo-heterodyne [13], synthetic-heterodyne [14], and homodyne [15]. Each of these techniques has both advantages and disadvantages. However, the homodyne system has achieved high performance, packageability, and low power consumption [15].
Therefore, an interrogator is needed to read the displacement in real time from the optical fiber sensor. Its implementation can exclusively use analog electronic devices to design and modify the demodulator; nevertheless, it implies a change in the circuit topology, which entails additional difficulties in the implementation and operation of the device. In addition, miniaturization, which is important for portable applications, is difficult. To tackle this problem, a demodulation algorithm can be implemented using a digital circuit. However, it requires the reconfiguration of hardware and several operations, with a high consumption of hardware resources. Fortunately, field-programmable gate array (FPGA) devices, which contain massive logic elements, large on-chip random access memory (RAM) storage, and rich digital signal processor (DSP) units, provide a potentially powerful platform to implement this scheme [16]. In addition, FPGA technology is more convenient because of its portability, high degree of parallelism, and low power consumption [17].
Two digital systems with the implementation of a homodyne demodulation (HD) algorithm have been reported [18,19]. Whereas in [18], a data acquisition (DAQ) board was used, and the acquired signal was processed using LabVIEW®®, a DSP controller board and Simulink/C language was used in [19]. However, these types of systems are massive, expensive, and require design redundancy to achieve high reliability and high-speed acquisition.
On the other hand, some FPGA-based interrogators for interferometric sensors have been proposed with different interferometers and demodulation schemes [20,21,22,23,24,25] to the ones used in this work. In [20], a system for displacement measurements based on a microcontroller and an FPGA is developed. However, the use of intellectual property (IP) cores, look-up table (LUT), or DSP modules is not reported. Moreover, since the processing is executed by separate devices, the processing speed is affected. The systems proposed in [21,22] are based on IP cores. The inconvenience is that the FPGA vendor’s IP cores are usually tailored for their own proprietary platforms. They are not portable and are frequently delivered as black boxes. Therefore, a system must be redesigned if it is retargeted to a device from a different vendor. The hardware design of [23] was performed by using hardware description language (HDL), but the hardware architecture is not reported. The hardware designs of [4,24,25] were built in the commercial embedded system Red Pitaya STEMlab 125-14, based on a Xilinx Zynq 7010 FPGA [26]. The disadvantages of these systems are that the designs are limited to the capabilities of the architecture of the system, and the code is not portable.
As can be seen, no FPGA-based HD algorithm was found, so part of the novelty is the hardware architecture construction and its use. In this work, the interest focuses on the digital implementation of the HD algorithm and its use to detect the proof-mass displacement of our own designed micro-electro-mechanical system (MEMS) [27]. The research is focused on demonstrating that the implementation of the HD algorithm in an FPGA-based embedded system can be developed without using a vendor’s proprietary IPs or components, taking advantage of the HDL portability, allowing for the development of VLSI (Very Large Scale Integration) integrated circuits, with a variety of technologies. The proposed prototype facilitates the way towards a complete digital integration on the chip of optical fiber sensors, which is capable of delivering real-time measurements for vibration and displacement applications in an embedded, autonomous manner.

2. Materials and Methods
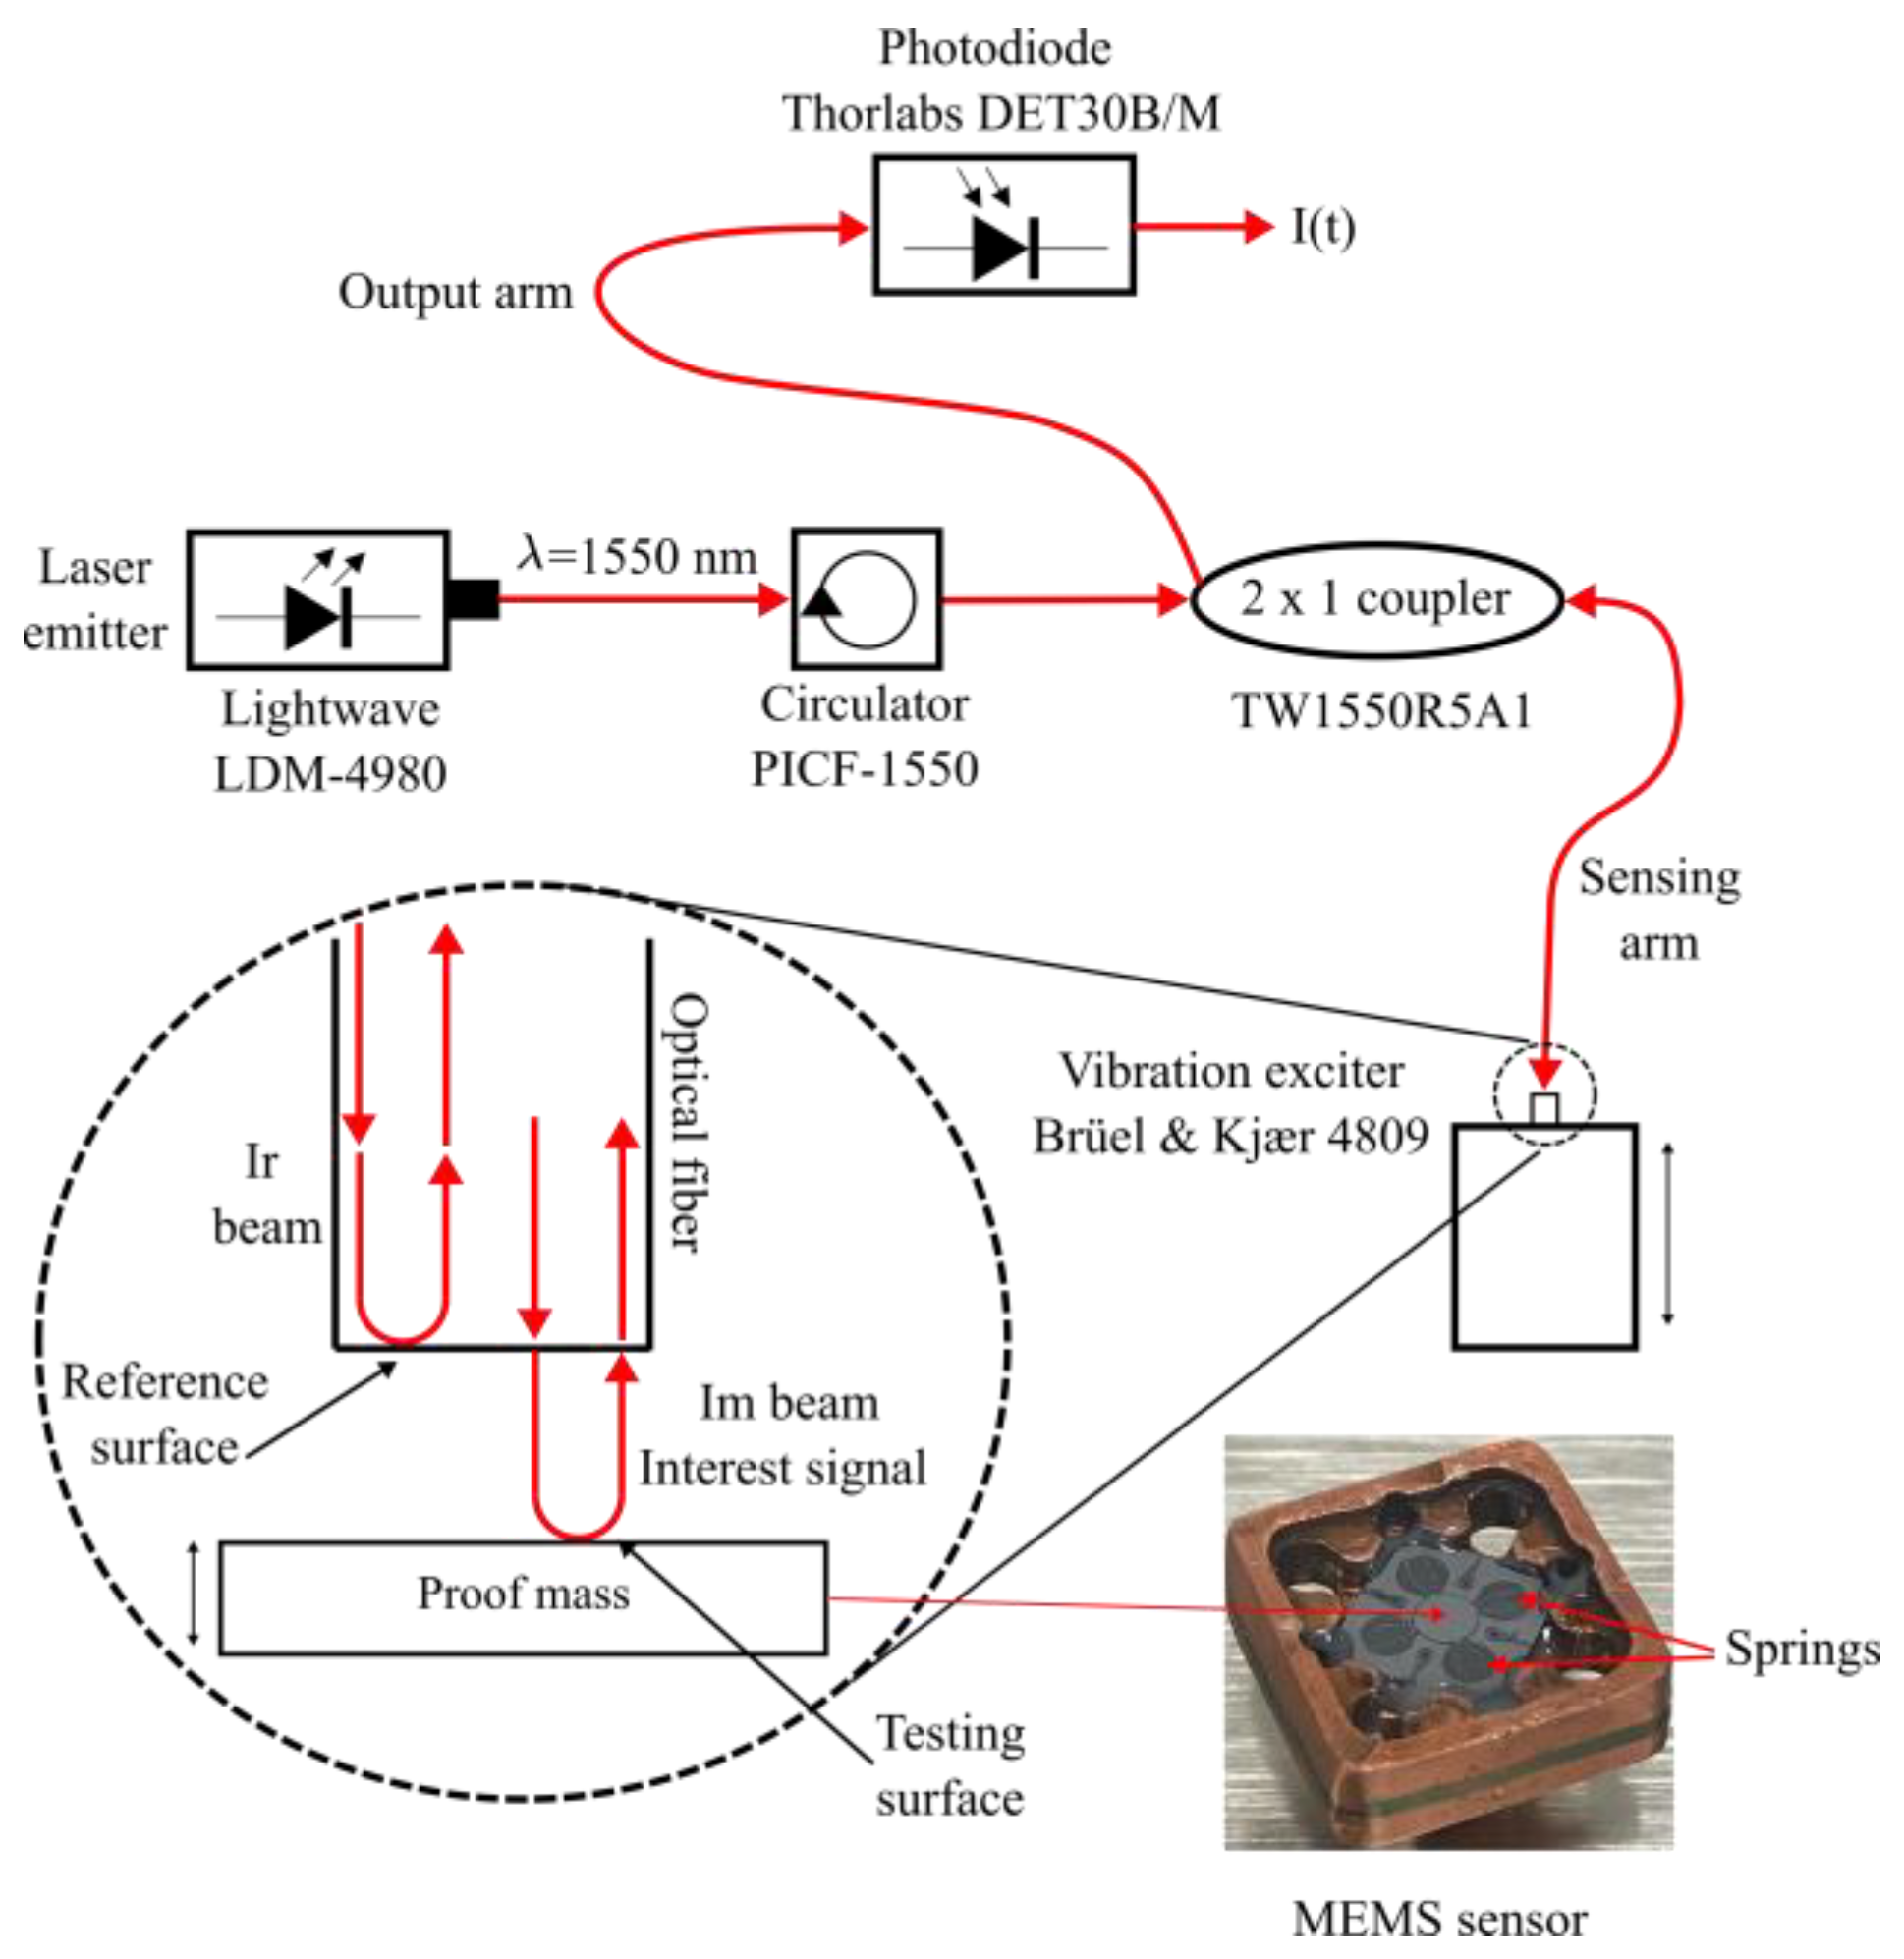
2.1. Optical Setup

Figure 1 shows the optical fiber Michelson interferometer configuration, where a monochromatic laser beam of wavelength  λ  is divided by a beam splitter into a reference  ( I r )  and a measurement  ( I m )  beam.
Both beams travel along the sensing arm of the optical fiber. Whereas  I r  is reflected at the end tip of the fiber,  I m  reaches the testing surface (the surface of proof-mass MEMS in this work). Thus,  I m  travels a different path; further, the fraction of light from the optical fiber that reaches the testing surface, which can be in motion or contain some of its physical properties—such as temperature, refractive index, and thickness—may change. Once both beams are reflected, they are coupled again into the sensing arm. Finally,  I r  and  I m  pass through the beam splitter again and combine, generating the phenomenon of interference [9,19].
As shown in Figure 1, the beam emitted from the LDM-4980 laser diode with  λ = 1550  nm was passed through a circulator to avoid retroreflections in the laser. The beam splitter is a 2 × 1 fiber coupler Thorlabs TW1550R5A1. A sinusoidal signal of 100 Hz was generated by using a Brüel & Kjær® (Virum, Denmark) 4809 vibration exciter to stimulate the proof-mass MEMS [28]. The modulated interference signal, generated by the Michelson interferometer, was detected by a photodiode Thorlabs DET30B/M, which converts the interference intensity of the reflected beams into a time-dependent electrical signal. The expression for the output signal  I ( t )  of the interferometer has the form:
I ( t ) = A + V cos ( 4 π λ O P D ( t ) )
where  A  and  V  are parameters that depend on interferometer values, such as the intensity of the source, and the coupling and reflection coefficients of fiber optics.  t  is the time and  λ  is the wavelength.  O P D ( t )  is the optical path difference function that accounts for the difference in the optical path induced by the variation in the measurand with respect to the reference fixed surface (the end tip of the sensing arm in Figure 1).
Figure 2 shows a measured amplitude of the interferometric signal and its spectrum. The signal is obtained with the optical setup of Figure 1 for the modulated and carrier signals of 100 Hz and 1000 Hz, respectively. The amplitude was normalized to a maximum amplitude of 1 V. The signal is very similar to the form of Equation (1) for a sinusoidal displacement. It can be recognized that the information of interest is inside the cosine argument of Equation (1), and the procedure to extract the information from  O P D ( t )  is known as demodulation.

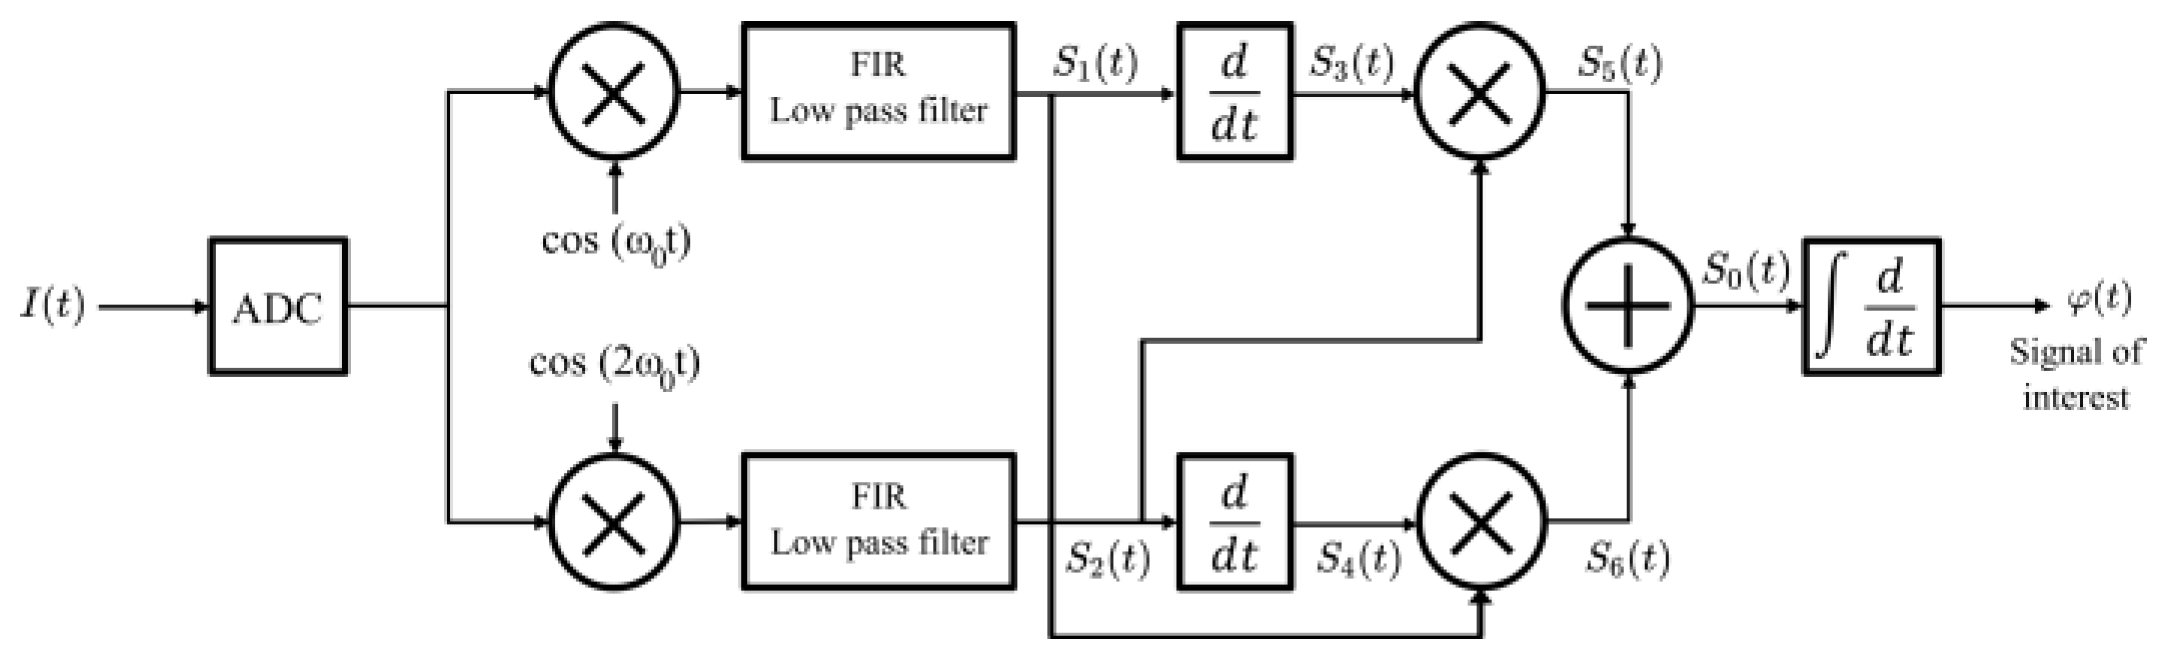
2.2. Demodulation Method
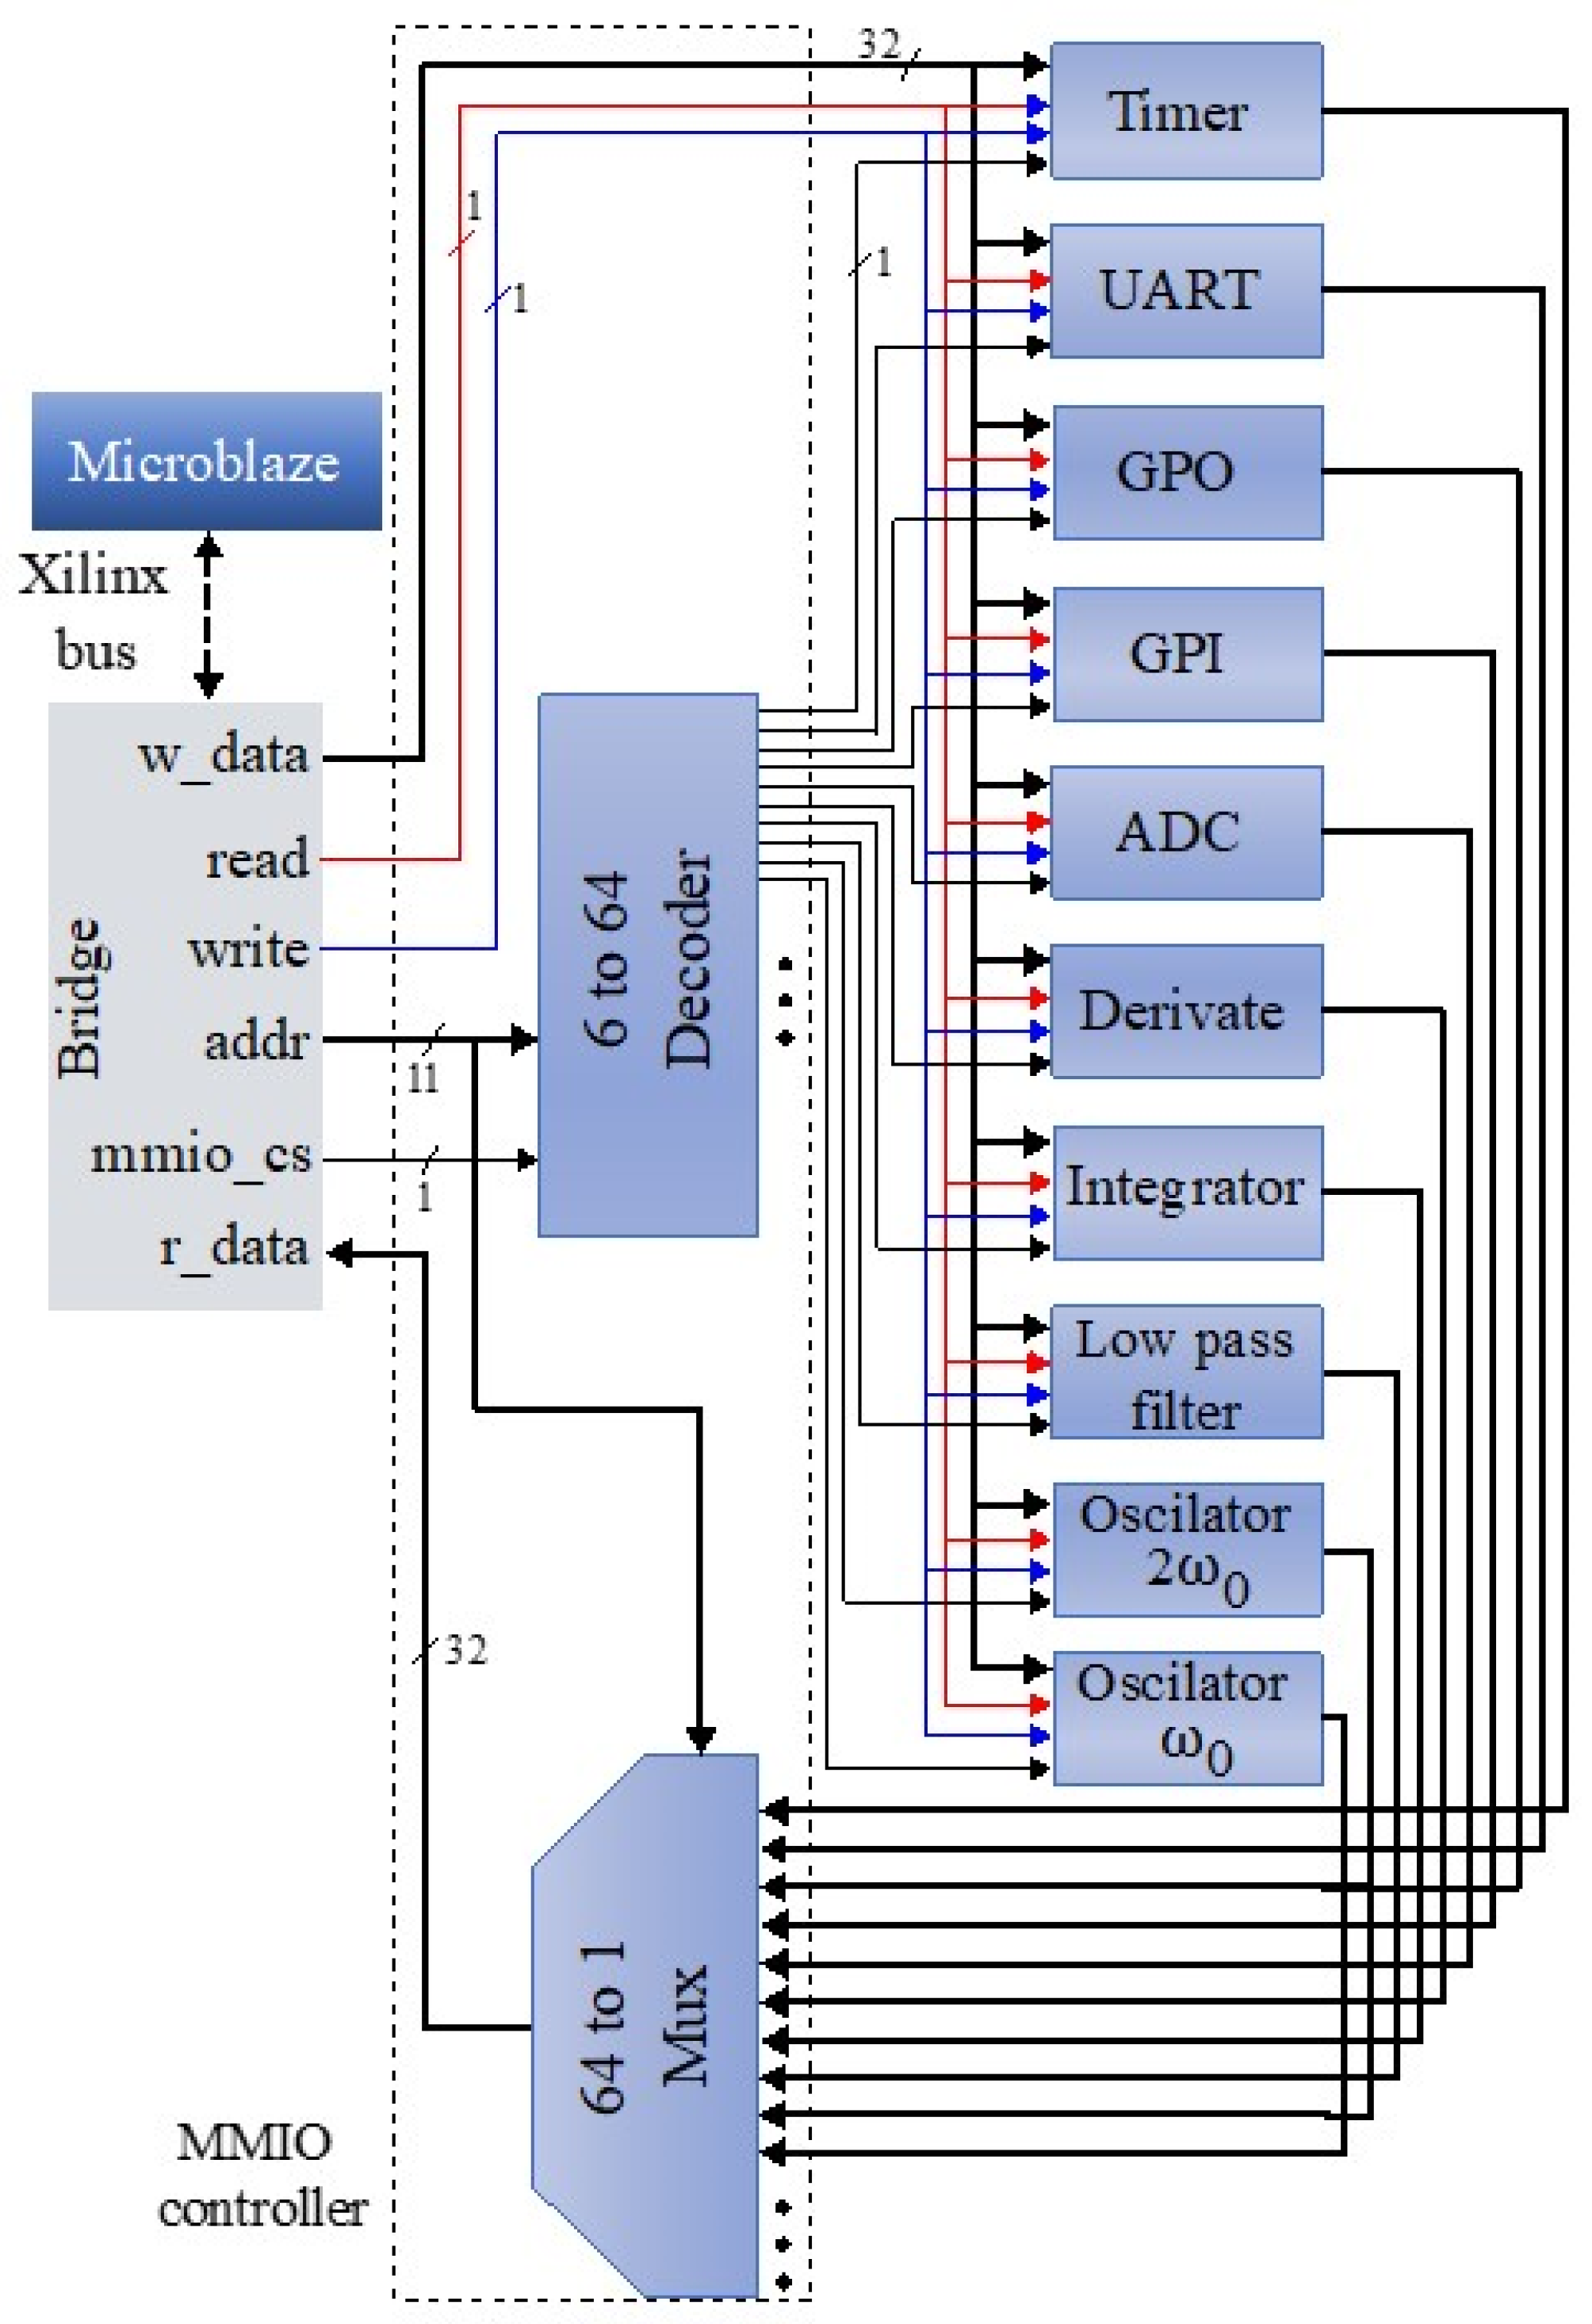
The homodyne demodulation (HD) scheme is the most widely used method for interferometric sensing. In this method, the frequency of the light source is not changed during the sensing process, but a phase-generated carrier is introduced as a known modulation at a known frequency, given by  C cos ω 0 t . Therefore, the information of interest is obtained through FM demodulation [29].
The photo-intensity detected from Equation (1) can be mathematically modeled as:
I ( t ) = A + V cos [ C cos ( ω 0 t ) + 4 π λ O P D ( t ) ]
where  C  represents the maximum amplitude of the arbitrary phase and  ω 0  is the carrier frequency [13].
Experimentally, there are several techniques for introducing the arbitrary phase,  C cos ω 0 t . One of them is the change of laser frequency through the variation of the laser injection current. This technique was used in this work, and it can be considered as an HD scheme in the context that the frequencies of  I r  and  I m  are the same [9,19]. Thus, Equation (2) can be rewritten as:
I ( t ) = A + V cos [ C cos ( ω 0 t ) + φ ( t ) ]
where  φ ( t ) = 4 π λ O P D ( t ) + u n d e s i r a b l e   p h a s e   v a r i a t i o n  represents the optical phase to be determined by the demodulation scheme. It not only represents the optical phase due to the measurand, but it also includes undesirable contributions due to environmental disturbances such as temperature, pressure, mechanical vibrations, etc.
After using Bessel function expansion in Equation (3), it can be shown that the second term contains two orthogonal components centered at the even and odd multiples of  ω 0 . This implies the mixing of the interferometer signal with  ω 0  and  2 ω 0  (which are the lowest odd and even components), as shown in Figure 3. The harmonics above the maximum frequency of interest are eliminated by low-pass filtering to obtain the two components  S 1 ( t )  and  S 2 ( t ) .
S 1 ( t ) = A V J 1 ( C ) sin [ φ ( t ) ]
S 2 ( t ) = A V J 2 ( C ) cos [ φ ( t ) ]
for the upper and lower branches of Figure 3, respectively.  J 1 ( C )  and  J 2 ( C )  represent the values of the first-kind Bessel functions of order one and two, respectively. Both are evaluated in  C , which is chosen such that  J 1 ( C ) = J 2 ( C ) ; therefore, the first value of  C  that satisfies this condition is  C 2.6  rad. In the proposed system, this value is adjusted through proper selection of the amplitude of the laser’s injection current. Next, the time derivatives of  S 1 ( t )  and  S 2 ( t )  yield:
S 3 ( t ) = A V J 1 ( C ) φ ˙ ( t ) cos [ φ ( t ) ]
S 4 ( t ) = A V J 2 ( C ) φ ˙ ( t ) sin [ φ ( t ) ]
Then, multiplying  S 1 ( t )  by  S 4 ( t )  and  S 2 ( t )  by  S 3 ( t )  gives
S 5 ( t ) = ( A V ) 2 J 1 ( C ) J 2 ( C ) φ ˙ ( t ) sin 2 [ φ ( t ) ]
S 6 ( t ) = ( A V ) 2 J 1 ( C ) J 2 ( C ) φ ˙ ( t ) cos 2 [ φ ( t ) ]
Afterwards, subtracting  S 5 ( t )  from  S 6 ( t )  gives
S 0 ( t ) = A V 2 J 1 ( C ) J 2 ( C ) φ ˙ ( t )
Finally, when Equation (10) is integrated with respect to  t , the information of interest is recovered, as shown in Figure 3.
φ ( t ) = A V 2 J 1 ( C ) J 2 ( C ) φ ˙ ( t )   d t

2.3. FPGA Design

The digital interrogator in the optical fiber sensor system is mainly responsible for demodulating the sensing information of the MEMS device. This analog interference signal was digitalized after signal conditioning using an analog to digital converter (ADC). The ADC has a resolution of 12 bits and a sampling rate of 1 M samples per second (SPS). A block diagram of the HD algorithm implemented in the FPGA-based embedded digital system is shown in Figure 4.
The entire implementation of the embedded system hardware uses a very high-speed integrated circuit (VHSIC) hardware description language (VHDL) with Vivado®® Design Suite 2019.2. The organization of hardware modules is based on the memory-mapped inputs/outputs (MMIO) method [30]. The Xilinx MicroBlaze soft-core microcontroller uses the same address space to address both memory and I/O cores. The MMIO controller decodes an input signal to select and enable one of the hardware modules (slots) and can accommodate up to 64 instantiated cores. After being wrapped with an interface circuit, custom digital modules (oscillators, derivative, integral, etc.) can be plugged into the platform [31].
From the MicroBlaze perspective, a slot is a 32-word (25-word) memory module. The slot interface is defined as follows.
  • A 32-bit signal carrying the read data (r_data).
  • A 32-bit signal carrying the write data (w_data).
  • An 11-bit word address for the hardware module (addr).
  • A 1-bit control signal to initiate a write operation (write).
  • A 1-bit control signal to initiate a read operation (read).
  • A 1-bit enable (chip select) signal to activate the MMIO system (mmio_cs).
  • The microcontroller must communicate with other cores. This is accomplished by the interconnected structure of a bridge and a bus. The bridge converts the Xilinx microcontroller native bus signals into a simple synchronous bus protocol for the MMIO system (Figure 4).
The proposed embedded system was built around a specific application, and its configuration was tailored to support the application. The software model contained three layers [31]. The first (bottom) layer is the hardware platform specification, which captures the relevant hardware information (microcontroller configuration, memory size, I/O cores, etc.) required for software development and deployment. The second (middle) layer was the board support package (BSP). It is a software library (in C++) containing drivers and initialization routines based on information from the hardware platform specification file. The third (top) layer is the application program that uses the routines in the BSP library to access the hardware modules. A driver acts as a translator between the hardware module and application programs and enables the application programs to access module functions without needing to know precise details. To obtain the final software image file (.elf file) of the system, the software routines and BSP library were compiled and linked using the software development kit (SDK) of Xilinx.

2.3.1. Finite State Machine

The hardware modules of the filter, derivative, and integral require a finite state machine to maintain the previous input value. It has three internal states: The first state is wait_new_data, where the writing operation from the microcontroller is paused, and the previous data entered in the module are maintained. The second is processing. In this state, a specific function of the module was carried out. The third state is waiting_data_reading, in which the processed data are obtained by the reading operation of the microcontroller.

2.3.2. Look-Up Table (LUT)

This module is a memory array containing the output data of a function. The proposed architecture optimizes the data flow path and employs two LUTs of 512 words in length with the values of functions  cos ω 0  and  cos 2 ω 0  in the oscillator’s modules. This method avoids the entire process involved in the calculation of the trigonometric functions [25]. The software implementation of the C++ class contains the following attributes:
  • A constructor that requires the address of the VHDL module.
  • A writing method, which requires a 32-bit index as an input parameter.
  • A read method, which receives the 32-bit data from the LUT as a result.

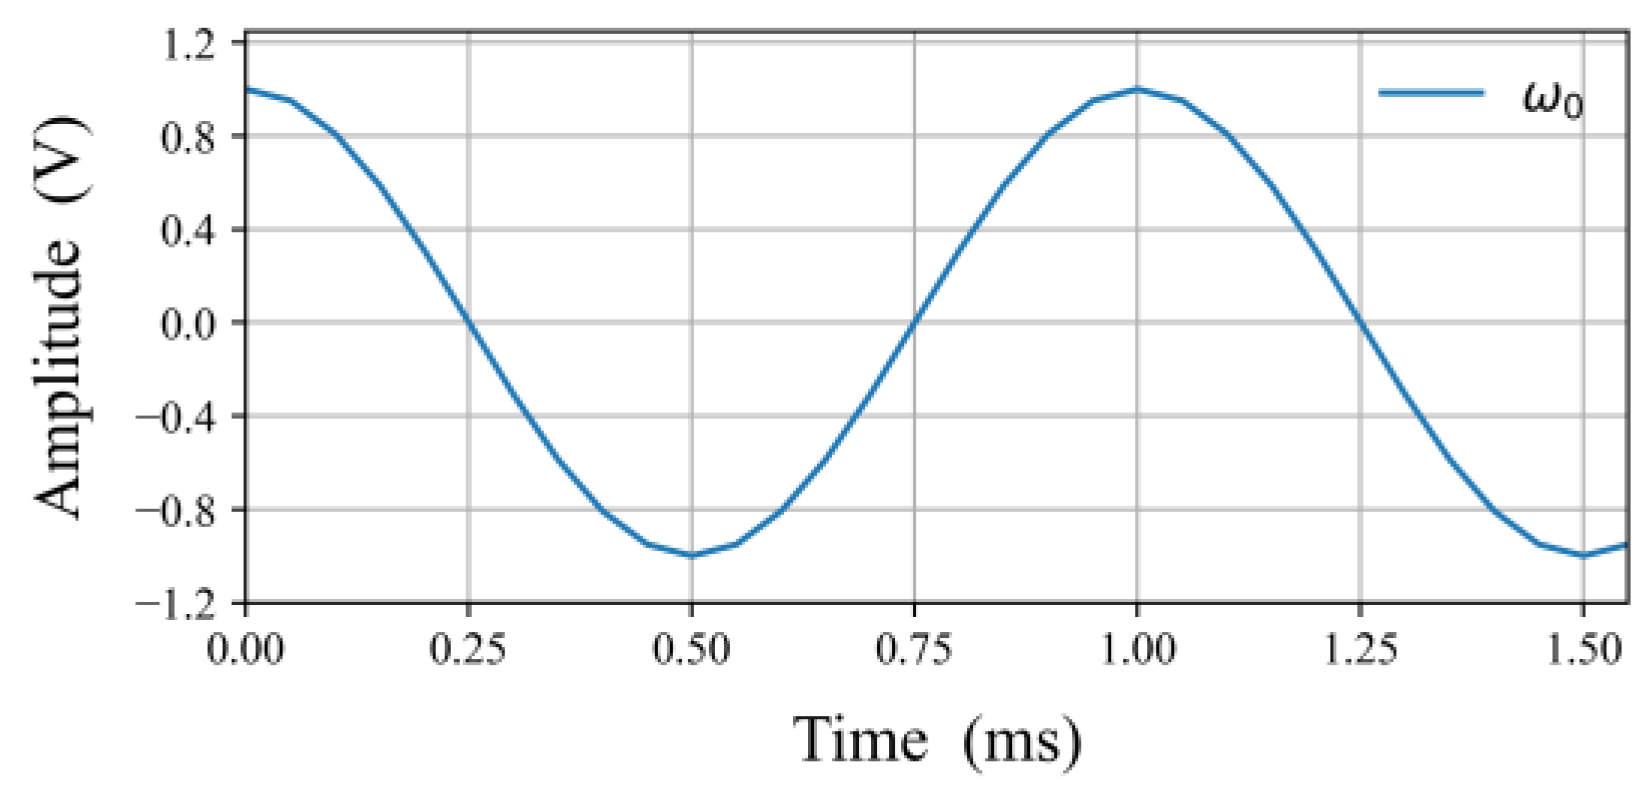
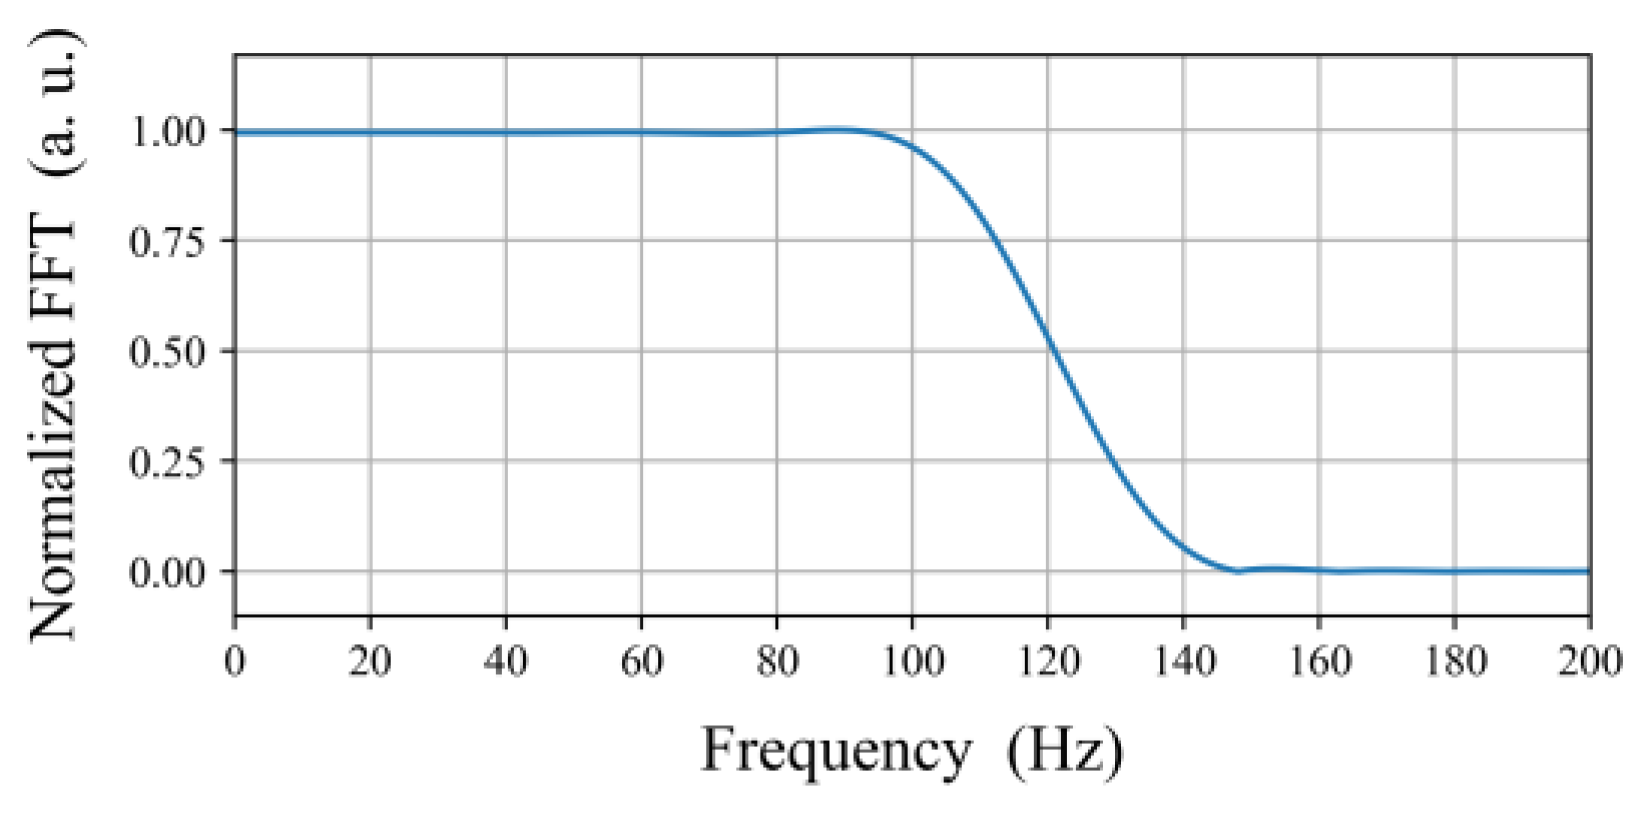
2.3.3. Low-Pass Filter

The low-pass finite impulse response (FIR) filter plays an important role in the embedded system. It suppresses the higher components of the frequencies of the signals used to stimulate the proof-mass MEMS (sinusoids of 200 and 100 Hz). The output sample depends on the present input sample and the previous input sample. The model in the time domain for the low-pass FIR filter is given as:
y ( n ) = i = 0 N 1 b i x ( n i ) = b 0 x ( n ) + b 1 x ( n 1 ) + + b N x ( n N )
where  b i  represents the filter weights or coefficients,  x ( n i )  denotes the input values, and  N  represents the filter order [32]. In this preliminary version of the embedded system, the low-pass filter was implemented through software (in C++) owing to the complexity of the hardware implementation. A Hanning filter was designed in MATLAB®® with a cut-off frequency of 120 Hz and an order of N = 141. Consequently, the generated coefficients were used in the FPGA implementation. The filter parameters were variable in order to adjust the cut-off frequency to the interferogram signal.

2.3.4. Derivative

The operator of differentiation was numerically approximated by a finite difference scheme of the first order:
d f ( t ) d t ( f n f n 1 T )
where  T  is the sampling period,  f n  and  f n 1  are the samples of a function  f  at times  t  and  t T . The VHDL module implementation of the derivative takes the input value, subtracts the previous value, and divides the result by the sample time  T . This implementation implies that the precision of the hardware module depends on the sampling rate. Regarding the software, the implementation of the class in C++ contained the same attributes that were used in the LUT module.

2.3.5. Integrator

The integration of the signal  f ( t )  is the final part of the homodyne demodulator. This operator can be approximated numerically by:
a b f ( t )   d t = i = 1 n t i 1 t i f ( t )   d t i = 1 n f ( t i 1 ) + f ( t i ) 2 T
called the trapezoid rule, which locally approximates a curve by a straight line. Considering two points, a trapezoid can be created to obtain an approximation of the area under the curve. The VHDL module implementation of the integral takes the previous input  f ( t i 1 )  value, adds the input value, and divides the result by 2. This division is implemented in VHDL shifting to the left position. The implementation of the class in C ++ contains the same attributes that were used in the LUT and derivative cores.
As shown in Figure 3, the demodulation algorithm must implement two derivatives. To optimize execution times, the two functions were implemented with two hardware modules and two objects. Both objects were identical, except for the address.

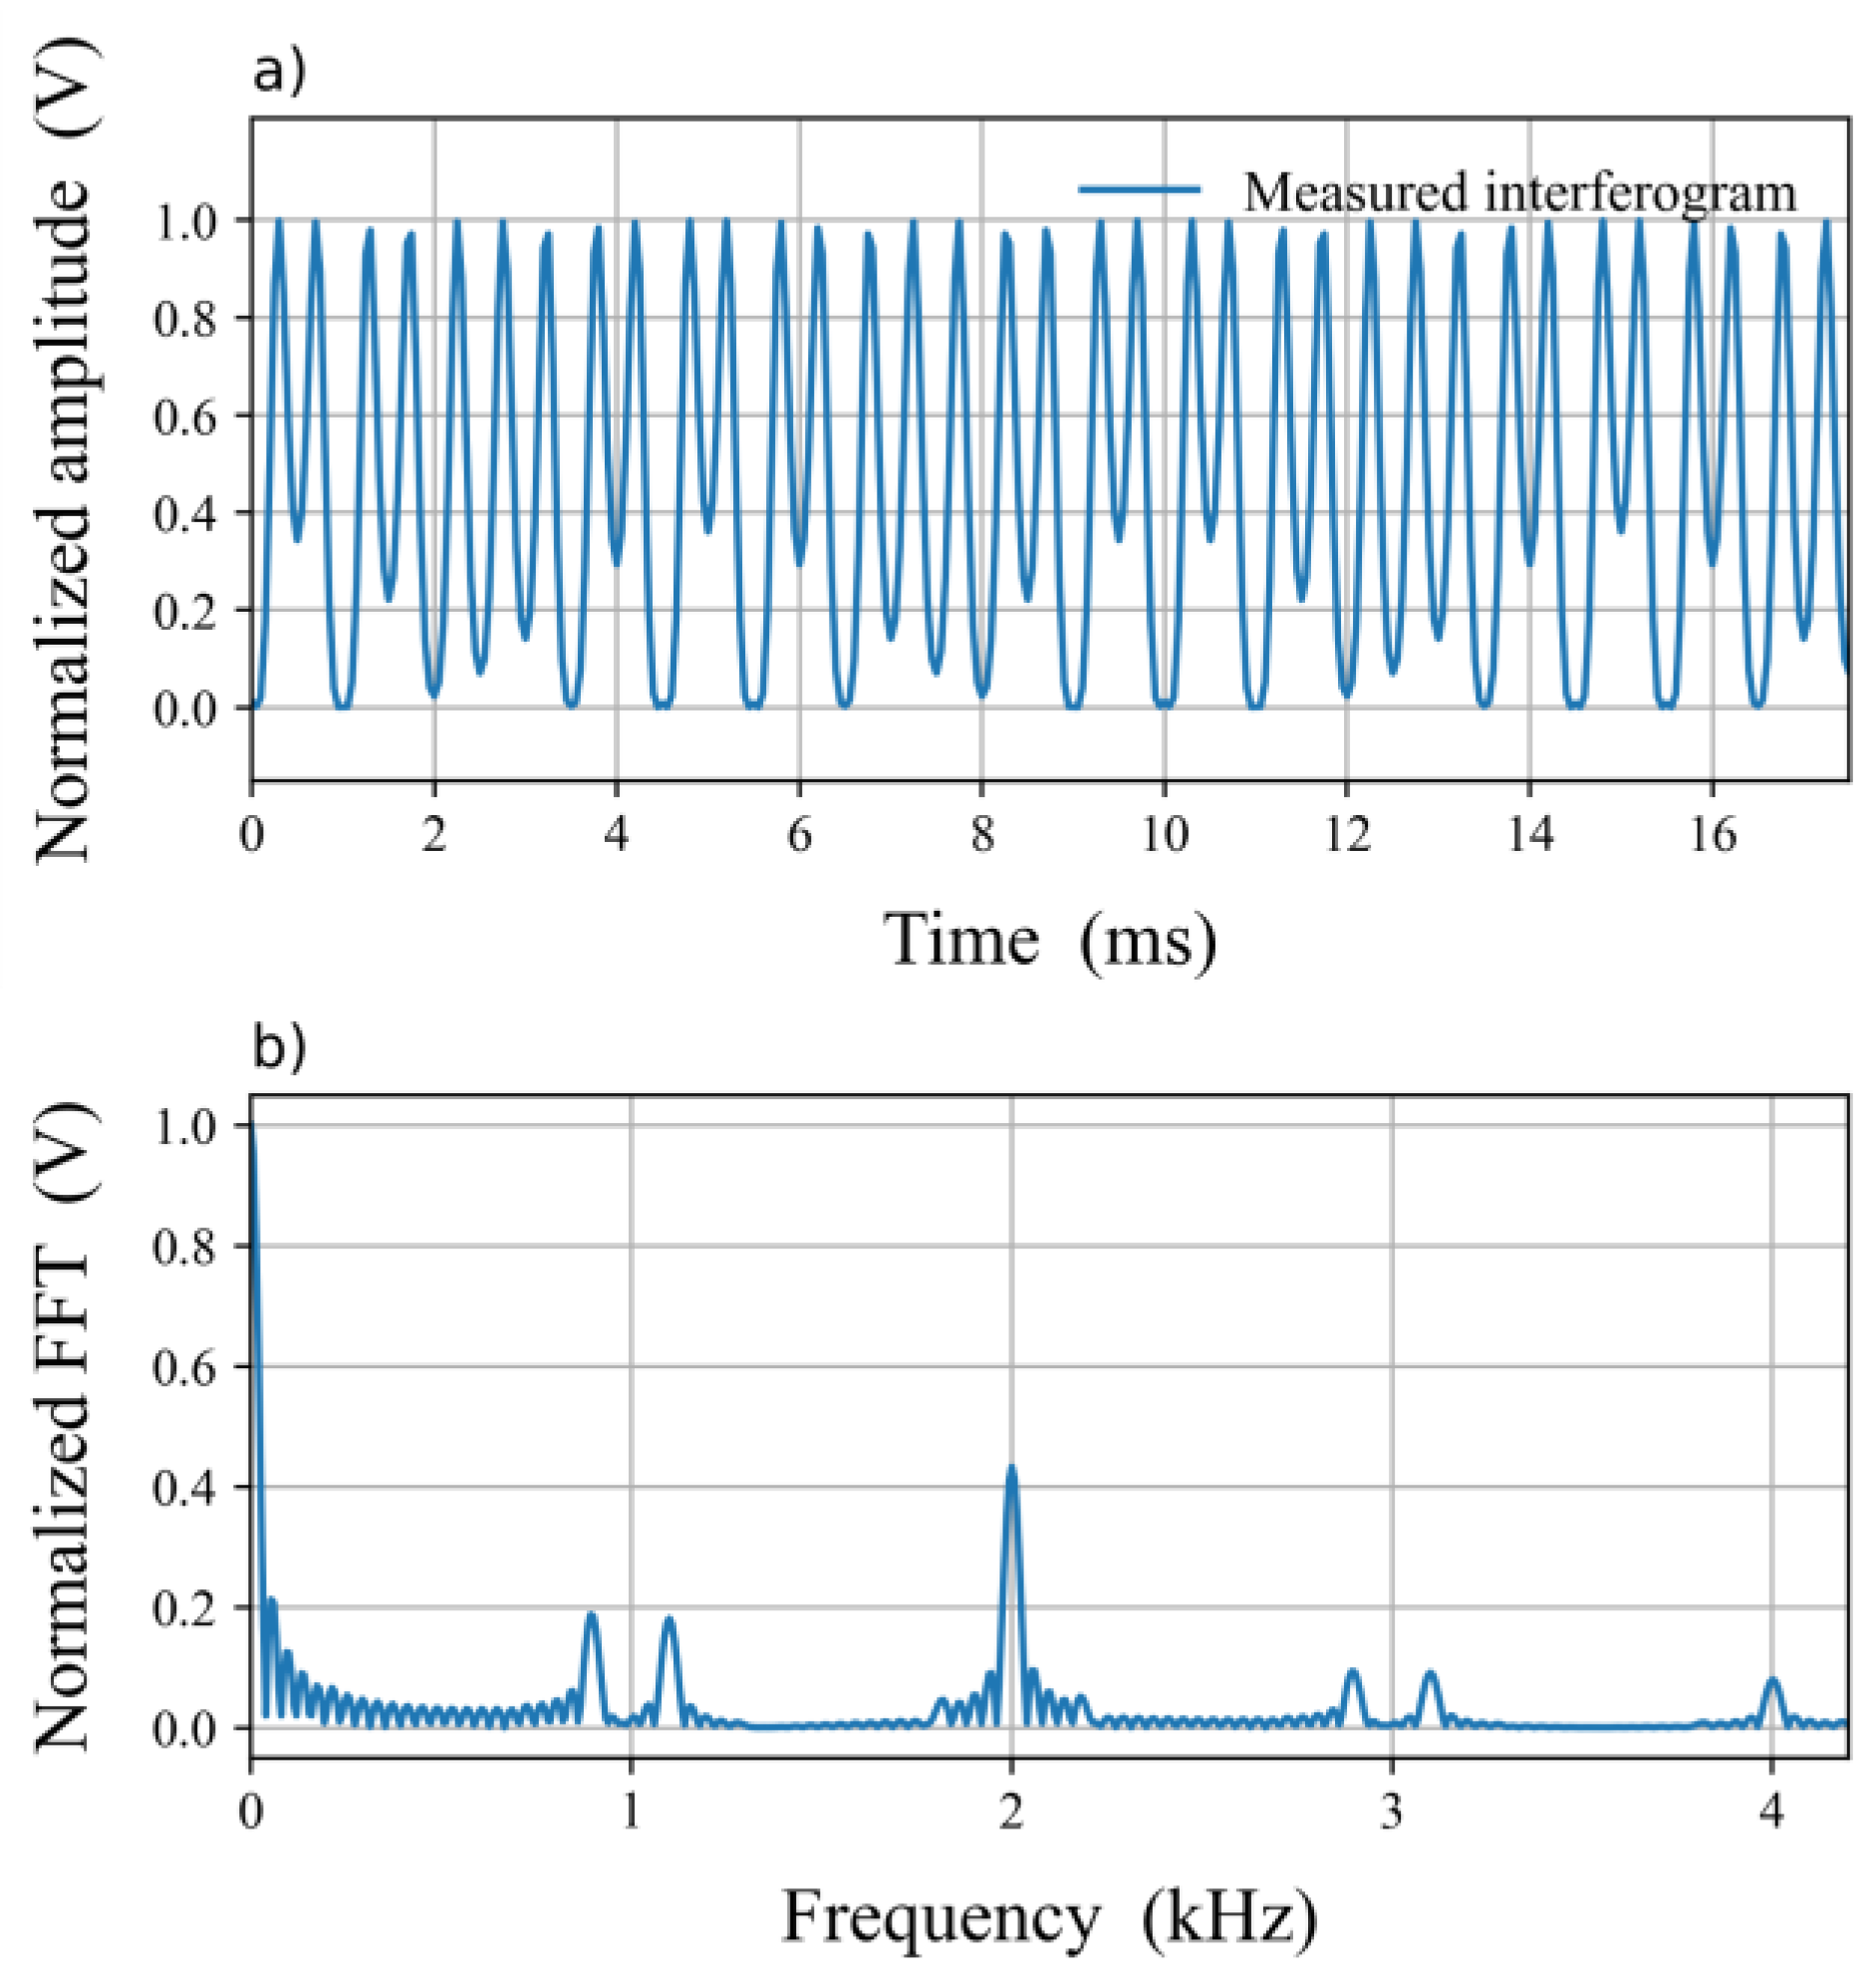
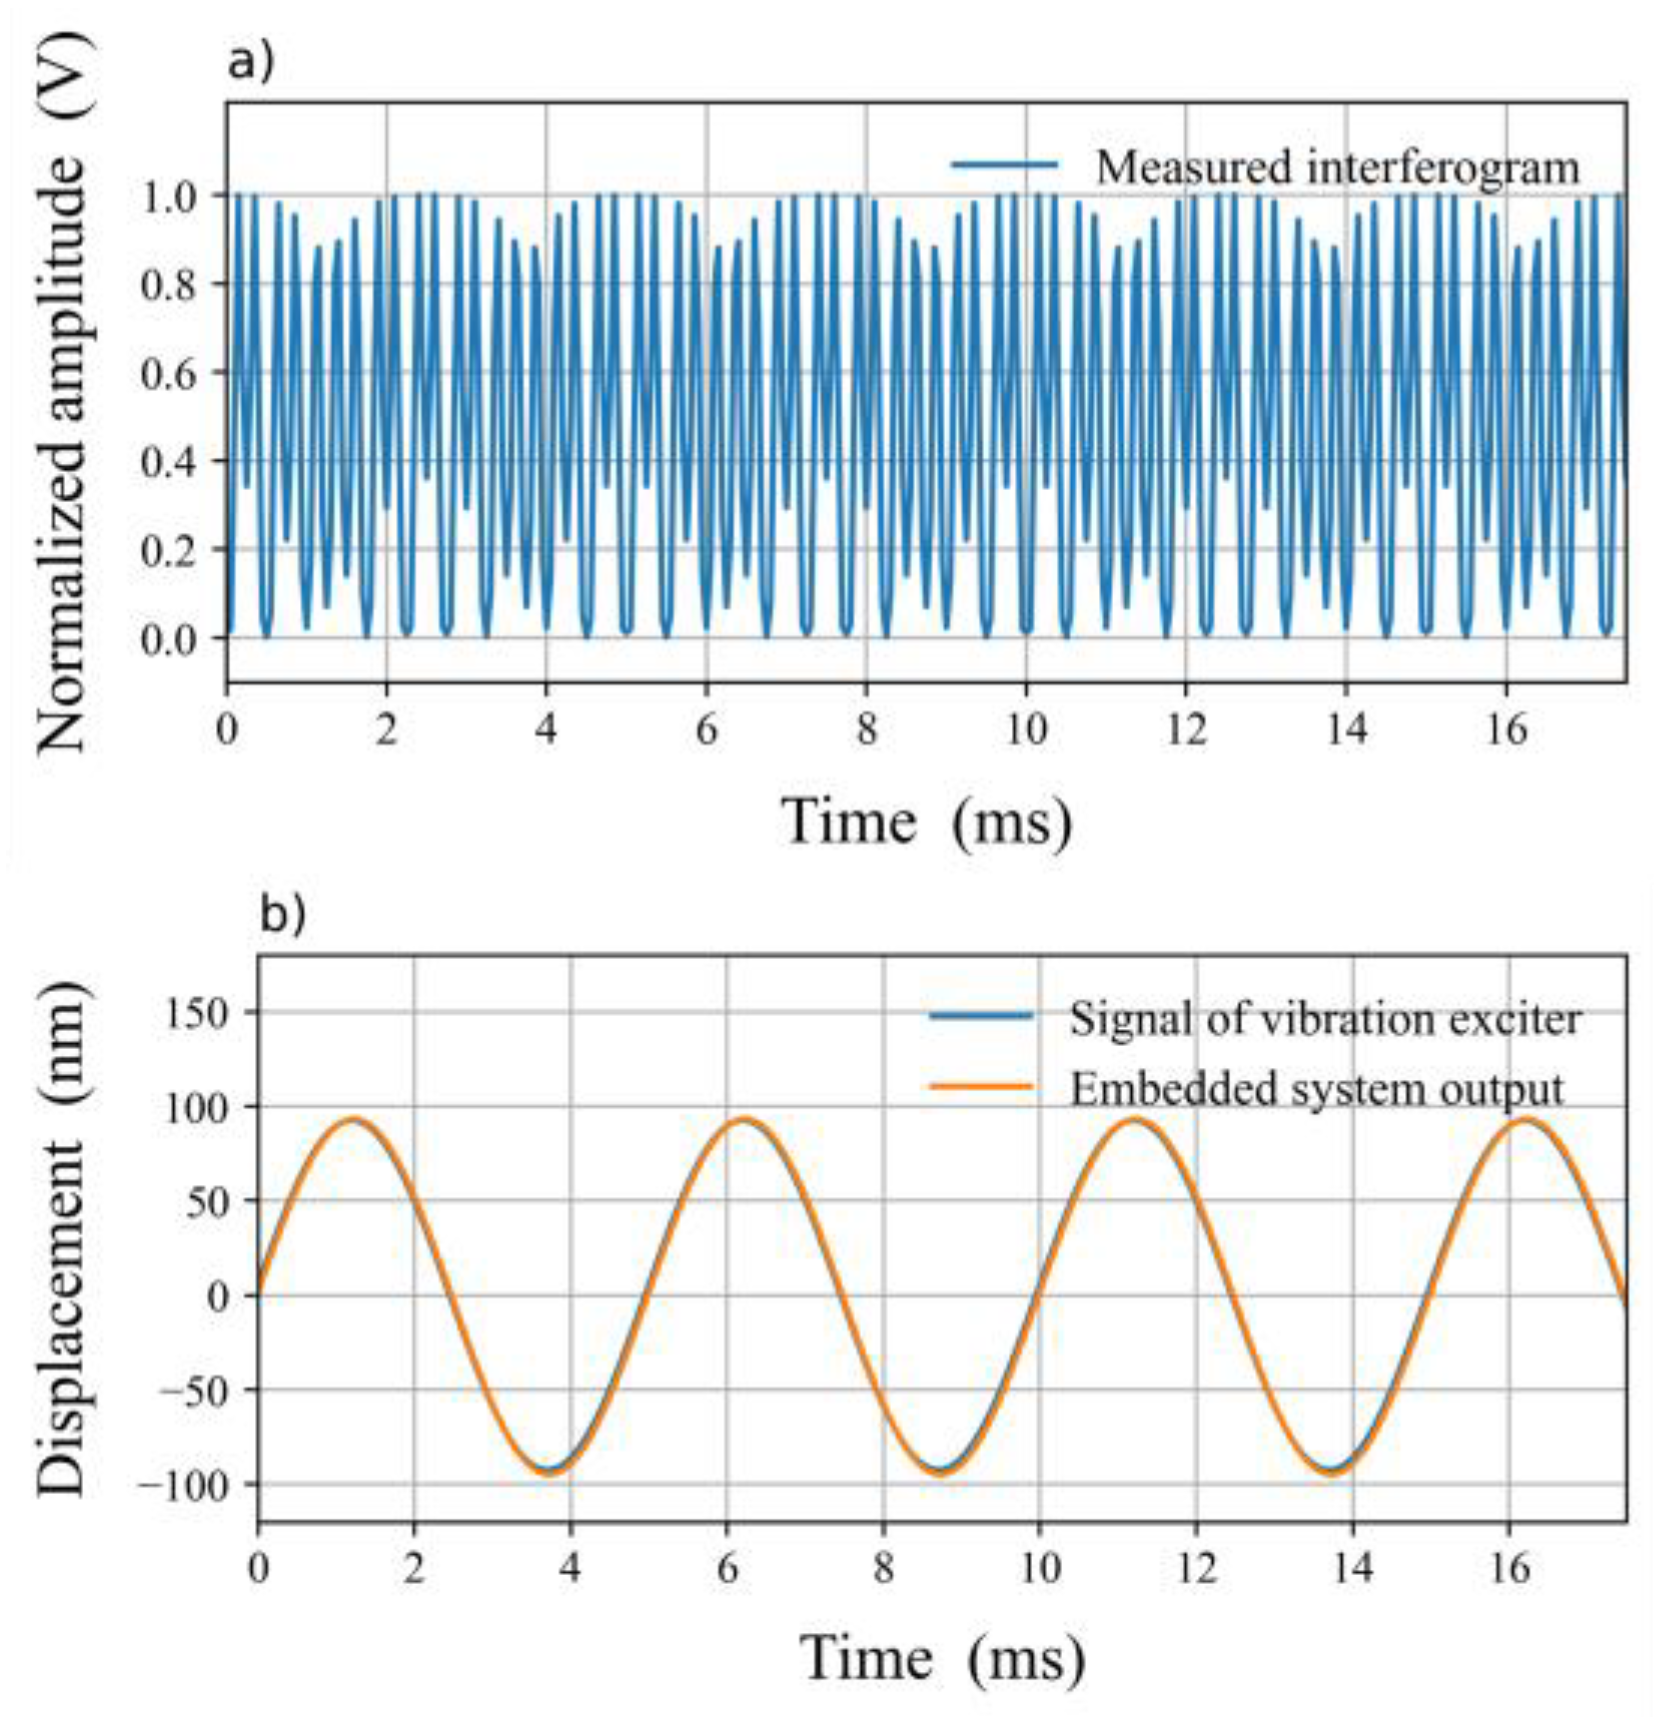
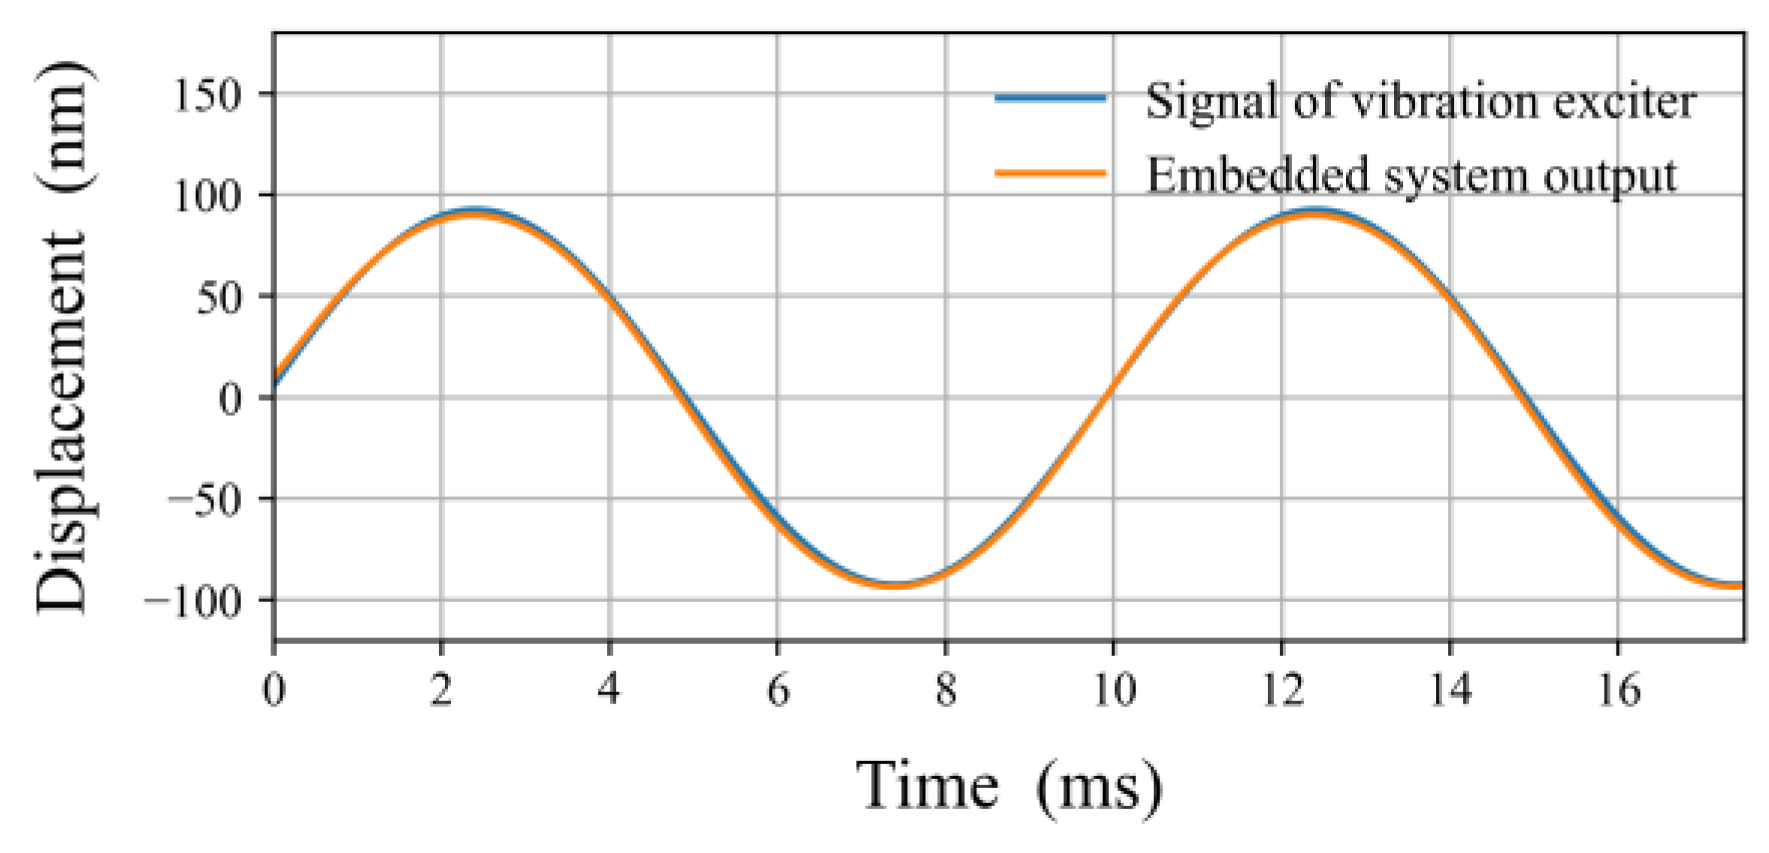
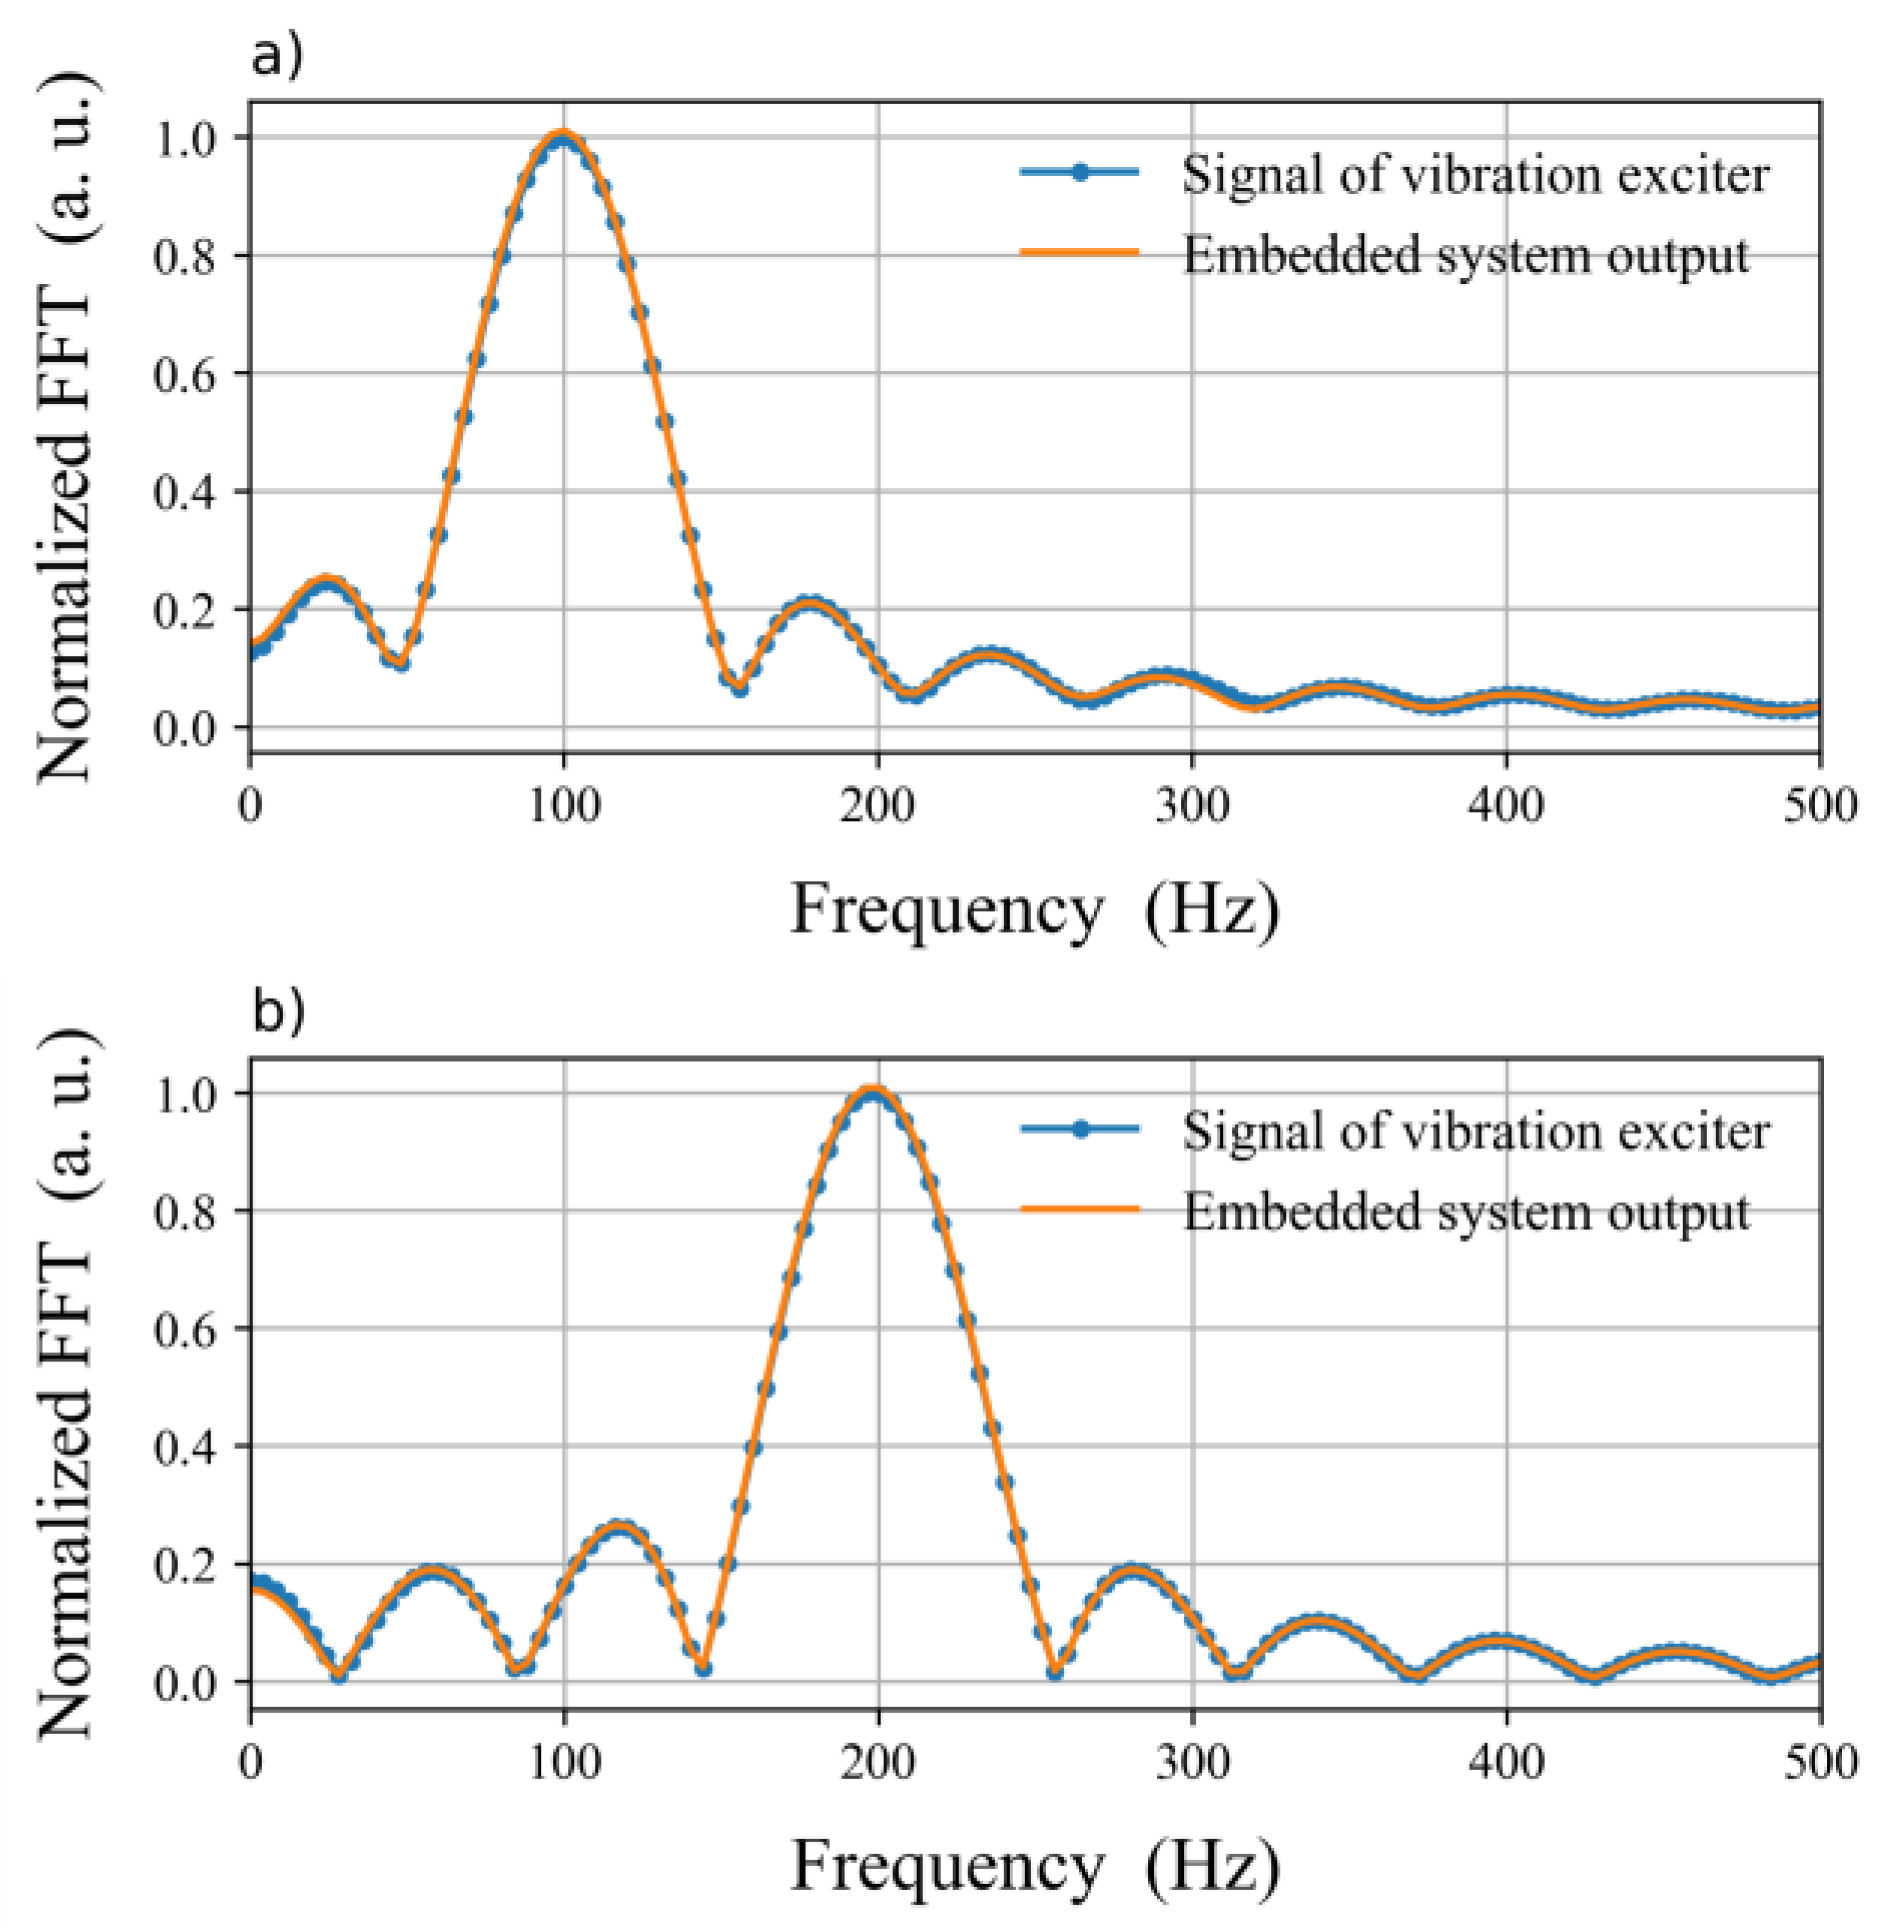
3. Experimental Results

In the present study, an FPGA-based digital system with an HD scheme is validated by measuring the motion of a proof-mass MEMS, taking as reference the input vibration generated with a certified characterization system. It consists of a Kistler 5022 controller, 8076 K reference accelerometer, and a Brüel & Kjær®® 4809 vibration exciter. The embedded system was tested by introducing the input interferogram defined by Equation (2) with  A = V = 1   I ( t ) = 1 + cos [ 2.6 cos ( 2 π × 1000 t ) + φ ( t ) ] . This signal had a carrier frequency of  ω 0 = 1 000 Hz and amplitude  C = 2.6   r a d . The shaker generates sinusoidal signals to excite the mass. Thus,  φ ( t ) = ( 4 π / λ ) D sin ( ω t ) + u n d e s i r a b l e   p h a s e   v a r i a t i o n , where  D  and  ω  represent the maximum amplitude and angular frequency of the measurand vibrations, respectively. Two modulated signals  φ ( t )  with an amplitude of  0.75   r a d  and angular frequencies of  ω = 2 π × 200  and  ω = 2 π × 100  were used. However, the system was tested in the frequency range of 50 to 500 Hz, which is a useful range of this displacement MEMS sensor. The output signal of the system was obtained using the universal asynchronous receiver–transmitter (UART) module. It establishes a serial communication channel with a computer via a serial port, and its interface utilizes first-in–first-out (FIFO) buffers.
Figure 5 shows the curve of the oscillator  cos ω 0  as was implemented in hardware, using a LUT module of 512 words. Figure 6 shows the FFT (magnitude) response of the low-pass filter as implemented in the FPGA. The filter has the suitable parameters to eliminate the harmonics above the maximum frequencies of interest of  φ ( t ) ω = 2 π × 200  and  ω = 2 π × 100 .
Figure 7 shows the input and output signals of the embedded system for a modulated signal of 200 Hz. Figure 7a shows the input interferogram  I ( t ) . In addition, a comparison between the output signal and the modulated signal  φ ( t ) = 0.75 cos ( 2 π × 200 t )  is shown in Figure 7b. To change the units from radians to meters, both signals are scaled to  λ 4 π .
Figure 8 shows a comparison between the output signal of the embedded system and the modulated signal  φ ( t ) = 0.75 cos ( 2 π × 100 t ) . The input interferogram for the modulated signal of  ω = 2 π × 100  is shown in Figure 2.
Figure 9 shows the FFT (magnitude) of the displacement responses corresponding to Figure 7b and Figure 8. Figure 9a,b show the spectrum comparison of the embedded system output and shaker signal when the proof-mass is excited with sine signals of 200 and 100 Hz, respectively.

4. Discussion

Figure 5 shows that the LUTs of cosine waves can be reconfigured easily in the system instead of the calculation of the trigonometric functions. The same method used in Figure 5 was used in the VHDL implementation of the oscillator  cos 2 ω 0 .
The interest signal shown in Figure 1 was recovered correctly using the HD technique, as shown in Figure 7b and Figure 8. That is, they describe the response of the proof-mass MEMS to the sinusoid signal generated by the vibration exciter.
As mentioned in Section 2.3.3, the order of the low-pass filter was N = 141. However, for  N > 141 , the demodulator estimator presents a signal behavior that is in phase, and the maximum and minimum values are correctly estimated. Figure 9 shows that the proposed FPGA-based interrogator detects the frequencies of interest of 200, 100 Hz, and its harmonics.
Table 1 lists the results obtained after the application of HD to the experimentally acquired interferograms signals. The root-mean-squared (RMS) errors were calculated by comparing the output displacement of the embedded system with the sinusoidal reference target displacement generated by the vibration exciter.
We would like to emphasize that the design implementation of the modules for the prototype of the embedded system consumes very few resources: 6149/63400 (10%) LUTs, 32.5/135 (24%) RAM blocks, and 9/240 (4%) DSP elements on an Artix-7 FPGA. This low consumption of hardware resources results in an efficient and portable FPGA design system for a homodyne demodulator. This FPGA-based interrogator could be relevant in recent studies based on demodulation schemes for optical fiber sensors [33,34,35,36,37,38,39].
The main application of the prototype is in vibration monitoring, using a MEMS sensor [27]. We identified two limitations of the system. The first one is that for frequencies greater than 800 Hz, the interrogator is limited by the size of LUTs to implement the trigonometric functions  cos ω 0  and  cos 2 ω 0 , but it can be solved with a module of the direct digital synthesis of a cosine waveform. Another limitation is the sampling rate of the ADC. However, the hardware is portable because no IP cores were used. Therefore, the system can be implemented in a different FPGA development board with a better ADC.

5. Conclusions

This work successfully demonstrates the development and validation of an FPGA-based interrogator capable of processing interferograms through a homodyne demodulation scheme, whose principal aim is the interrogation of optical fiber sensors. The hardware modules were developed from scratch in VHDL. This method offers a low consumption of resources in the FPGA: on average, we only consumed 13% of the resources in the hardware platform. Moreover, the bus protocol and device drivers were not tied to any specific commercial platform. Thus, the embedded system is portable, and the hardware can be synthetized for a VLSI design of an integrated circuit or reused on different FPGA devices and prototyping boards. Our experimental findings show that our system has the potential for engineering applications to monitor vibrations, including applications in high electromagnetic power generation machines.

Author Contributions

Conceptualization of FPGA architecture and writing—original draft preparation, A.J.; methodology and investigation of the optical system, and characterization of the MEMS sensor, Á.S.; formal analysis and writing—review and editing, A.M.; data curation and validation J.D.; MEMS sensor integration, writing—review and editing, J.M.J. All authors have read and agreed to the published version of the manuscript.

Funding

The authors thank Universidad Autónoma de Ciudad Juárez and Instituto de Ingeniería y Tecnología for the usage of laboratory facilities at open user’s Centro de Investigación en Ciencia y Tecnología Aplicada (https://www.uacj.mx/IIT/CICTA/, accessed on 10 January 2023) of UACJ. The authors also thank the Sistema Nacional de Investigadores of Consejo Nacional de Ciencia y Tecnología (CONACyT-México) for providing research fellowship. This work was published with the economic support of the Instituto de Innovación y Competitividad de la Secretaría de Innovación y Desarrollo Económico del Estado de Chihuahua (2022–2028), who the authors thank for providing a partial economical support to defray article processing charges.

Institutional Review Board Statement

Not applicable.

Informed Consent Statement

Not applicable.

Data Availability Statement

Data supporting this study are openly available from OneDrive at https://alumnosuacj-my.sharepoint.com/:x:/g/personal/abimael_jimenez_uacj_mx/ERQojB_110BMpe7UyOOB5HQB2V5HchzqRkOGTXZBIszaSw?e=0×1ftu, accessed on 10 January 2023.

Conflicts of Interest

The authors declare no conflict of interest.

References

  1. Kazieva, T.V.; Gubskiy, K.L.; Kuznetsov, A.P.; Reshetov, V.N. 3D push–pull heterodyne interferometer for SPM metrology. Appl. Opt. 2019, 58, 4000–4006. [Google Scholar] [CrossRef] [PubMed]
  2. Nguyen, T.D.; Higuchi, M.; Vu, T.T.; Wei, D.; Aketagawa, M. 10-pm-order mechanical displacement measurements using heterodyne interferometry. Appl. Opt. 2020, 59, 8478–8485. [Google Scholar] [CrossRef] [PubMed]
  3. Yu, L.; Molnar, G.; Werner, C.A.; Weichert, C.; Koening, R.; Danzebrink, H.-U.; Tan, J.; Fluegge, J. Single beam 3DoF homodyne interferometer. Meas. Sci. Technol. 2020, 31, 084006. [Google Scholar] [CrossRef]
  4. Straube, G.; Fischer Calderón, J.S.; Ortlepp, I.; Füßl, R.; Manske, E. A Heterodyne Interferometer with Separated Beam Paths for High-Precision Displacement and Angular Measurements. Nanomanuf. Metrol. 2021, 4, 200–207. [Google Scholar] [CrossRef]
  5. Meggitt, B.T.; Hall, C.J.; Weir, K. An all fiber white light interferometric strain measurement system. Sens. Actuators A Phys. 2000, 79, 1–7. [Google Scholar] [CrossRef]
  6. Seat, H.C.; Ouisse, E.; Morteau, E.; Metivier, V. Vibration-displacement measurements based on a polarimetric extrinsic fiber Fabry–Perot interferometer. Meas. Sci. Technol. 2003, 14, 710–716. [Google Scholar] [CrossRef]
  7. Caldas, P.; Rego, G. Optical Fiber Interferometers Based on Arc-Induced Long Period Gratings at INESC TEC. Sensors 2021, 21, 7400. [Google Scholar] [CrossRef]
  8. Flores-Bravo, J.A.; Illarramendi, M.A.; Zubia, J.; Villatoro, J. Optical fiber interferometer for temperature-independent refractive index measuring over a broad range. Opt. Laser Technol. 2021, 139, 106977. [Google Scholar] [CrossRef]
  9. Malacara, D.; Servin, M.; Malacara, Z. Spatial Linear and Circular Carrier Analysis. In Interferogram Analysis for Optical Testing, 2nd ed.; CRC Press: Boca Raton, FL, USA; Taylor & Francis Group: Abingdon, VA, USA, 2005; pp. 426–430. [Google Scholar]
  10. Lee, B.H.; Kim, Y.H.; Park, K.S.; Eom, J.B.; Kim, M.J.; Rho, B.S.; Choi, H.Y. Interferometric Fiber Optic Sensors. Sensors 2012, 12, 2467–2486. [Google Scholar] [CrossRef] [Green Version]
  11. Yin, S.; Ruffin, P.B.; Yu, F.T.S. Fiber Optic Sensors, 2nd ed.; CRC Press: Boca Raton, FL, USA, 2008. [Google Scholar]
  12. Liang, H.; Wang, J.; Zhang, L.; Liu, J.; Wang, S. Review of Optical Fiber Sensors for Temperature, Salinity, and Pressure Sensing and Measurement in Seawater. Sensors 2022, 22, 5363. [Google Scholar] [CrossRef]
  13. Jackson, D.A.; Kersey, A.D.; Corke, M.; Jones, J.D.C. Pseudoheterodyne detection scheme for optical interferometers. Electron. Lett. 1982, 18, 1081–1083. [Google Scholar] [CrossRef]
  14. Cole, J.H.; Danver, B.A.; Bucaro, J.A. Synthetic-Heterodyne Interferometric Demodulation. IEEE Trans. Microw. Theory Tech. 1982, 30, 540–543. [Google Scholar] [CrossRef] [Green Version]
  15. Dandridge, A.; Tveten, A.; Giallorenzi, T. Homodyne demodulation scheme for fiber optic sensors using phase generated carrier. IEEE J. Quantum Electron. 1982, 18, 1647–1653. [Google Scholar] [CrossRef] [Green Version]
  16. Xilinx, Specifications Versal Architecture. 2022. Available online: https://www.xilinx.com/support/documentation/data_sheets/ds950-versal-overview.pdf (accessed on 10 January 2023).
  17. Monmasson, E.; Idkhajine, L.; Cirstea, M.N.; Bahri, I.; Tisan, A.; Naouar, M.W. FPGAs in industrial control applications. IEEE Trans. Industr. Inform. 2011, 7, 224–243. [Google Scholar] [CrossRef]
  18. Galeti, J.H.; Kitano, C.; Connelly, M.J. Improved synthetic-heterodyne Michelson interferometer vibrometer using phase and gain control feedback. Appl. Opt. 2015, 54, 10418–10424. [Google Scholar] [CrossRef] [Green Version]
  19. Connelly, M.J. Digital synthetic-heterodyne interferometric demodulation. J. Opt. 2002, 4, S400–S405. [Google Scholar] [CrossRef]
  20. Zhang, L.; Zhang, S.; Lufei, Z.; Fujii, Y. Nanometer-resolution displacement measurement system based on weak feedback effect of dual-frequency laser. Phys. Procedia 2009, 2, 19–26. [Google Scholar] [CrossRef] [Green Version]
  21. Vera-Salas, L.A.; Moreno-Tapia, S.V.; Garcia-Perez, A.; Romero-Troncoso, R.d.J.; Osornio-Rios, R.A.; Serroukh, I.; Cabal-Yepez, E. FPGA-Based Smart Sensor for Online Displacement Measurements Using a Heterodyne Interferometer. Sensors 2011, 11, 7710–7723. [Google Scholar] [CrossRef] [Green Version]
  22. Cui, K.; Li, S.; Ren, Z.; Zhu, R. A Highly Compact and Efficient Interrogation Controller Based on FPGA for Fiber-Optic Sensor Array Using Interferometric TDM. IEEE Sens. J. 2017, 17, 3490–3496. [Google Scholar] [CrossRef]
  23. Ehtesham, A.; Zabit, U.; Bernal, O.D.; Raja, G.; Bosch, T. Analysis and implementation of a direct phase unwrapping method for displacement measurement using self-mixing interferometry. IEEE Sens. J. 2017, 17, 7425–7432. [Google Scholar] [CrossRef] [Green Version]
  24. Yan, L.; Chen, Z.; Chen, B.; Xie, J.; Zhang, S.; Lou, Y.; Zhang, E. Precision PGC demodulation for homodyne interferometer modulated with a combined sinusoidal and triangular signal. Opt. Express 2018, 26, 4818–4831. [Google Scholar] [CrossRef]
  25. Elaskar, J.; Luda, M.A.; Tozzetti, L.; Codnia, J.; Oton, C.J. FPGA-Based High-Speed Optical Fiber Sensor Based on Multitone-Mixing Interferometry. IEEE Trans. Instrum. Meas. 2022, 71, 7003011. [Google Scholar] [CrossRef]
  26. STEMlab 125-14 Technical Specifications. Available online: https://redpitaya.com/stemlab-125-14/ (accessed on 10 January 2023).
  27. Mireles, J.; Sauceda, A.; Jiménez, A.; Ramos, M.; Gonzalez-Landaeta, R. Design and development of a MOEMS accelerometer using SOI technology. Micromechanics 2023, 14, 231. [Google Scholar] [CrossRef] [PubMed]
  28. Product Data: Vibration Exciter Type 4809 (BP-0231). Available online: https://www.bksv.com/-/media/literature/Product-Data/bp0231.ashx (accessed on 10 January 2023).
  29. Fischer, E.; Dalhoff, E.; Heim, S.; Hofbauer, U.; Tiziani, H.J. Absolute interferometric distance measurement using a FM-demodulation technique. Appl. Opt. 1995, 34, 5589–5594. [Google Scholar] [CrossRef] [PubMed]
  30. Vahid, F. Digital Design with RTL Design, Verilog and VHDL, 2nd ed.; John Wiley and Sons: Hoboken, NJ, USA, 2010; pp. 247–250. [Google Scholar]
  31. Chu, P.P. FPGA Prototyping by VHDL Examples: Xilinx MicroBlaze MCS SoC; John Wiley & Sons: Hoboken, NJ, USA, 2017; pp. 171–184. [Google Scholar]
  32. Potsangbam, J.; Kumar, M. Design and Implementation of Combined Pipelining and Parallel Processing Architecture for FIR and IIR filter Using VHDL. Int. J. VLSICS 2019, 10, 1–16. [Google Scholar] [CrossRef]
  33. Muanenda, Y.; Faralli, S.; Oton, C.J.; Cheng, C.; Yang, M.; Di Pasquale, F. Dynamic phase extraction in high-SNR DAS based on UWFBGs without phase unwrapping using scalable homodyne demodulation in direct detection. Opt. Express 2019, 27, 10644–10658. [Google Scholar] [CrossRef] [PubMed]
  34. Clement, J.; Maestre, H.; Torregrosa, G.; Fernández-Pousa, C.R. Incoherent Optical Frequency-Domain Reflectometry Based on Homodyne Electro-Optic Downconversion for Fiber-Optic Sensor Interrogation. Sensors 2019, 19, 2075. [Google Scholar] [CrossRef] [Green Version]
  35. Kumar, S.S.; Khansa, C.A.; Praveen, T.V.; Sreehari, C.V.; Santhanakrishnan, T.; Rajesh, R. Assessment of Dynamic Range in Interferometric Fiber Optic Hydrophones Based on Homodyne PGC Interrogator. IEEE Sens. J. 2020, 20, 13418–13425. [Google Scholar] [CrossRef]
  36. Bloom, Y.; Fields, I.; Maslennikov, A.; Rozenman, G.G. Quantum Cryptography—A Simplified Undergraduate Experiment and Simulation. Physics 2022, 4, 104–123. [Google Scholar] [CrossRef]
  37. Qiao, J.; Zhang, W.; Wang, Y.; Shao, Q.; Cai, J.; Zhao, H. Ultra-High SNR Demodulation Method for Optical Fiber Sensors Applied in Power Transformer Partial Discharge Detection. Sensors 2022, 22, 2828. [Google Scholar] [CrossRef]
  38. Liu, R.; Rozenman, G.G.; Kundu, N.K.; Chandra, D.; De, D. Towards the industrialisation of quantum key distribution in communication networks: A short survey. IET Quant. Comm. 2022, 3, 151–163. [Google Scholar] [CrossRef]
  39. Yuan, Y.; Li, J.; Zhu, Y.; Tian, S.; Zhu, Y.; Zhu, Z.; Zhang, X.; Jiang, F.; Dang, F.; Yang, J. A high-stable self-referenced PGC demodulation algorithm for fiber-optic interferometric sensor. Opt. Fiber Tech. 2023, 76, 103249. [Google Scholar] [CrossRef]
Figure 1. Optical setup showing the components of the Michelson interferometer, the vibration exciter, and the proof-mass MEMS [27].
Photonics 10 00258 g001
Figure 2. (a) Normalized measured interferometric signal, using the optical setup of Figure 1 and (b) its spectrum (FFT amplitude).
Photonics 10 00258 g002
Figure 3. Block diagram of the homodyne interferometric demodulation scheme, Equations (4) to (11), as implemented on the FPGA.
Photonics 10 00258 g003
Figure 4. The FPGA-based implementation architecture of the interrogation controller.
Photonics 10 00258 g004
Figure 5. LUT values of the oscillator  cos ω 0  implemented in VHDL.
Photonics 10 00258 g005
Figure 6. FFT (magnitude) response of the FIR low-pass filter designed in MATLAB®® and implemented in the FPGA.
Photonics 10 00258 g006
Figure 7. (a) Input interferogram for a modulated signal of 200 Hz. (b) Comparison between the modulated signal and the output signal of the embedded system, after demodulation process and scaled to  λ 4 π .
Photonics 10 00258 g007
Figure 8. Comparison between the modulated signal of  ω = 2 π × 100  and the output signal of the embedded system, after demodulation process and scaled to  λ 4 π .
Photonics 10 00258 g008
Figure 9. FFT (magnitude) comparison of embedded system output and shaker signal corresponding to Figure 7b and Figure 8. (a) For  ω = 2 π × 100 . (b) For  ω = 2 π × 200 .
Photonics 10 00258 g009
Table 1. Maximum and RMS errors for HD technique.
Amplitude of Vibration (nm)Target Frequency (Hz)RMS Error (nm)Max Error (nm)
92.52002.384.13
92.51002.473.94
Disclaimer/Publisher’s Note: The statements, opinions and data contained in all publications are solely those of the individual author(s) and contributor(s) and not of MDPI and/or the editor(s). MDPI and/or the editor(s) disclaim responsibility for any injury to people or property resulting from any ideas, methods, instructions or products referred to in the content.

