Abstract
Digital holographic microscopy has significant advantages over traditional 3D measurements. In order to obtain a reconstructed image of superior quality, the zero-order-term spectrum and the −1 term spectrum must be eliminated during the digital reconstruction. At the same time, digital holographic microscopy has changed from the traditional manual selection of the +1 term spectrum to the automatic selection of the +1 term spectrum. In the process of spatial filtering of the +1 term spectrum, the filtering window is crucial, and the shape of the filtering window and the robustness of the filtering window to noise will ultimately affect the reconstruction results. In this paper, we propose an automatic spatial filtering method that combines wavelet transform and mathematical morphology to automatically extract the +1 term spectrum. Compared with conventional methods, the reconstruction results are more accurate and robust to noise, and the experimental results verify the feasibility of the proposed method.
1. Introduction
Digital holographic microscopy (DHM) is an interferometric technique for quantitative phase imaging. In 1948, British physicist Gabor invented holography and took the first in-line hologram with the aim of improving the resolution of microscopes [1]. In 1999, Cuche proposed a DHM that used a digital imaging device to record a single hologram and recover the complex amplitude and phase information of the object [2,3]. Nowadays, DHM has been more fully developed and has become a promising tool for nonlabeled imaging. Compared with traditional microscopy systems, DHM is not only capable of displaying three-dimensional information of objects, but also widely used in microelectromechanical system (MEMS) measurement [4,5], biological cell monitoring [6,7,8], microscopic particle detection [9,10], metrology [11,12], and other fields because of its significant advantages of efficiency and nondestructiveness compared to other traditional three-dimensional measurements.
DHM is divided into in-line holographic microscopy and off-axis holographic microscopy [13,14], whose reconstruction plane contains three parts: real image (+1 term), direct component (DC) image (zero-order term), and conjugate image (−1 term). In order to obtain a reconstructed image of superior quality, the interference of the DC and conjugate images with the real image is eliminated as much as possible in the digital reconstruction process. Common methods to eliminate DC and conjugate images are phase-shift techniques and spatial domain filtering techniques. Phase-shifting techniques have been applied mainly to in-line digital holography. Traditional phase-shift techniques require multiple exposures, and this technique is not suitable for real-time dynamic analysis [15]. Thus, DHM typically employs off-axis optical structures. The simple structure of off-axis digital holography is not only suitable for real-time dynamical analysis, but also has a strong spatial resolution.
To enable real-time analysis, it is essential to find the distribution of the +1 term spectrum automatically and accurately. The current methods for implementing spatial filtering of the +1 term spectrum are divided into two categories, namely, artificial spatial filtering and automatic spatial filtering [16,17]. Although manual spatial filtering can recover object information accurately, it requires subjective judgment and is therefore time-consuming and limited in practical applications. As a result, automatic spatial filtering is becoming increasingly popular. In automatic spatial filtering, it is further divided into setting a regular spatial filtering window and an irregular spatial filtering window. Among the methods for setting regular spatial filtering windows, Xu et al. proposed a spatial filtering method based on reference wave irradiation holograms, which is able to directly obtain object images without zero-order and conjugate terms by using reference wave irradiation and low-pass filters for convolution operations [18]. Matrecano et al. proposed a Butterworth filter that takes into account background noise in the hologram for automatic filtering [19]. Zhi et al. proposed a cross-filtering method, where the cross-filtering consists of two cross-elliptical filters to obtain most of the high-frequency information according to the distribution of the sample spectrum [20]. The regular filtering window described above is set according to subjective judgment and is therefore not adaptive. In contrast, in the irregular spatial filtering window approach, the filtering window is mainly designed to be automatically generated based on the distributional properties of the +1 term spectrum itself. Li et al. used an adaptive filtering method based on region growth to extract the +1 term spectrum [21]. The drawbacks of this approach are the choice of initial values and the sensitivity to noise. Weng et al. analyzed the spectrum histogram to obtain parameter thresholds and then provided a spatial filtering window. The proposed method can perform effective segmentation only when the difference between the target and background intensities is large [22]. He et al. used an iterative threshold approach to extract the +1 period spectrum [23]. The step size of the iteration threshold was set to 1% of the global threshold level. However, this method may affect the accuracy and efficiency of the amplitude spectrum of the hologram binarization, and this method is also greatly affected by noise.
These methods present difficulties in designing suitable filtering windows. To accurately obtain the spectrum of a real image, the filtering window design must adequately take into account the size and distribution of the spectrum of the real image. Theoretically, this filtering window contains only all the spectrum information of the +1 term, while in practice, due to the problem of blurred boundaries of the +1 term spectrum, in the automatic filtering method proposed above, it is more difficult to locate the boundary of the spectrum, the automatically generated filtering window is wrong, and there is loss of object phase information in the reconstruction. With noise, it is more difficult to locate the boundary of the spectrum of the +1 term, and the loss of phase information of the reconstructed object is more severe.
To address the problems of low phase accuracy and poor noise immunity of object reconstruction by automatic spatial filtering methods, we propose a combination of wavelet-transform modal maxima and mathematical morphology. The reconstruction results of this method are relatively accurate, and the reconstruction phase of this method is less affected by noise, while other automatic spatial filtering methods are greatly affected by noise and the reconstruction results appear to be severely lacking in the object phase.
Section 2 presents the theory of spatial filtering in off-axis digital holography. Section 3 presents the theoretical analysis of the proposed method. Section 4 details the automatic filtering procedure of the proposed method and demonstrates the capabilities of the method, and Section 5 presents the conclusions.
2. Spatial Filtering in Off-Axis Digital Holography
In off-axis DHM, interference between the reference and object beams can be obtained with a charge-coupled device (CCD) or a complementary metal-oxide-semiconductor (CMOS) camera, and a microscope objective is used to magnify the object and produce a magnified image of the object, thereby increasing the lateral resolution of the system. The intensity of a hologram can be expressed as
where O and R are the objective and the reference wave functions, respectively. The first two terms are the zero-order-term spectrum. OR* and O*R are the interference terms, which represent the imaginary and real images, respectively, and * denotes the conjugate.
The reference light is a plane wave, denoted by
where k denotes the wave number, k = 2π/λ(x, y) are the coordinates of the holographic plane, R0 is the amplitude of the reference wave, and α and β are the angles of incidence along the x and y axis, respectively. The incident angles α and β allow the separation of the zero-order term and the two conjugate terms in the frequency domain.
Object wave carries information about the object, denoted by
Performing the Fourier transform on the hologram, the spectrum of the hologram can be written as
where FT{} denotes the Fourier transform, and fx and fy are the spatial frequencies of x and y, respectively. G is the hologram spectrum, G0 and G1 are the zero-order-term spectra, which form a bright circular spot at the center of the hologram spectrum, and G2 and G3 are the +1 and −1 term spectra, respectively, representing the imaginary and real images. By using appropriate spatial filtering, the +1 term spectrum, G3, can be extracted. Then, an inverse Fourier transform is applied to the extracted spectrum to obtain a complex function that can be used to reconstruct the image. Reconstruction algorithms include the Fresnel transform method, the convolution method, and the angular spectrum method [24]. Moreover, based on the characteristics of the angular spectrum method, the G3 spectrum can be directly used to reconstruct the image, as denoted by
where FT−1{} denotes the Fourier inverse transform, (xi, yi) denotes the coordinates of the reconstructed surface, and z’ is the reconstruction distance, which is equal to the distance between the hologram and the image plane in DHM. In the reconstructed wave, the quadratic phase factor introduced by the modem leads to distortion of the reconstructed image. Here, a surface-fitting method (least-squares fitting [25], Zernike polynomials fitting [26], principal component analysis [27], etc.) is used to eliminate this distortion and, thus, obtain high-quality reconstructed images. The amplitude and phase distribution of the reconstructed image is described by the following equation.
There is a 2π ambiguity in the phase of the equation, which can be removed by least-squares phase unwrapping using a two-dimensional (2-D) discrete cosine transform [28].
Appropriate spatial filtering is necessary to obtain an accurate +1 term spectrum and, hence, to reconstruct images of superior quality. Adaptive spatial filtering methods are a major factor in real-time dynamic analysis. How adaptively and accurately the +1 term spectrum is obtained is therefore crucial for each hologram, as the distribution of the spectrum varies from object to object under test.
3. Theory Analysis of Adaptive Spatial Filtering
3.1. Wavelet-Transform Modal Maxima Method
As representative of multiscale theory, wavelet transforms are widely used in image processing due to the completeness of their mathematical description. In image edge detection, it can be well combined with traditional image-edge detection methods. Wavelet transforms have excellent performance in both time and frequency domains, and wavelet decomposition and reconstruction can remove redundant information from the signal.
The principle of the modal maxima method for the wavelet transform is as follows.
Let θ(x, y) be a 2-D smoothing function satisfying the following conditions.
Then, θ(x, y) has an excellent localization property, and the partial derivatives in the x and y directions for θ(x, y), respectively, are
where φx(x, y) and φy(x, y) are 2-D wavelet functions. For any function of f(x, y)∈L2(R), the wavelet transform defined by the 2-D wavelet functions φx(x, y) and φy(x, y) is defined as
Thus, the wavelet transform of the hologram amplitude spectrum is defined as
S is the hologram amplitude spectrum, and the gradient vector of (S × θ)(kx, ky) is
From the formula, we can see that the two components of the wavelet transform are proportional to the two components in the gradient ▽(S × φ)(kx, ky), so the two components of the wavelet transform are proportional to the first-order derivatives of (S × θ)(kx, ky). The extreme value point of the S(kx, ky) wavelet transform is the mutation point of (S × θ)(kx, ky). The mode of the S(kx, ky) wavelet transform is
The amplitude angle (i.e., the direction of the gradient vector) is
The direction of the gradient vector is the direction of the local modal maximum point, and finding the local mode maximum point leads to the spectrum edge points.
3.2. Basic Operations in Mathematical Morphology
Mathematical morphology (MM) is a nonlinear theory of image processing that describes the properties and features of images analyzed from a set-theoretic perspective [29,30] and is a contemporary approach applied in the fields of image processing and pattern recognition. The basic idea is to use the structural elements of a certain morphology to measure and extract the corresponding shapes in an image for image analysis and recognition purposes. Morphological methods are able to retain the main information of an image and remove irrelevant shapes such as burrs. Morphological methods are real-time, localized, and easy to implement and, thus, have a wide range of applications in image segmentation, region filling, and shape recognition. The basic operations of MM include erosion, dilation, opening, and closing. Letting f(x, y) be the input image, g(x, y) be the structural element, and the domain of definition of f(x, y) and g(x, y) be Df(x, y) and Dg(x, y), respectively, then the four operations are defined as
Erosion operation.
Dilation operation.
Opening operation.
Closing operation.
The structural elements of the MM are actually grayscale within a tiny window, and their selection directly affects the final result. For the general window size, 3 × 3, 5 × 5, 7 × 7 are used, among which the 3 × 3 window has the fastest calculation speed and the finest edge extraction; thus, 3 × 3 is chosen as the structure element in this paper. As shown in Figure 1.
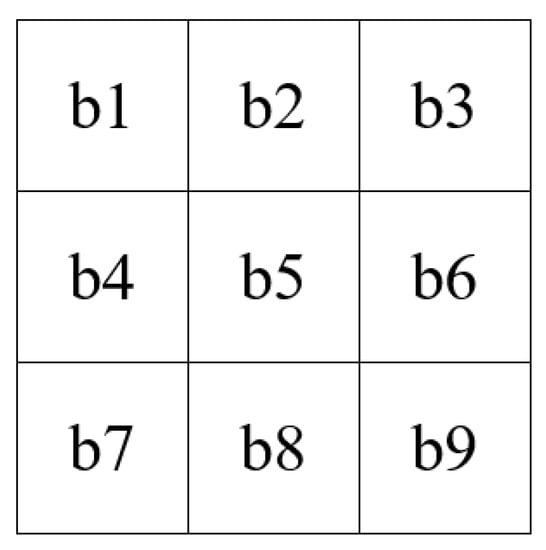
Figure 1.
Structural element b.
4. Experiment Verification
In this paper, we propose an automatic spatial filtering method that combines wavelet-transform modal maxima and MM in the following steps.
- Step 1: Treating the spectrum as a grayscale image, the amplitude spectrum of the hologram is wavelet-decomposed to obtain a low-frequency, approximate subimage and a high-frequency, detailed subimage.
- Step 2: Edge detection is performed using grayscale morphology on low-frequency, approximated images containing a large amount of amplitude spectrum information to obtain a binary image that approximates the shape of the object spectrum as well as the edge information of the low-frequency subimage.
- Step 3: The high-frequency, detailed subimage is detected using the wavelet-transform nonmaximally suppressed method, and the resulting binary image contains the edge information of the high-frequency subimage.
- Step 4: Fusion of low-frequency amplitude spectrum edges with high-frequency amplitude spectrum edges, which is simply image superimposition, to obtain a complete and more informative amplitude spectral edge.
4.1. Process of Adaptive Spatial Filtering
Figure 2a shows the captured image plane hologram, and the spectrum of the hologram is obtained by the Fourier transform of Figure 2a, and then the spectrum is transformed into the amplitude spectrum, as shown in Figure 2b. This operation can avoid the poor segmentation results caused by the inconspicuous edge information of the object’s optical spectrum. It is clear from the figure that the hologram spectrum is divided into three regions, namely, zero-order background information, +1 term object information, and −1 term conjugate object information. In addition, it can be seen that the amplitude spectrum makes the object’s light information more obvious, which is more beneficial for the subsequent edge detection step.
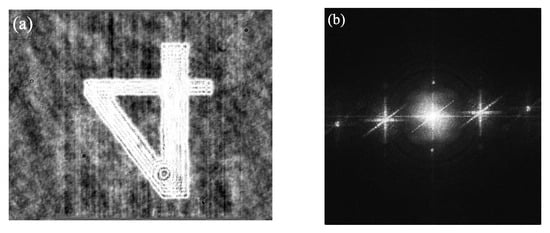
Figure 2.
(a) Hologram; (b) hologram amplitude spectrum.
Wavelet decomposition is performed on the amplitude spectrum images to obtain the high- and low-frequency subimages. In this paper, we choose sym4 as the wavelet basis function, which belongs to the Symlets wavelet family, has a large number of symmetries, and is also characterized by excellent regularity. The sym4 wavelet has a support length of seven, which is computationally less, and its decomposition results are shown in Figure 3. The number of decomposition layers is chosen according to the actual situation, which is one to two layers in general, and in this paper, the number of decomposition layers is chosen to be one because the image will be distorted when the decomposition reaches the second layer. Since the amplitude spectrum data can be viewed as a 2-D grayscale signal, it is sufficient to use grayscale morphology, and, in this paper, we use a morphological gradient-based edge detection method. The morphological gradient is defined as follows.
where f is the signal to be processed and g is the structure element. As the amplitude of the signal changes, so does the gradient, and the gradient of the signal f is at a maximum when the amplitude changes to the middle of the maxima and minima. Thus, if a suitable threshold is chosen, the edges of the signal can be found, and the spectrum information of the object can be separated from the background.
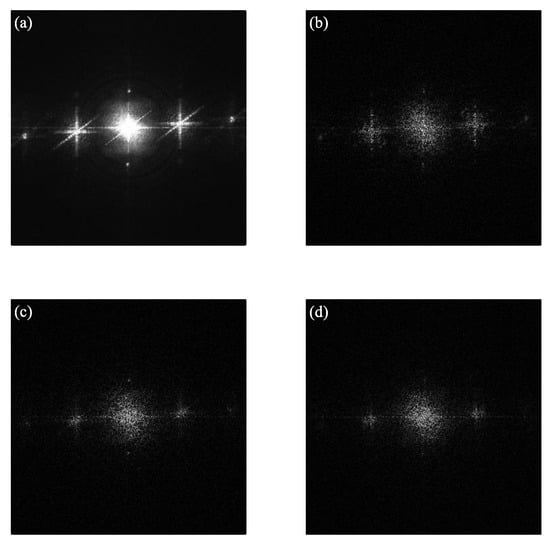
Figure 3.
(a) Approximation factor; (b) horizontal detail component; (c) vertical detail component; and (d) diagonal detail component.
Figure 4a shows the gray histogram of the low-frequency component after morphological operations. The overall shape of this image histogram is that of a single peak, that is, there is only one main peak. The reason for this is that the object region has a small area relative to the background region. For such images, traditional methods such as the maximum between-class variance (Otsu method) do not find a suitable threshold [31], and the Otsu method is suitable for gray histograms that show a double-peaked shape. The histogram inflection point, which is the value of the dividing point between the low- and high-gradient regions of the single-peaked histogram, is found and used as a threshold. The method is simple and fast to process. After threshold, the binary image of the low-frequency component is shown in Figure 4b, from which it can be seen that the low-frequency component maintains the shape of the original spectrum compared to the original spectrum.
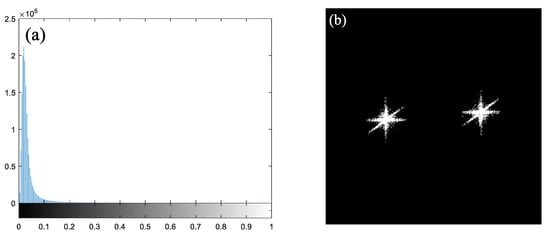
Figure 4.
(a) Gray histogram of the low-frequency component; (b) binary image of the low-frequency component.
A nonmaximum suppression method is applied to the high-frequency subimages to remove the pseudoedge point information and obtain candidate edge points, whose histograms also show the shape of a single-peaked distribution (as shown in Figure 5a). The same method of thresholding histogram inflection points can also be used, and the result obtained is shown in Figure 5b.
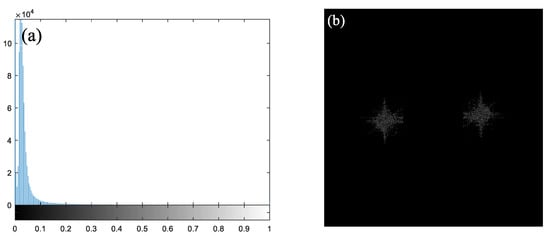
Figure 5.
(a) Gray histogram of the high-frequency component; (b) binary image of the high-frequency component.
The low-frequency component binary image was combined with the high-frequency component binary image, as shown in Figure 6a. Preprocessing is then applied. In this paper, morphological preprocessing is used, and it can be seen from the figure that there are two large regions, although there are some isolated points around the regions. In order to connect the isolated points into as many regions as possible while maintaining the shape of the regions, morphological open operators are used. The 1 × 3 morphological operator is used here, with four operations at 0°, 45°, 90°, and 135°, respectively. The morphological open operation is conducted to complete the expansion operation first and then the corrosion operation. Then, the four open operations can be decomposed into four expansion operations first, then four corrosion operations (which can also achieve the effect of doing four open operations), and then can seek the area of the region to delete the −1 term region to obtain the binary mask that is the filtering window, as shown in Figure 6b. The +1-term spectrum is filtered, and the spectrum is centered by finding the position of the maximum value of the amplitude spectrum. The final result is shown in Figure 6c.
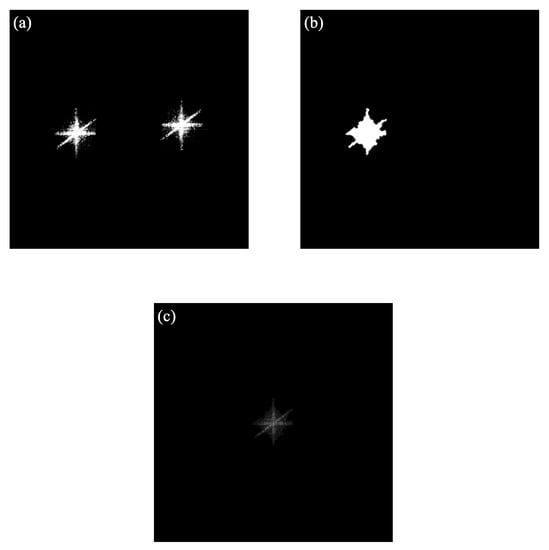
Figure 6.
(a) Merging; (b) binary mask; (c) centering after filtering.
4.2. Result and Discussion
In this paper, the angular spectrum reconstruction method is used, and the image plane hologram is used so that the reconstruction distance is zero. The reconstruction results are shown in Figure 7.
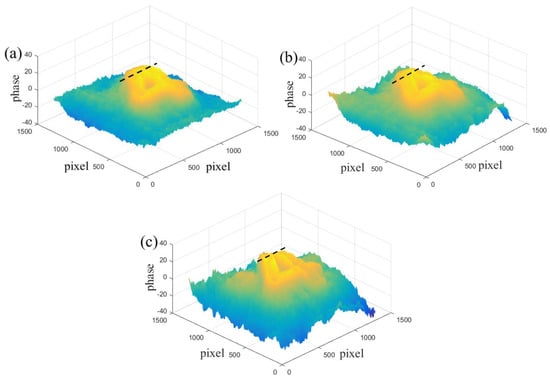
Figure 7.
(a) Manual spatial filtering method; (b) method of this paper; (c) region−growing filtering method.
Figure 7 shows the phase maps reconstructed by the conventional manual spatial filtering method, the proposed method, and the region-growing method, respectively. Traditional manual filtering methods, by manually adjusting the position and size of the filtering window, in combination with denoising algorithms, can eventually recover the true phase information of the object. Figure 7a shows that the reconstruction result of the manual filtering method is better, and the height information of the object is obvious. Figure 7b shows that the reconstructed object-height information is obvious, and the phase distribution is uniform, the phase information of the object edges is obvious, and the internal information of the object is not severely lost. Figure 7c shows the reconstruction results of the region-growing method. It is obvious that, because the region-growing method needs to determine the location and threshold of the seed point (i.e., the initial growth pixel point), the threshold is commonly the difference between the maximum point of the +1 term spectrum intensity and the background intensity, and when there is noise in the environment, the spectrum information of the noise will be distributed around the +1 term spectrum, making the edges of the +1 term spectrum blurred, which not only affects the determination of the threshold but also affects the area growth process, and, finally, leads to a serious loss of phase information of the reconstructed object. As a result, the region-growing method is sensitive to noise.
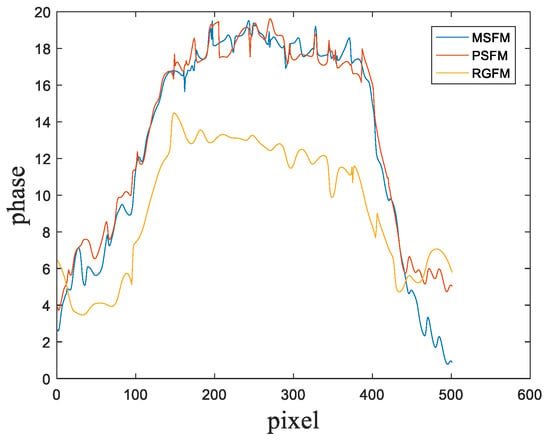
To evaluate these filtering methods more intuitively, we select the one-dimensional (1-D) phase profile at the black dashed line in Figure 7. The phase profile at this location clearly reflects the goodness of the reconstructed phase, and the results are shown in Figure 8. The blue, red, and yellow curves are the profiles of the traditional manual filtering method, the proposed method, and the region-growing method, respectively. From Figure 8, we can see that the phase information is more severely missing in the reconstruction of the region-growing method, which demonstrates the limitations of this method. The reconstruction results in this paper are similar to those of the manual filtering method, which indicates that the proposed method is able to extract the +1 term spectrum well and is feasible.
Digital holography is now widely used in microscopy, but noise remains a key factor in the quality of the reproduced images. Although off-axis digital holography can separate the spectrum, the distribution of noise in the spectrum can affect the accuracy of the spectrum segmentation, which degrades the quality of the reproduced image. The noise of digital holography is mainly speckle noise, because the rough surface of the object can be regarded as being composed of irregular surface elements. When the laser passes through the surface of the object, each surface can be regarded as a diffraction unit, and the whole surface consists of a large number of diffraction units. Due to the disorder of the surface elements, the spatial interference will change irregularly, resulting in the random distribution of light intensity and the formation of granular laser speckle. The laser speckle is irregular in the spatial domain, and the speckle spectrum is also randomly distributed in the frequency domain, so the noise spectrum will be distributed around the +1 term spectrum, which increases the difficulty of detecting the +1 term spectrum edges.
Speckle noise is a type of multiplicative noise. To investigate the effect of noise on the segmentation results, we add random multiplicative noise with a uniform distribution with a mean of 0 and variances of 0.02 and 0.04 to the holograms.
Figure 9 shows the spectrum with noise and the corresponding filtering results obtained with the proposed method. Figure 9b corresponds to Figure 9a, and Figure 9d corresponds to Figure 9c. We can see from the figure that the edge of the objective spectrum becomes more and more blurred as the noise increases, while the method proposed in this paper is less affected by the noise, and the results are similar to those in Figure 6c.

Figure 9.
Hologram amplitude spectrums and filtering results with speckle noise with the method of this paper: (a) speckle noise with a mean of 0 and variance of 0.02; (b) centering after filtering; (c) speckle noise with a mean of 0 and variance of0.04; and (d) centering after filtering.
For convenience, the conventional manual spatial filtering is abbreviated as MSFM, and the proposed method is abbreviated as PSFM in this paper. To verify the noise immunity and effectiveness of the method in this paper, it is compared with the region-growing method (abbreviated as RGFM) and iterative-thresholding method (abbreviated as ITFM) in the presence of noise, as shown in Figure 10.
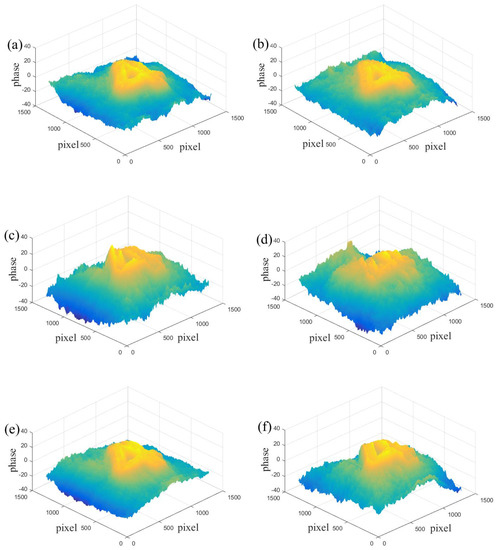
Figure 10.
Reconstructions of the phase with different spatial filtering methods: (a) PSFM, speckle noise with a mean 0 and variance of 0.02; (b) PSFM, speckle noise with a mean of 0 and variance of 0.04; (c) RGFM, speckle noise with a mean of 0 and variance of 0.02; (d) RGFM, speckle noise with a mean of 0 and variance of 0.04; (e) ITFM, speckle noise with a mean of 0 and variance of 0.02; (f) PSFM, speckle noise with a mean of 0 and variance of 0.04.
Figure 10a,b shows the phase diagrams reconstructed by the method proposed in this paper, and when the noise increases, the results do not differ much; thus, the method has a certain degree of noise resistance and effectiveness. Figure 10c,d shows the reconstructed results of the region-growth method, and it can be seen that the reconstructed results have phase loss when the noise is small, and as the noise increases, the reconstructed results of the method show serious deformation, the phase loss is more serious, and the shape of the object cannot be seen; therefore, the segmentation accuracy of the region-growth method is affected by the noise, and the robustness is poor. Figure 10e,f shows the reconstruction results of the iterative-thresholding method, and the reconstruction results are better when the noise is smaller, and when the noise increases, the reconstruction results have phase loss; therefore, this method is also affected by the noise. To evaluate these filtering methods more intuitively, we select the 1-D phase profile at the same position (black dashed line) in Figure 7 and compare it with the traditional manual filtering method, as shown in Figure 11.
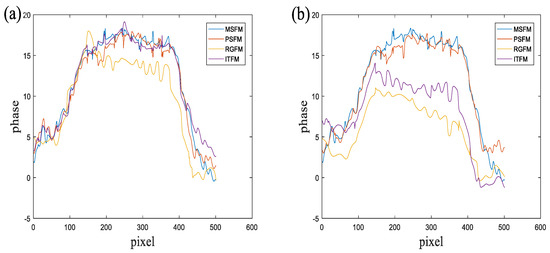
Figure 11.
Profiles of different spatial filtering methods under noise: (a) speckle noise with a mean of 0 and variance of 0.02; (b) Speckle noise with a mean of 0 and variance of 0.04.
To evaluate these filtering methods more intuitively, we select the 1-D phase profile at the same position (black dashed line) in Figure 7 and compare it with the traditional manual filtering method, as shown in Figure 11. It can be seen that the phases of the objects reconstructed by RGFM and ITFM are greatly affected by noise. In contrast, the phase reconstructed by the proposed method does not differ much from the phase reconstructed by the manual filtering method; hence, the proposed method is more robust to noise.
Table 1 shows the root-mean-square error (MSE) of the reconstructed phases for these three automatic spatial filtering methods and the manual filtering method. As can be seen from Table 1, the proposed method has the smallest MSE, which indicates that the reconstruction results are more accurate. When multiplicative noise is added and the noise increases, the MSE of the proposed method does not change much, which indicates that the proposed method is less affected by noise and has stronger noise rejection. The phase reconstruction of the RGFM is very poor. ITFM is also affected by noise, and its reconstruction is accurate only at low noise.

Table 1.
MSE of the reconstructed phases for automatic spatial filtering methods.
5. Conclusions
We have presented a joint wavelet-transform mode maximization and morphology method for the automatic extraction of the +1 term order spectrum in off-axis digital holography. The hologram amplitude spectrum is treated as a grayscale image, which is then decomposed into a low-frequency approximation subimage and a high-frequency detail subimage, and the filtering window is obtained using wavelet mode maximization and MM, respectively. Experimental results show that the reconstructed phase information is uniformly distributed, the height information is clearly visible, the object-light information is lost less, and the reconstruction results are more accurate. Moreover, the proposed method is less affected by noise. The proposed method is useful for improving the accuracy of digital holography in the fields of microelectromechanical systems measurement, biomedicine, and microscopic particle tracking.
Author Contributions
Conceptualization, H.X.; methodology, H.X.; writing—original draft preparation, H.X.; resources, D.Z.; writing—review and editing, H.X.; funding acquisition, D.Z. All authors have read and agreed to the published version of the manuscript.
Funding
The work was supported in part by the National Natural Science Foundation of China (62275160).
Institutional Review Board Statement
Not applicable.
Informed Consent Statement
Not applicable.
Data Availability Statement
The raw/processed data required to reproduce these findings cannot be shared at this time as the data also form part of an ongoing study.
Conflicts of Interest
The authors declare no conflict of interest.
References
- Gabor, D. A new microscopic principle. Nature 1948, 161, 777. [Google Scholar] [CrossRef] [PubMed]
- Cuche, E.; Bevilacqua, F.; Depeursinge, C. Digital holography for quantitative phase-contrast imaging. Opt. Lett. 1999, 24, 291–293. [Google Scholar] [CrossRef] [PubMed]
- Cuche, E.; Marquet, P.; Depeursinge, C. Simultaneous amplitude-contrast and quantitative phase-contrast microscopy by numerical reconstruction of Fresnel off-axis holograms. Appl. Opt. 1999, 38, 6994–7001. [Google Scholar] [CrossRef] [PubMed]
- León-Rodríguez, M.; Rodríguez-Vera, R.; Rayas, J.A.; Calixto, S. Digital holographic microscopy through a Mirau interferometric objective. Opt. Lasers Eng. 2013, 51, 240–245. [Google Scholar] [CrossRef]
- Ferraro, P.; Coppola, G.; De Nicola, S.; Finizio, A.; Pierattini, G. Digital holographic microscope with automatic focus tracking by detection sample displacement in real time. Opt. Lett. 2003, 28, 1257–1259. [Google Scholar] [CrossRef]
- Ortega, N.P.; Montes, M.H.; Mendoza-Santoyo, F.; Flores, J. Measurement of morphology-thickness andrefractive index in Melanoma A375 cell lineusing digital holographic microscopy. Appl. Opt. 2021, 60, 815–822. [Google Scholar] [CrossRef]
- Park, H.S.; Rinehart, M.; Walzer, K.A.; Chi, J.T.A.; Wax, A. Automated Detection of P. falciparum Using Machine Learning Algorithms with Quantitative Phase Images of Unstained Cells. PLoS ONE 2016, 11, 19. [Google Scholar] [CrossRef]
- Muschol, M.; Wenders, C.; Wennemuth, G. Four-dimensional analysis by high-speed holographic imaging reveals a chiral memory of sperm flagella. PLoS ONE 2018, 13, 20. [Google Scholar] [CrossRef]
- Cacace, T.; Paturzo, M.; Memmolo, P.; Vassalli, M.; Ferraro, P.; Fraldi, M.; Mensitieri, G. Digital holography as 3D tracking tool for assessing acoustophoretic particle manipulation. Opt. Express 2017, 25, 17746–17752. [Google Scholar] [CrossRef]
- Merola, F.; Miccio, L.; Paturzo, M.; Finizio, A.; Grilli, S.; Ferraro, P. Driving and analysis of micro-objects by digital holographic microscope in microfluidics. Opt. Lett. 2011, 36, 3079–3081. [Google Scholar] [CrossRef] [PubMed]
- Montfort, F.; Emery, Y.; Solanas, E.; Cuche, E.; Aspert, N.; Marquet, P.; Joris, C.; Kuhn, J.; Depeursing, C. Surface roughness parameters measurements by Digital Holographic Microscopy (DHM). In Proceedings of the 3rd International Symposium on Precision Mechanical Measurements, Urumqi, China, 2–6 August 2006. [Google Scholar]
- Senegond, N.; Certon, D.; Bernard, J.E.; Teston, F. Characterization of cMUT by Dynamic Holography Microscopy. In Proceedings of the 2009 IEEE International Ultrasonics Symposium, Rome, Italy, 20–23 September 2009; pp. 2205–2208. [Google Scholar]
- Nomura, T. Phase imaging in-line digital holography with random phase modulation. In Proceedings of the Conference on Three-Dimensional Imaging, Visualization, and Display, Baltimore, MD, USA, 15–16 April 2019; Spie-Int Soc Optical Engineering: Baltimore, MD, USA, 2019. [Google Scholar]
- Bai, H.Y.; Shan, M.G.; Zhong, Z.; Guo, L.L.; Zhang, Y.B.; Liu, B. Fast and accurate carrier and aberration remzerooval in phase retrieval for off-axis holography. Optik 2018, 162, 95–101. [Google Scholar] [CrossRef]
- Kim, D.; You, J.W.; Kim, S. White light on-axis digital holographic microscopy based on spectral phase shifting. Opt. Express 2006, 14, 229–234. [Google Scholar] [CrossRef]
- Mann, C.J.; Yu, L.; Lo, C.M.; Kim, M.K. High-resolution quantitative phase-contrast microscopy by digital holography. Opt. Express 2005, 13, 8693–8698. [Google Scholar] [CrossRef]
- Colomb, T.; Kühn, J.; Charrière, F.; Depeursinge, C.; Aspert, N. Total aberrations compensation in digital holographic microscopy with a reference conjugated hologram. Opt. Express 2006, 14, 4300. [Google Scholar] [CrossRef] [PubMed]
- Xu, Y.; Qiu, P.Z. Off-Axis Digital Holographic Reconstruction Based on the Spatial Filtering of the Hologram Illuminated with the Reference Wave. Adv. Mater. Res. 2013, 760–762, 502–506. [Google Scholar] [CrossRef]
- Matrecano, M.; Memmolo, P.; Miccio, L.; Persano, A.; Quaranta, F.; Siciliano, P.; Ferraro, P. Improving holographic reconstruction by automatic Butterworth filtering for microelectromechanical systems characterization. Appl. Opt. 2015, 54, 3428–3432. [Google Scholar] [CrossRef]
- Zhong, Z.; Zhao, H.J.; Cao, L.C.; Shan, M.G.; Liu, B.; Lu, W.L.; Xie, H. Automatic cross filtering for off-axis digital holographic microscopy. Results Phys. 2020, 16, 6. [Google Scholar] [CrossRef]
- Li, J.; Wang, Z.; Gao, J.; Liu, Y.; Huang, J. Adaptive spatial filtering based on region growing for automatic analysis in digital holographic microscopy. Opt. Eng. 2014, 54, 031103. [Google Scholar] [CrossRef]
- Weng, J.; Li, H.; Zhang, Z.; Zhong, J. Design of adaptive spatial filter at uniform standard for automatic analysis of digital holographic microscopy. Optik 2014, 125, 2633–2637. [Google Scholar] [CrossRef]
- He, X.; Nguyen, C.V.; Pratap, M.; Zheng, Y.; Wang, Y.; Nisbet, D.R.; Williams, R.J.; Rug, M.; Maier, A.G.; Lee, W.M. Automated Fourier space region-recognition filtering for off-axis digital holographic microscopy. Biomed. Opt. Express 2016, 7, 3111–3123. [Google Scholar] [CrossRef]
- Zhang, Y.Y.; Wu, J.C.; Hao, R.; Jin, S.Z.; Cao, L.C. Digital holographic microscopy for red blood cell imaging. Acta Phys. Sin. 2020, 69, 16. [Google Scholar] [CrossRef]
- Gao, C.; Wen, Y.F.; Cheng, H.B.; Wang, Y.W. Automatic Phase-Distortion Compensation Algorithm in Digital Holography. Acta Opt. Sin. 2018, 38, 7. [Google Scholar]
- Miccio, L.; Alfieri, D.; Grilli, S.; Ferraro, P.; Finizio, A.; De Petrocellis, L.; Nicola, S.D. Direct full compensation of the aberrations in quantitative phase microscopy of thin objects by a single digital hologram. Appl. Phys. Lett. 2007, 90, 3. [Google Scholar] [CrossRef]
- Zuo, C.; Chen, Q.; Qu, W.; Asundi, A. Phase aberration compensation in digital holographic microscopy based on principal component analysis. Opt. Lett. 2013, 38, 1724–1726. [Google Scholar] [CrossRef]
- Ghiglia, D.C.; Romero, L.A. Robust two-dimensional weighted and unweighted phase unwrapping that uses fast transforms and iterative methods. J. Opt. Soc. Am. A 1994, 11, 107–117. [Google Scholar] [CrossRef]
- Su, T.C.; Yang, M.D. Morphological segmentation based on edge detection-II for automatic concrete crack measurement. Comput. Concr. 2018, 21, 727–739. [Google Scholar]
- Chen, J. Image Edge Detection Algorithm of Machined Parts Based on Mathematical Morphology. In Proceedings of the 2021 IEEE International Conference on Industrial Application of Artificial Intelligence (IAAI), Harbin, China, 24–26 December 2021; pp. 275–280. [Google Scholar]
- Otsu, N. A threshold selection method from gray-level histograms. IEEE Trans. Syst. Man Cybern. 1979, 9, 62–66. [Google Scholar] [CrossRef]
Disclaimer/Publisher’s Note: The statements, opinions and data contained in all publications are solely those of the individual author(s) and contributor(s) and not of MDPI and/or the editor(s). MDPI and/or the editor(s) disclaim responsibility for any injury to people or property resulting from any ideas, methods, instructions or products referred to in the content. |
© 2023 by the authors. Licensee MDPI, Basel, Switzerland. This article is an open access article distributed under the terms and conditions of the Creative Commons Attribution (CC BY) license (https://creativecommons.org/licenses/by/4.0/).