1. Introduction
Currently, space gravitational wave detection programs mainly include China’s “Taiji” program [
1], the ‘Tianqin’ program [
2], and the European Space Agency’s LISA program [
3]. In space gravitational wave detection missions, a type of oblique-placement steering mirror needs to achieve point-ahead angle pointing. To verify that the steady-state background noise originating from the steering mirror does not drown out the gravitational wave signal, a ground-based laser interferometer is essential for evaluating its optical path difference performance. This requires the laser interferometer to achieve a sensitivity level of
in the frequency range of 1 mHz to 1 Hz. The relevant research on the optical path difference caused by steering mirrors is relatively scarce, both domestically and internationally. Notably, the Albert Einstein Institute in Hannover has conducted relevant studies for the LISA project’s steering mirror, called the Point-Ahead Angle Mechanism (PAAM). They employed a triangular resonant cavity and achieved a measurement precision of
in the corresponding frequency range [
4,
5]. Among the array of laser interferometry technologies, the heterodyne laser interferometer stands out due to its advantages, including high sensitivity and fast detection speed, making it a preferred choice for high-precision displacement measurement.
Research on heterodyne laser interferometers has always been a hot topic. The main research contents of heterodyne interferometers with different design configurations are also different. To avoid interference caused by excessively long interference arms, interferometers are generally designed to be relatively compact. For example, they can take the form of a heterodyne interferometer in a single, small, two-dimensional cubic optical unit [
6]. Another approach involves abandoning spatial light and using optical fibers to design interferometers for studying repeated positioning accuracy [
7]. A heterodyne interferometer designed using the grating diffraction effect and high-angular-sensitivity total internal reflection was used to detect small wavelength shifts [
8]. To study the linearity and phase noise contributions of the interference phase readout, the interferometer was designed in a hexagonal quasi-monolithic optical bench style [
9]. Aluminum optical benches are the most common style of laboratory interferometers due to their relative simplicity. They have been used to study methods of measuring amplitude enhancement [
10], measuring piezoelectric-drive displacement accuracy [
11], measuring straightness and displacement error simultaneously [
12], laser linewidth measurement [
13], and straightness measurement of linear motion platforms [
14]. Studying the noise in each part of the interferometer and eliminating it through data post-processing can greatly improve the measurement accuracy of the interferometer. Laser frequency noise [
15,
16], laser Relative Intensity Noise (RIN) [
17,
18], temperature fluctuations [
16,
19], electronic readout noise [
19], optical components [
15], geometric TTL noise [
20], etc., have an impact on the measurement accuracy of the interferometer. Here, laser frequency noise is reflected in the optical path through the differential of the interferometer arms. After the above-mentioned noise is identified in principle [
6] and its model is estimated [
14], some non-periodic errors [
12] and non-linear errors [
16] can be eliminated through data post-processing. However, there is currently no research on measuring the optical path difference (OPD) caused by a steering mirror using laser heterodyne interferometry.
This paper designs a strictly equal-arm laser heterodyne interferometer to measure the OPD caused by the steering mirror. The measurement accuracy is improved through some improvement methods and can reach in the 1 mHz to 1 Hz frequency band. By analogy, the OPD caused by the steering mirror can reach in the 1 mHz to 1 Hz frequency band. Firstly, we analyzed the geometric noise generated by the laser incident on the optical mirror. Then, we introduced the design of the interferometer. The interferometer has a strictly equal-arm-length design, which suppresses part of the laser frequency noise. The optical components are fixed by UV bonding to reduce the impact of thermal noise. We also evaluated the performance of the interferometer under vacuum, vibration isolation, and temperature control conditions. It was found that the interferometer cannot meet the requirements of in the 1 mHz–1 Hz range, so it cannot be used directly to measure the OPD of a steering mirror driven by a minor variation in voltage. Finally, the OPD caused by the steering mirror was obtained indirectly by analogy. The OPD can reach in the 1 mHz–1 Hz range, which meets the specified requirement. The TTL noise model is verified by the tests conducted.
2. Geometric Noise Analysis
Precision laser interferometers have many common noise sources. Among them, TTL noise is a coupling noise caused by angle jitter and lateral and longitudinal jitter. It is an important noise source in precision laser interferometers and exists in any type of interferometer.
Figure 1 below is a schematic diagram of the geometric TTL noise analysis generated when the laser is incident on a steering mirror. For ease of explanation, we divide the noise into lever arm noise and piston noise.
2.1. Lever Arm Noise
After geometric calculation, the lever arm noise is
When
approaches 0, the detector alignment error is ignored, and the lever arm noise is
Perform numerical fitting on the trigonometric function part, as shown in
Figure 2 below.
It can be determined that the lever arm noise is approximately
It can be seen from Formula (3) that the lever arm noise has a first-order correlation with the distance from the reflected light to the detector. The lever arm noise can be suppressed by reducing the distance of the reflected light to the detector. The relationship between lever arm noise and angle jitter exhibits a second-order dependency.
2.2. Piston Noise
After geometric calculation, the piston noise is
When approaches 0 and , then .
We can examine Equation (4) in two cases: when and when .
When approaches 0, then .
Perform numerical fitting on the trigonometric function part, as shown in
Figure 3 below.
It can be determined that a part of the piston noise is approximately
When approaches 0, then .
In the same way, its numerical fitting is performed, as shown in
Figure 4 below.
It can be determined that another part of the piston noise is approximately
By combining Equations (5) and (6), the piston noise is
The piston noise is first-order related to the lateral and longitudinal jitter of the mirror. Improving laser alignment accuracy can effectively reduce piston noise. The piston noise exhibits a first-order and a second-order relationship with the angle jitter.
By combining Equations (3) and (7), the TTL noise is
The noise model comprises two second-order terms and one first-order term. When the angle jitter is very small, the second-order term is much smaller than the first-order term and can be neglected.
3. Design of the Interferometer
Based on the principle of a laser heterodyne interferometer, a high-precision interferometry system is constructed.
Figure 5 shows the layout of the entire interferometer. The entire system consists of a frequency modulation bench and an optical bench. The modulation bench consists of a laser, a signal generator, acousto-optic modulators (AOMs), etc. And the modulation bench is designed to obtain two lasers with a certain frequency difference. The optical bench consists of the steering mirror (SM) to be measured, photodetectors (PDs), linear polarizers (LPs), beam splitters (BSs), a mirror (M), etc. And the optical bench comprises a reference interferometer and a measurement interferometer. Here, the function of the AOMs is to achieve frequency shifting in the laser, while the LPs serve to ensure that the laser entering the interferometer is not affected by polarization changes. The laser with a frequency of
emits a light that passes through a one-to-two optical fiber coupler and is divided into two paths. The two laser paths pass through the AOMs, resulting in two laser beams with frequency shifts
and
, respectively. At this point, the laser modulation bench has obtained two laser beams (
and
) with frequencies (
+
) and (
+
), respectively.
where
and
are the amplitude vectors, respectively, and
and
are the initial phases, respectively.
The two laser beams then pass through the linear polarizers, beam splitters, the steering mirror, and the reference mirror, and finally combine at the beam splitters to form a heterodyne beat optical signal. The frequency of the heterodyne beat optical signal is the difference between the frequencies of the two lasers; that is, the heterodyne frequency is
. The heterodyne signal is then converted into electrical signals
and
through the detectors.
where
is the photoelectric conversion efficiency;
,
,
, and
are the amplitudes of the light field before interference; and
and
are the optical path phase differences of the measurement interferometer and the reference interferometer. The phase difference can be obtained with a phase meter. Then, we apply the optical path and phase conversion formula (Formula (13)):
The optical path difference of the interference optical path can be obtained. Due to the stationary nature of the reference mirror in the reference interferometer, the measured optical path difference, obtained as the steering mirror rotates in the measurement interferometer, can be attributed entirely to the rotation of the steering mirror.
It can be seen from the interference measurement optical bench that the optical path resolved by detector PD1 is
The optical path resolved by detector PD2 is
The differential optical path is
The result obtained after subtraction is 0. In theory, equal-arm-length interferometry can be achieved, which will not change due to the length of a single optical path and can eliminate laser frequency noise. However, due to the manufacturing errors of optical components and the challenge of precisely aligning the light beam combination, there will still exist a slight discrepancy in arm lengths, resulting in partial optical path noise. However, the resulting difference in arm lengths due to this reason is relatively small, insufficient to bring about significant changes to the measured optical path difference.
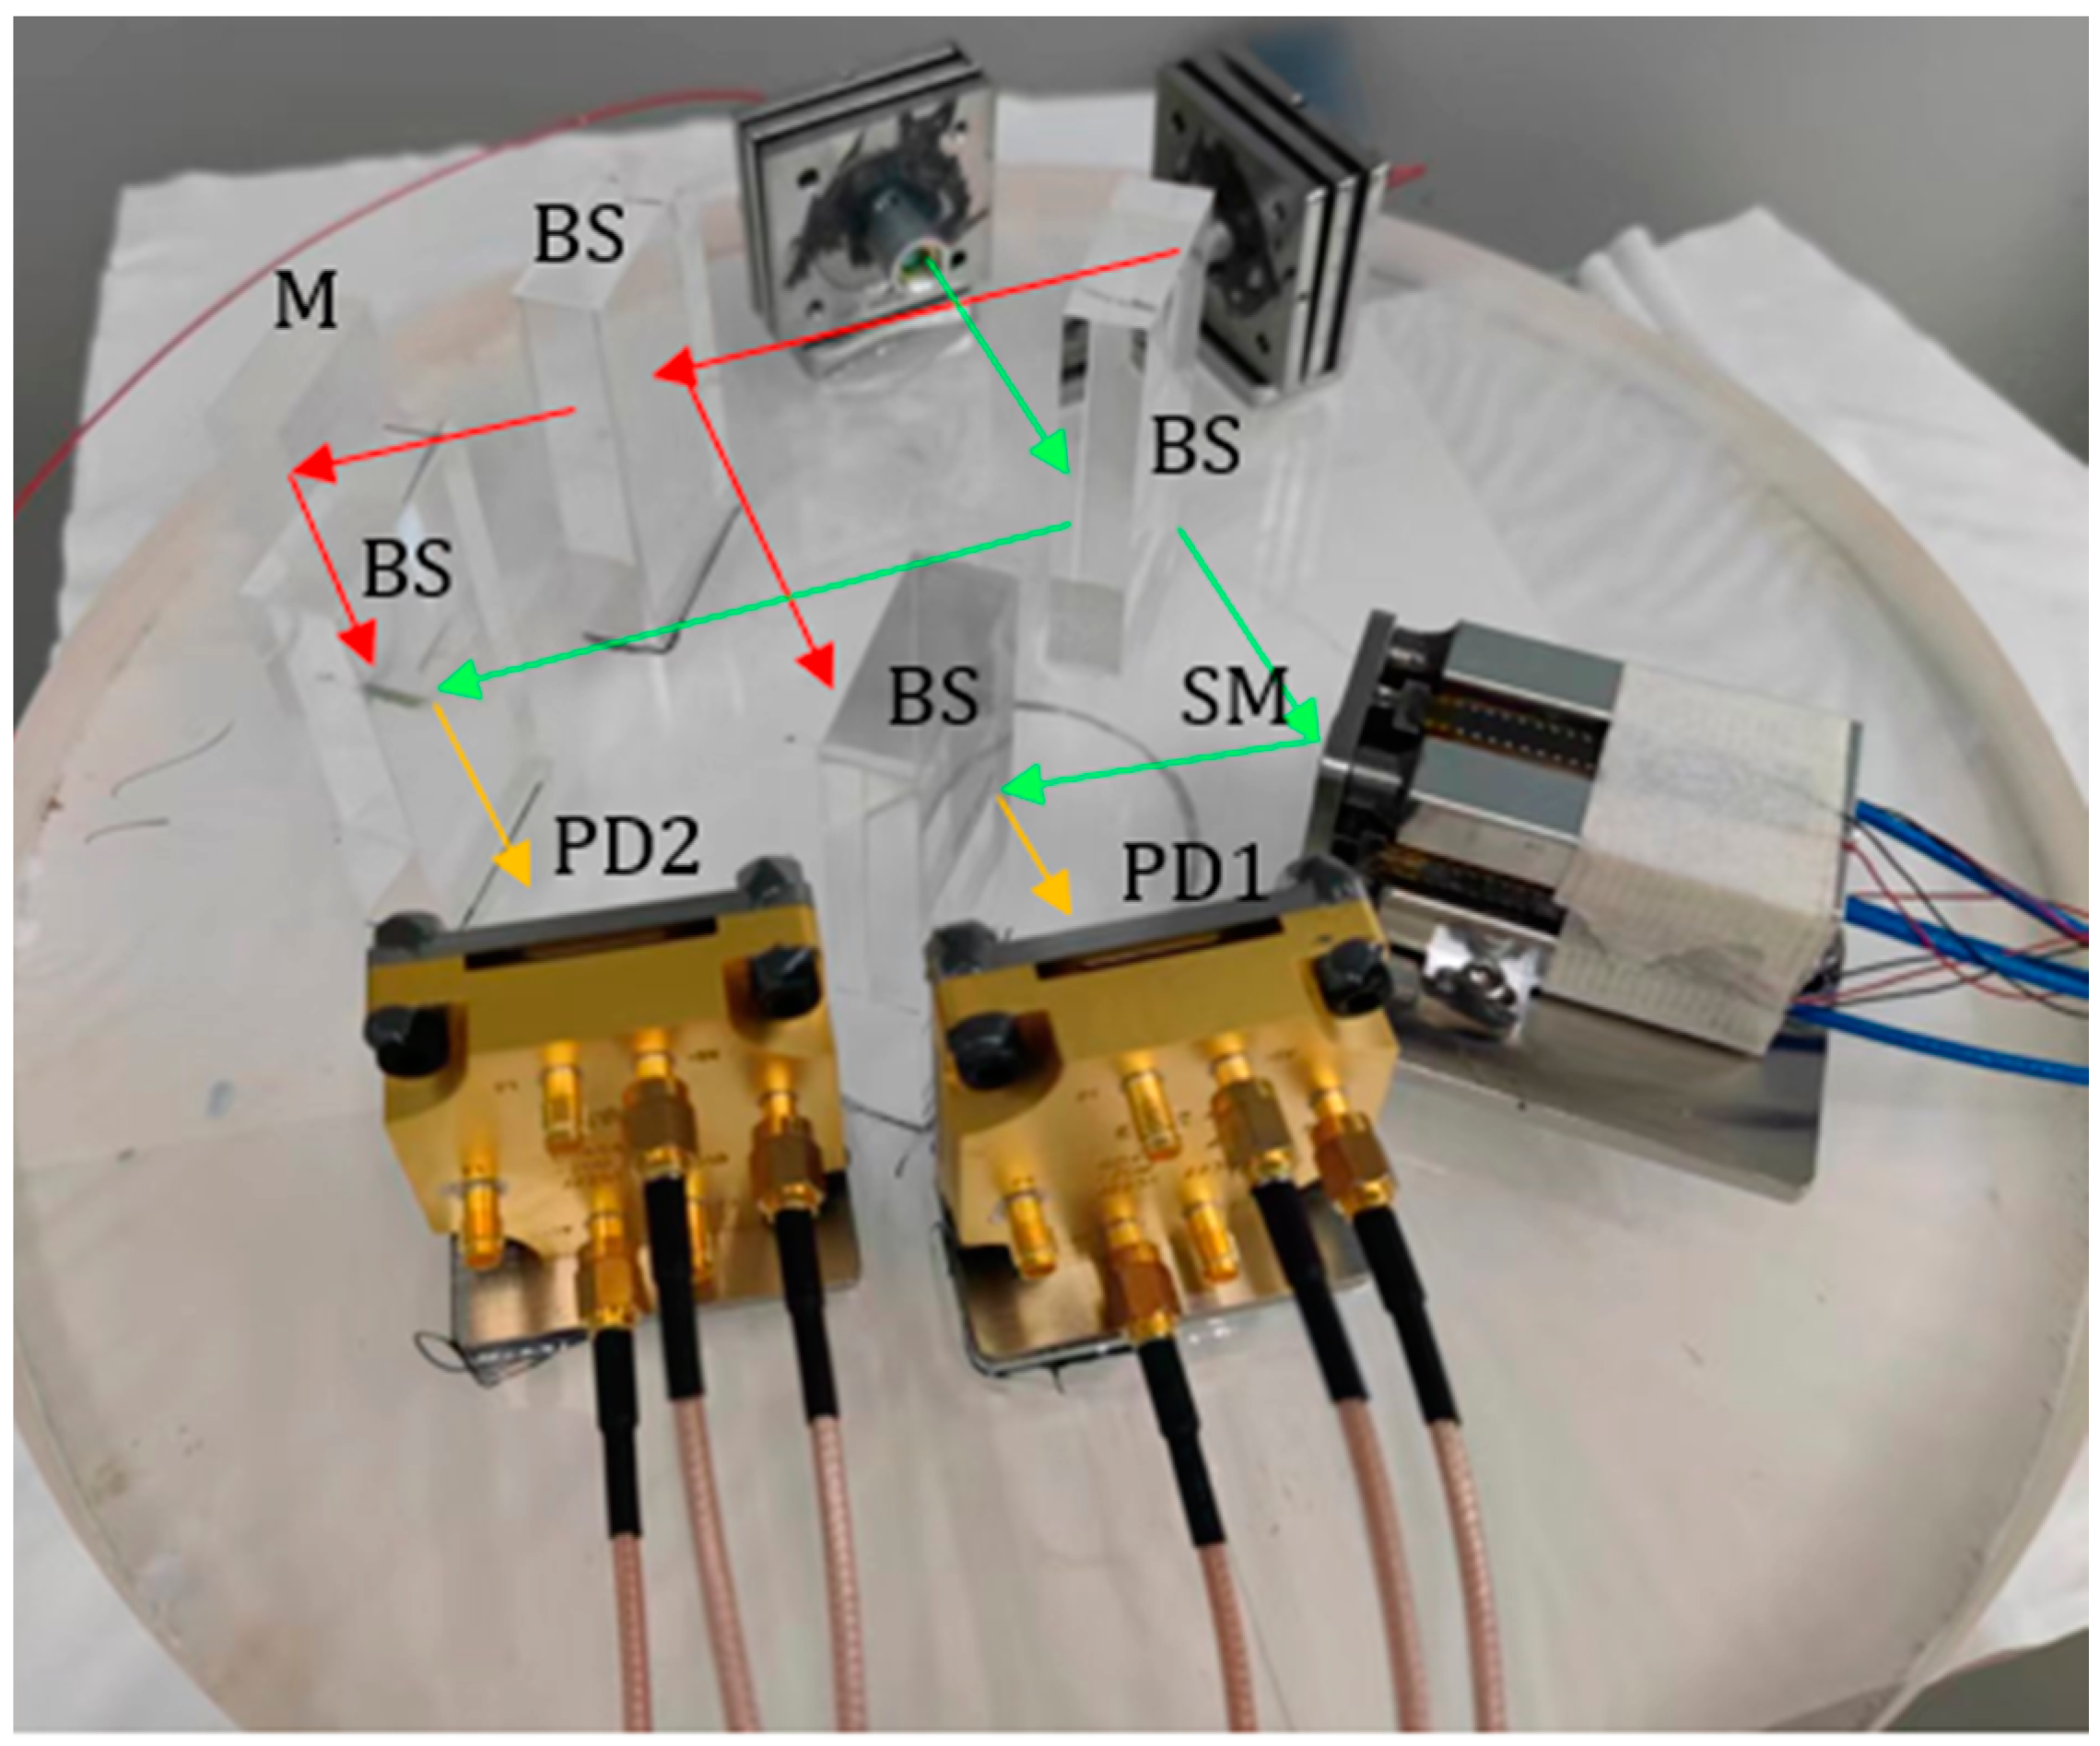
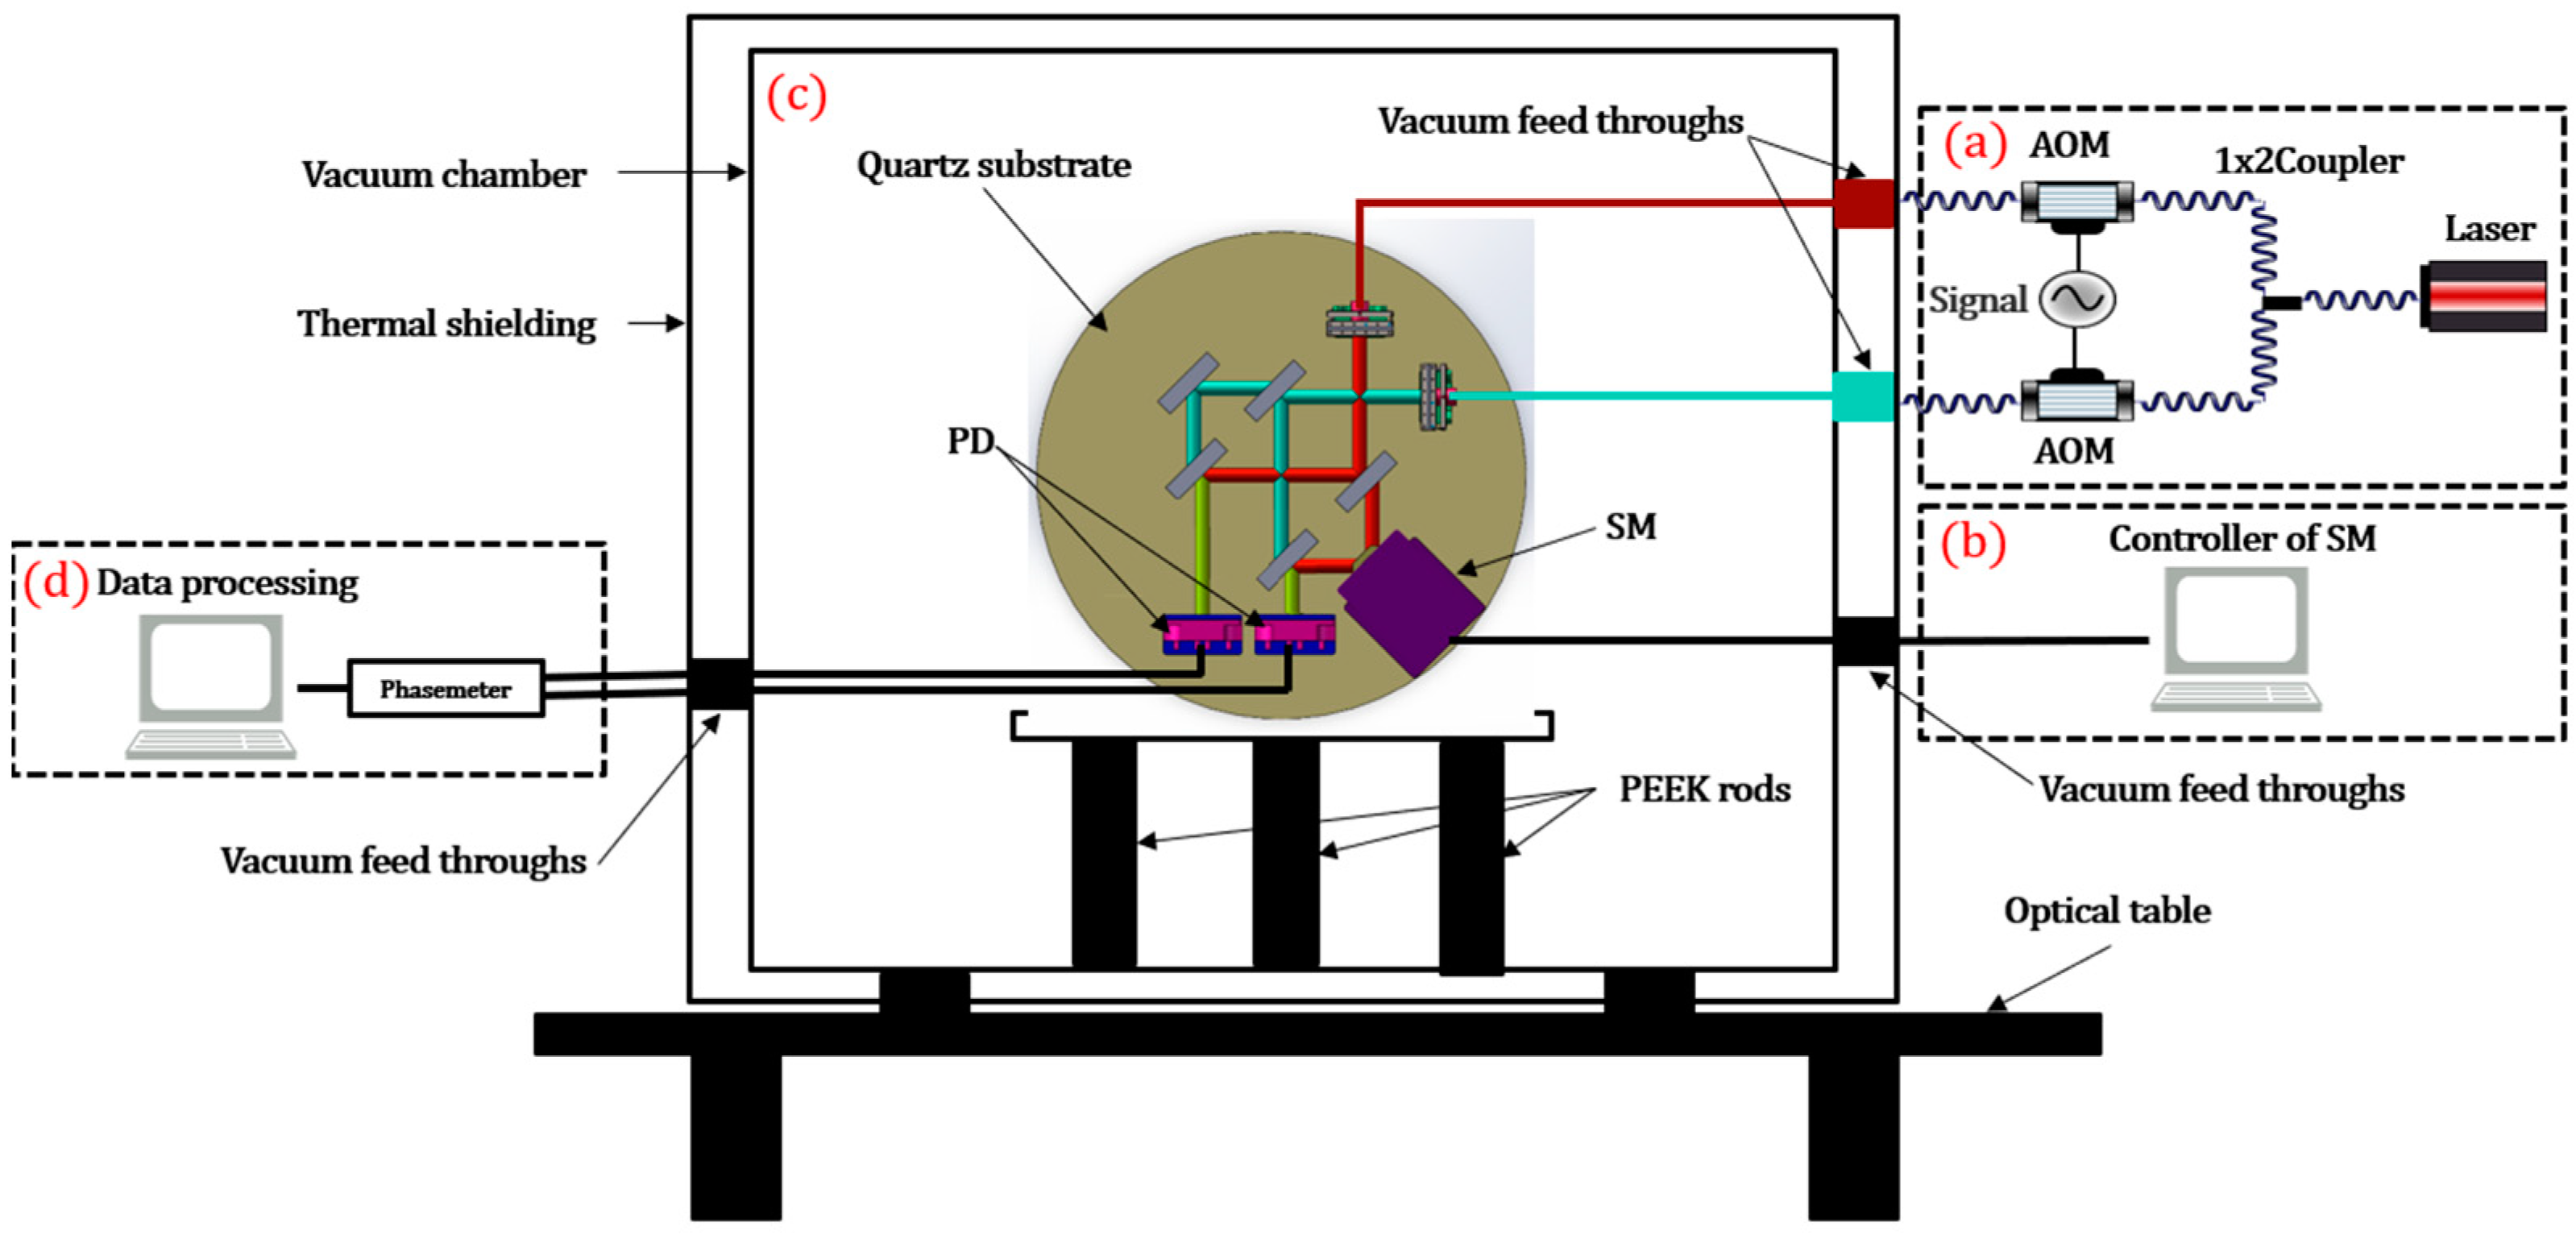
On an optical quartz substrate with a diameter of 280 mm, we fixed some optical components, such as BSs, a reference mirror, a steering mirror [
21], and photodetectors (CETC, GD4542-20MHZ-12K), on the substrate through UV-glue bonding. The fiber couplings, photodetectors, and the steering mirror were all combined and bonded to the optical substrate together with some specially designed mechanical structural parts, as shown in
Figure 6. The laser source used a semiconductor laser (Coherent, Mephisto S) with a nominal wavelength of 1064 nm. To generate the 200 kHz heterodyne frequency, we used two AOMs (CETC, SGTF150-1064-1P) in two paths, shifting the two laser frequencies by 150.1 MHz and 149.9 MHz, respectively. To extract the phase from the heterodyne signal, we used a commercial phase meter (Liquid Instruments, Moku: Pro) and adopted the Phase-Locked Loop (PLL) algorithm with a sampling frequency of 37 Hz. To ensure interference visibility, all fibers in the system were polarization-maintaining fibers (PMFs).
4. Experimental Results and Discussion
The entire system was tested in a vacuum chamber with a pressure of
to reduce the effects of refractive index fluctuations and air turbulence. The laser source is coupled into the system through the vacuum feed-throughs, and the optical signal is detected after being transmitted through the vacuum feed-throughs, too.
Figure 7 shows the operating environment of the preliminary test. A small vacuum chamber is placed on an air-floating optical platform (LBTEK, AFT1510) to isolate vibrations above its resonance (1 Hz). The modulation bench is also placed on a commercial isolator (Herz, TS-300/LP) to isolate environmental vibrations. Paste heating film around the vacuum chamber and wrap it with thermal insulation cotton to achieve approximately 10 mK temperature control. Place the optical substrate into the vacuum chamber and use three heat-insulating brackets (PEEK) to raise it so that the optical substrate is not in direct contact with the bottom of the vacuum chamber to reduce heat conduction.
To evaluate the background noise of the interferometer, we do not apply voltage to the steering mirror, so that the steering mirror is in a static state, equivalent to a reference mirror.
Figure 8 shows the measurement results of the reference interferometer, the measurement interferometer, and their differences, which represent the sensitivity level of the entire interferometer. Measurements were performed for 8 h in the operating environment described above.
Figure 8a shows the time series of the measured OPD for individual interferometers and the differential results, with a measured displacement change of
over a duration of 1081 s (40,000 sampling points).
Figure 8b is their Linear Amplitude Spectral Density (LASD) plot, showing that the reference and measurement interferometers achieve a sensitivity level of
in the frequency range of 1 mHz to 1 Hz. Since the two interferometers share similar paths, the traces of the reference and measurement interferometers are highly overlapping. They contain some common noise, including laser frequency noise, laser Relative Intensity Noise (RIN), temperature fluctuations, etc. Through the common-mode suppression scheme, the sensitivity is increased to a level of
in the 1 mHz to 1 Hz frequency band, which is about four orders of magnitude higher than that of a single interferometer. Such differential experimental results highlight the advantages of the equal-arm interferometer. The reference interferometer and measurement interferometer follow similar paths, enabling the effective elimination of common-mode noise as much as possible. This achieves measurement accuracy spanning from micrometers to hundreds of picometers.
However, this interferometer cannot directly measure the OPD of the steering mirror in the frequency range of 1 mHz to 1 Hz because the OPD of the interferometer is higher than in the 1 mHz to 1 Hz frequency band. This is mainly related to temperature fluctuations (10 mK in this paper), vacuum performance ( in this paper), etc.
The entire interferometer is mainly composed of quartz glass and Super-Invar (4J32). The linear expansion coefficients of quartz glass and Super-Invar (4J32) are approximately and . With a temperature variation of 10 mK, the linear expansion of quartz glass is approximately , and for Super-Invar (4J32), it is roughly . In practical terms, this translates to a change of approximately 550–900 pm within a 100 mm range. It is noteworthy that these linear expansions surpass the required target. Simultaneously, temperature fluctuations can alter the refractive indices of certain optical components, primarily the beam splitters (BSs), resulting in changes in the optical path due to refraction when the beams pass through the BSs. Based on the existing analysis, achieving a temperature control precision of 10 μK is deemed necessary to attain picometer-level measurement accuracy. This necessitates the implementation of measures in subsequent work to mitigate the impact of temperature fluctuations. These measures include adopting a combination of active and passive temperature-control methods to achieve higher-precision temperature control, as well as using materials with lower thermal expansion coefficients in the construction of the interferometer.
The higher the vacuum level, the better the test results. The vacuum level primarily influences variations in the refractive index of the medium within the vacuum chamber, consequently affecting measurement accuracy. Due to the elusive movement of medium molecules in the three-dimensional vacuum environment, it becomes challenging to capture and describe the optical path difference caused by them through theoretical calculations. Currently, according to empirical knowledge, a vacuum level of is typically required to achieve picometer-level accuracy at low frequencies. However, the vacuum chamber utilized in this paper can only attain a vacuum level of , thereby impacting the overall measurement accuracy. To enhance the measurement accuracy of the interferometer, it is necessary to improve the vacuum performance of the vacuum chamber in subsequent experiments.
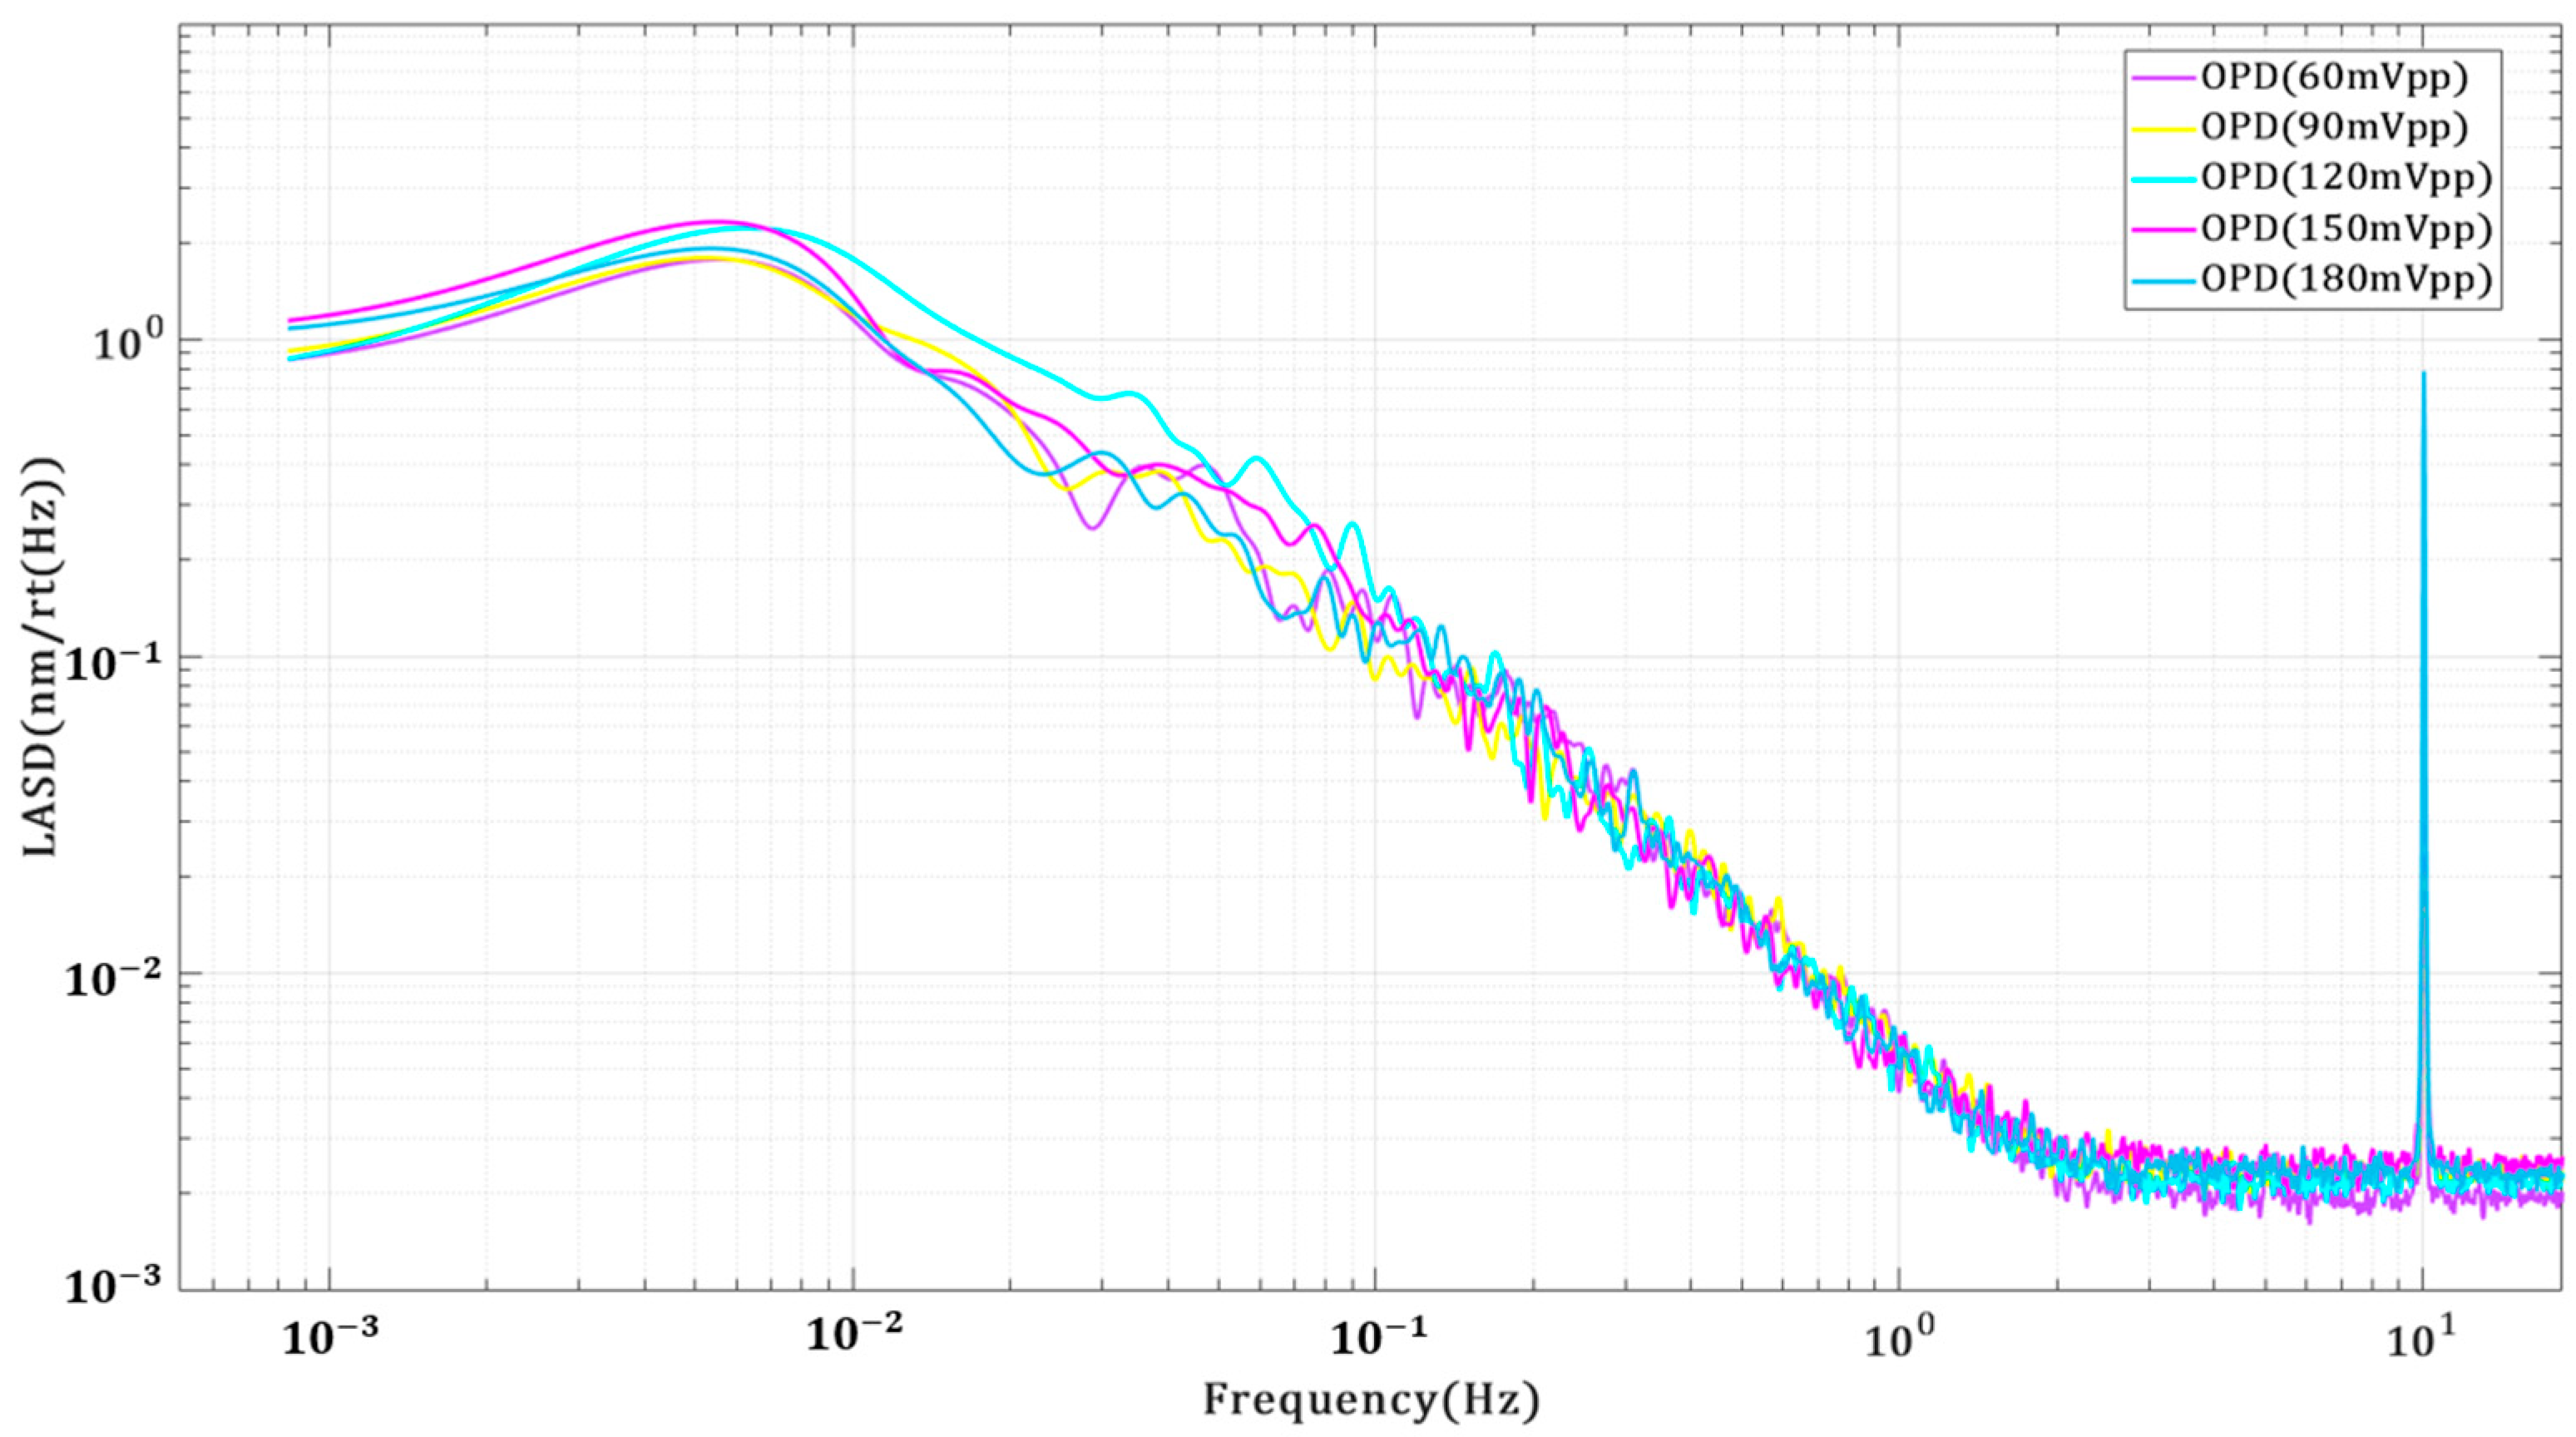
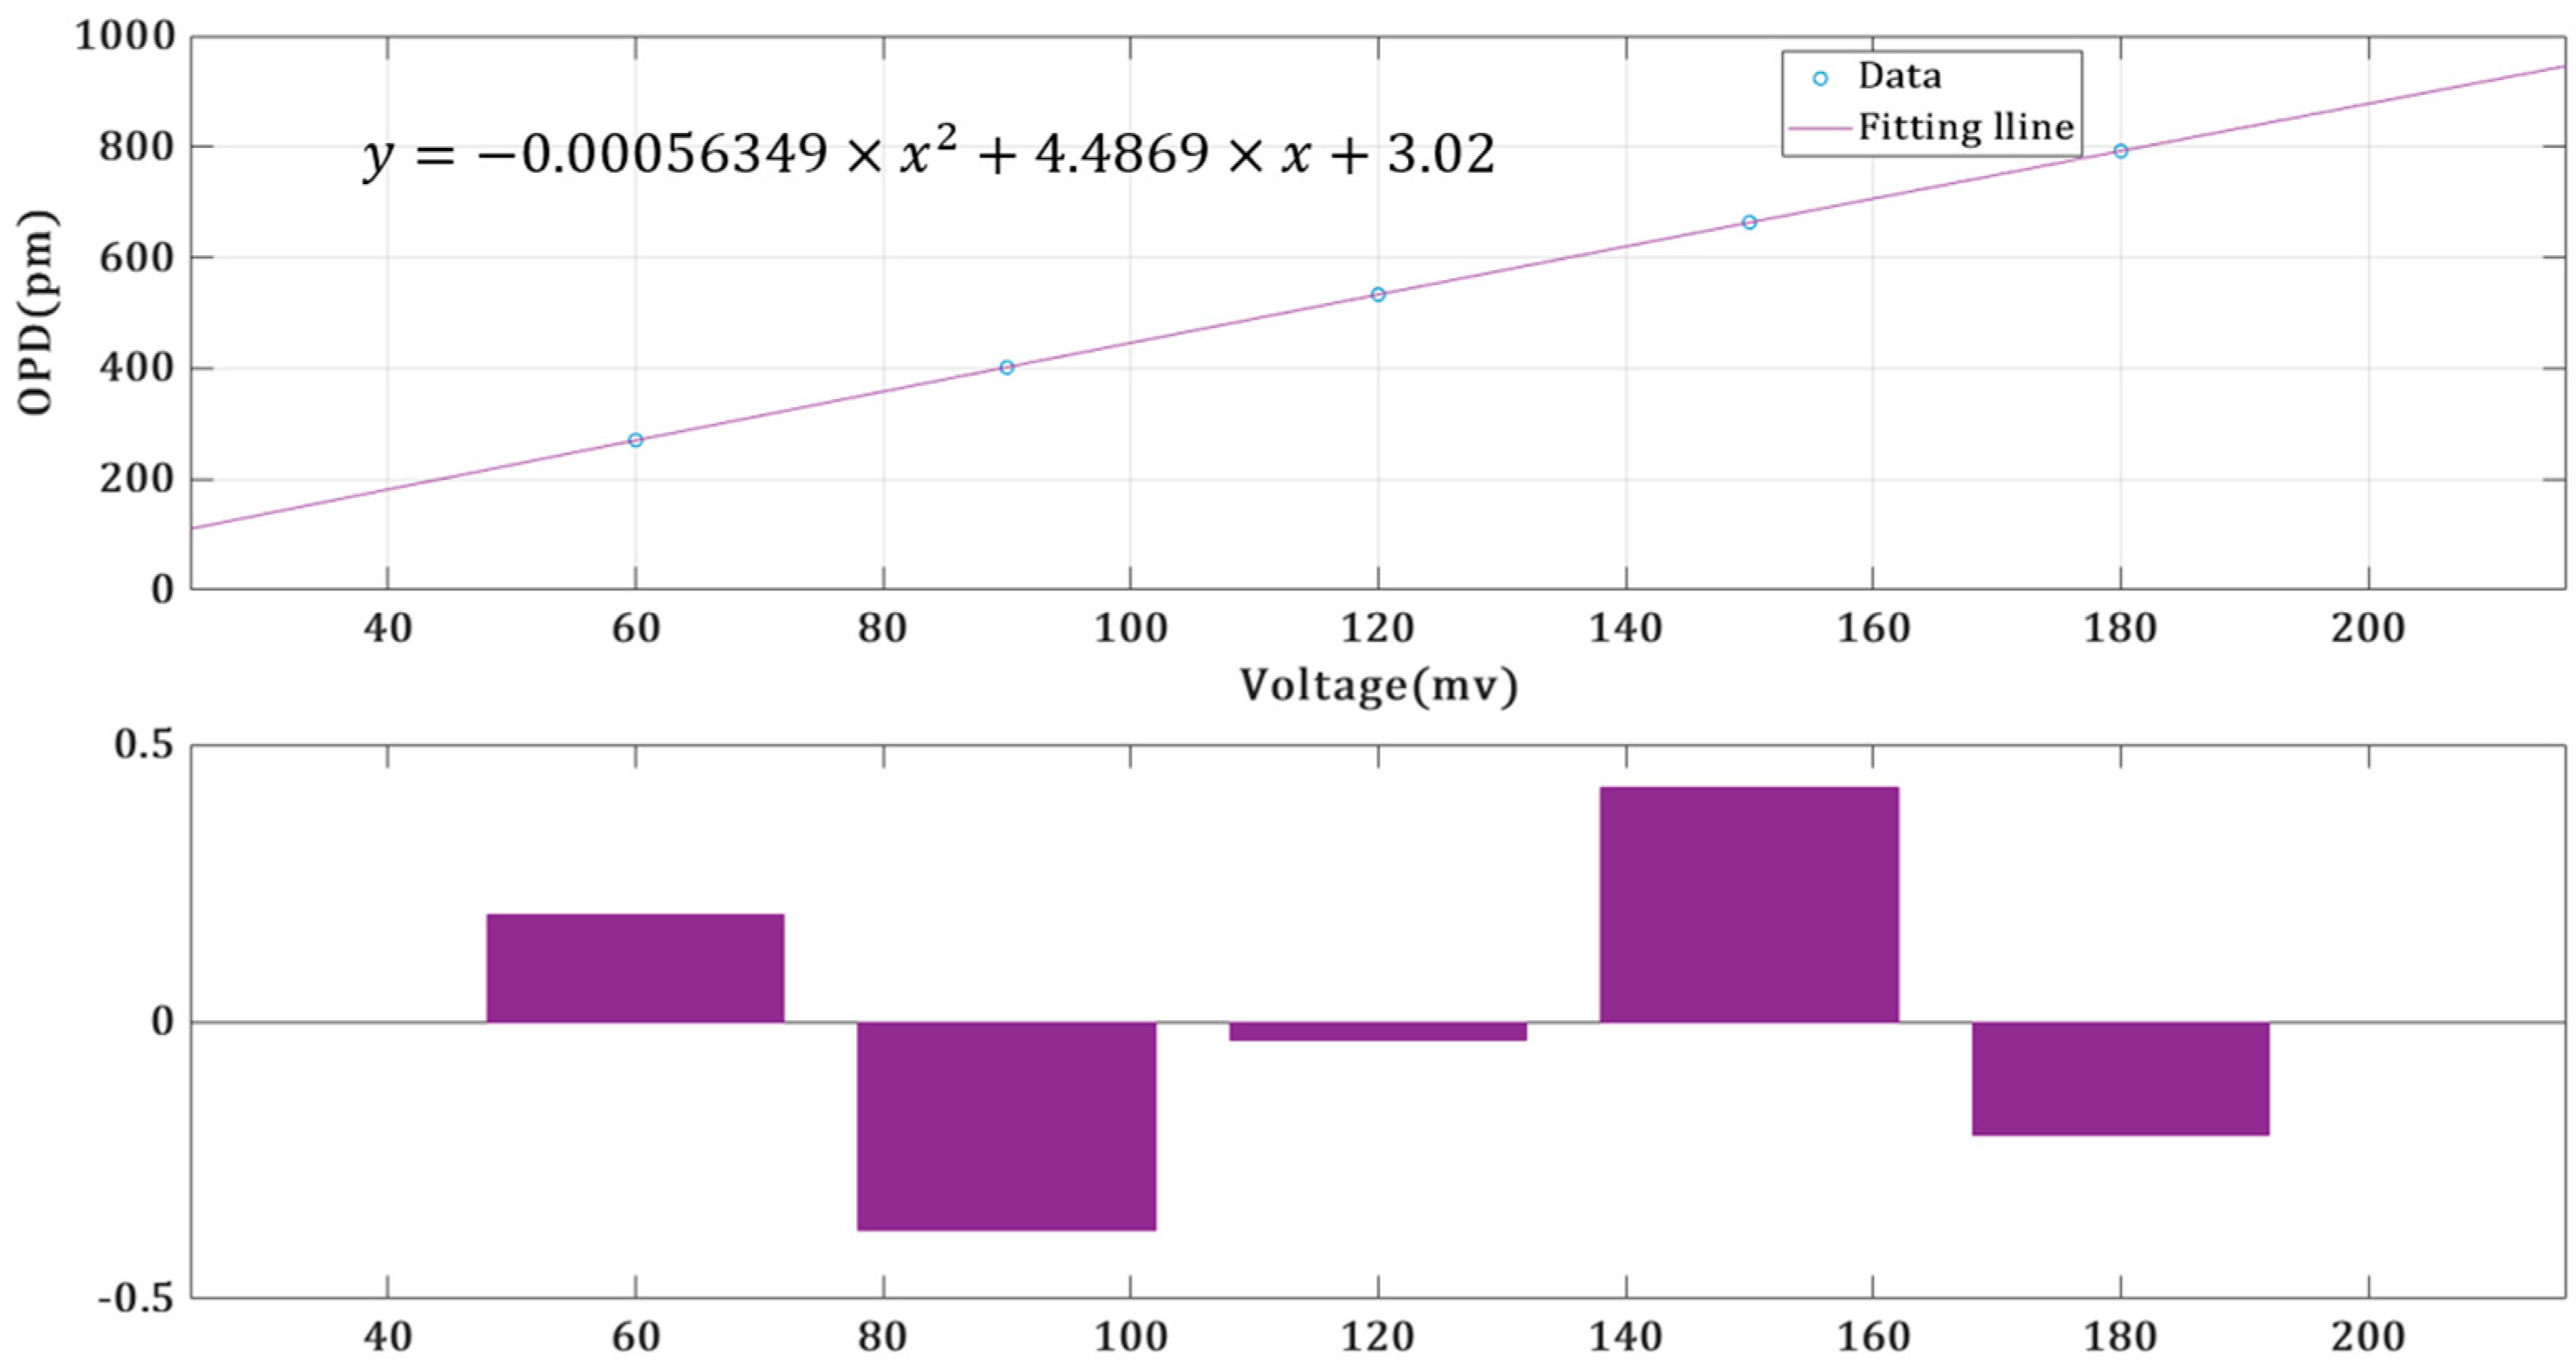
However, the OPD caused by the steering mirror can be obtained through an indirect analogical approach. According to equation 8, the calculated optical path difference has a relationship with the angle jitter. When the angle jitter is very small, neglecting the second-order term, it can be approximated that there is a proportional relationship between angle jitter and optical path difference. Preliminary investigations have established a first-order relationship between voltage and angle, implying an analogous first-order relationship between voltage and optical path difference. Voltage signals of different amplitudes are given to the steering mirror to obtain different OPDs. Then, the relationship between the driving voltage amplitude and the OPD can be obtained. Based on the voltage at the steady state of the steering mirror, the OPD at the steady state of the steering mirror could be calculated. Since the size of the OPD in the time domain is greatly affected by the experimental environment, it is difficult to obtain real results. The linear characteristics of the frequency domain can be used for analysis. By providing the steering mirror with voltage signals of the same frequency but different amplitudes, we can obtain varying optical path differences at that frequency. Through the numerical fitting of the optical path difference and voltage values, the coupling relationship between the driving voltage and optical path difference can be determined. According to the interferometer results in
Figure 8b, the 10 Hz frequency point is selected as the experimental frequency point, which helps to avoid low-frequency noise and obtain an accurate relationship between the OPDs and voltages. The OPDs are shown in
Figure 9. The OPD of each 10 Hz frequency point is fitted by second-order linear fitting based on the applied voltages, and the results are obtained as shown in
Figure 10.
As shown in
Figure 10, it can be seen from the fitting curve equation that the coefficient of the second-order term is small, and the second-order term can be ignored. The relationship between OPDs and voltages is
In previous experiments, it was found that the voltage change in the steering mirror in the steady state is 0.15 mV. It is considered that the OPD obtained when the driving voltage amplitude is 180 mV is the actual result caused by the steering mirror. In accordance with the multiplier relationship between the steady-state voltage of 0.15 mV and the experimental voltage of 180 mV, the optical path difference by applying the steady-state voltage should correspondingly decrease throughout the entire frequency domain. Analogous to the OPD when the driving voltage amplitude is 180 mV, the OPD of the steering mirror in the steady state is obtained as shown in
Figure 11. The OPD is less than
in the 1 mHz to 1 Hz frequency band when the voltage change applied to the steering mirror is 0.15 mV, so it meets the OPD requirement of
in the 1 mHz to 1 Hz frequency band.
In previous work, the relationship between the rotary angles and driving voltages was calibrated, as shown in the following formula (Formula (18)):
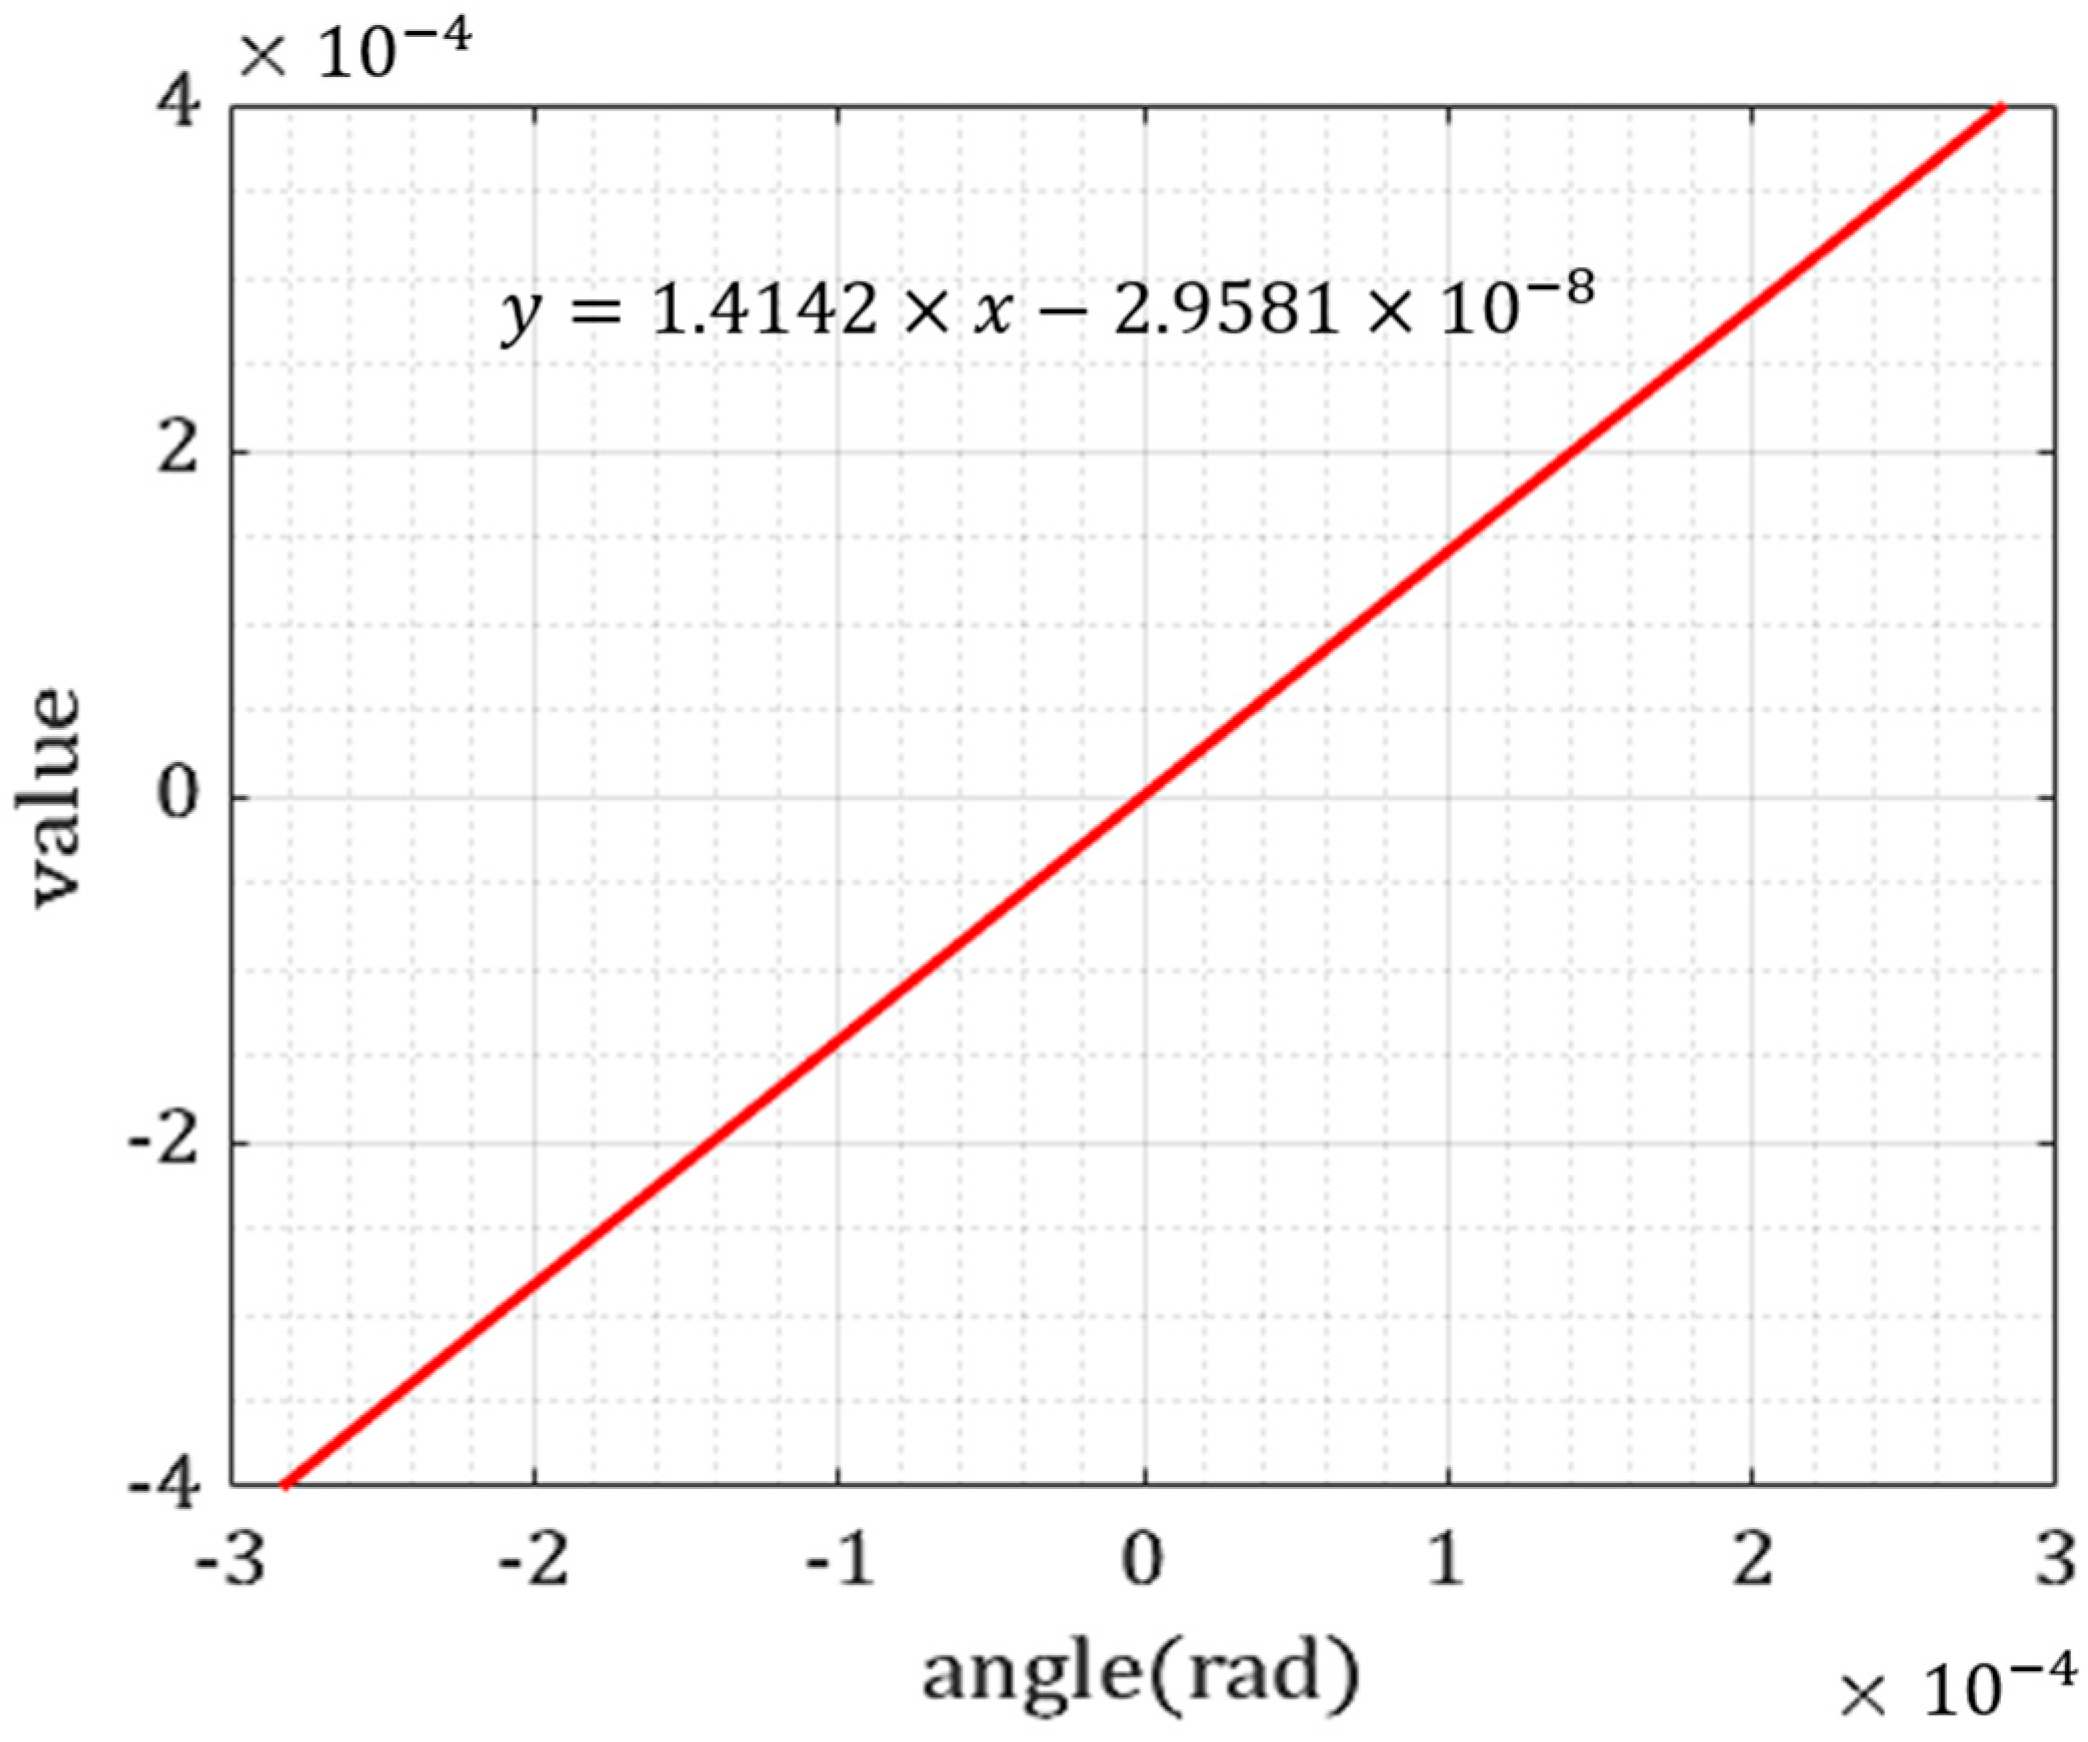
Combining Equations (17) and (18), the obtained TTL noise is
From Equation (19), it can be inferred that there is a first-order proportional relationship between angle jitter and optical path difference. The constant bias in Equation (19) is caused by the interferometer noise floor.
So far, we have achieved a measurement accuracy of in the 1 mHz to 1 Hz frequency band. Through indirect analog experiments, we have not only verified that the optical path difference induced by the steering mirror reaches but also identified the coupling relationship between angle jitter and optical path difference. The interferometer adopts the design concept of an equal arm, maximizing common-mode noise suppression and achieving measurement accuracy spanning four orders of magnitude. It also offers a robust experimental platform for pertinent studies on angle jitter noise suppression, laser Phase-Locked Loop control, laser frequency noise suppression, and related research. To directly achieve a measurement accuracy of in subsequent research, we will implement a combination of active and passive temperature-control methods to suppress temperature fluctuation noise while also providing an improved vacuum environment.

 ,
, 