Article

Density Functional Study of Structural and Vibrational Properties of α-Moganite

1
Center for Optical and Laser Materials Research, St. Petersburg State University, Ulianovskaya 5, 198504 St. Petersburg, Russia
2
Faculty of Physics, St. Petersburg State University, Universitetskaya Nab. 7/9, 199034 St. Petersburg, Russia
3
Laboratory of Spectroscopy of Solid State, Ioffe Institute, Politehnicheskaya St. 26, 194021 St. Petersburg, Russia
*
Author to whom correspondence should be addressed.
Photonics 2023, 10(12), 1346; https://doi.org/10.3390/photonics10121346
Submission received: 30 October 2023 / Revised: 27 November 2023 / Accepted: 1 December 2023 / Published: 6 December 2023
(This article belongs to the Special Issue Optical Spectroscopy and Applications)

Abstract

:
α-moganite is a recently discovered polymorph of silica, commonly intergrown with quartz in natural microcrystalline silica samples. An important challenge is finding an effective method for estimating its amount in a sample under study, which is important for its applications, related to the technology of growth of dielectric layers, as well as for fundamental problems, related to the formation of both terrestrial and lunar mineral deposits and biogenic formation. One of these methods is vibrational spectroscopy, with the help of which the presence of a particular compound is determined by the presence of characteristic spectral lines. In this work, the search for such lines is carried out using density functional theory calculations and comparisons of the IR and Raman spectra of α-quartz and α-moganite. With the help of such calculations, the stability of the moganite structure has been proven for the first time, and its spectral characteristics have been determined over the entire range of vibrational frequencies. Several new spectral lines characteristic of α-moganite were discovered in the 65–85 cm−1 region. Moreover, the evolution of spectral peculiarities under hydrostatic pressure was studied.

1. Introduction

Silicon dioxide, one of the most abundant compounds in the Earth’s crust, is a technologically important dielectric that is widely used in industry, optics and electronics [1]. The miniaturization of the silicon-based transistor devices is closely related to the reduction in the thickness of the dielectric layers [1]. This, in turn, requires the development of technologies for the growth of SiO2 layers, which is closely related to the study of the structure of silicon dioxide polymorphs, as well as knowledge and methods for their characterization [2].
α-moganite (hereinafter moganite) is one of the metastable polymorphs of SiO2 [3]. It was originally discovered by Florke et al. in 1976 [4,5]. Its structure with space group I2/a was described in 1984 [6] and subsequently refined in 1994 [7]. In the CNMMN mineral catalogue, this structure is numbered 99–035. As research on this mineral expanded, it became clear that it is quite widespread in the form of inclusions in microcrystalline α-quartz [8]. It was observed in noticeable quantities in crystallization processes in chalcedony, agate and opals [8,9,10]. When studying the ornamental stone inlays used in jewelry and crafts, inclusions of moganite were also found in objects of cultural and historical value [11,12,13]. It was discovered that the presence or absence of moganite may correlate with the visual characteristics of the mineral used for inlay [13]. Moreover, moganite as an inclusion was found in biologically generated chalcedony [14]. From this point of view, research on chalcedony (quartz and moganite) as a biologically compatible material, as well as the biological processes associated with its formation, are of practical importance [14]. Equally important is the study of the dependence of the optical and electronic properties of chalcedony on its composition [15]. Recently, moganite was found in grains from a lunar meteorite, being crystallized along with α-quartz, coesite and stishovite [16].
According to [17], moganite in its purest state occurs in nature in the Mogan formation on Gran Canaria (Spain); in other places it occurs in the form of inclusions with other polymorphic modifications of SiO2, mostly with α-quartz. In this regard, it is of interest to study quartz–moganite mixtures.
The use of silicon dioxide in layered heterostructures in silicon microelectronics raises the question of the structure of the interface between the semiconductor and the dielectric. The optoelectronic properties of such heterostructures depend on the structure and quality of such interfaces. In this regard, moganite has attracted attention as one of the possible crystal structures that arise in the immediate vicinity of the interface with crystalline silicon. On the other hand, identifying and estimating the amount of moganite inclusions can play an important role in choosing suitable technological conditions for the growth of defect-free α-quartz-based heterostructures.
The presence of moganite in the sample under study is identified mainly by experimental methods such as X-ray diffraction, Raman spectroscopy and IR absorption spectroscopy [7,8,9,18,19,20,21,22,23], and less often by the methods of NMR spectroscopy [22] and cathodoluminescence [24]. Vibrational spectroscopy—IR absorption spectroscopy and Raman spectroscopy—looks the most promising due to its high sensitivity to structure, non-invasive and non-destructive character, relative ease of implementation, as well as the high spatial resolution. A significant advantage of Raman spectroscopy is its relatively easy ability to study phonons with frequencies in the far-IR region. Another advantage of Raman spectroscopy is its ability to localize the region of interest in depth (using confocal optics) and in the focal plane (using objectives with a higher magnification and a shorter wavelength of laser excitation and, accordingly, collect scattered light). These features of Raman spectroscopy are especially important in studies of small micrometer silica inclusions of terrestrial origin as much as for remote investigations of meteorite-origin silica polymorphs [16,25].
The problem of identifying moganite and studying both the technological and natural processes occurring with it in mixtures with other polymorphic modifications of similar composition requires the identification of spectral features belonging specifically to moganite, as well as the establishment of structure–spectrum correlations. Computer modeling based on density functional theory (DFT) can help in establishing the characteristic spectral features of moganite. Theoretical calculation from first principles makes it possible to fairly accurately predict the structural, electronic and vibrational properties of various objects, such as crystals (see e.g., [8,26,27,28,29]) and molecules in different media (see e.g., [30,31,32]). This is necessary for the targeted planning of technologically complex experiments, especially with small amounts of the substance being studied in the volume of another phase.
Using DFT methods in various approximations, the structure of moganite, its elastic properties, the phase transition from I2/a to Imab phases [8], as well as chemical shifts associated with the local environment of atoms in moganite [26] have already been studied. In addition, the electronic band structure in several SiO2 polymorphs, including moganite, has been studied recently [27].
The study of the vibrational properties of moganite via theoretical methods is represented in the current literature. In this regard, the purpose of this work is modeling the vibrational properties of moganite, as well as interpreting the obtained Raman and IR absorption spectra. The calculation results are intended to be compared with the available experimental data. This will make it possible to identify characteristic spectral regions for pure moganite and in the moganite–quartz mixture. In addition, such calculations will make it possible to predict the frequency values of phonons that have not previously been observed in the experiment, and will also make it possible to propose new methods for estimating the concentration of moganite in a moganite–quartz mixture. Additional information will be obtained from studies of changes in the phonon spectrum of moganite under external hydrostatic pressure.

2. Theoretical Approach

The calculation was carried out within the framework of the local density approximation (LDA) of density functional theory with the CA-PZ functional [33,34]. The LDA method was chosen because it makes it possible to fairly accurately predict the structural, elastic and phonon properties of oxide materials, including α-quartz [26]. In our calculations, we used a norm-conserving pseudopotential implemented in the Castep software (Material Studio software package) [35,36]. The cutoff energy for constructing the plane wave basis was 1000 eV. The convergence criterion in the self-consistent field procedure was assumed to be 5 × 10⁻⁹ eV/atom. Geometry optimization was carried out using a modified Broyden–Fletcher–Goldfarb–Schanno (LBFGS) method [37] until residual forces, residual stresses and maximum displacements did not exceed 0.005 eV/Ȧ, 0.02 GPa and 5 × 10⁻⁵ Ȧ, respectively. The dimensions of the Monkhorst–Pack k-grid [38] were set as 6 × 6 × 4 for moganite and 6 × 6 × 6 for α-quartz, which provided a step of 0.04 1/Ȧ. The convergence of properties was checked using a calculation with larger grids of 8 × 8 × 6 for moganite and 8 × 8 × 8 for α-quartz. The calculation of vibrational frequencies, as well as Raman and IR absorption spectra, was carried out using the linear response method within the framework of perturbation theory [39,40]. The vibrational properties were calculated both at zero pressure and in the hydrostatic compression regime at pressures of 2, 5, 8, 10 and 25 GPa. The upper pressure limit was chosen on the basis of the stability of α-quartz as a possible wide spread host material. Drastic structural changes occur in α-quartz above 25 GPa, as was noticed in [41,42]. Visualization of the crystal structure and atomic displacements in vibrational modes was carried out using the Jmol program [43]. The Raman spectra were simulated for practically important cases of 785 nm excitation and 300 K temperature with the 10 cm−1 width at half maximum.

3. Results and Discussion

3.1. Structural Parameters

Moganite crystallizes in a monoclinic structure (space group I2/a) with a monoclinic angle slightly different from 90°. The elementary and primitive cells of moganite are shown in Figure 1. The framework structure formed by SiO4 tetrahedra connected by common vertices can be represented as the result of alternating right- and left-handed α-quartz domains, bounded by {101} planes [3]. As a result of such ordering, a structure is formed consisting of interconnected four-membered and six-membered rings. Four-membered rings form chains extended along the a-axis. An example of such a 4-chain can be seen in Figure 1a. In the perpendicular direction, rings of the neighboring four chains are interconnected by infinite Si–O–Si chains extended along the b axis.
The optimized unit cell parameters and atomic positions are given in Table 1 and Table 2, respectively.
It can be noted that the value of the monoclinic angle is quite accurately reproduced in the calculation, and the discrepancies between theory and experiment for lattice parameters abc are in the range of 1–3%. The optimized atomic positions (see Table 2) also agree well with the experimental data, with one exception for the y-positions of the Si2 and O1 atoms. In this regard, we note that, firstly, the error in determining these parameters in the experiment is maximum, and secondly—and this is the most important reason for the discrepancy—the calculations were carried out in the harmonic approximation, i.e., at T = 0, and the experimental data refer to room temperature. Recall that the y-positions of Si2 and O1 atoms depend most strongly on temperature [44]. In general, it can be considered that the calculation results are in good agreement with experimental data.

3.2. Vibrational Properties at Ambient Pressure

3.2.1. Group Theoretic Approach

Phonons at the Г-point can be divided into four groups corresponding to four irreducible representations (IRR): Au, Bu, Ag and Bg. Due to the presence of an inversion center, the phonon modes of moganite obey the rule of alternative prohibition: the phonons of the Au and Bu representations are active only in the IR absorption spectra, and the phonon modes of the Ag and Bg representations are active only in the Raman spectra. In general, the reducible representation at the Г point is decomposed according to the IRR, as follows [7]:
Г = Гac + Гopt
Гac = Au + 2Bu
Гopt = 12Au +12Bu + 13Ag + 14Bg

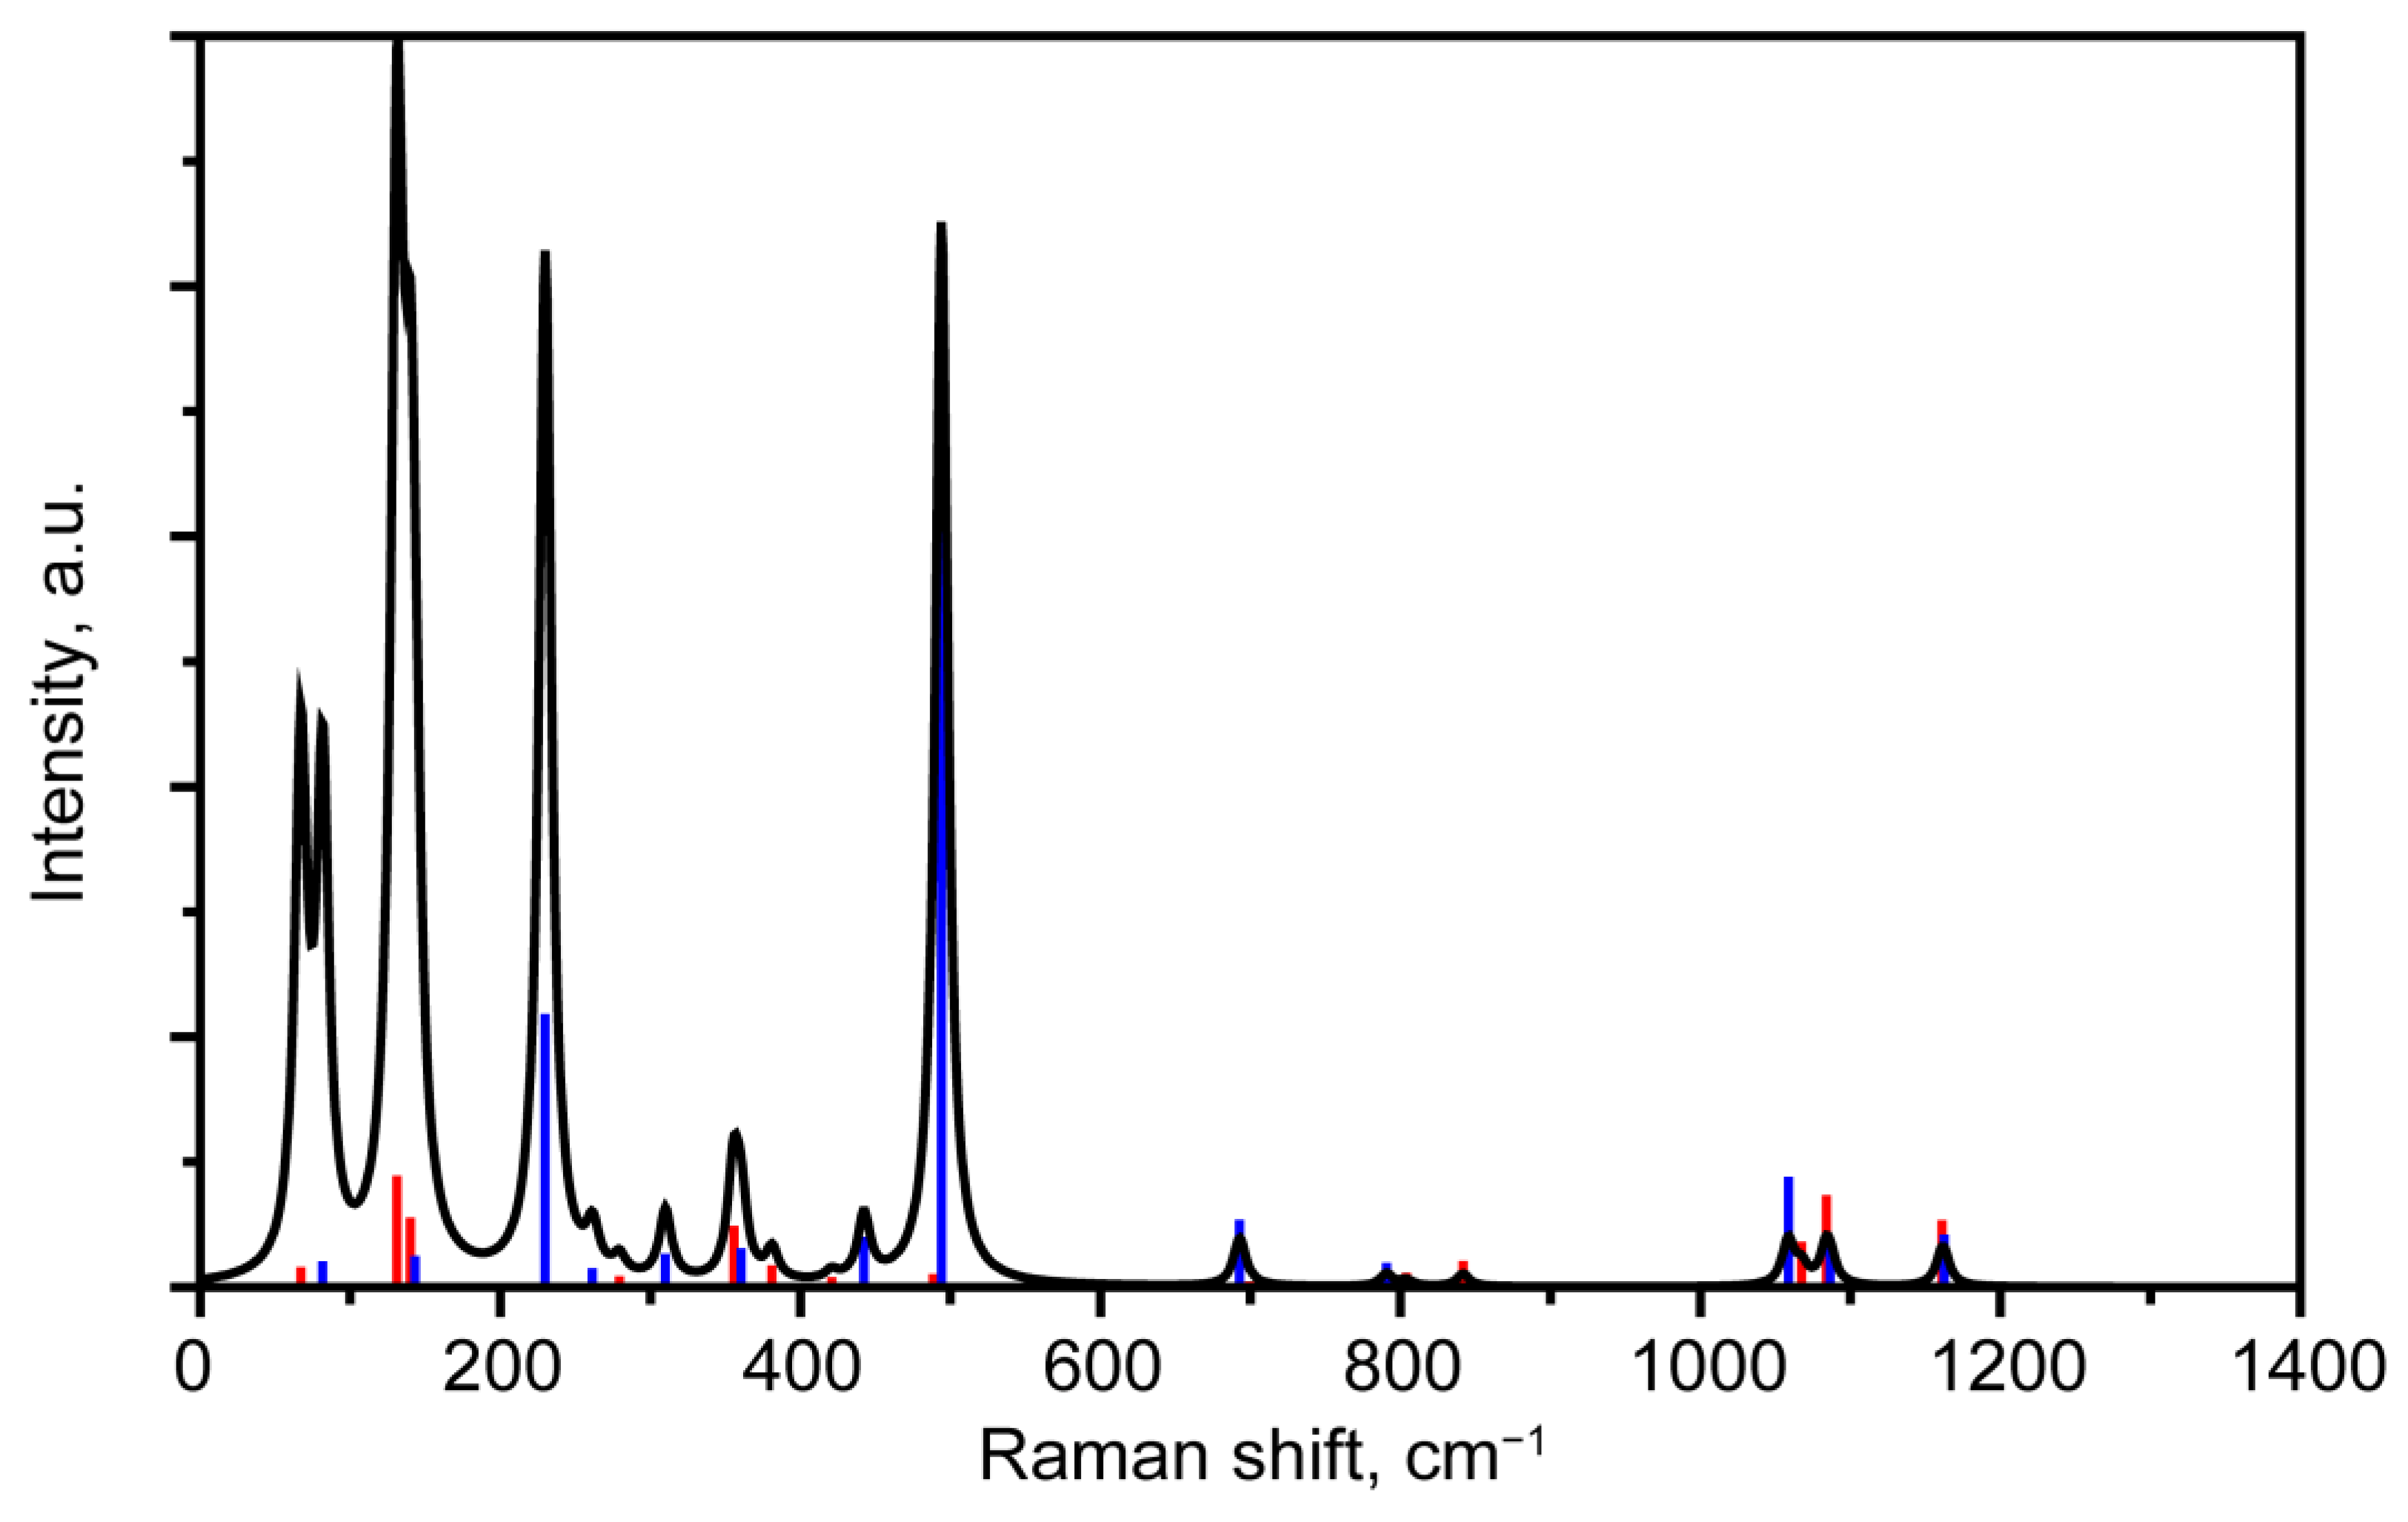
3.2.2. Interpretation of Raman Spectra

In the calculated Raman spectrum of moganite, four regions containing intense peaks can be distinguished: 65–85 cm−1, 125–145 cm−1, about 230 cm−1 and 500 cm−1. In the last three regions that are easily accessible to experimental Raman studies, several distinct spectral lines were indeed observed [7,8,16,18]. Their frequencies are listed in Table 3 in comparison with our computational results.
The most intense peak is around 500 cm−1. It was previously noted that the presence of this peak in the spectra of individual minerals correlates with the presence of four-membered rings in their structure [7]. In our calculation, this peak is associated with the Ag mode—494 cm−1, which is also very intense in the Raman spectrum (see Figure 2). Analyses of the calculated eigenvector (see Figure 3a) showed that oxygen atoms oscillate predominantly in this mode. Moreover, the O atoms perform in-phase oscillations in a direction close to the bisectors of the bridge Si–O–Si angles. Therefore, such a mode can be called “in-phase stretching vibration of all Si–O–Si bridges” and denoted νs(Si–O–Si). As a consequence, all four-membered rings expand and contract in phase. This mode can also be called “in-phase breathing” of all four-membered rings. The breathing nature of this mode explains its high activity in the Raman spectrum.
In the structures of all crystalline modifications of SiO2, based on tetrahedra connected by vertices, rings of Si–O–Si bridges can be found. Therefore, the spectra of all such crystals contain similar breathing modes with high Raman activity. The frequencies of such modes lie in the range typical of deformation vibrations, and their specific value depends on the number of links in the rings. So, for example, in quartz, the structure of which contains only six-membered rings, a similarly strong Raman peak is observed at 464 cm−1 [45], which is 34 cm−1 lower than in the spectrum of moganite. In our calculation, the frequency of the breathing A1 mode in quartz turned out to be 459 (see Table S1), which is 35 cm−1 lower than in α-moganite. As we can see, our calculation perfectly reproduces the frequency shift in the quartz/moganite pair. As has been shown, the structure of silicate glasses contains Si–O–Si rings containing four, five and six members [46]. Accordingly, in the Raman spectra of silicate glasses, there are strong lines in the range of 300–500 cm−1, which were attributed to similar symmetrical deformation vibrations of rings of different numbers of SiO4 tetrahedra [47].
Another intense Raman peak was observed at around 210–220 cm−1 [7,8,16,18]. In our calculation, this peak is associated with the Ag mode 230 cm−1, which is also very intense in the Raman spectrum (see Figure 2). A detailed examination of the atomic displacements in this mode allows us to represent it as antiphase rotational rocking of the oxygen tetrahedra of Si1 atoms and the infinite Si2–O–Si2 chains around the b axis. Thus, this mode can be considered as quasi Rigid Unit Mode (quasi-RUM). This explains its low frequency and relatively high Raman activity. The atomic displacements are demonstrated in Figure 3b and Figure S1.
In the low-frequency region (below 140 cm−1) of the Raman spectrum, one can note the presence of a number of lines corresponding to vibrational modes with low static Raman activity. However, their contribution to the spectrum observed at a finite temperatures is quite significant due to the large thermal amplitudes, which, as is known, increase sharply with decreasing frequency. Let us recall that the Raman intensity Ik of the k mode with frequency νk and Raman activity Rk at temperature T (ad hoc 300 K) obeys dependence (1) [48]:
I k = R k v 0 v k 4 v k   1 e h c v k k B T
where ν0 is the laser frequency (ad hoc 785 nm), h and kB are the Plank and Boltzmann constants and c is the speed of light.
Such low-frequency modes include vibrations with frequencies of 67, 82, 131 and 140 cm−1. The Bg 140 cm−1 mode is characterized by complex atomic displacements that involve rotations of tetrahedra in a chain of four link rings. In this case, the O11 and O6 atoms rotate in one direction, and the O12 and O5 atoms rotate in the opposite direction due to the inversion operation. Such displacements deform the rings compressing them in one direction and stretching them in a perpendicular direction—see Figure 3c. The Bg 131 cm−1 mode corresponds to the rotation of the four-member ring around an axis passing through the Si17 and Si18 atoms—see Figure 3d.
The calculation predicts in the Raman spectrum of moganite the presence of two low-frequency lines corresponding to the Bg 67 cm−1 and Ag 82 cm−1 modes, which have not yet been observed experimentally. In the Ag 82 cm−1 mode, oscillations of the SiO4 tetrahedra have a mixed translational–rotational nature. The inversion–nonequivalent tetrahedra of the Si13 and S14 atoms tilt, and the motion of the Si18 tetrahedron is predominantly translational—see Figure 3e. The mode with a frequency of 67 cm−1 also has a mixed translational–rotational character of atomic oscillations. Rotations occur in the Si13 and S14 tetrahedra, and predominantly translations occur in the Si18 tetrahedron—see Figure 3f. The features of the 67 cm−1 mode include two points related to the fourth-fold rings. First, the most noticeable displacements of atoms occur in the plane of the ring. Second, the amplitudes of silicon atoms are greater than in the 82 cm−1 mode with comparable amplitudes of atomic displacements of oxygen atoms. A pair of nearby oxygens moves in one direction, another pair in the opposite direction.

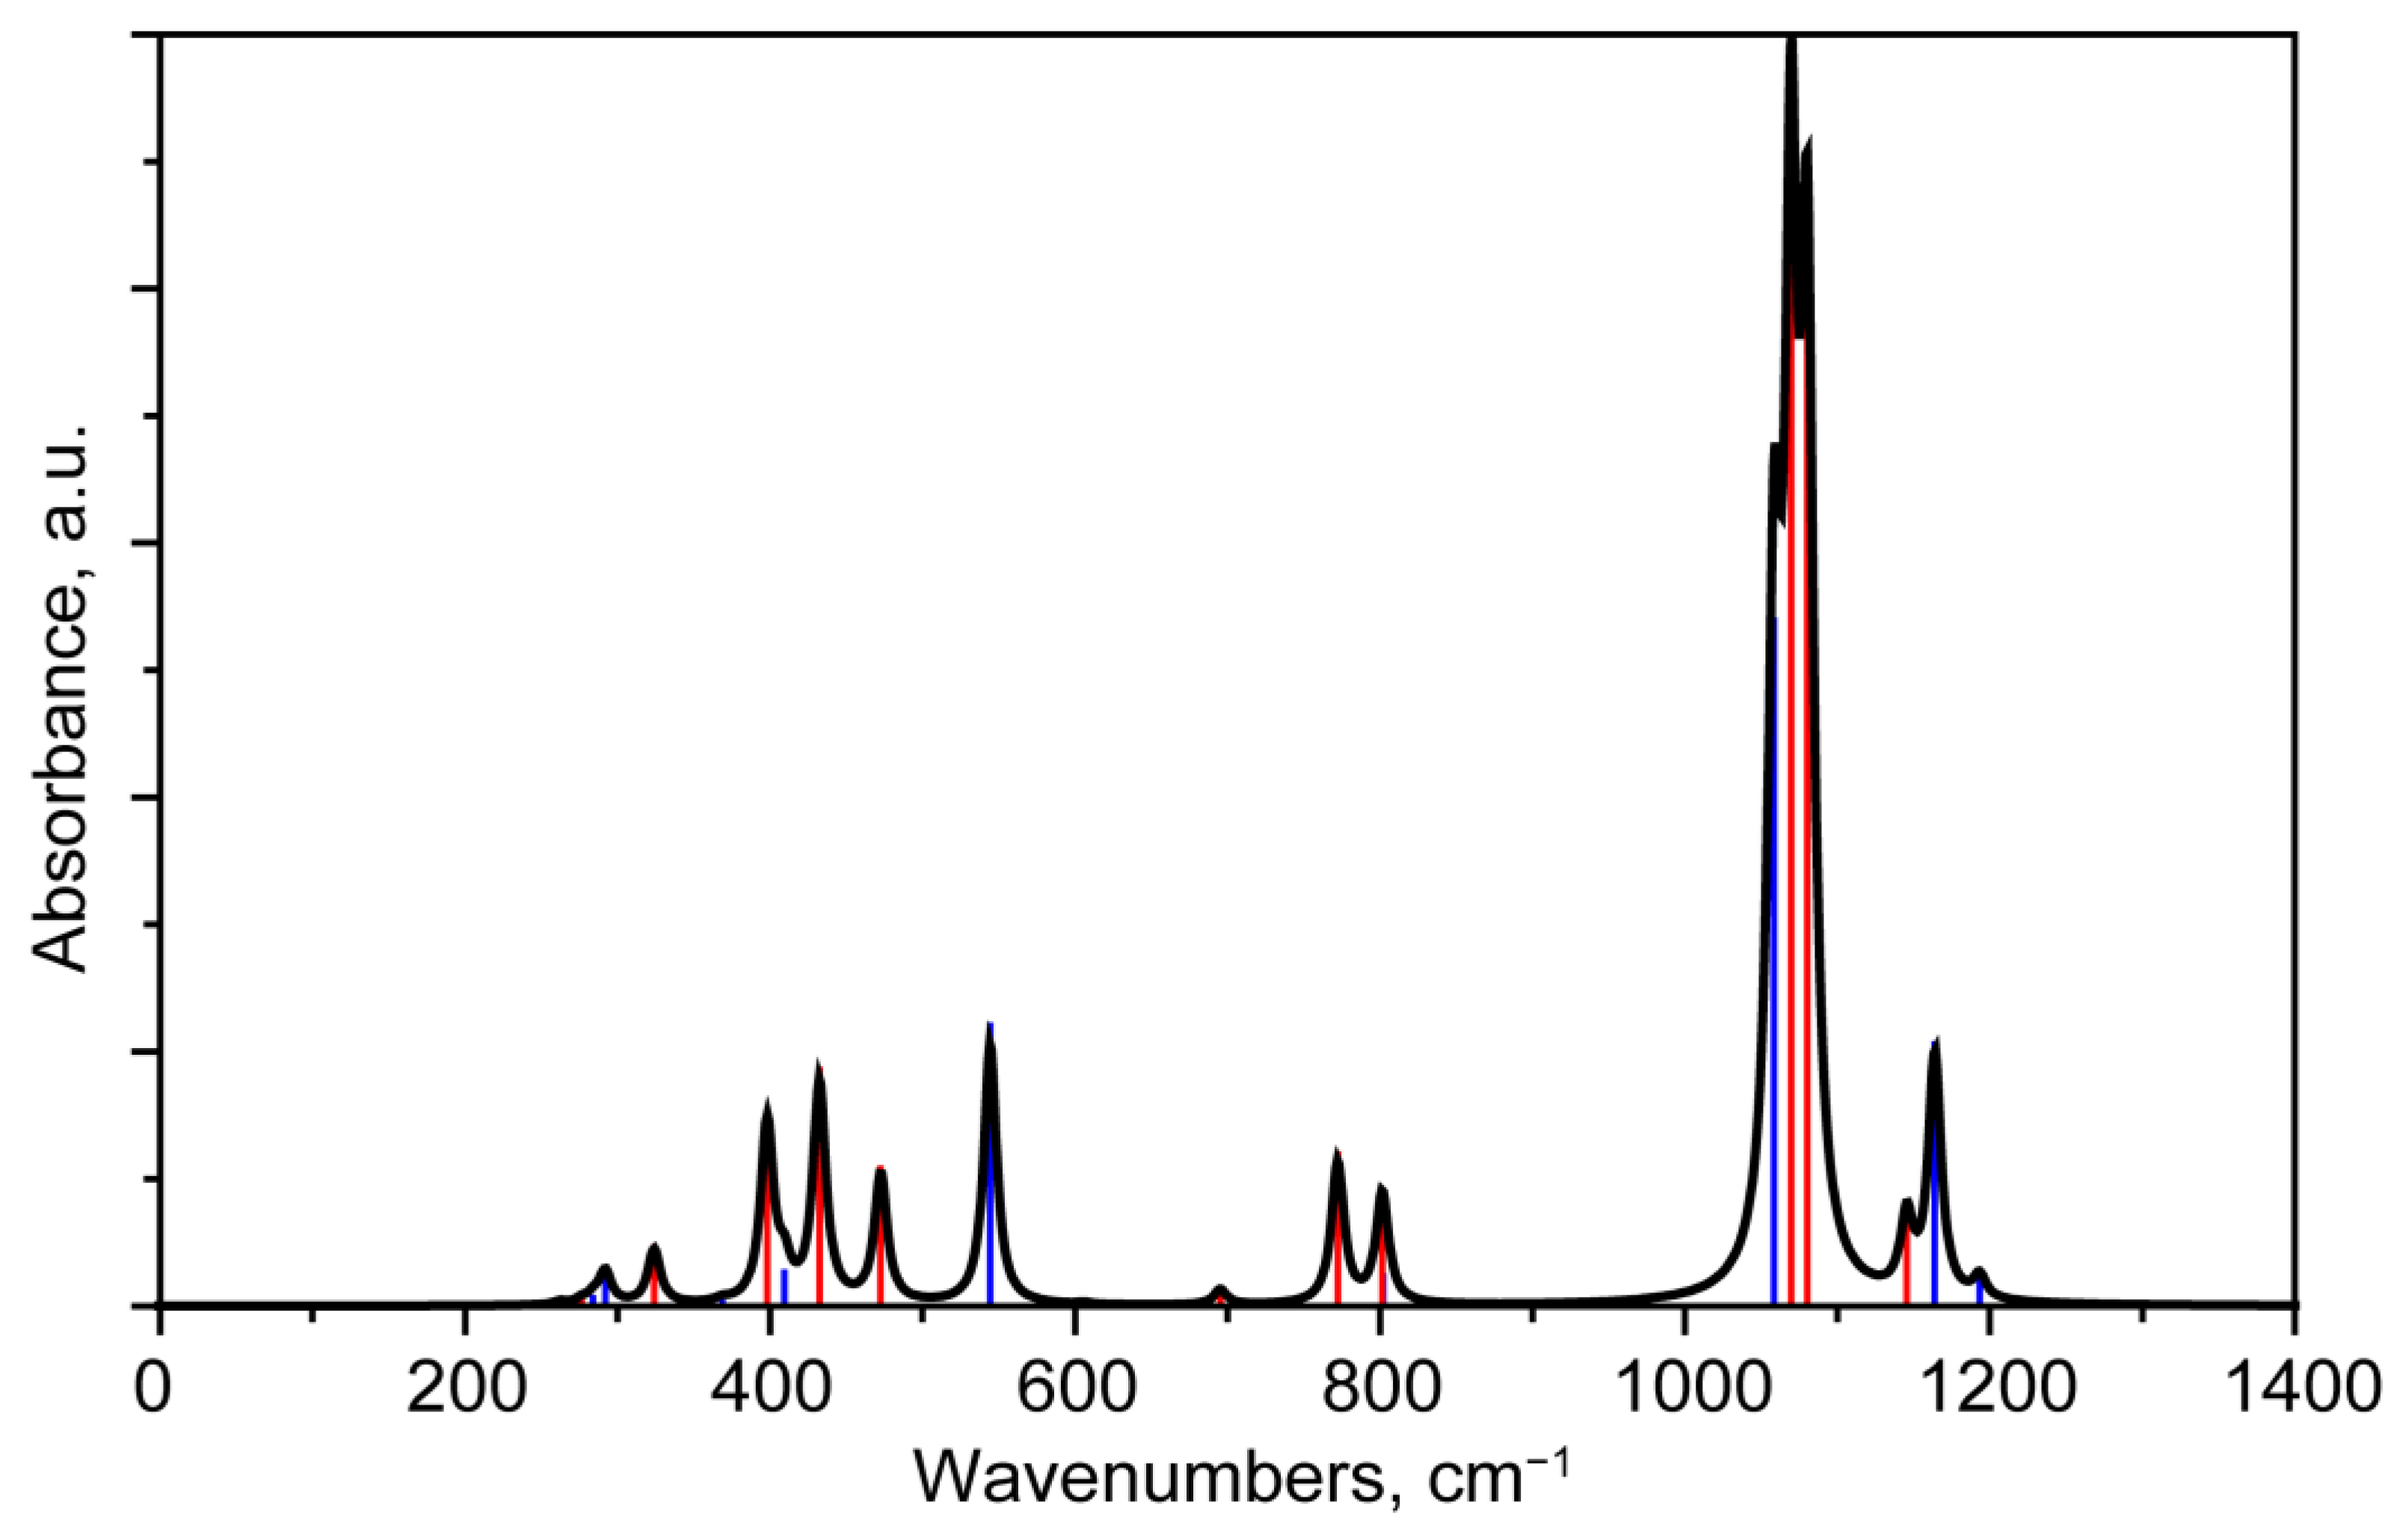
3.2.3. Interpretation of the IR Absorption Spectra

In the IR absorption spectrum of moganite, vibrational modes occupy the range from 160 to 1200 cm−1 (see Table 4 and Figure 4). It contains contributions of 12 Au modes and 12 Bu modes. The Au modes are polarized in the direction of the b axis, while the polarization vectors of the Bu modes lie in the ac plane.
Unlike Raman spectra, in IR absorption spectra the most intense peaks are in the high-frequency part. These peaks correspond to the stretching vibrations of Si–O bonds. A similar picture is typical for many polymorphic modifications of SiO2. In the calculated spectrum of moganite, stretching vibration modes are located in the range 1058–1193 cm−1. Due to the finite width of the peaks in the experimental spectrum, they form a wide band in which the contribution from the three most IR-intense modes can be distinguished. Two of them belong to the Bu representation (1070 cm−1 and 1080 cm−1), and the third to the Au representation (1058 cm−1).
Analysis of the vibrational modes can be given on the basis of atomic displacements in chains consisting of fourth-fold rings. In this case, silicon atoms in a ring ordered along the c axis (perpendicular to the chain axis) can be considered as axial. On the other hand, the silicon atoms ordered along the a axis (along the chain axis) can be considered as equatorial. In some cases the displacements of oxygen atoms resemble the ν3 mode of a tetrahedral unit, which is why in some cases we use standard notation for the modes of a regular tetrahedron [49]—see Figure S2.
Atomic displacements in the Au 1058 cm−1 mode occur in zigzag-like axial silicon-oxygen chains located in the bc plane. The zigzag chains are directed along the b axis. Predominant atomic displacements are associated with antisymmetric water-like movements of oxygens.
In the Bu mode (1070 cm−1), atomic ν3 oscillations are localized in Si1 tetrahedra (see Figure 5b). The in-phase character of the local ν3 (Si1) deformations explains the high IR-activity of this mode. Atomic displacements in the Bu mode (1080 cm−1) can be represented as a combination of ν3 (S1 tetrahedra) and ν3 (Si2 tetrahedra) vibrations, polarized along the a and c axes, respectively (see Figure 5c). In Au modes (1164 cm−1 and 1194 cm−1), the ν3 vibrations are localized predominantly in the Si1 tetrahedra. Moreover, in the Au 1164 cm−1 mode, the local ν3 (Si1 tetrahedra) deformations are in-phase (see Figure 5d). In the Au (1194 cm−1) mode, the polarities of local ν3 deformations of neighboring Si1 tetrahedras are anti-phase (see Figure 5e), which explains the weak IR-activity of this mode. Atomic displacements in the Bu mode (1145 cm−1) can be represented as a combination of ν3 (Si1 tetrahedra) and ν1 (Si2 tetrahedra) vibrations (see Figure 5f). The large contribution of the nonpolar ν1 mode explains the weak IR-activity of this mode.
The ν3 mode of a SiO4 tetrahedron involves oscillations of both the peripheral O atoms and the central Si atom. When such tetrahedra are incorporated in a crystal lattice, the ν3 vibrations give rise to two types of phonons: in the former, the O atoms oscillate predominantly, while in the latter, the Si atoms oscillate with the largest amplitudes. Due to the difference in the masses of the O and Si atoms, the frequencies of the two types of phonons are noticeably different. The frequencies of higher-frequency phonons of the first type lie in the range 1060–1190 cm−1. We reviewed them above. The frequencies of phonons of the second type (associated with oscillations of Si atoms) lie in the range of 700–800 cm−1. This division of phonon modes, consisting of ν3 vibrations of tetrahedra, into two types—with predominant oscillations of O and Si atoms—occurs in the phonon spectra of all SiO2 polymorphs, the structure of which is formed by SiO4 tetrahedra [50,51].
In this range, our calculation predicts one Au mode (802 cm−1) and three Bu modes (695, 772 and 801 cm−1).
For the Au mode (802 cm−1), significant atomic displacements occur in axial Si atoms forming a chain of four-fold rings. Inside each ring, the displacements of both axial atoms are in phase. On the other hand, axial silicon atoms in adjacent rings move in antiphase (see Figure S3a).
For the Bu mode (695 cm−1), the largest atomic displacements are associated with the equatorial silicon atoms (see Figure S3a). They occur in the ac plane, being predominantly directed along the c axis—see Figure S3b.
For the Bu (772 cm−1) and Bu (801 cm−1) modes, complex atomic displacements of various silicon atoms were noted (see Figure S3c,d). In this case, stretching occurs on one side of the four-fold ring and compression on the other, and vice versa along the a-axis. The atomic displacements of equatorial and axial silicon are comparable. This leads to close frequencies for both modes. Small differences in frequencies are still associated with slightly larger displacements of equatorial silicon in the case of the Bu mode (772 cm−1) and slightly larger displacements of axial silicon in the case of the Bu mode (801 cm−1). Similar frequency value relations were noted for Bu (695 cm−1) and Au (802 cm−1) modes.
The frequency range of ~500 cm−1 includes modes in which O atoms oscillate along the bisectors of the Si–O–Si angles. Such modes are usually called vs(Si–O–Si). One of these modes (Ag 494 cm−1) dominates in the Raman spectrum (see above), while others exhibit significant activity in the IR spectrum. Of these modes, Au 544 cm−1 has the highest IR activity. Such high IR activity occurs due to the tensile deformation in one half of the four-fold ring and compression deformation in another part. Such deformation occurs in the whole chain with the antiphase motions in the adjacent rings (see Figure S4).
In the IR spectrum below 400 cm−1, there are peaks corresponding to different modes, which are different combinations of bending vibrations of SiO4 tetrahedra.

3.3. Comparison of Quartz and Moganite Vibrational Spectra

The presence of moganite as inclusions with other polymorphs of SiO2 has been noted both in samples of terrestrial origin [8,9,52] and in lunar meteorites [16]. Quite often, intergrowth occurs with α-quartz, especially for samples less than 100 Ma old [9]. The investigation of moganite/quartz mixtures requires knowledge of the spectral features of both substances, which allows their identification. Subsequently, such spectral features can be used to construct calibration curves, with the help of which the concentration of moganite in the sample under study can be assessed. In this regard, in this section, the vibrational spectra of the two crystals are discussed and compared. To do this, in addition to studying the properties of moganite, we simulated the structure and vibrational spectrum for α-quartz (see Table S1) using the same calculation method.

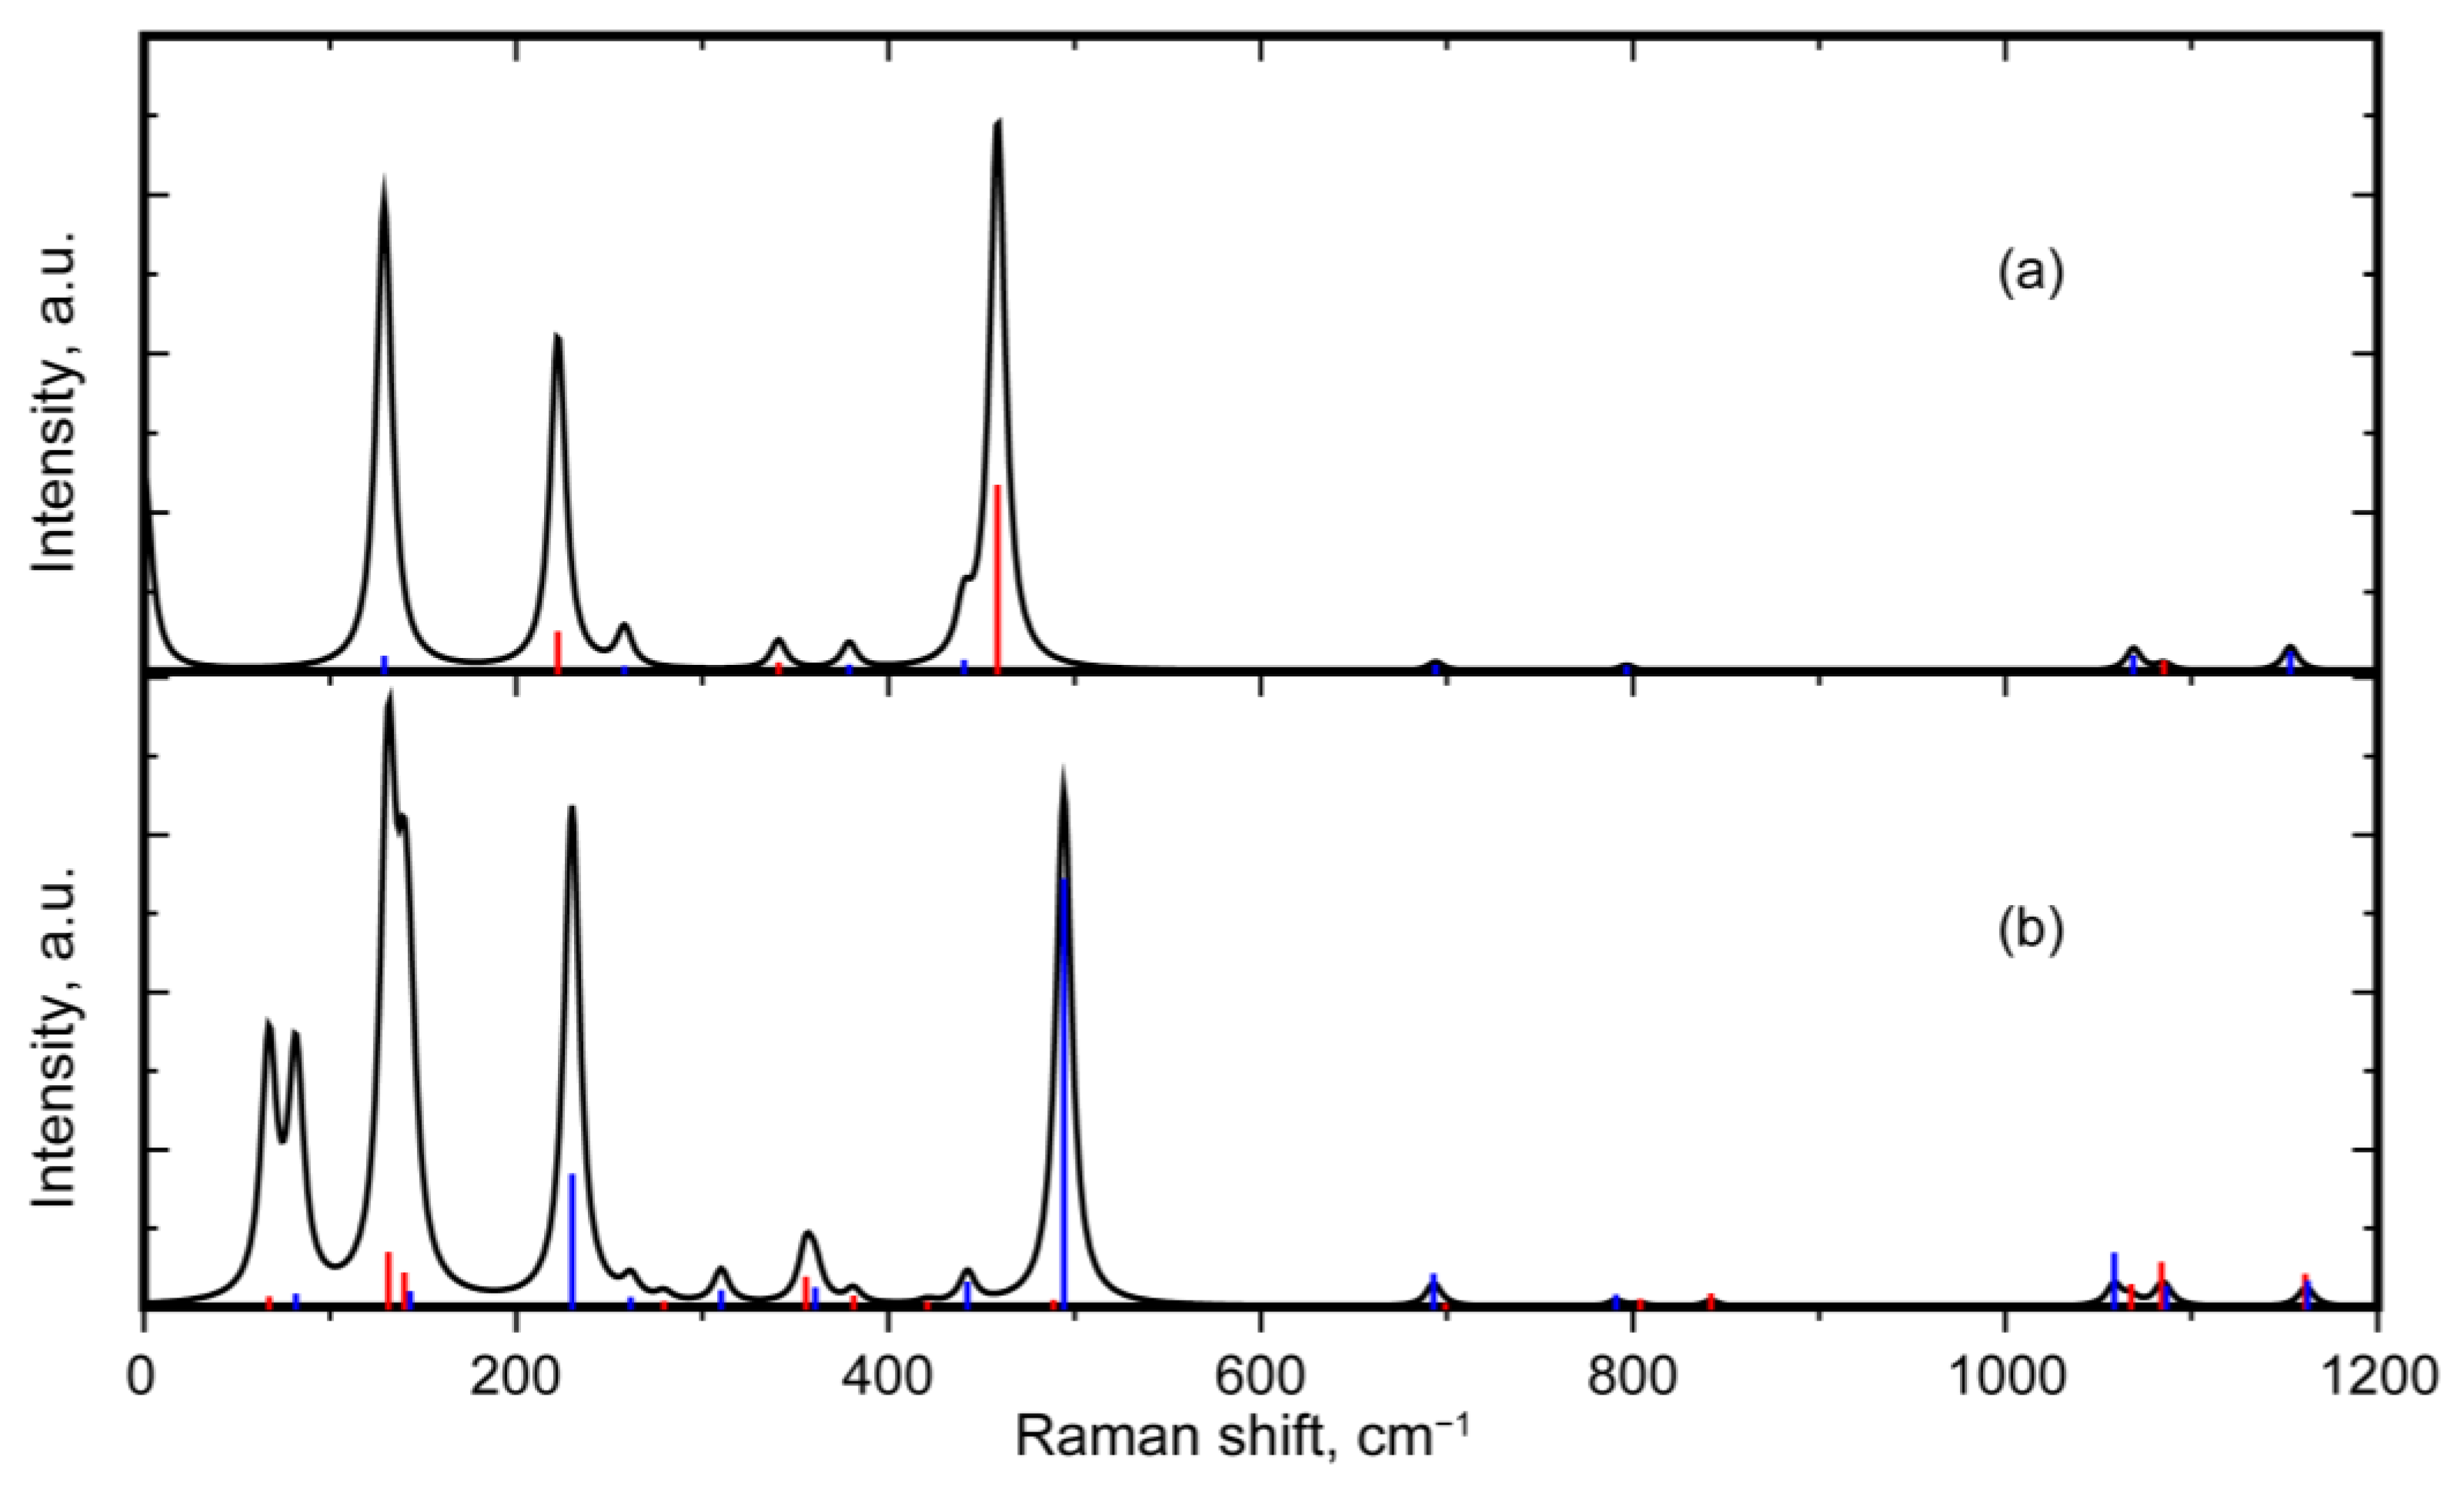
3.3.1. Comparison of Raman Spectra

In the Raman spectrum of moganite, two features can be noted that distinguish it from the spectrum of quartz. Firstly, both spectra contain intense peaks in the region of about 500 cm−1, but their frequency positions are noticeably different. Secondly, in the low-frequency region in the range of 65–85 cm−1, a noticeable doublet peak is present in the Raman spectrum of moganite, but such a feature is not observed in the spectrum of quartz (see Figure 6).
The peak around 500 cm−1 appears to be the most common way to identify moganite at relatively low concentrations. This peak has been used to identify small concentrations of moganite against a background of quartz in a number of applied works [9,11,13,19,20].
In this article, it is proposed to use the doublet peak corresponding to the Ag (82 cm−1) and Bg (67 cm−1) modes as an additional spectroscopic indicator of moganite. These modes should be observed experimentally, since their frequencies are not too low, and the Raman intensities, as predicted by calculations, are significant. At the same time, in the Raman spectrum of quartz, the lowest frequency line predicted by calculations and observed in experiments corresponds to mode E (129 cm−1) [50].
In other spectral ranges, the spectra of quartz and moganite overlap. When the moganite concentration in samples containing a quartz/moganite mixture varies, changes in the spectral contour are observed [7,21]. It becomes possible to identify the presence of moganite lines in this complex spectral picture only at high concentrations [7,20].

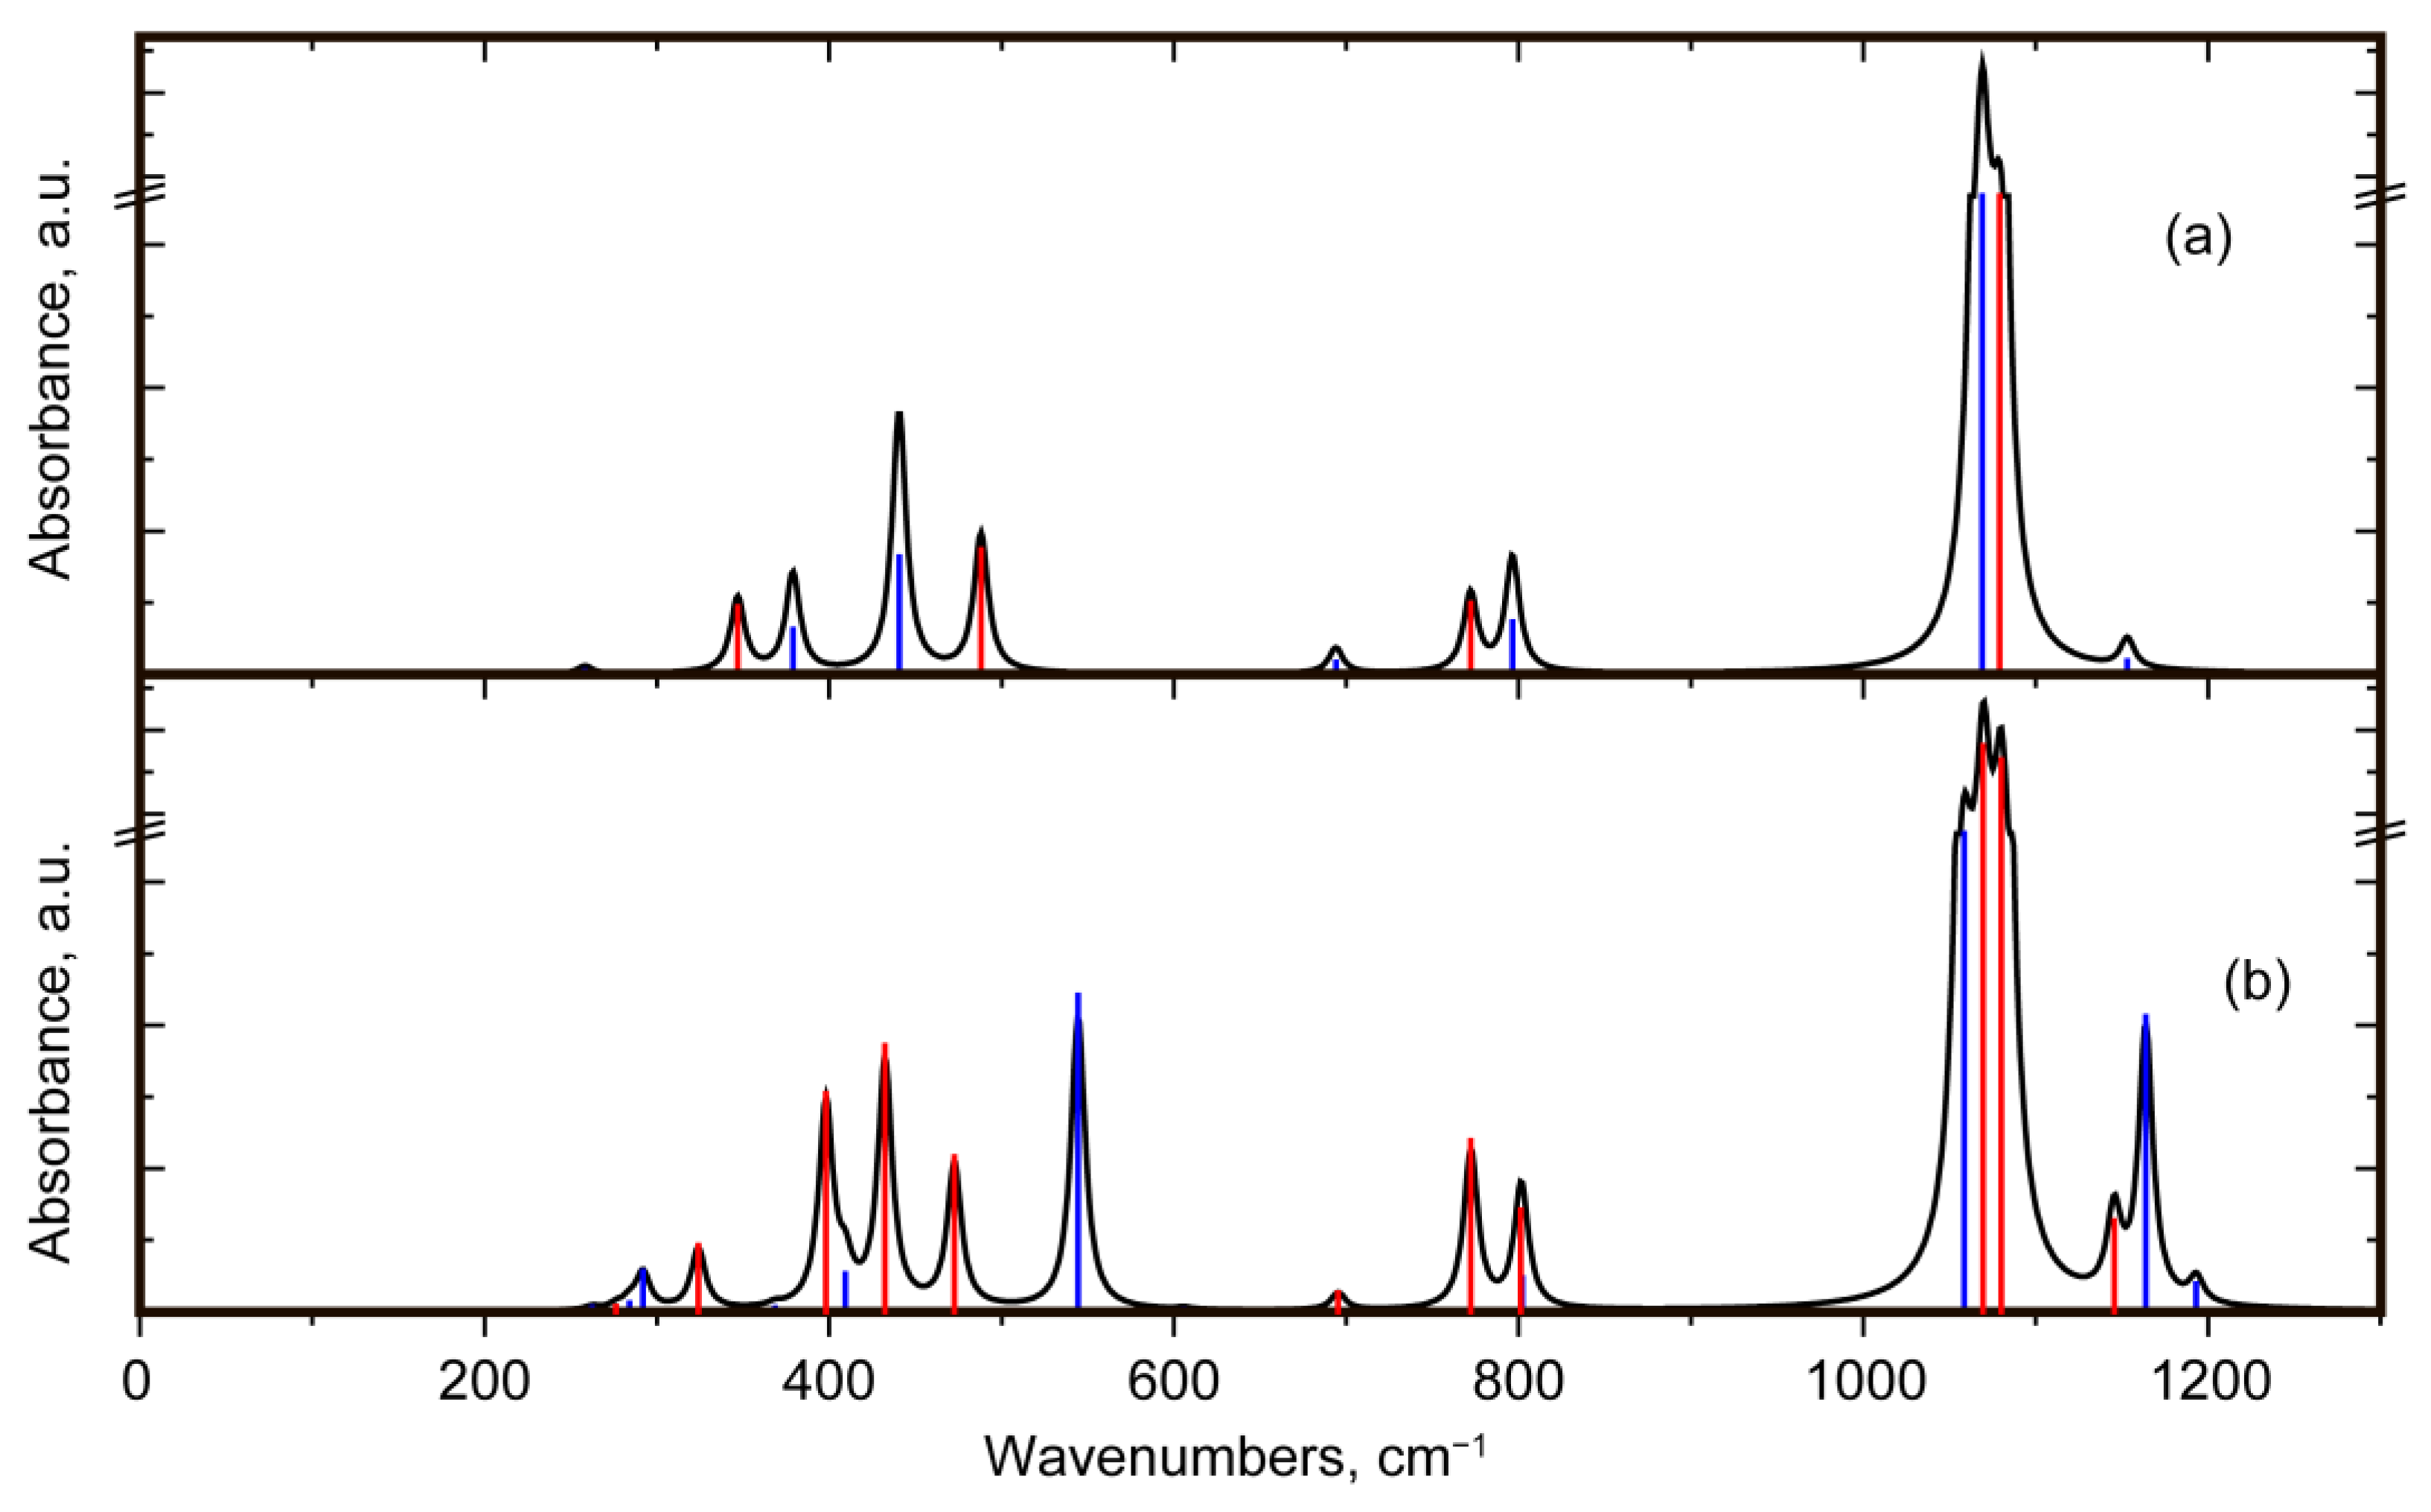
3.3.2. Comparison of IR Absorbance Spectra

A comparison of the IR absorption spectra of α-quartz and α-moganite is shown in Figure 7. It can be seen that in both calculated spectra, the most intense is a broad band in the region of Si–O stretching vibrations with a maximum around 1070 cm−1. In [18], the position of the most intense IR peak in the a-quartz spectrum has a slightly higher frequency and shifts to lower frequencies as the moganite fraction increases. In the calculation, this maximum in both spectra is located at the same frequency. However, in the moganite spectrum, this band is wider due to the appearance of the low-frequency shoulder associated with the splitting of the Au 1058 cm−1 mode.
On the side of the higher wavenumbers in the spectrum of moganite, one can note the Au peak at 1164 cm−1, which is slightly shifted relative to the E peak at 1153 cm−1 in the spectrum of a-quartz. In the experimental spectra [18], such a relatively small shift is not discernible on the background of a rather large line width. According to the calculation, as the transition from quartz to moganite occurs, a high-frequency shoulder appears (above 1161 cm−1). However, it should be noted that this shoulder will be noticeable only at rather high concentrations of moganite, since the relative intensity of the Au 1164 cm−1 mode is relatively low.
In the region of stretching vibrations with displacements of silicon atoms, the most intense peaks in the spectrum of moganite (773 (Bu) and 801 (Bu) cm−1) are close in frequency to the peaks in the spectrum of quartz (796 (E) and 772 (A2) cm−1). When the concentration of moganite changes, they smoothly transform into each other. However, it can be noted that the intensity ratio in the pairs of these peaks for moganite and quartz is different, which is reflected in the experiment [18]. This suggests the possibility of using the intensity ratio of these peaks to estimate the moganite fraction.
Much more significant differences in the IR absorption spectra are noted in the region of bending vibrations, which is consistent with the conclusion of [18]. In this spectral range, the highest frequency mode is Au (544 cm−1), which corresponds to the line observed in the samples with a high content of moganite [5,18,22] in the region of 570–576 cm−1, and in the samples with different concentration in the region of 554–576 cm−1 [18].
In general, in the range of deformation vibrations, the calculated frequencies are lower than the experimental ones. However, both calculations and experiments predict a difference in the frequency position of a pair of modes in the spectrum of quartz (347 (A2) and 379 (E) cm−1) and a pair of modes in the spectrum of moganite (292 (Au) and 394 (Bu) cm−1)—see Figure 7. The intensity ratios of these peaks can be used to determine the relative concentration of moganite in a quartz/moganite mixture.
In the range of 395–520 cm−1, the modes of two crystals predicted by calculation strongly overlap, which, together with their broadening in the experiment, makes it impossible to decompose the full spectrum into the spectra of two components.

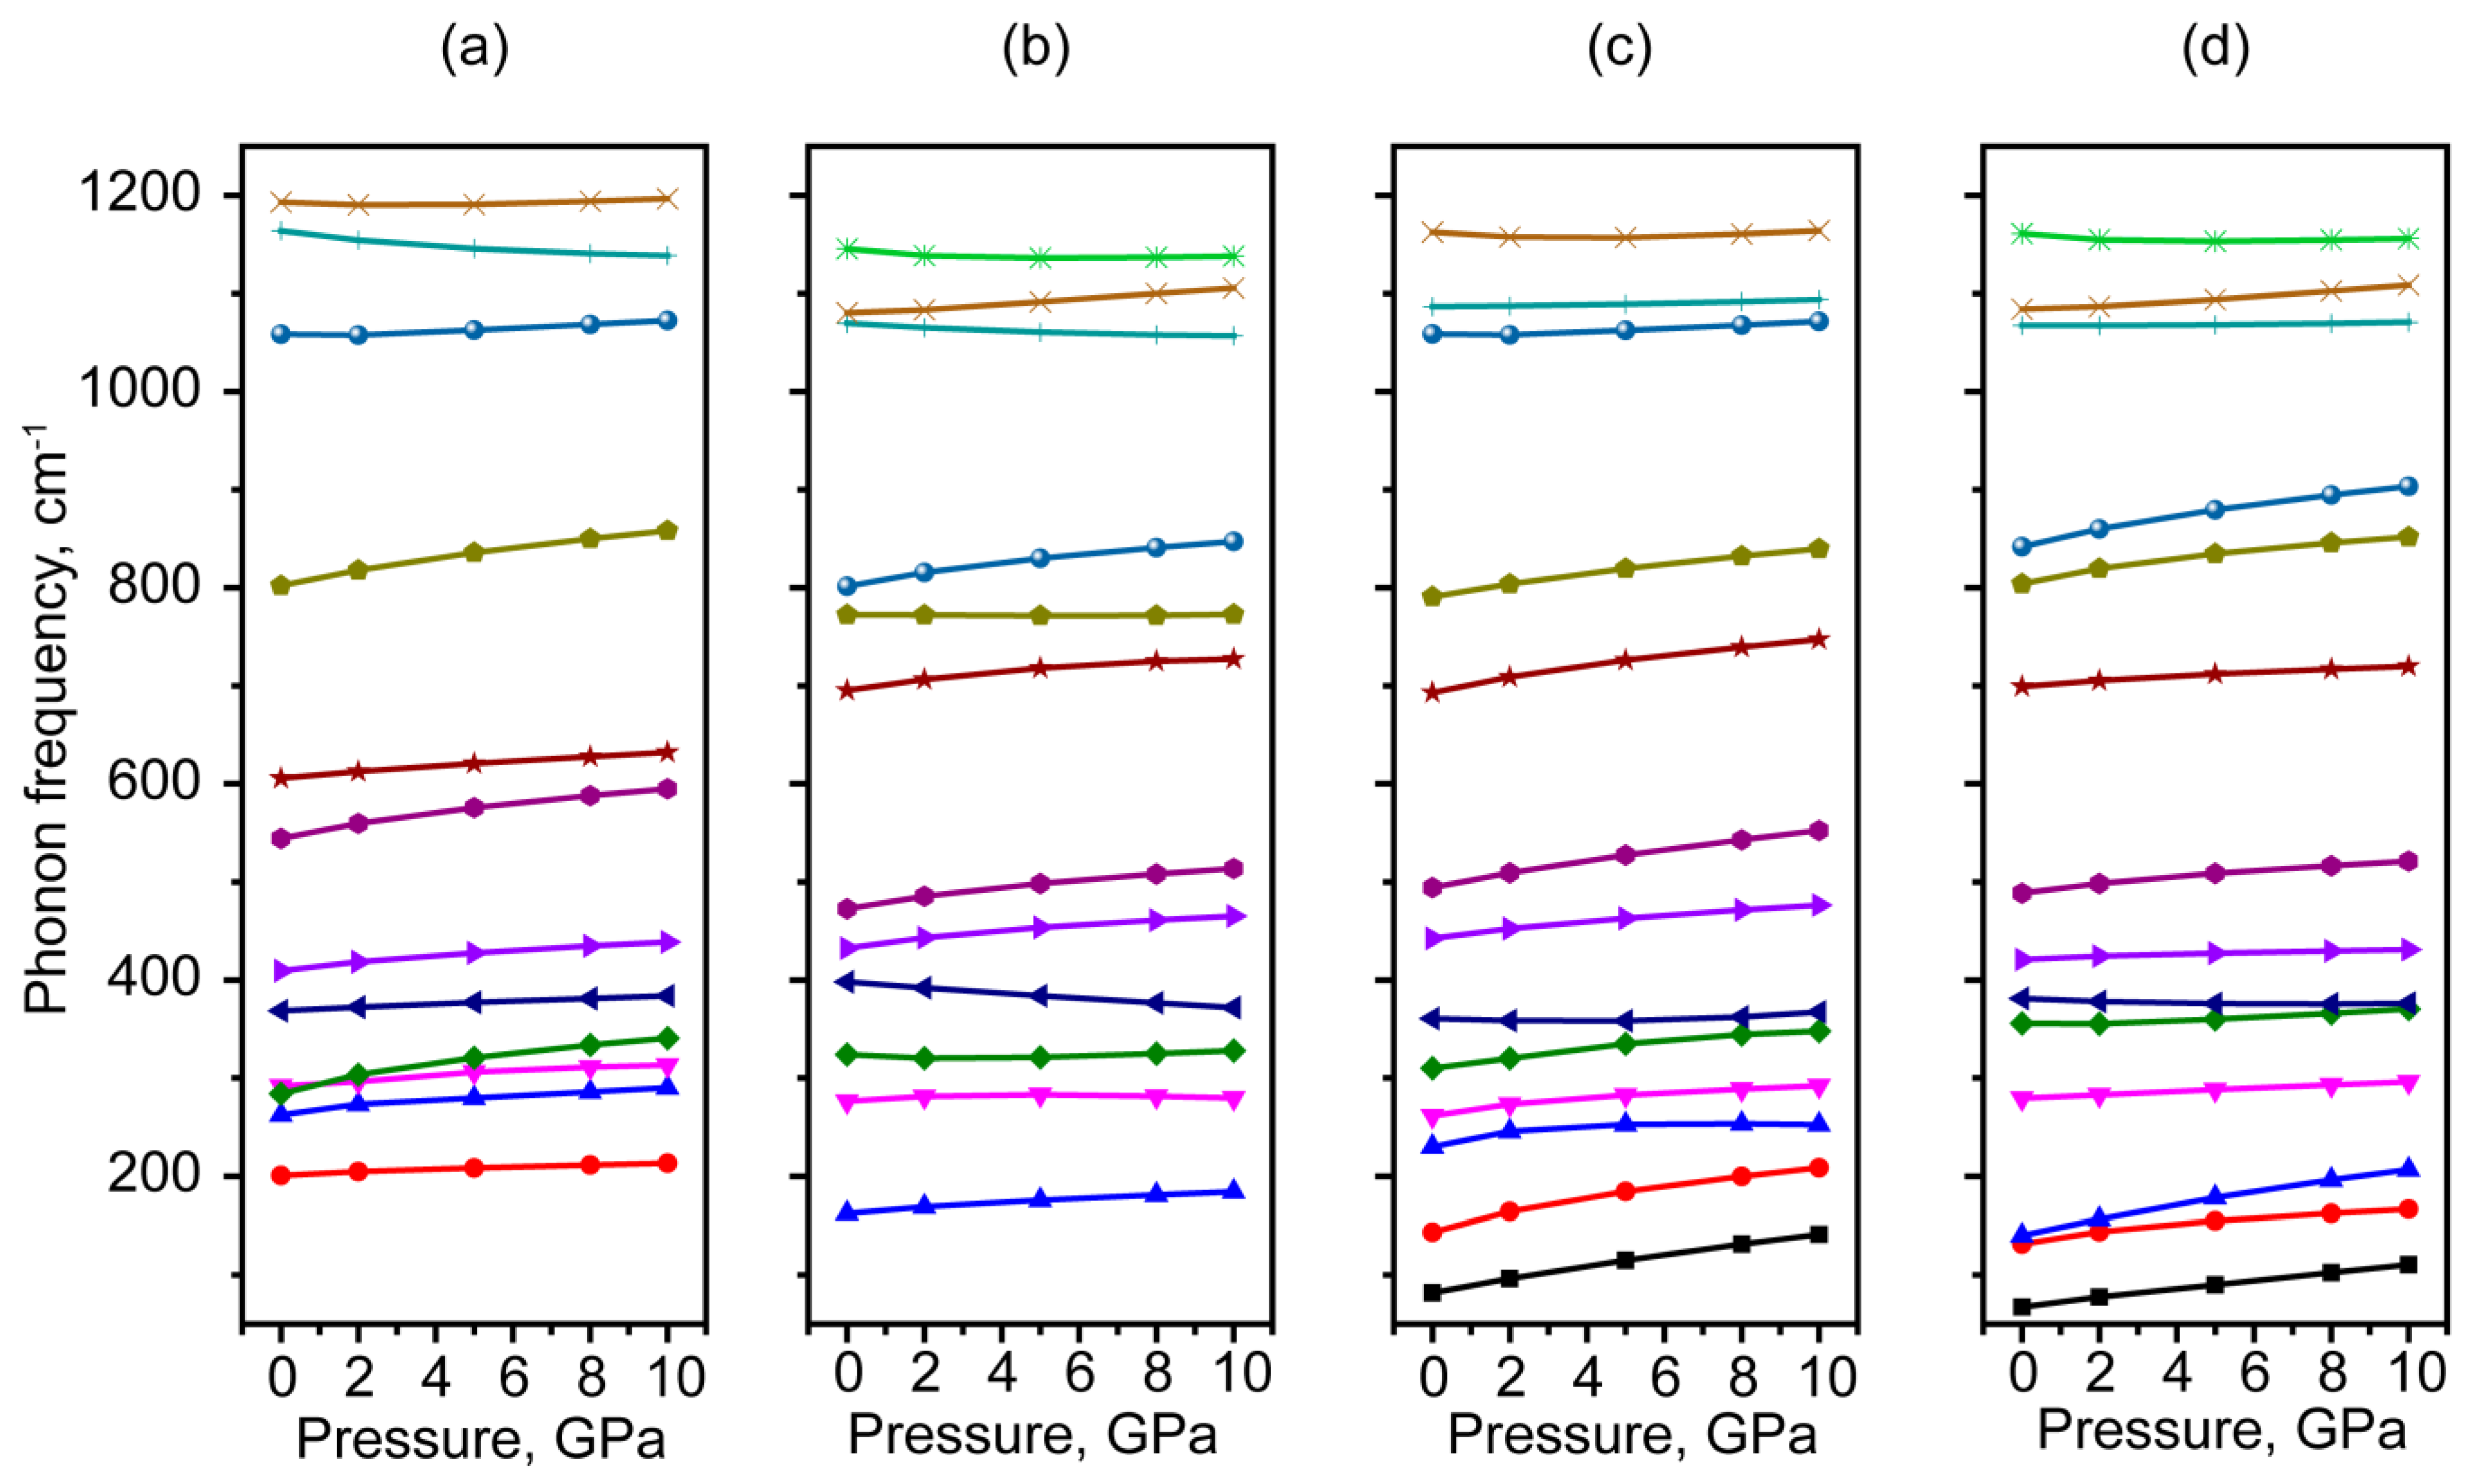
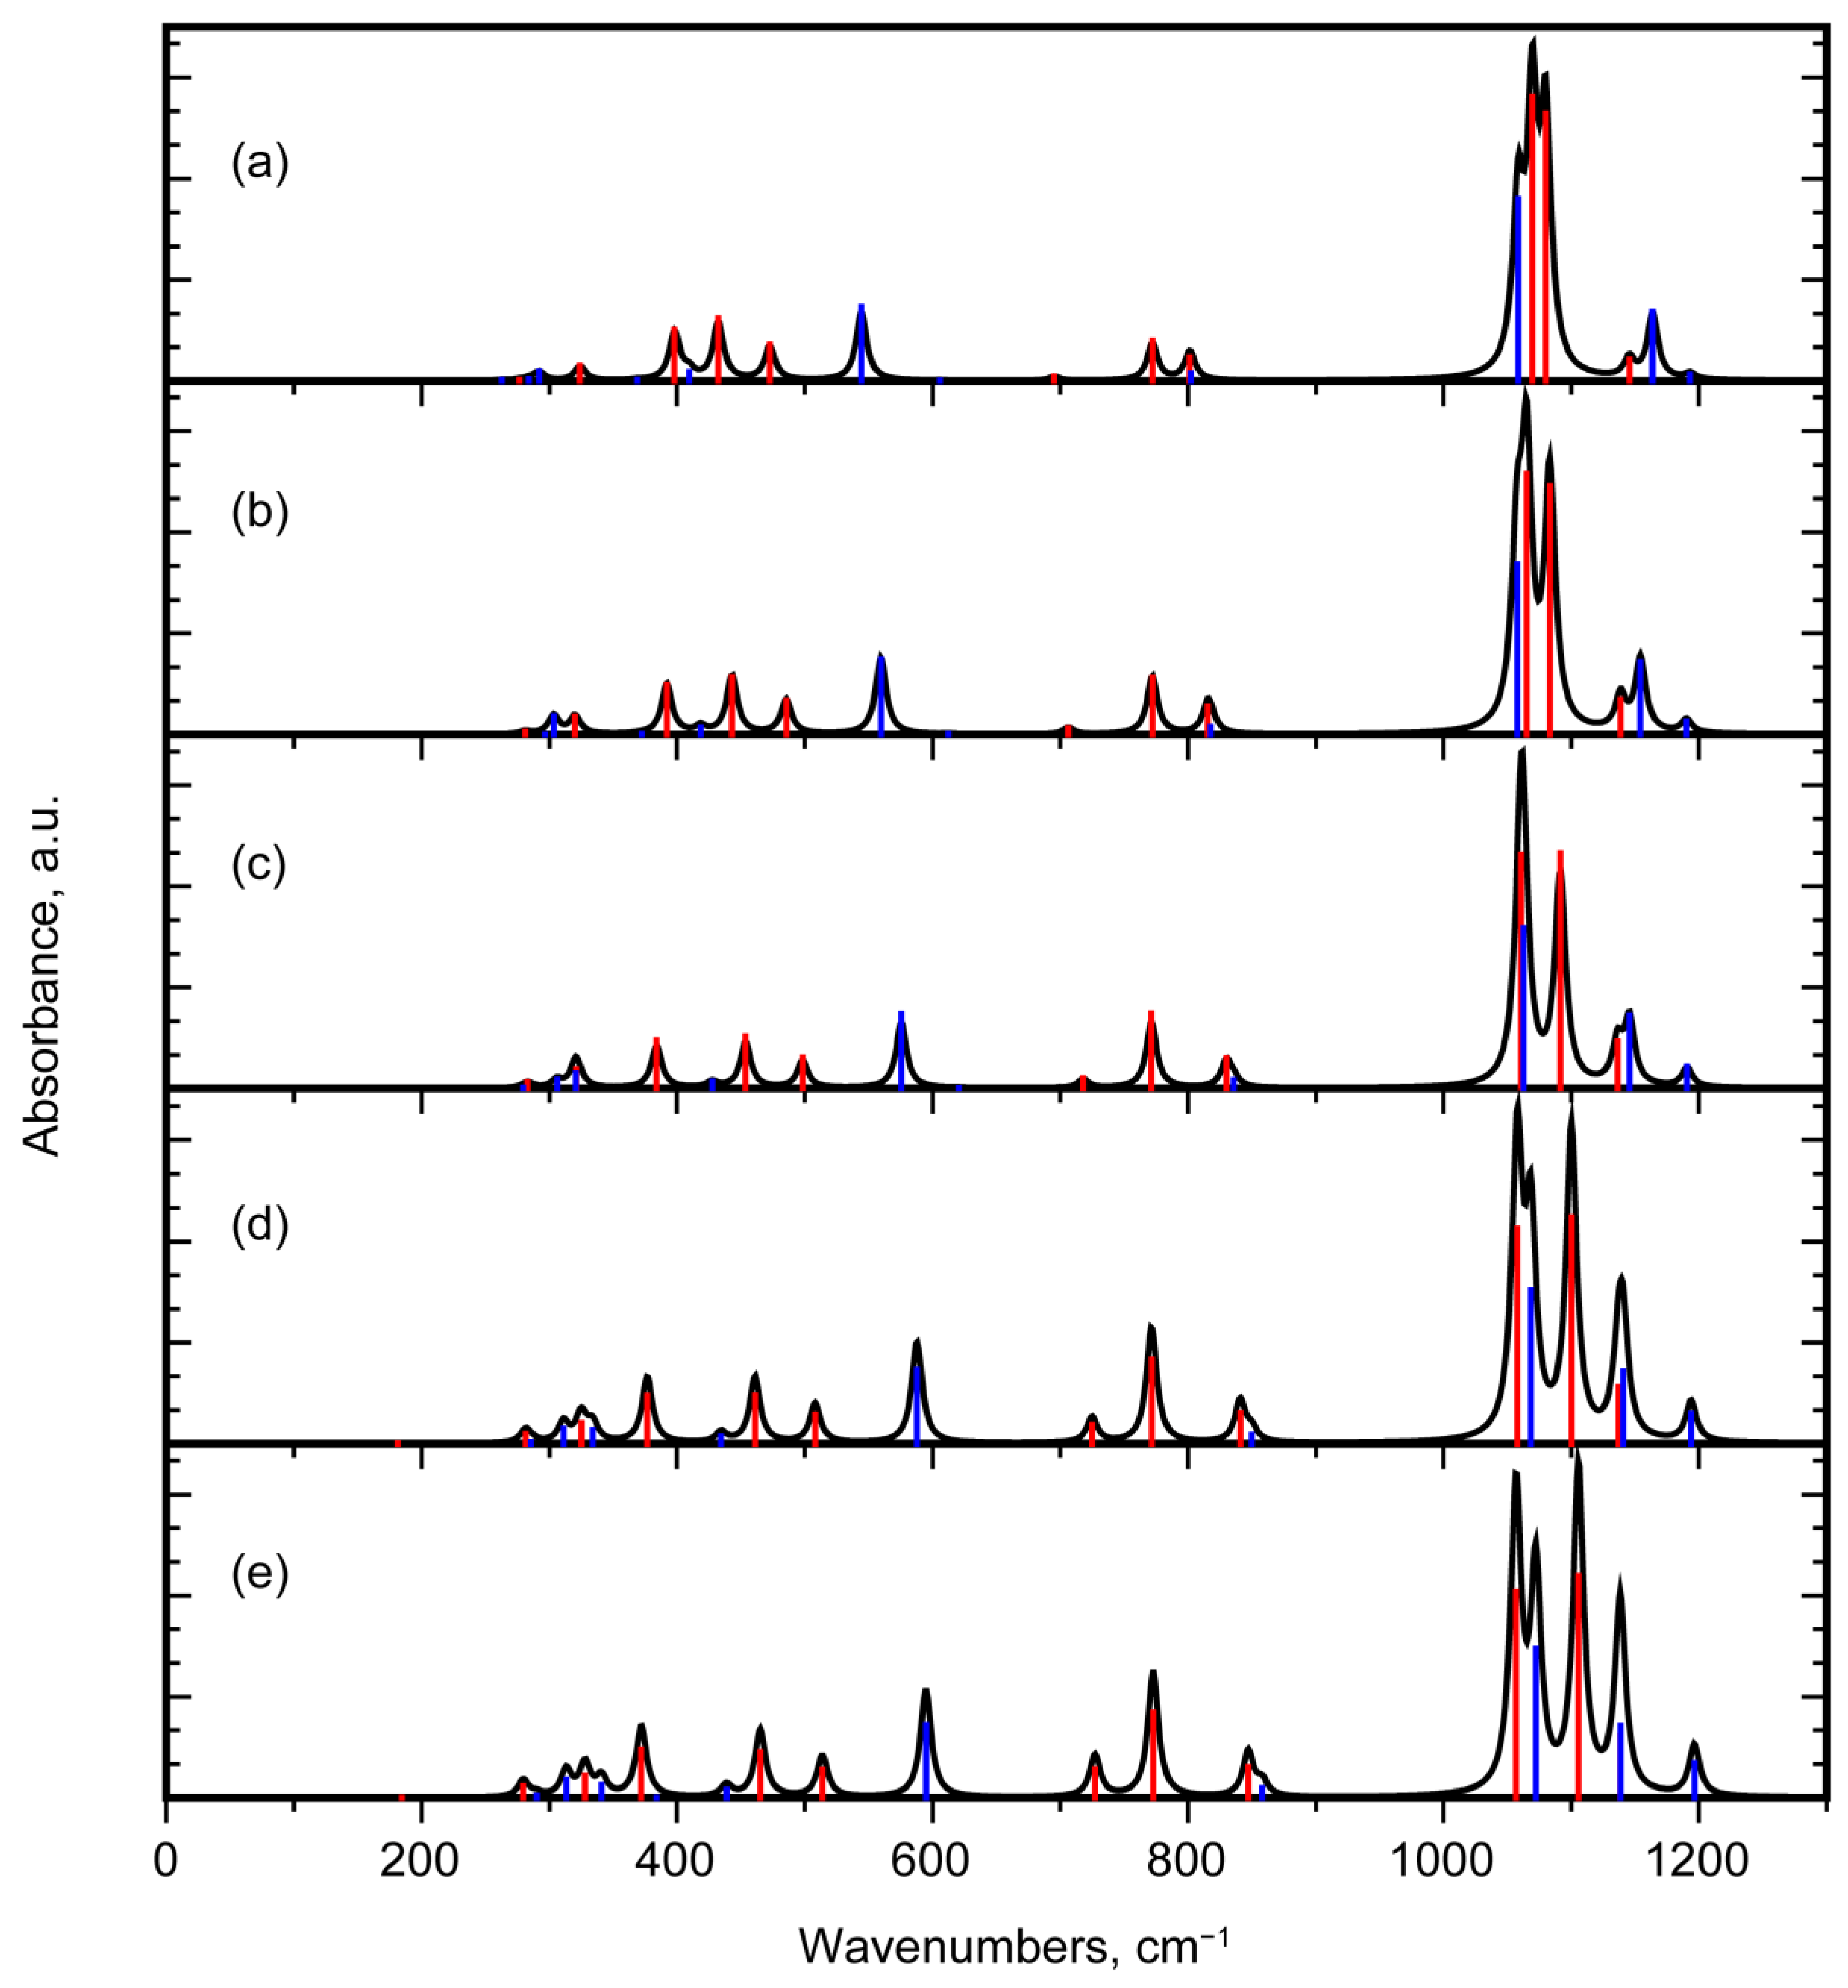
3.4. Vibrational Properties of Moganite under Pressure

Due to the fact that moganite very often occurs in the form of inclusions in other SiO2 polymorphs, stresses caused by compression or tension at grain boundaries can occur. This should lead to a shift in the peaks in the Raman and IR absorption spectra. To assess possible shifts, the structure and vibrational spectra of moganite were studied under hydrostatic pressure up to 25 GPa. For several values of external hydrostatic pressure, the crystal structure was optimized and the phonons at the Г point were calculated. The stability of the structure was tested by the absence of imaginary frequencies. The resulting dependence of the relative volume of a primitive cell on pressure is shown in Figure S5.
At the next stage, the spectrum of vibrational modes was calculated. The dependence of phonon frequencies on pressure in the range from 0 to 10 GPa is shown in Figure 8.
Most of the modes in the phonon spectrum of moganite under pressure exhibit normal behavior—their frequencies increase under pressure. Based on the calculation results, we estimated the value of the Grüneisen parameter for the most Raman-intense mode of Ag (494 cm−1), which is widely used as a spectroscopic fingerprint for moganite. The details of the calculation can be found in the supporting information (see Figure S6). The obtained isothermal value γ = 0.64 ± 0.02 turned out to be comparable with the isobaric value 0.75, which was obtained for this parameter from the temperature dependences of frequencies in [53].
For some IR-active modes of the stretching type (Au (1164cm−1), Bu (1145 cm−1), Bu (1070 cm−1)) and the deformation mode Bu (398 cm−1), a decrease in frequency with increasing pressure is observed. Thus, the different signs of the Grüneisen parameter for the Bu (1070 cm−1) and Bu (1080 cm−1) modes indicate that as pressure increases, one can expect splitting, or at least significant broadening, of the intense band observed in the IR absorption spectrum in the region of bond stretching vibrations. The calculated IR absorption spectra in the range of 0–10 GPa are shown in Figure 9.

4. Conclusions

It has been established that calculations using the DFT method in the LDA approximation confirm the stability of the moganite structure, as was previously proposed based on experimental data. The calculation method used in this work provides an estimate of the structural parameters that is mostly in good agreement (within 1–3%) with the experimental results. The calculated Raman and IR spectra are also consistent with the available experimental data. Based on the calculation results, an analysis of the vibrational modes responsible for various features in the experimental spectra was carried out.
Particular attention is paid to the search for spectral lines that can be used to identify moganite in samples of mixed composition quartz/moganite. Several such spectral fingerprints of moganite have been proposed. In the low-frequency part of the Raman spectrum (this region has not yet been studied experimentally), the calculation predicts the presence of peaks Ag (82 cm−1) and Bg (67 cm−1) that are absent in the spectrum of quartz. In the mid-frequency region, the spectroscopic fingerprint of moganite can present as an intense peak at about 500 cm−1 corresponding to a phonon of Ag symmetry.
Based on the analysis of atomic displacements, the interpretation of vibrational modes corresponding to the features in the IR absorption spectrum of moganite was carried out. It is noted that modes in the range of 280–345 cm−1 and 530–580 cm−1 can be used as characteristic modes for moganite in a mixture quartz/moganite. Spectral lines are also marked and phonon modes are indicated, the relative intensities of which can be used to determine the concentrations of moganite in the mixtures.
The behavior of moganite under hydrostatic pressure was studied. It is shown that in the range of 0–10 GPa, the structure remains stable, and the intense high-frequency IR band of Bu symmetry splits. The frequency shifts of other spectral lines, including those characteristic of moganite, were assessed.

Supplementary Materials

The following supporting information can be downloaded at: https://www.mdpi.com/article/10.3390/photonics10121346/s1, Table S1: Comparison of selected experimental and theoretically calculated frequencies for α-quartz phonons [54]; Figure S1: Atomic displacements in conventional cell in Raman active Ag mode 229 cm−1; Figure S2: Standard notation for the modes of a regular tetrahedron: v1 (A1) (a), v2 (E) (b), v3 (F2) (c) and v4 (F2) (d); Figure S3: Atomic displacements in middle-frequency IR active modes: Au 802 cm−1 (a), Bu 695 cm−1 (b), Bu 772 cm−1 (c), Bu 801 cm−1 (d); Figure S4: Atomic displacements in Au 544 cm−1 mode; Figure S5: Dependence of the relative volume of moganite lattice on pressure; Figure S6: The dependence of the relative frequency of Ag (494 cm−1) mode on the relative volume (blue); the result of interpolation (red).

Author Contributions

Conceptualization, D.P., A.P. and M.S.; methodology, D.P. and M.S.; formal analysis, D.P., M.S., E.R., A.S., A.P. and I.K.; investigation, D.P., M.S., E.R. and A.S.; resources, M.S.; data curation, D.P. and M.S.; writing—original draft preparation, D.P. and M.S.; writing—review and editing, D.P., M.S., A.P. and I.K.; supervision, M.S.; project administration, M.S.; funding acquisition, D.P., M.S., E.R. and A.S. All authors have read and agreed to the published version of the manuscript.

Funding

The study was supported by grants from the Russian Science Foundation (project no. 22-22-20021) and from the Saint Petersburg Science Center (project no. 32/2022) using the resources of the Computing Center and the Center for Optical and Laser Materials Research at the Research Park of St. Petersburg State University.

Institutional Review Board Statement

Not applicable.

Informed Consent Statement

Not applicable.

Data Availability Statement

The data presented in this study are available from the corresponding author upon reasonable request.

Acknowledgments

The authors express their gratitude to the resource centers: “Optical and laser methods for studying matter” and “Computing center” of the Science Park of St. Petersburg State University.

Conflicts of Interest

The authors declare no conflict of interest.

References

  1. Borowicz, P.; Taube, A.; Rzodkiewicz, W.; Latek, M.; Gierałtowska, S. Raman Spectra of High-k Dielectric Layers Investigated with Micro-Raman Spectroscopy Comparison with Silicon Dioxide. Sci. World J. 2013, 2013, 208081. [Google Scholar] [CrossRef] [PubMed]
  2. Smirnov, M.; Roginskii, E.; Savin, A.; Mazhenov, N.; Pankin, D. Density-Functional Study of the Si/SiO2 Interfaces in Short-Period Superlattices: Structures and Energies. Coatings 2023, 13, 1231. [Google Scholar] [CrossRef]
  3. Lee, S.; Xu, H.; Xu, H.; Neuefeind, J. Crystal Structure of Moganite and Its Anisotropic Atomic Displacement Parameters Determined by Synchrotron X-Ray Diffraction and X-Ray/Neutron Pair Distribution Function Analyses. Minerals 2021, 11, 272. [Google Scholar] [CrossRef]
  4. Flörke, O.W.; Jones, J.B.; Schmincke, H.-U. A New Microcrystalline Silica from Gran Canaria. Z. Krist. Cryst. Mater. 1976, 143, 156–165. [Google Scholar] [CrossRef]
  5. Miehe, G.; Graetsch, H. Crystal Structure of Moganite: A New Structure Type for Silica. Eur. J. Mineral. 1992, 4, 693–706. [Google Scholar] [CrossRef]
  6. Miehe, G.; Graetsch, H.; Florke, O.W. Crystal Structure and Growth Fabric of Length-Fast Chalcedony. Phys. Chem. Miner. 1984, 10, 197–199. [Google Scholar] [CrossRef]
  7. Kingma, K.J.; Hemley, R.J. Raman Spectroscopic Study of Microcrystalline Silica. Am. Mineral. 1994, 79, 269–273. [Google Scholar]
  8. Heaney, P.J.; McKeown, D.A.; Post, J.E. Anomalous Behavior at the I2/a to Imab Phase Transition in SiO2-Moganite: An Analysis Using Hard-Mode Raman Spectroscopy. Am. Mineral. 2007, 92, 631–639. [Google Scholar] [CrossRef]
  9. Hardgrove, C.; Rogers, A.D. Thermal Infrared and Raman Microspectroscopy of Moganite-Bearing Rocks. Am. Mineral. 2013, 98, 78–84. [Google Scholar] [CrossRef]
  10. Hatipoğlu, M. Moganite and Quartz Inclusions in the Nano-Structured Anatolian Fire Opals from Turkey. J. Afr. Earth Sci. 2009, 54, 1–21. [Google Scholar] [CrossRef]
  11. Casadio, F.; Daher, C.; Bellot-Gurlet, L. Raman Spectroscopy of Cultural Heritage Materials: Overview of Applications and New Frontiers in Instrumentation, Sampling Modalities, and Data Processing. Top. Curr. Chem. 2016, 374, 62. [Google Scholar] [CrossRef] [PubMed]
  12. Bersani, D.; Madariaga, J.M. Applications of Raman Spectroscopy in Art and Archaeology. J. Raman Spectrosc. 2012, 43, 1523–1528. [Google Scholar] [CrossRef]
  13. Povolotckaia, A.; Pankin, D.; Kurganov, N.; Borisov, E.; Grigorieva, I.; Kurochkin, A. Xiongnu Ancient Nomad Inlaid Buckles (2nd-1st Centuries BC): Multi-Analytical Research. J. Archaeol. Sci. Rep. 2023, 52, 104253. [Google Scholar] [CrossRef]
  14. Prado Figueroa, M.; Flores, L.; Sanchez, J.; Cesaretti, N. Biosilicification (chalcedony) in human cerebral cortex, hippocampus and cerebellum from aged patients. Micron 2008, 39, 859–867. [Google Scholar] [CrossRef] [PubMed]
  15. Çetin, A.; Okutan, M.; İçelli, O.; Yalçın, Z.; San, S.E.; Kibar, R.; Pesen, E. Electrical and optical properties of chalcedony and striped chalcedony. Vacuum 2013, 97, 75–80. [Google Scholar] [CrossRef]
  16. Kayama, M.; Nagaoka, H.; Niihara, T. Lunar and Martian Silica. Minerals 2018, 8, 267. [Google Scholar] [CrossRef]
  17. Moxon, T.; Ríos, S. Moganite and Water Content as a Function of Age in Agate: An XRD and Thermogravimetric Study. Eur. J. Mineral. 2004, 16, 269–278. [Google Scholar] [CrossRef]
  18. Zhang, M.; Moxon, T. Infrared Absorption Spectroscopy of SiO2-Moganite. Am. Mineral. 2014, 99, 671–680. [Google Scholar] [CrossRef]
  19. Sitarz, M.; Wyszomirski, P.; Handke, B.; Jeleń, P. Moganite in Selected Polish Chert Samples: The Evidence from MIR, Raman and X-Ray Studies. Spectrochim. Acta A Mol. Biomol. Spectrosc. 2014, 122, 55–58. [Google Scholar] [CrossRef]
  20. Schmidt, P.; Bellot-Gurlet, L.; Leá, V.; Sciau, P. Moganite Detection in Silica Rocks Using Raman and Infrared Spectroscopy. Eur. J. Mineral. 2014, 25, 797–805. [Google Scholar] [CrossRef]
  21. Rodgers, K.A.; Cressey, G. The Occurrence, Detection and Significance of Moganite (SiO2) among Some Silica Sinters. Mineral. Mag. 2001, 65, 157–167. [Google Scholar] [CrossRef]
  22. Parthasarathy, G.; Kunwar, A.C.; Srinivasan, R. Occurrence of Moganite-Rich Chalcedony in Deccan Flood Basalts, Killari, Maharashtra, India. Eur. J. Mineral. 2001, 13, 127–134. [Google Scholar] [CrossRef]
  23. Zhang, M.; Moxon, T. In Situ Infrared Spectroscopic Studies of OH, H2O and CO2 in Moganite at High Temperatures. Eur. J. Mineral. 2012, 24, 123–131. [Google Scholar] [CrossRef]
  24. Götze, J.; Nasdala, L.; Kleeberg, R.; Wenzel, M. Occurrence and Distribution of “Moganite” in Agate/Chalcedony: A Combined Micro-Raman, Rietveld, and Cathodoluminescence Study. Contrib. Mineral. Petrol. 1998, 133, 96–105. [Google Scholar] [CrossRef]
  25. Squyres, S.W.; Arvidson, R.E.; Ruff, S.; Gellert, R.; Morris, R.V.; Ming, D.W.; Crumpler, L.; Farmer, J.D.; Des Marais, D.J.; Yen, A.; et al. Detection of Silica-Rich Deposits on Mars. Science 2008, 320, 1063–1067. [Google Scholar] [CrossRef] [PubMed]
  26. Hantsch, U.; Winkler, B.; Pickard, C.J.; Gale, J.D.; Warren, M.C.; Milman, V.; Mauri, F. Theoretical Investigation of Moganite. Eur. J. Mineral. 2005, 17, 21–30. [Google Scholar] [CrossRef]
  27. Güler, E.; Uğur, G.; Uğur, Ş.; Güler, M. A Theoretical Study for the Band Gap Energies of the Most Common Silica Polymorphs. Chin. J. Phys. 2020, 65, 472–480. [Google Scholar] [CrossRef]
  28. Mehmood, S.; Ali, Z.; Altuijri, R.; El Maati, L.A.; Khan, S.R.; Trukhanov, S.V.; Zubar, T.I.; Sayyed, M.I.; Tishkevich, D.I.; Trukhanov, A.V. First-principles study of the rare earth anti-TH3P4 type zintles for opto-electronic and thermoelectric applications. Phys. B Condens. Matter 2023, 670, 415353. [Google Scholar] [CrossRef]
  29. Alharbi, F.F.; Mehmood, S.; Ali, Z.; Aman, S.; Khosa, R.Y.; Kostishyn, V.G.; Trukhanov, S.V.; Sayyed, M.I.; Tishkevich, D.I.; Trukhanov, A.V. First principles calculation to investigate the effect of Mn substitution on Cu site in CeCu 3− x Mn x V 4 O 12 (x = 0, 1, 2 and 3) system. RSC Adv. 2023, 13, 12973–12981. [Google Scholar] [CrossRef]
  30. Guo, Z.A.; Xian, J.Y.; Rong, L.R.; Qin, H.; Jie, Z. Theoretical study of metal ion impact on geometric and electronic properties of terbutaline compounds. Monatshefte Für Chem.-Chem. Mon. 2019, 150, 1355–1364. [Google Scholar] [CrossRef]
  31. Zhao, D.; Liu, S.; Rong, C.; Zhong, A.; Liu, S. Toward Understanding the Isomeric Stability of Fullerenes with Density Functional Theory and the Information-Theoretic Approach. ACS Omega 2018, 3, 17986–17990. [Google Scholar] [CrossRef] [PubMed]
  32. Wang, K.; He, X.; Rong, C.; Zhong, A.; Liu, S.; Zhao, D. On the origin and nature of internal methyl rotation barriers: An information-theoretic approach study. Theor. Chem. Acc. 2022, 141, 68. [Google Scholar] [CrossRef]
  33. Ceperley, D.M.; Alder, B.J. Ground State of the Electron Gas by a Stochastic Method. Phys. Rev. Lett. 1980, 45, 566–569. [Google Scholar] [CrossRef]
  34. Perdew, J.P. Jacob’s Ladder of Density Functional Approximations for the Exchange-Correlation Energy. AIP Conf. Proc. 2001, 577, 1–20. [Google Scholar] [CrossRef]
  35. Clark, S.J.; Segall, M.D.; Pickard, C.J.; Hasnip, P.J.; Probert, M.I.J.; Refson, K.; Payne, M.C. First Principles Methods Using CASTEP. Z. Kristallogr. Cryst. Mater. 2005, 220, 567–570. [Google Scholar] [CrossRef]
  36. Refson, K.; Tulip, P.R.; Clark, S.J. Variational Density-Functional Perturbation Theory for Dielectrics and Lattice Dynamics. Phys. Rev. B 2006, 73, 155114. [Google Scholar] [CrossRef]
  37. Aarons, J. A New CASTEP and Onetep Geometry Optimiser, 2011. Available online: http://www.hector.ac.uk/cse/distributedcse/reports/castep-geom/castep-geom/HTML/dCSE_project.html (accessed on 29 October 2023).
  38. Monkhorst, H.J.; Pack, J.D. Special Points for Brillouin-Zone Integrations. Phys. Rev. B 1976, 13, 5188–5192. [Google Scholar] [CrossRef]
  39. Gonze, X.; Lee, C. Dynamical Matrices, Born Effective Charges, Dielectric Permittivity Tensors, and Interatomic Force Constants from Density-Functional Perturbation Theory. Phys. Rev. B 1997, 55, 10355–10368. [Google Scholar] [CrossRef]
  40. Baroni, S.; Giannozzi, P.; Testa, A. Green’s-Function Approach to Linear Response in Solids. Phys. Rev. Lett. 1987, 58, 1861–1864. [Google Scholar] [CrossRef]
  41. Binggeli, N.; Chelikowsky, J.R. Elastic instability in α-quartz under pressure. Phys. Rev. Lett. 1992, 69, 2220–2223. [Google Scholar] [CrossRef]
  42. Hu, Q.Y.; Shu, J.-F.; Yang, W.G.; Park, C.; Chen, M.W.; Fujita, T.; Sheng, H.W. Stability limits and transformation pathways of α -quartz under high pressure. Phys. Rev. B 2017, 95, 104112. [Google Scholar] [CrossRef]
  43. Jmol: An Open-Source Java Viewer for Chemical Structures in 3D. Available online: https://Jmol.Sourceforge.Net/ (accessed on 29 October 2023).
  44. Heaney, P.J.; Post, J.E. Evidence for an I2/a Phase Transition in the Silica Polymorph Moganite at ~570 K. Am. Mineral. 2001, 86, 1358–1366. [Google Scholar] [CrossRef]
  45. Scott, J.F.; Porto, S.P.S. Longitudinal and Transverse Optical Lattice Vibrations in Quartz. Phys. Rev. 1967, 161, 903–910. [Google Scholar] [CrossRef]
  46. Shi, Y.; Neuefeind, J.; Ma, D.; Page, K.; Lamberson, L.A.; Smith, N.J.; Tandia, A.; Song, A.P. Ring Size Distribution in Silicate Glasses Revealed by Neutron Scattering First Sharp Diffraction Peak Analysis. J. Non Cryst. Solids 2019, 516, 71–81. [Google Scholar] [CrossRef]
  47. Salh, R. Defect Related Luminescence in Silicon Dioxide Network: A Review. In Crystalline Silicon-Properties and Uses; InTech: Rijeka, Croatia, 2011. [Google Scholar]
  48. Long, D.A. The Raman Effect; John Wiley & Sons Ltd.: Hoboken, NJ, USA, 2002. [Google Scholar]
  49. Kolesov, B.A.; Geiger, C.A. Molecules in the SiO2-Clathrate Melanophlogite: A Single-Crystal Raman Study. Am. Mineral. 2004, 88, 1364–1368. [Google Scholar] [CrossRef]
  50. Etchepare, J.; Merian, M.; Smetankine, L. Vibrational Normal Modes of SiO2. I. α and β Quartz. J. Chem. Phys. 1974, 60, 1873–1876. [Google Scholar] [CrossRef]
  51. Etchepare, J.; Merian, M.; Kaplan, P. Vibrational Normal Modes of SiO2. II. Cristobalite and Tridymite. J. Chem. Phys. 1978, 68, 1531–1537. [Google Scholar] [CrossRef]
  52. Bustillo, M.Á.; Pérez-Jiménez, J.L.; Alonso-Zarza, A.M.; Furio, M. Moganite in the Chalcedony Varieties of Continental Cherts (Miocene, Madrid Basin, Spain). Spectrosc. Lett. 2012, 45, 109–113. [Google Scholar] [CrossRef]
  53. Lider, M.C.; Yurtseven, H. Temperature Dependence of the Raman Frequency of an Internal Mode for SiO2-Moganite Close to the α-β Transition. J. Thermodyn. 2012, 2012, 892696. [Google Scholar] [CrossRef]
  54. He, M.; Yan, W.; Chang, Y.; Liu, K.; Liu, X. Fundamental infrared absorption features of α-quartz: An unpolarized single-crystal absorption infrared spectroscopic study. Vib. Spectrosc. 2019, 101, 52–63. [Google Scholar] [CrossRef]
Figure 1. (a) Moganite structure in (010) projection; conventional unit cells are shown by the black rectangle. (b) Moganite primitive cell with labels at atoms; O and Si atoms are shown by red and beige balls, respectively.
Photonics 10 01346 g001
Figure 2. Simulated Raman spectrum of α-moganite (black). Blue and red bars are Raman activities of Ag and Bg modes.
Photonics 10 01346 g002
Figure 3. Atomic displacements in Raman active modes with frequencies 494 (a), 230 (b), 140 (c), 131 (d), 82 (e) and 67 (f) cm−1.
Photonics 10 01346 g003
Figure 4. Simulated IR absorbance spectrum of α-moganite (black). Blue and red bars are Raman activities of Au and Bu modes.
Photonics 10 01346 g004
Figure 5. Atomic displacements in high-frequency IR active modes: Au 1058 cm−1 (a), Bu 1070 cm−1 (b), Bu 1080 cm−1 (c), Au 1164 cm−1 (d), Au 1193 cm−1 (e), Bu 1145 cm−1 (f).
Photonics 10 01346 g005
Figure 6. Comparison of calculated Raman spectra of a-quartz (a) and moganite (b). Blue and red bars in case of a-quartz correspond to the Raman activities of E and A1 modes, respectively. Blue and red bars in the case of moganite correspond to the Raman activities of E and A1 modes, respectively.
Photonics 10 01346 g006
Figure 7. IR absorption spectra of α-quartz (a) and α-moganite (b). For α-moganite, the intensities of the Au and Bu modes are shown by blue and red columns; for α-quartz, the intensities of the E and A2 modes are shown by blue and red columns. Cumulative spectra with a 10 cm−1 peak width are drawn, taking into account the degeneracy of vibrational modes.
Photonics 10 01346 g007
Figure 8. Dependence of frequencies of vibrational modes of different irreducible representations on pressure: Au (a), Bu (b), Ag (c), Bg (d).
Photonics 10 01346 g008
Figure 9. Calculated IR absorption spectra of moganite under hydrostatic pressure: 0 (a), 2 (b), 5 (c), 8 (d), 10 (e) GPa. The Au and Bu modes are shown by the blue and red columns, respectively.
Photonics 10 01346 g009
Table 1. Unit cell parameters of α-moganite (monoclinic I2/a).
ParametersCalculationsExperiment 1 [44]Experiment 2 [5]
a (Å)8.52228.7978.758
b (Å)4.76754.8694.876
c (Å)10.589510.72210.715
β (°)90.1290.1990.08
Table 2. Atomic positions in α-moganite (monoclinic I2/a).
AtomCalculationsExperiment 1 [44]Experiment 2 [5]
Si1 *1/40.9657401/40.972601/40.99080
Si2 *0.015340.295340.165640.01030.24860.16820.01150.253300.1678
O10.978290.114830.291690.97810.06440.28780.96860.06800.2860
O20.170340.167210.103840.16780.17080.10020.17110.17700.1050
O30.878420.225050.068160.87030.22960.06750.86570.21480.0739
* These notations will be used when discussing atomic displacements.
Table 3. Comparison of Raman-active modes in theoretical and experimental spectra of α-moganite. Frequencies of the most prominent spectral features and the most active modes are highlighted by bold.
Experimental Phonon Frequency, cm−1Theoretical Phonon Frequency, cm−1
Reference [20]Reference [7]Ag ModesBg Modes
67
82
130129 131
140141143140
207220230
270265262279
317310
356
375370361
377 381
398
432 421
449449442
464463 489
500501494
710693693699
790792791
804
820833 842
1060105810591067
1080108410871084
1171 1161
118011771163
Table 4. Comparison of theoretical and experimental optical modes in moganite active in the IR absorbance spectrum. Frequencies of the most prominent spectral features and the most active modes are highlighted by bold.
Au ModesBu Modes
ExperimentTheory, This WorkExperimentTheory, This Work
[18][5][22][18][5][22]
207 201165 162
264 263 276
284343341 324
296295 292 398
369448447447432
421420418409483480 473
576572570544696 700695
612 600606780 800772
798800808802798800808801
10581082110011051070
1167 11641080
1191 11911193 1145
Disclaimer/Publisher’s Note: The statements, opinions and data contained in all publications are solely those of the individual author(s) and contributor(s) and not of MDPI and/or the editor(s). MDPI and/or the editor(s) disclaim responsibility for any injury to people or property resulting from any ideas, methods, instructions or products referred to in the content.

