1. Introduction
MI is caused by the interaction between the nonlinear effect and the dispersion effect, and has been studied in the fields of fluid mechanics, nonlinear optics and plasma physics [
1,
2,
3,
4,
5]. MI induced by cross-phase modulation (XPM) can occur in the normal dispersion region when two beams propagate together in a fiber. This instability manifests in the splitting of the continuous or quasi-continuous wave into a train of short pulses in the time domain and the generation of spectral sidebands in the frequency domain [
6,
7,
8,
9]. MI has been widely used in the generation of supercontinua [
10], optical pulses with a high repetition rate and optical odd waves [
11,
12,
13]. In recent years, MI in high-power fiber lasers has attracted the attention of researchers [
14,
15,
16,
17].
High-power narrow-linewidth lasers based on a master oscillator power amplification (MOPA) structure hold value for applications in fields such as gravitational wave detection, frequency conversion and beam synthesis due to their compact structure, low noise, good beam quality and coherence [
18,
19,
20]. It is difficult for high-power fiber amplifiers to achieve a laser output that simultaneously has a high power and spectral purity due to nonlinear effects. MOPA based on a phase-modulated single frequency (PMSF) seed source is an effective scheme for obtaining a narrow-linewidth laser output with high power and a high spectral signal-to-noise ratio (SNR) [
21,
22,
23] that can achieve a narrow-linewidth laser output within a few kilowatts. This scheme requires high-speed phase modulation or a complex configuration to broaden the seed source spectrum and raise the stimulated Brillouin scattering (SBS) threshold, thereby suppressing the SBS effect in the amplifier, which increases the cost and imposes strict requirements on the modulator [
24]. Another MOPA, based on an FBG fiber oscillator laser (FOL) seed source, makes it easier to achieve a high-power narrow-linewidth output [
25,
26,
27,
28,
29]. However, such lasers are susceptible to nonlinear effects, resulting in spectral purity degradation. Many spectral evolution models based on SPM, the four-wave mixing effect (FWM) and intermodal four-wave mixing (IMFWM) have been proposed in previous studies [
30,
31,
32,
33,
34,
35]. These models rarely discuss combinational nonlinear effects and cannot be used to perform an accurate numerical analysis of certain spectral changes in the power amplification process, such as the sideband secondary peaks with frequency shifts of 6 nm (less frequency shift than IMFWM) seen in Figure 2b of reference [
28] and main-peak splitting of the main signal spectrum such as that shown in Figure 6a of our previous research in reference [
29]. These spectral degradations will reduce the spectral purity of the laser that is output from a narrow-linewidth amplifier, making its performance limited in further applications. In reference [
28], during the femtosecond optical pulse compression process in single-mode fibers, optical wave splitting caused by the combination of the SPM effect and the dispersion effect was found, and two sidebands appeared on both sides of the main spectrum peak. This “experimental observation of spectral sidebands” can be interpreted as MI [
6].
In this paper, the effect of longitudinal-mode SPM on the spectral purity of high-power narrow-linewidth fiber amplifiers was studied and the spectral evolution model of SPM-induced MI in fiber amplifiers was established. Based on the simulated MI gain spectrum, we analyzed the effect of longitudinal-mode SPM at different powers on spectral purity. The theoretical model and inhibition scheme were verified via our experiments.
2. Theory
The spectral evolution process of SPM-induced MI in high-power narrow-linewidth fiber amplifiers is as follows: the longitudinal mode generated by SPM in the seed source [
30] and the central longitudinal mode undergo XPM during the amplification process, and MI occurs due to the interaction of the dispersion effects. It is assumed that the longitudinal mode generated by SPM in a narrow-linewidth laser has the same linearly polarized carrier frequency
ωj as the central-longitudinal-mode light wave, and the amplitudes of the longitudinal modes are varied slowly
Aj(
z,
t). Without considering the phase-matching process and fiber loss, the following coupled nonlinear Schrodinger equations are satisfied when the two longitudinal-mode light waves are transmitted through the fiber [
6]:
where
vgj is the group velocity of the light field and
βj is the group velocity dispersion.
is the nonlinear parameter,
n2 is the nonlinear Kerr parameter and
Aeff is the effective mode field area (
j = 1, 2). In order for us to consider whether the two longitudinal-mode light waves are still stable under a perturbation, it is assumed that the longitudinal-mode light wave is affected by the modulation effect, and a time-dependent perturbation based on the steady-state solution of the coupling equation is introduced:
where
represents the laser power,
is the perturbation and
is the nonlinear phase shift acquired by the
jth field. When Formula (3) is combined with Equations (1) and (2) and linearized, the perturbations
a1 and
a2 satisfy the following two coupled linear equations, respectively:
The general solution for Equations (4) and (5) is:
where
and
are the wave number and frequency of the perturbation, respectively. Equations (4)–(6) provide a set of four homogeneous equations for
U1,
U2,
V1 and
V2;
Uj and
Vj are the amplitudes of the real and imaginary parts of the complex amplitude
aj, respectively [
30], and the last term is introduced via XPM. This system of equations only has a non-trivial solution if the perturbation satisfies the following dispersion relation:
when
is taken to be a certain value and the imaginary part of the wave number
is not zero; then, the steady-state solution becomes unstable, and the perturbation exhibits exponential growth along the fiber axis with a gain coefficient of
g(Ω) = 2Im(
K). When the interacting waves have similar group velocities, Equation (7) reveals that:
In the normal dispersion state (
β1 > 0 and
β2 > 0), the wave number
K can only be complex if
CXPM >
h1h2, i.e.,:
where
. The expression of the spectral gain coefficient satisfying these conditions is:
For the two longitudinal-mode components of the main signal, the wavelength is only slightly different, so vgj, βj and γj are almost the same. In this case, the mismatch value in the group velocity is .
Via simple calculation, the peak frequency shift is as follows:
According to Formulas (12) and (13), the influence of the modulated longitudinal mode on the spectral evolution of the output laser can be obtained.
Under the condition that
vgj,
βj and
γj are basically the same, the following relations can be obtained by substituting
into Formula (12).
where Formula (14) indicates that the gain coefficient is inversely proportional to the fiber mode field area. It can be seen that an expansion of the mode field area can suppress MI.
3. Simulation
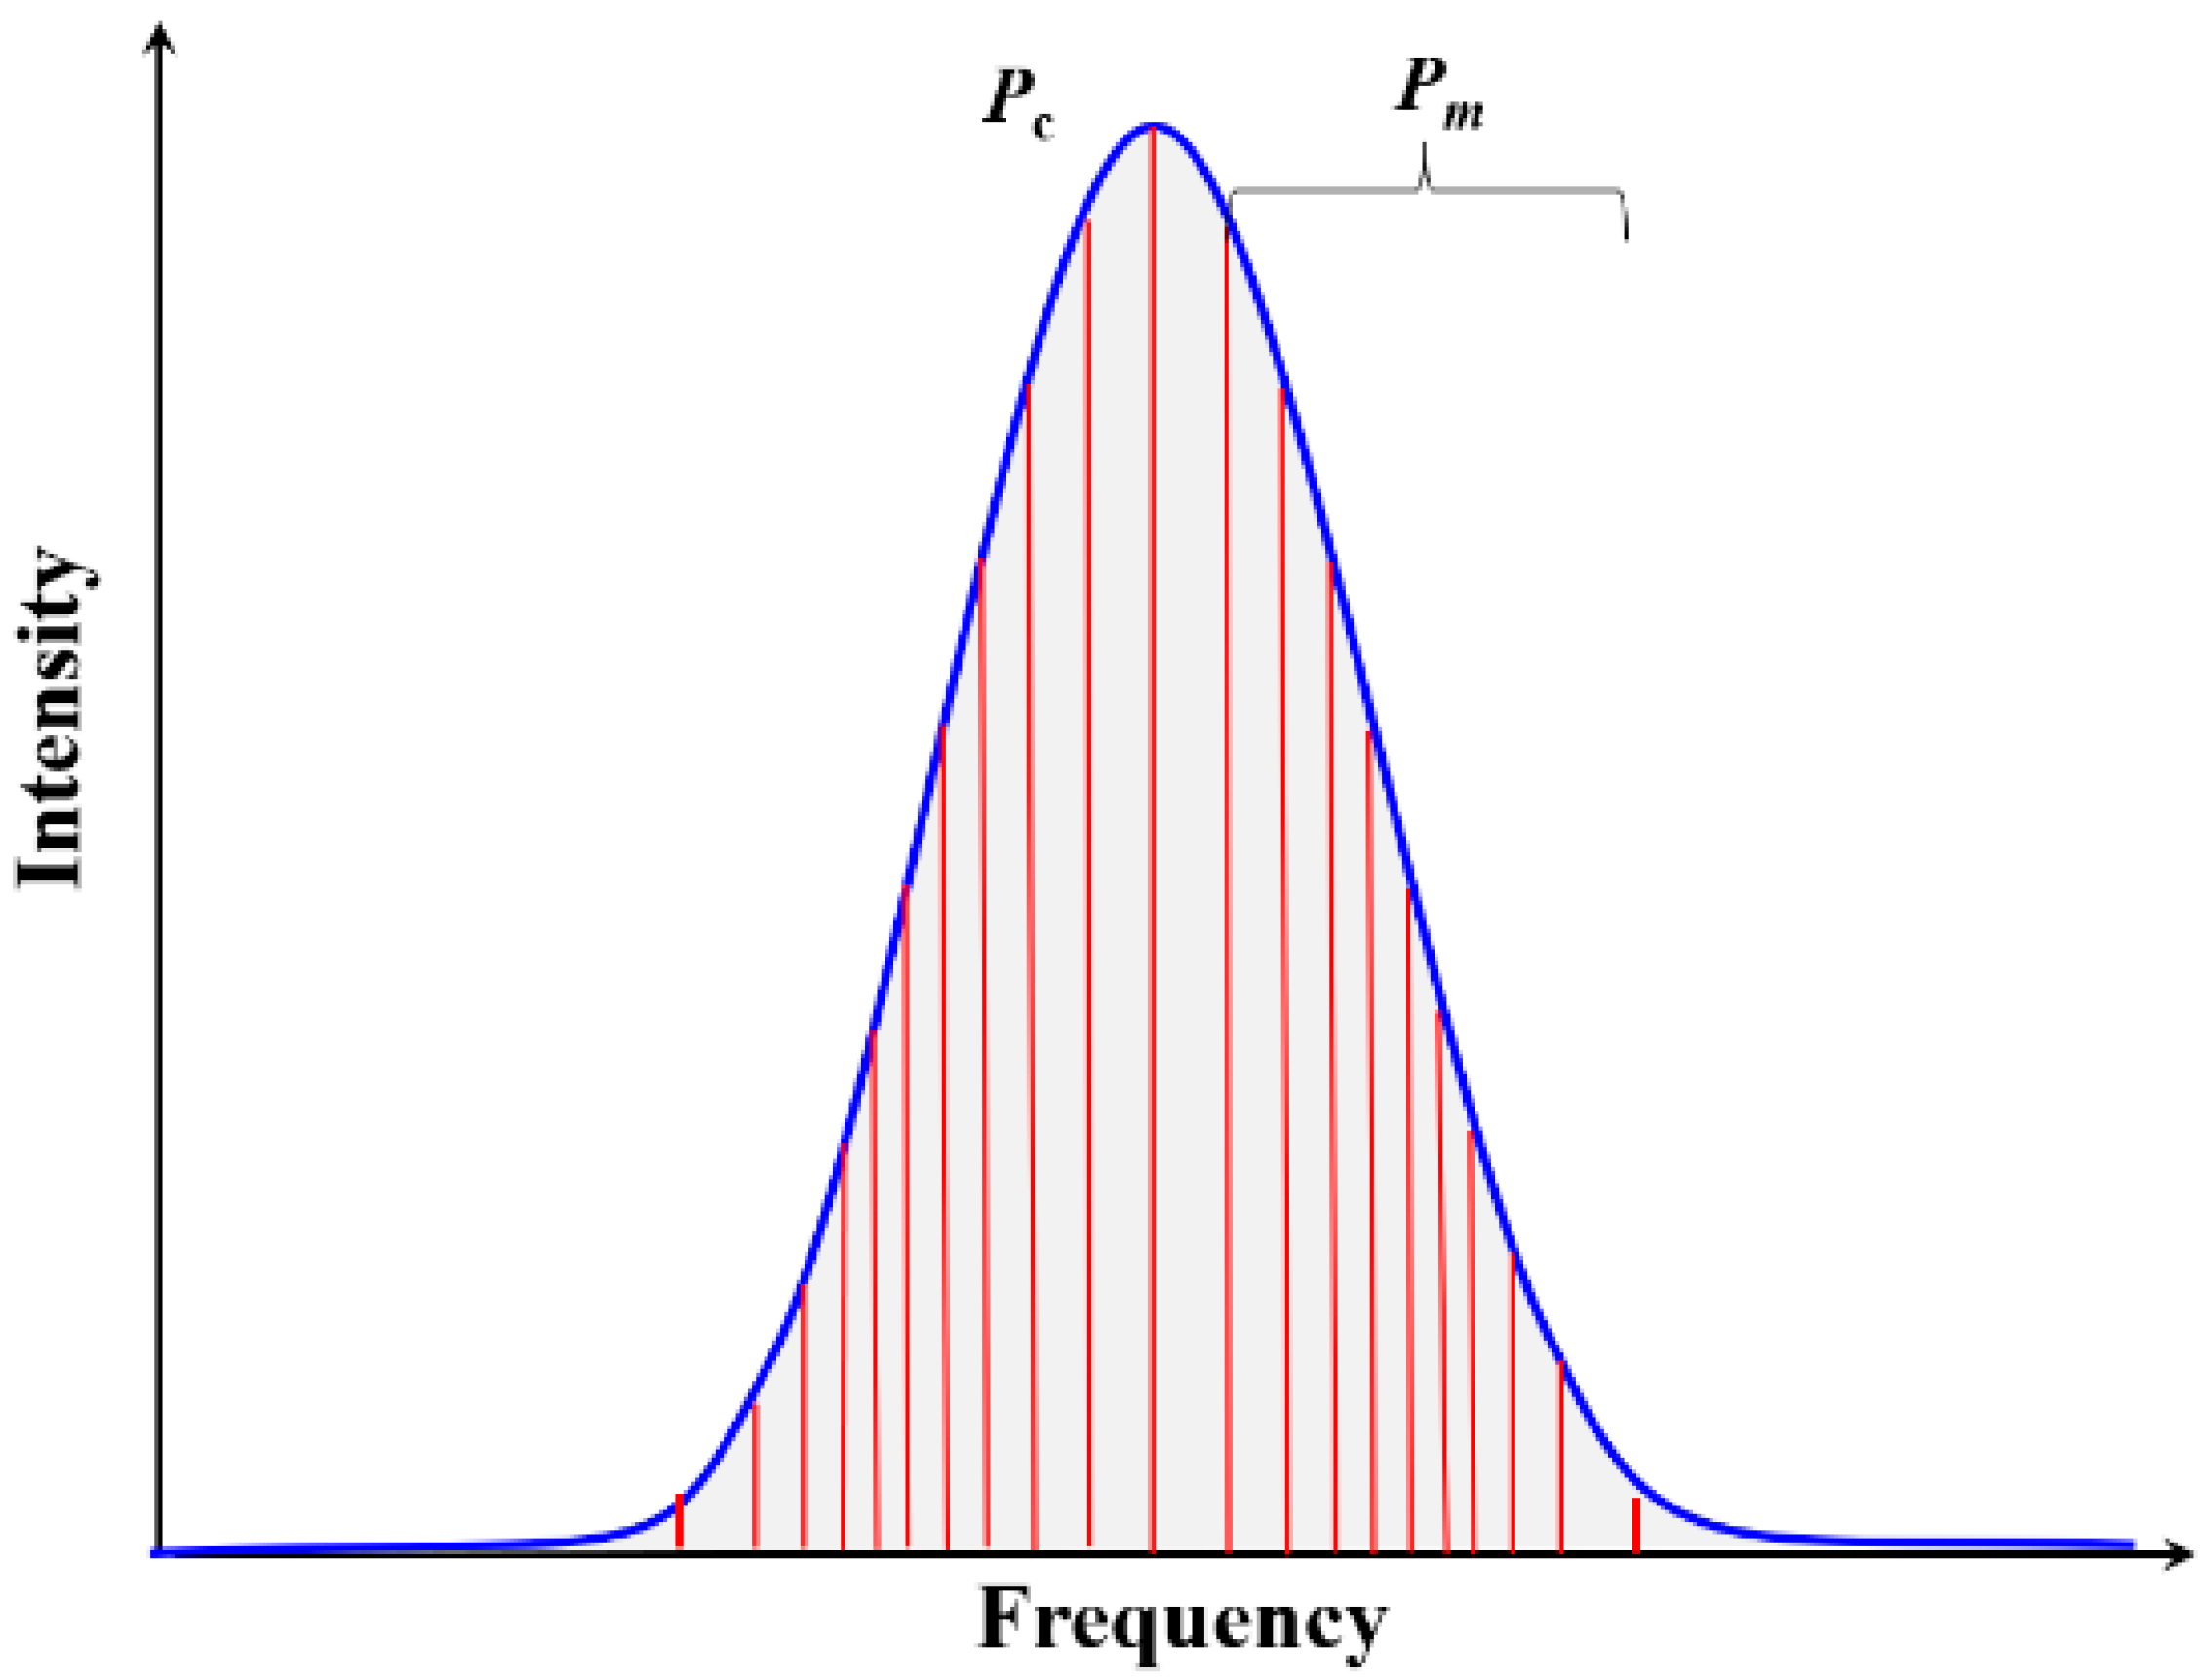
Figure 1 shows a Gaussian-type output spectral simulation for the FOL seed source, where the spectral distribution includes the central longitudinal mode as well as the symmetrically modulated longitudinal modes generated under the influence of SPM. The narrow-linewidth seed source in this simulation is FBG-FOL with a short resonator in the few-longitudinal mode, so its output spectral model is Gaussian [
32]. The longitudinal modes are divided according to power instead of frequency due to the better correlation with power. We assume that the power of the central longitudinal mode is
Pc, the power of each SPM longitudinal mode
Pm is 1%
Pc and 10%
Pc–90%
Pc, respectively,
m = 1–10, and the total laser power is
P = 10.2
Pc. This is a general model that only considers the process involved in the frequency shift change. The MI generated from the interaction between the central longitudinal mode and the SPM-modulated longitudinal mode of varying power is simulated to investigate the frequency shift change. Assuming that the wavelength difference in each modulated longitudinal mode of the laser’s main signal spectrum is very small and located in the same transverse mode, the
γj,
βj and
vgj of each longitudinal mode are almost the same. The simulation parameters for the commonly used material silica fiber are shown in
Table 1.
Only the forward frequency section of the gain spectrum is shown in the simulation due to the fact that g(−Ω) = g(Ω).
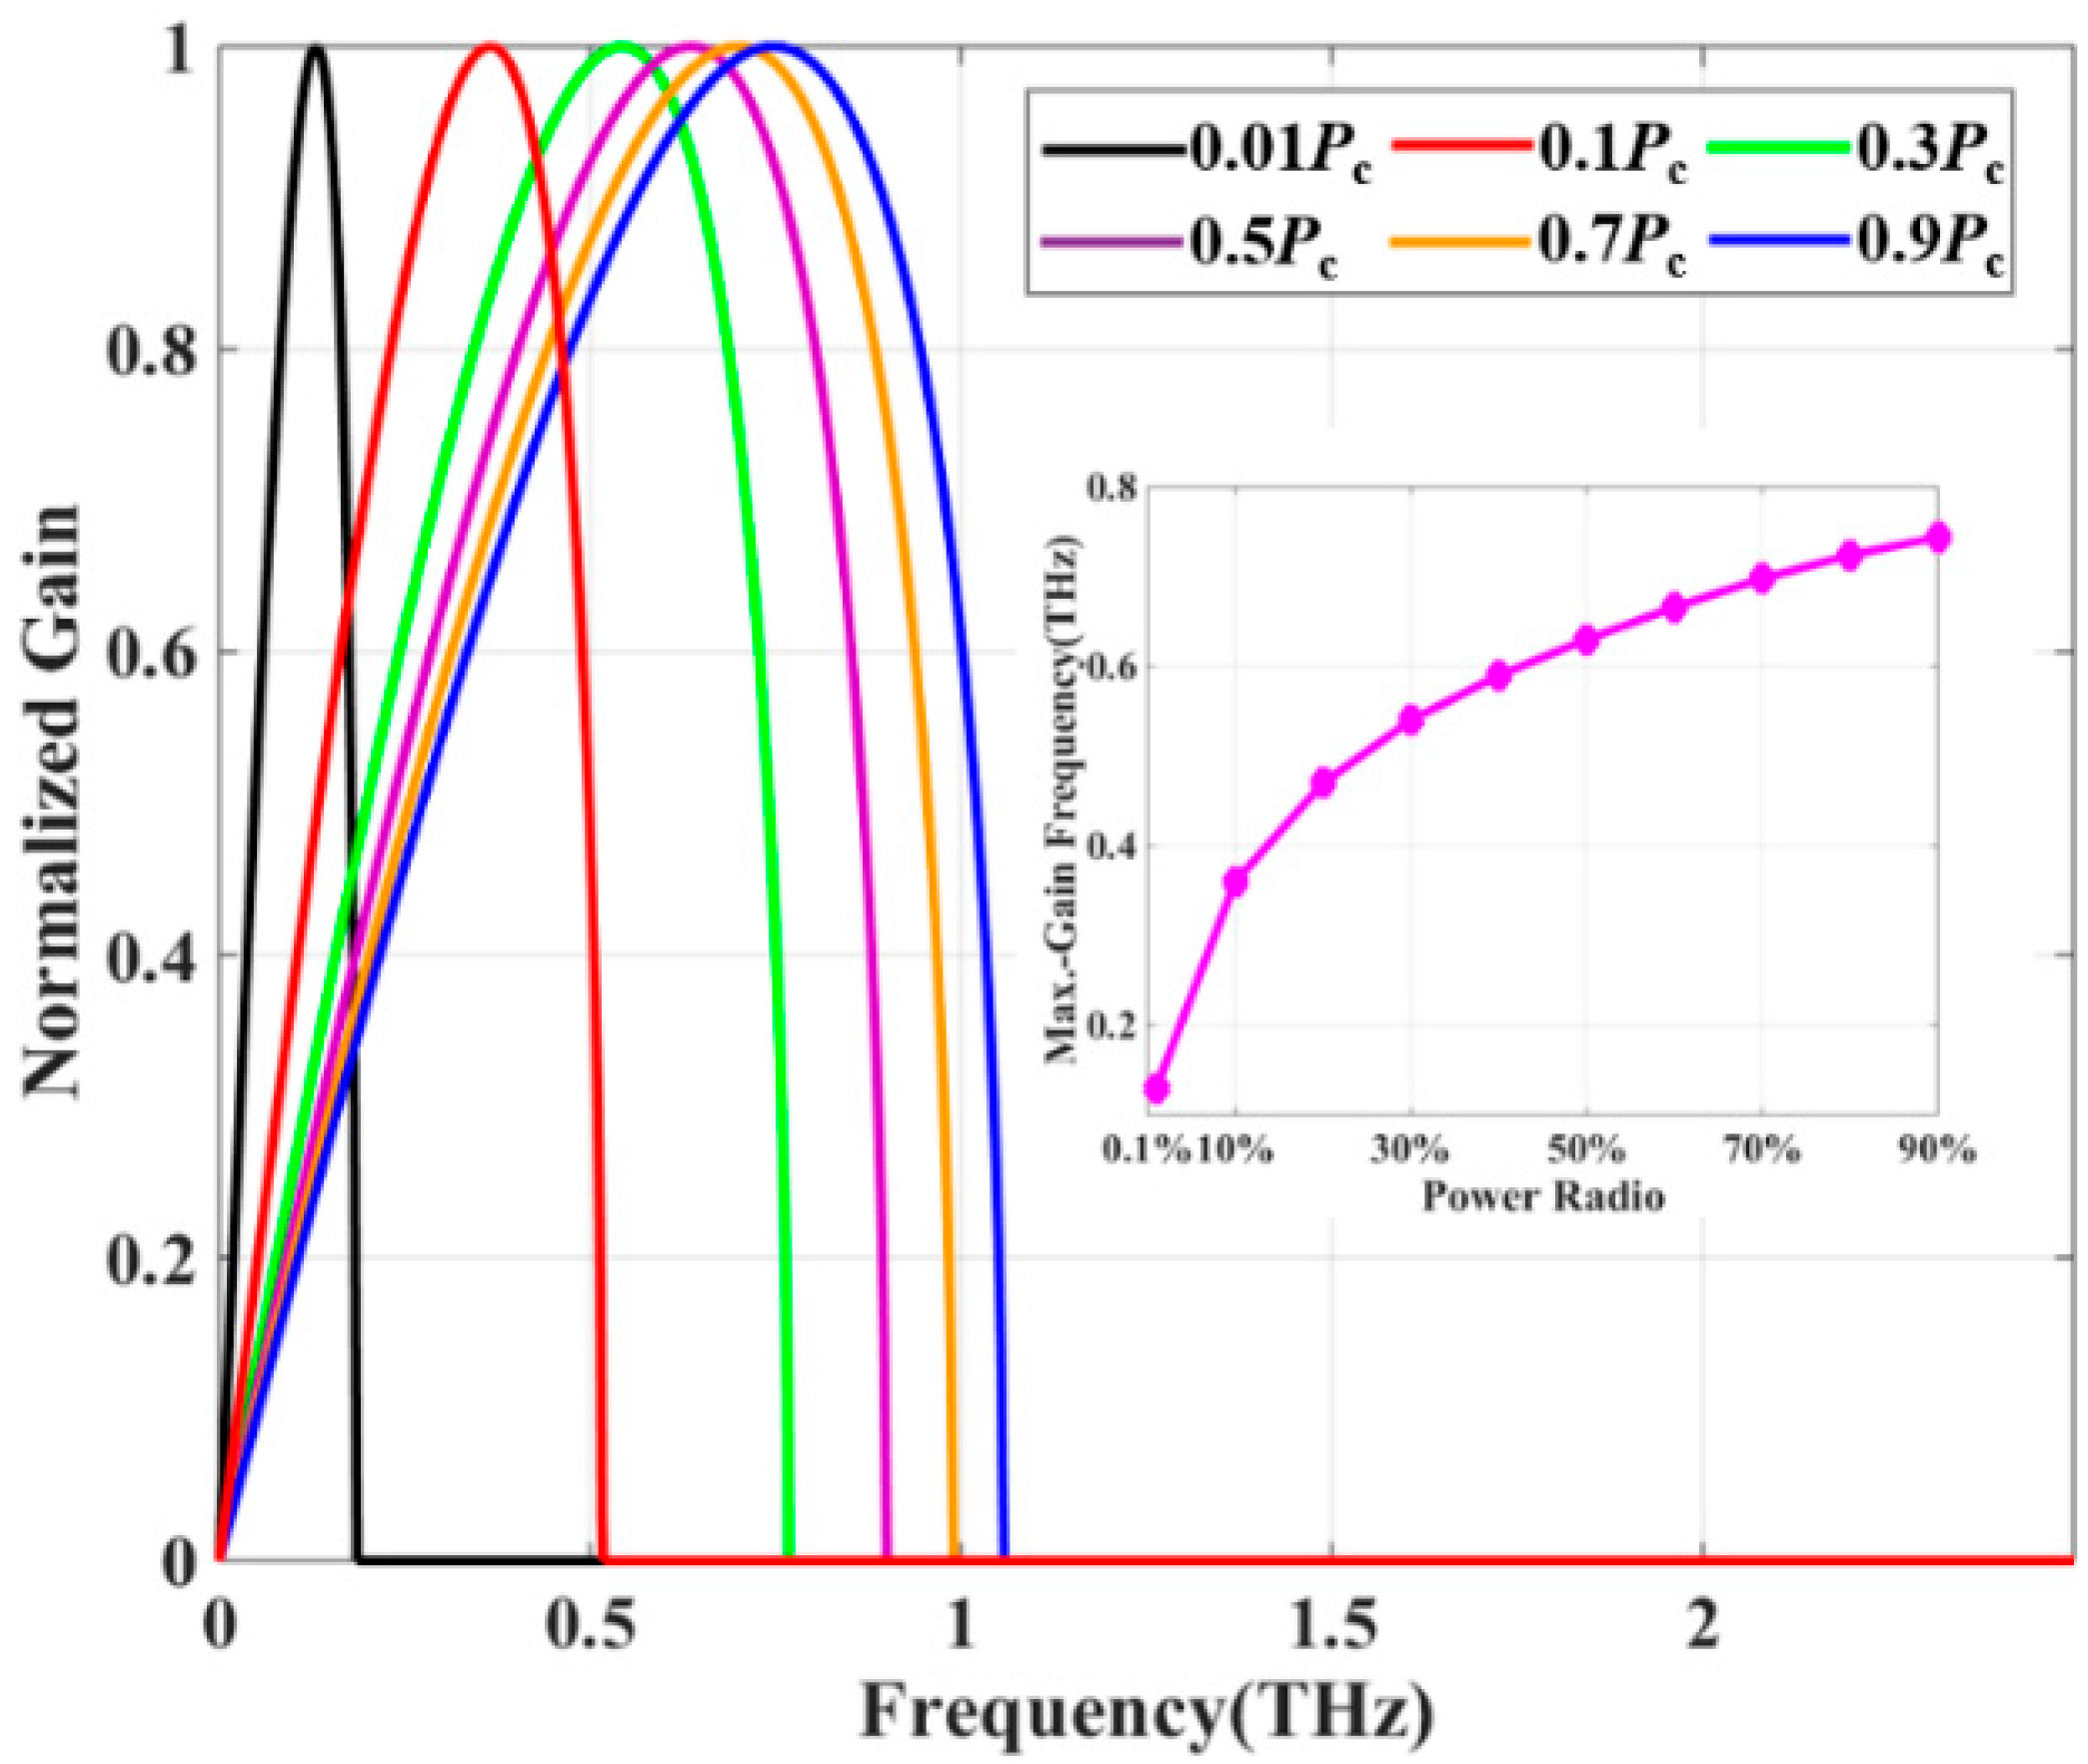
Figure 2 shows the MI-normalized gain spectrum when the central longitudinal mode interacts with the modulated longitudinal mode at different powers: at
P = 100 W and
Pc = 9.8 W, respectively. The black curve shows the normalized gain spectrum of MI generated from the central longitudinal mode and longitudinal-mode SPM with a power of 0.01
Pc. The maximum gain coefficient is obtained at 0.13 THz and the gain spectrum ranges from 0 to 0.52 THz. The blue curve represents the gain spectrum of MI caused by the central longitudinal mode and longitudinal-mode SPM with a power of 0.9
Pc. Compared with the black gain spectrum, the peak gain frequency shifts by 0.64 THz and the gain spectrum bandwidth also increases by 0.53 THz with the increase in the power in longitudinal-mode SPM. As can be seen from the inset in
Figure 2, the frequency variation in the MI peak gain gradually decreases with the increase in power in longitudinal-mode power SPM. When the total laser power
P = 100 W, the maximum peak gain frequency is about 0.77 THz. The simulation results show that the MI gain generated by the central longitudinal mode and the low-power longitudinal-mode SPM is close to the frequency of the central longitudinal mode, which accelerates the spectral broadening effect during laser transmission. The MI generated by the central longitudinal mode modulation and the high-power longitudinal mode will excite the modulation sideband and affect the purity of the output spectrum.
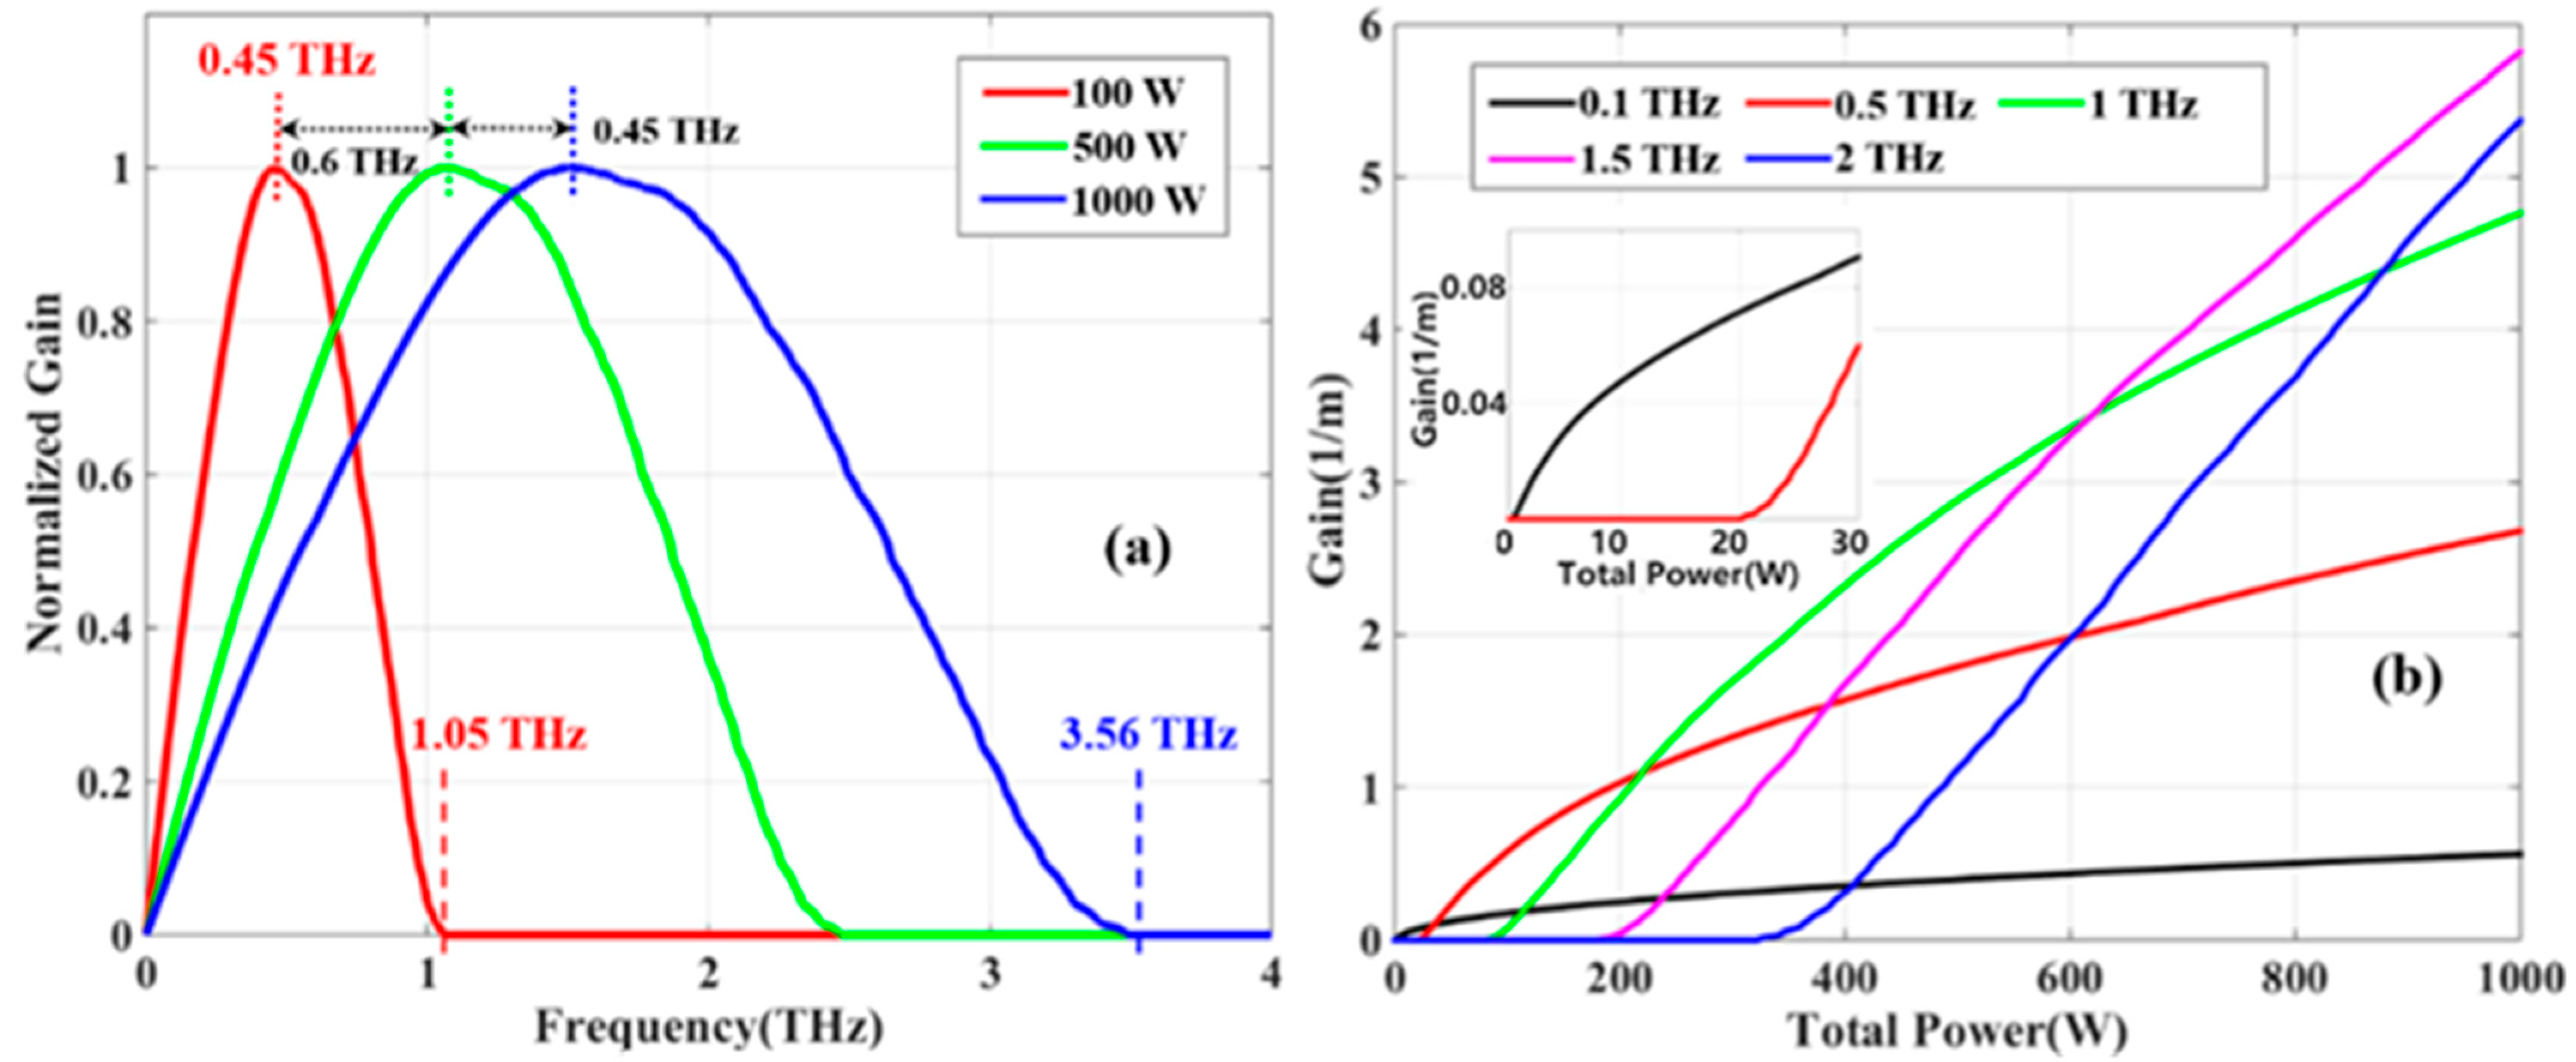
Figure 3a shows the normalized combined gain spectrum of MI at a total power
P of 100 W, 500 W and 1000 W, respectively. This gain spectrum is obtained from the combination and superposition of MI gain spectra of each longitudinal-mode SPM power. The calculation formula of the combined gain coefficient is as follows:
The red curve in
Figure 3a shows the combined gain spectrum at the total power
P of 100 W. The frequency range of the gain spectrum induced by MI is 0–1.05 THz, and the peak gain frequency is 0.45 THz. The frequency range of the gain spectrum at 1000 W power is 0–3.56 THz, as shown by the blue curve in
Figure 3a. Compared with 100 W and 500 W, the peak gain frequency is blue-shifted by 0.6 THz and 0.45 THz. It can be seen that, with the increase in total power, the increased rate of peak gain frequency in the gain spectrum gradually slows down.
Figure 3b shows the variations in the combined gain coefficient with total power P at the frequencies of 0.1, 0.5, 1, 1.5 and 2 THz. The gain coefficients at different frequencies increase with the growth in power, and there are thresholds for MI gain coefficients at different frequencies. The black curve in
Figure 3b indicates that MI at 0.1 THz occurs immediately when the power is 1 W, and the change rate of the gain coefficient is relatively slow compared to the growth in power, which is only 0.5 m
−1 at 1000 W. With the increase in frequency, the gain coefficient of MI also increases. At the power of 1000 W, the gain coefficients at the frequencies of 1, 1.5 and 2 THz rise to 4.76, 5.53 and 5.82 m
−1. The simulation results show that MI induced by longitudinal-mode SPM causes a spectral wingspan and affects spectral purity while generating a spectral sideband. With an increase in laser power, the spectral evolution caused by MI is limited to a certain wavelength range, the gain coefficient and frequency shift in MI increase linearly and the MI gain at different frequencies develops a threshold.
The gain coefficients at different frequency positions increase exponentially with an increase in power, and MI also occurs in these newly generated modulated longitudinal modes at high power.
Figure 4 shows the combined gain spectrum produced by the cascaded MI at 1000 W. Since the longitudinal mode generated via modulation has an initial frequency shift, both
g(−Ω) and
g(Ω) should be considered when calculating its combined gain coefficient. As can be seen from
Figure 3a, when
P = 1000 W, the frequency of the newly modulated longitudinal mode, generated by SPM-induced MI, ranges from 0 to 3.65 THz. To simplify this calculation, longitudinal modes with frequencies of 1 THz, 1.5 THz, 2 THz, 2.5 THz and 3 THz were simulated, respectively. The newly generated longitudinal mode is taken as the central longitudinal mode and its gain spectrum is calculated. Finally, the combined gain spectrum generated by cascaded MI at 1000 W is obtained via equal-proportion superposition according to the normalized gain coefficient of the blue gain spectrum shown in
Figure 3a.
Figure 4 shows that the cut-off frequency of the cascaded-MI normalized gain spectrum is 4.58 THz at 1000 W. Compared to the MI gain spectrum, the cascaded-MI gain spectrum is blue-shifted and produces a secondary gain peak with a frequency shift of less than 0.5 THz. In this case, the gain coefficient at 0.1 THz is 2/5 of the peak gain coefficient. The simulation results show that, with a continuous increase in laser power, the modulated longitudinal mode excited by MI causes cascaded MI, generates multiple spectral secondary peaks in the output spectrum and causes spectral broadening.
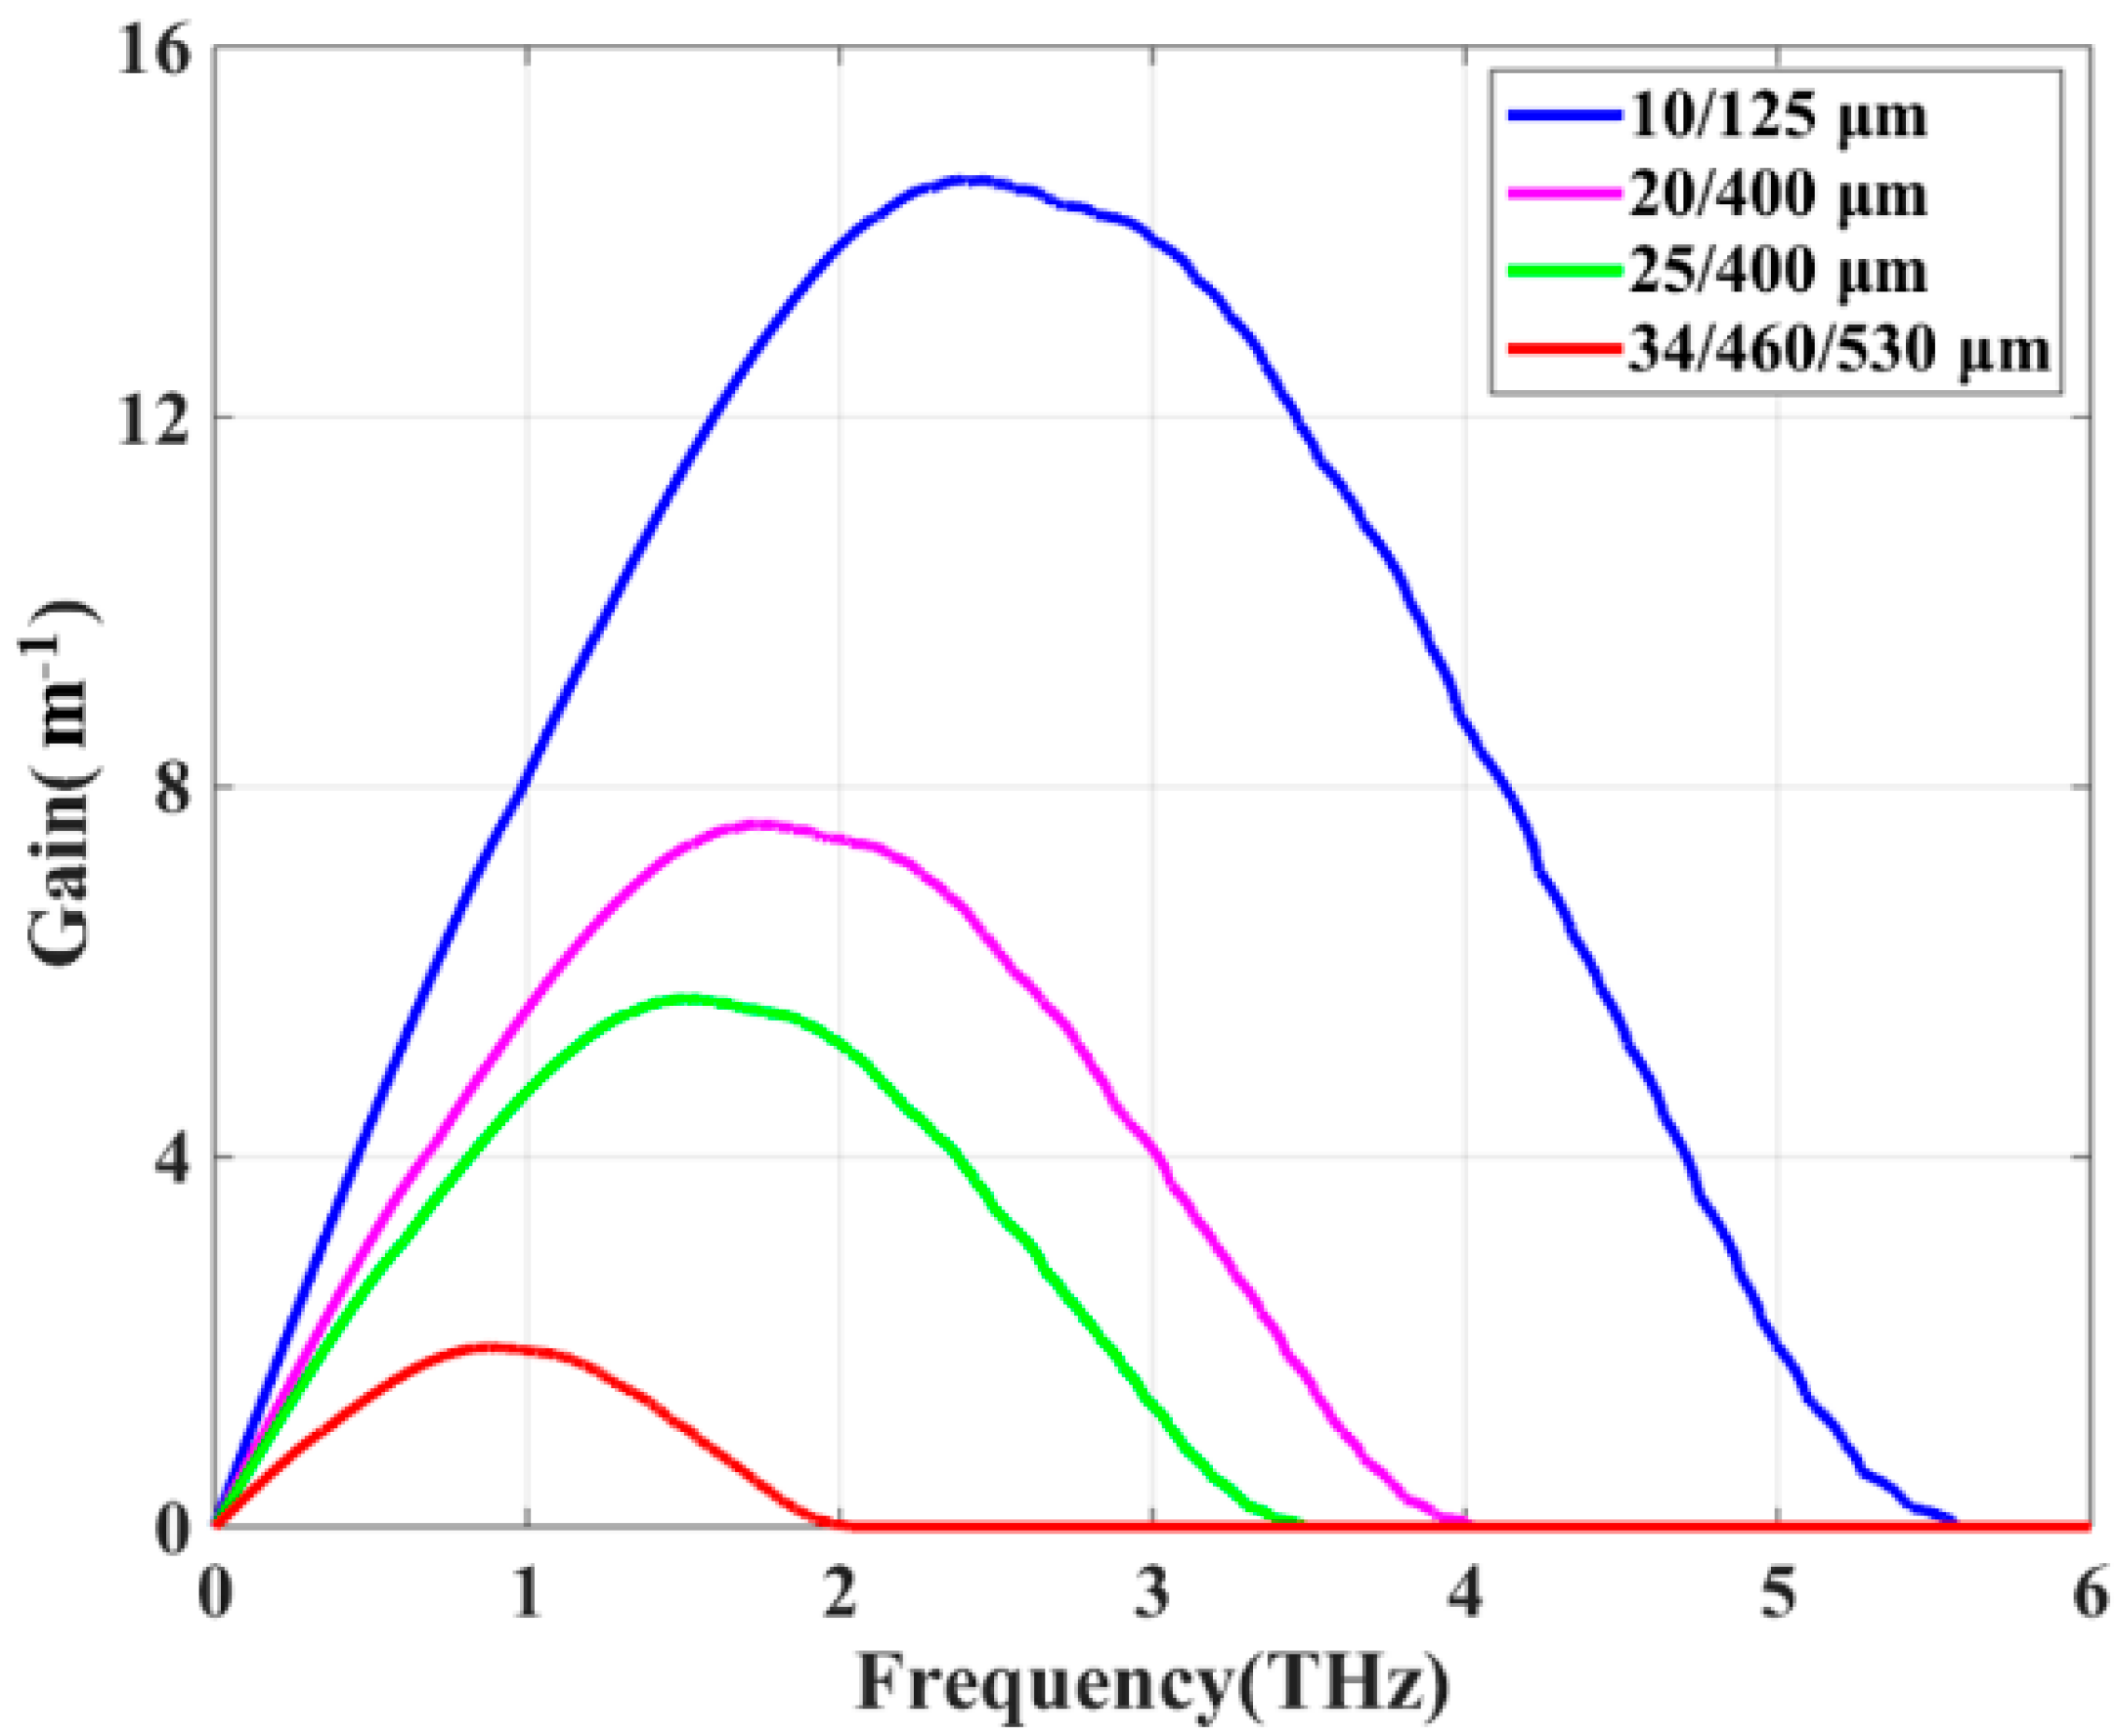
Figure 5 shows the MI gain spectra of fibers with different mode field areas at a total power of 1000 W. The commonly used double-clad fiber with a core/diameter of 10/125 μm, 20/400 μm and 25/400 μm, and the triple-clad fiber with a core/diameter of 34/460/530 μm were simulated, respectively. The corresponding
Aeff are 1.23 × 10
−10 m
2, 2.36 × 10
−10 m
2, 3.1 × 10
−10 m
2 and 9.1 × 10
−10 m
2, respectively, and the corresponding
γj are 0.0013, 0.00067, 0.0005 and 0.00017 W
−1/m, respectively. With an increase in the optical fiber mode field area, the maximum gain coefficient of the gain spectrum decreases and the gain spectrum width is compressed. The green curve in
Figure 5 shows the MI combination gain spectrum induced by the longitudinal-mode SPM of a 25/400 μm fiber. In this case, the frequency range of the gain spectrum is 0–3.56 THz, and the peak gain is 5.7 m
−1. The red curve in
Figure 5 represents the MI combined gain spectrum induced by the longitudinal-mode SPM of the 34/460/530 μm triple-clad fiber with a peak gain of 1.94 m
−1. Compared with the gain spectrum when the core diameter is 25 μm, the peak gain is reduced by 4.08 m
−1, and the gain spectrum range narrows by about half. The simulation results indicate that an increase in the mode field area can suppress MI effectively and achieve spectral purification.
4. Experiment
4.1. Experimental Verification of a Spectral Evolution Model for a Narrow-Linewidth Fiber Amplifier Based on MI Induced by Longitudinal-Mode SPM
A FOL-MOPA narrow-linewidth laser system was built, and the schematic diagram of the experimental device is shown in
Figure 6. The system consists of a short-gain fiber seed source and a main amplifier. The seed source includes an oscillator and a pre-amplifier. The resonator in the oscillator consists of a high-reflectivity fiber grating (HR-FBG), a low-reflectivity fiber grating (OC-FBG) and a 1 m ytterbium-doped fiber (YDF, core/cladding diameter: 20/400 μm; NA: 0.06/0.46; the cladding’s absorption coefficient near 975 nm is 1.20 dB/m; bending radius: 40 mm). The central wavelength of HR-FBG is 1080 nm, the spectral bandwidth of 3 dB is 2.05 nm and the reflectivity is greater than 99%. OC-FBG has a central wavelength of 1080 nm, a 3 dB spectral bandwidth of about 0.09 nm and a reflectivity of about 13.2%. The forward pumping source of the seed source consists of two 130 W wavelength-locked semiconductor lasers (BWT, Beijing, China), and pumped lasers are injected into the resonator through a (2 + 1) × 1 pumping combiner (Juhere Photonics, Wuhan, China). The OC’s output fiber tail was connected to the gain fiber of the preamplifier using a cladding optical stripper (CPS). A YDF with a length of 2.5 m (25/400 μm; NA 0.065/0.46; 4.3 dB/m@975 nm) was used in the preamplifier. A (6 + 1) × 1 reverse beam combiner (Juhere Photonics, Wuhan, China, HSP-61-B-M12-D07) was used to couple three wavelength-locked semiconductor lasers (BWT, Beijing, China) with a maximum output power of 130 W into the preamplifier. The output fiber of the reverse beam combiner (25/250 μm) was fused with the CPS, and the output was finally mitered at 8°. The total length of the output energy transmission fiber was about 3 m. The output power was measured using a Spiricon power meter, the spectral and temporal characteristics were measured using a YOKOGAWA spectrometer and a Tektronix oscilloscope, respectively, and a photodetector (Terahertz Technologies, Suzhou, China, TIA-525I-FC) was used to convert optical signals into electrical signals.
The red curve in
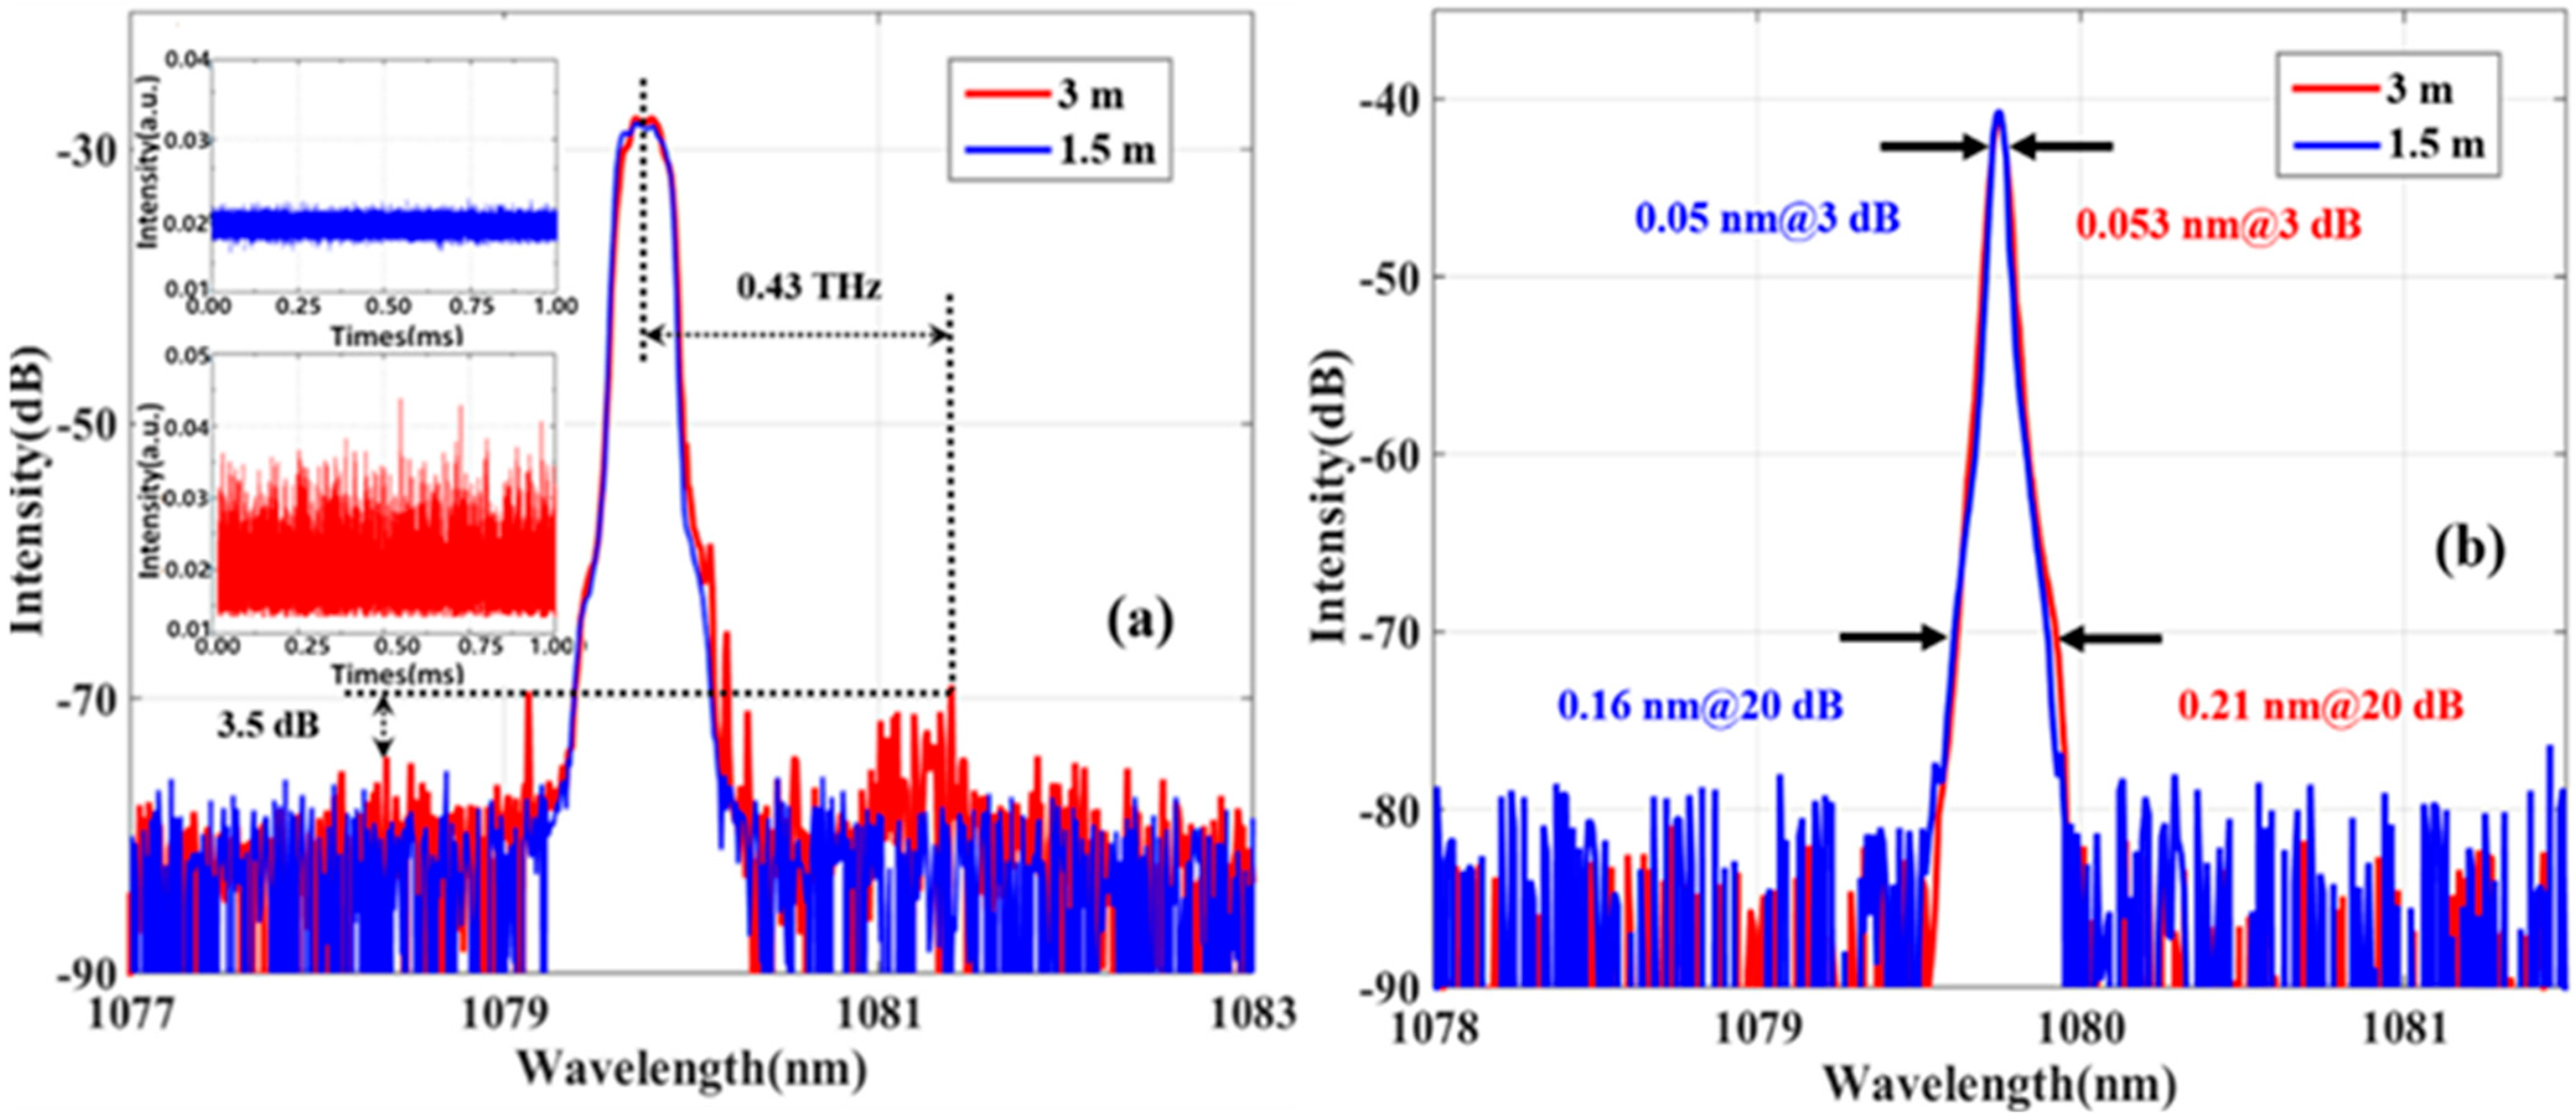
Figure 7a shows the spectral characteristics of the output from the seed source of 100 W with an energy-transmitting fiber length of 3 m. The spectral curve is measured by coupling the scattered light from the target surface of the power meter into a 400/440 μm patch cord. A Stokes light caused by MI is detected at a frequency shift of about 0.43 THz from the main spectral peak of 1080 nm, and anti-Stokes light with an intensity difference of 3.5 dB is also detected in its symmetric position. This is consistent with the peak frequency of the gain spectrum in the simulation when the laser power is 100 W, and the signal-strength difference may be caused by the addition of IMFWM. The blue curve in
Figure 7a represents the output spectrum of the energy-transmitting fiber after subtracting 1.5 m. In the spectral range of intensity from −22 dB to −80 dB, no modulation sideband appears and MI is suppressed. The red and blue curves in the inset in
Figure 7a represent the temporal characteristics of the seed source with output fiber lengths of 1.5 m and 3 m at an output power of 100 W, respectively. When the modulation sideband of MI excitation appears in the corresponding spectrum, a series of pulses appears in the time curve. These self-pulses may lead to stimulated Raman scattering (SRS) effects, which, in turn, produce an increase in Stokes light. This is also the reason why the intensity of the anti-Stokes light induced by MI is lower than that of the Stokes light. As can be seen from the temporal curve, represented by the blue curve in
Figure 7a, the self-pulse in the time domain also disappears with the disappearance of the spectral peak at the frequency shift of 0.43 THz. It can be seen from the spectrum of
Figure 7b that, when the power is 100 W, the 3 dB linewidth of seed sources with fiber lengths of 1.5 m and 3 m is 0.05 nm and 0.053 nm, respectively. The spectral curve is measured with a 9/125 μm single-mode patch cord. Since the wavelength resolution measured with a 400 μm core diameter patch cord is only 1 nm, while the wavelength resolution measured with a 9/125 μm patch cord is 0.02 nm, a patch cord of 9/125 µm is, therefore, more suitable for spectral linewidth measurement [
36]. When MI occurs, the 3 dB linewidth change in the spectrum is only 0.003 nm, which is practically negligible because it is less than the wavelength resolution of the spectrometer. The 20 dB linewidth is extended by 0.5 nm, which may be the result of FWM and MI. The experimental results are consistent with the spectral frequency shift caused by an MI of 100 W in the simulation, which indicates that the SPM-induced MI spectral evolution model proposed in this paper can explain the spectral sideband phenomenon accompanied by the temporal fluctuations in the output spectrum of a narrow-linewidth laser. In the narrow-linewidth laser amplification system with relatively low laser power, MI will not cause 3 dB linewidth broadening in the seed light, but will stimulate the modulation sideband, resulting in a spectral wingspan and reducing spectral purity. Shortening the fiber length can effectively inhibit MI, improve spectral SNR, suppress spectral wingspan, and thus improve spectral purity.
4.2. Experimental Verification of Spectral Evolution Model Based on MI Cascade Effect
A MOPA laser system based on a few-mode FOL and a pre-amplified seed source was built, and a schematic diagram of the experimental setup is shown in
Figure 8. The system in the above section is used as a pre-amplified seed source, with an output power of 100 W, a line width of 0.05 nm for 3 dB (10 dB for 0.09 nm) and an output fiber length of 1.5 m.
The gain fiber of the main amplifier 1 uses a YDF with a core/inner cladding diameter of 25/400 μm and a length of 9 m. The numerical aperture of the core/inner cladding of the gain fiber is 0.06/0.46 and the pumping absorption coefficient is 4.3 dB/m@975 nm. The first main amplifier uses a double-ended cascade pump structure. A total of 73,976 nm non-locked wavelength semiconductor lasers (BWT, Beijing, China, 976 nM-140) serve as pump sources. Pump light is coupled into a (6 + 1) × 1 forward beam combiner (Juhere Photonics, Wuhan, China, HSP-61-F-M12-D03-D07) and a (6 + 1) × 1 reverse beam combiner (Juhere Photonics, Wuhan, China, HSP-61-B-M12-D07-D04), respectively, via a 7 × 1 cascade pump combiner (Lightcomm, Shenzhen, China, 7 × 1-S2), and is then injected into the amplifier gain fiber. The positive and negative power ratio is 1:1. The amplified laser is finally output at the fused quartz endcap (QBH). The structure of the second main amplifier is the same as that of the first main amplifier, and the gain fiber is changed to a YDF with a core/inner cladding/outer cladding diameter of 34/460/530 μm and a length of 8 m. The numerical aperture of the core/inner cladding/outer layer of the gain fiber is 0.11/0.22/0.46, and the pump absorption coefficient is 4.3 dB/m@975 nm. The (6 + 1) × 1 forward beam combiner (Juhere Photonics, Wuhan, China, HSP-61-F-M12-D05-T12) and (6 + 1) × 1 reverse beam combiner (Juhere Photonics, Wuhan, China, HSP-61-B-M12-T12-T01), matched to the corresponding fiber, are replaced at the same time.
The output power of the first and the second main amplifiers are measured using a Spiricon power meter, and the spectral and temporal characteristics are measured using a YOKOGAWA spectrometer and Tektronix oscilloscope, respectively. A photodetector (Terahertz Technologies, Suzhou, China, TIA-525I-FC) is used to convert the light signal into an electrical signal.
The blue curve in
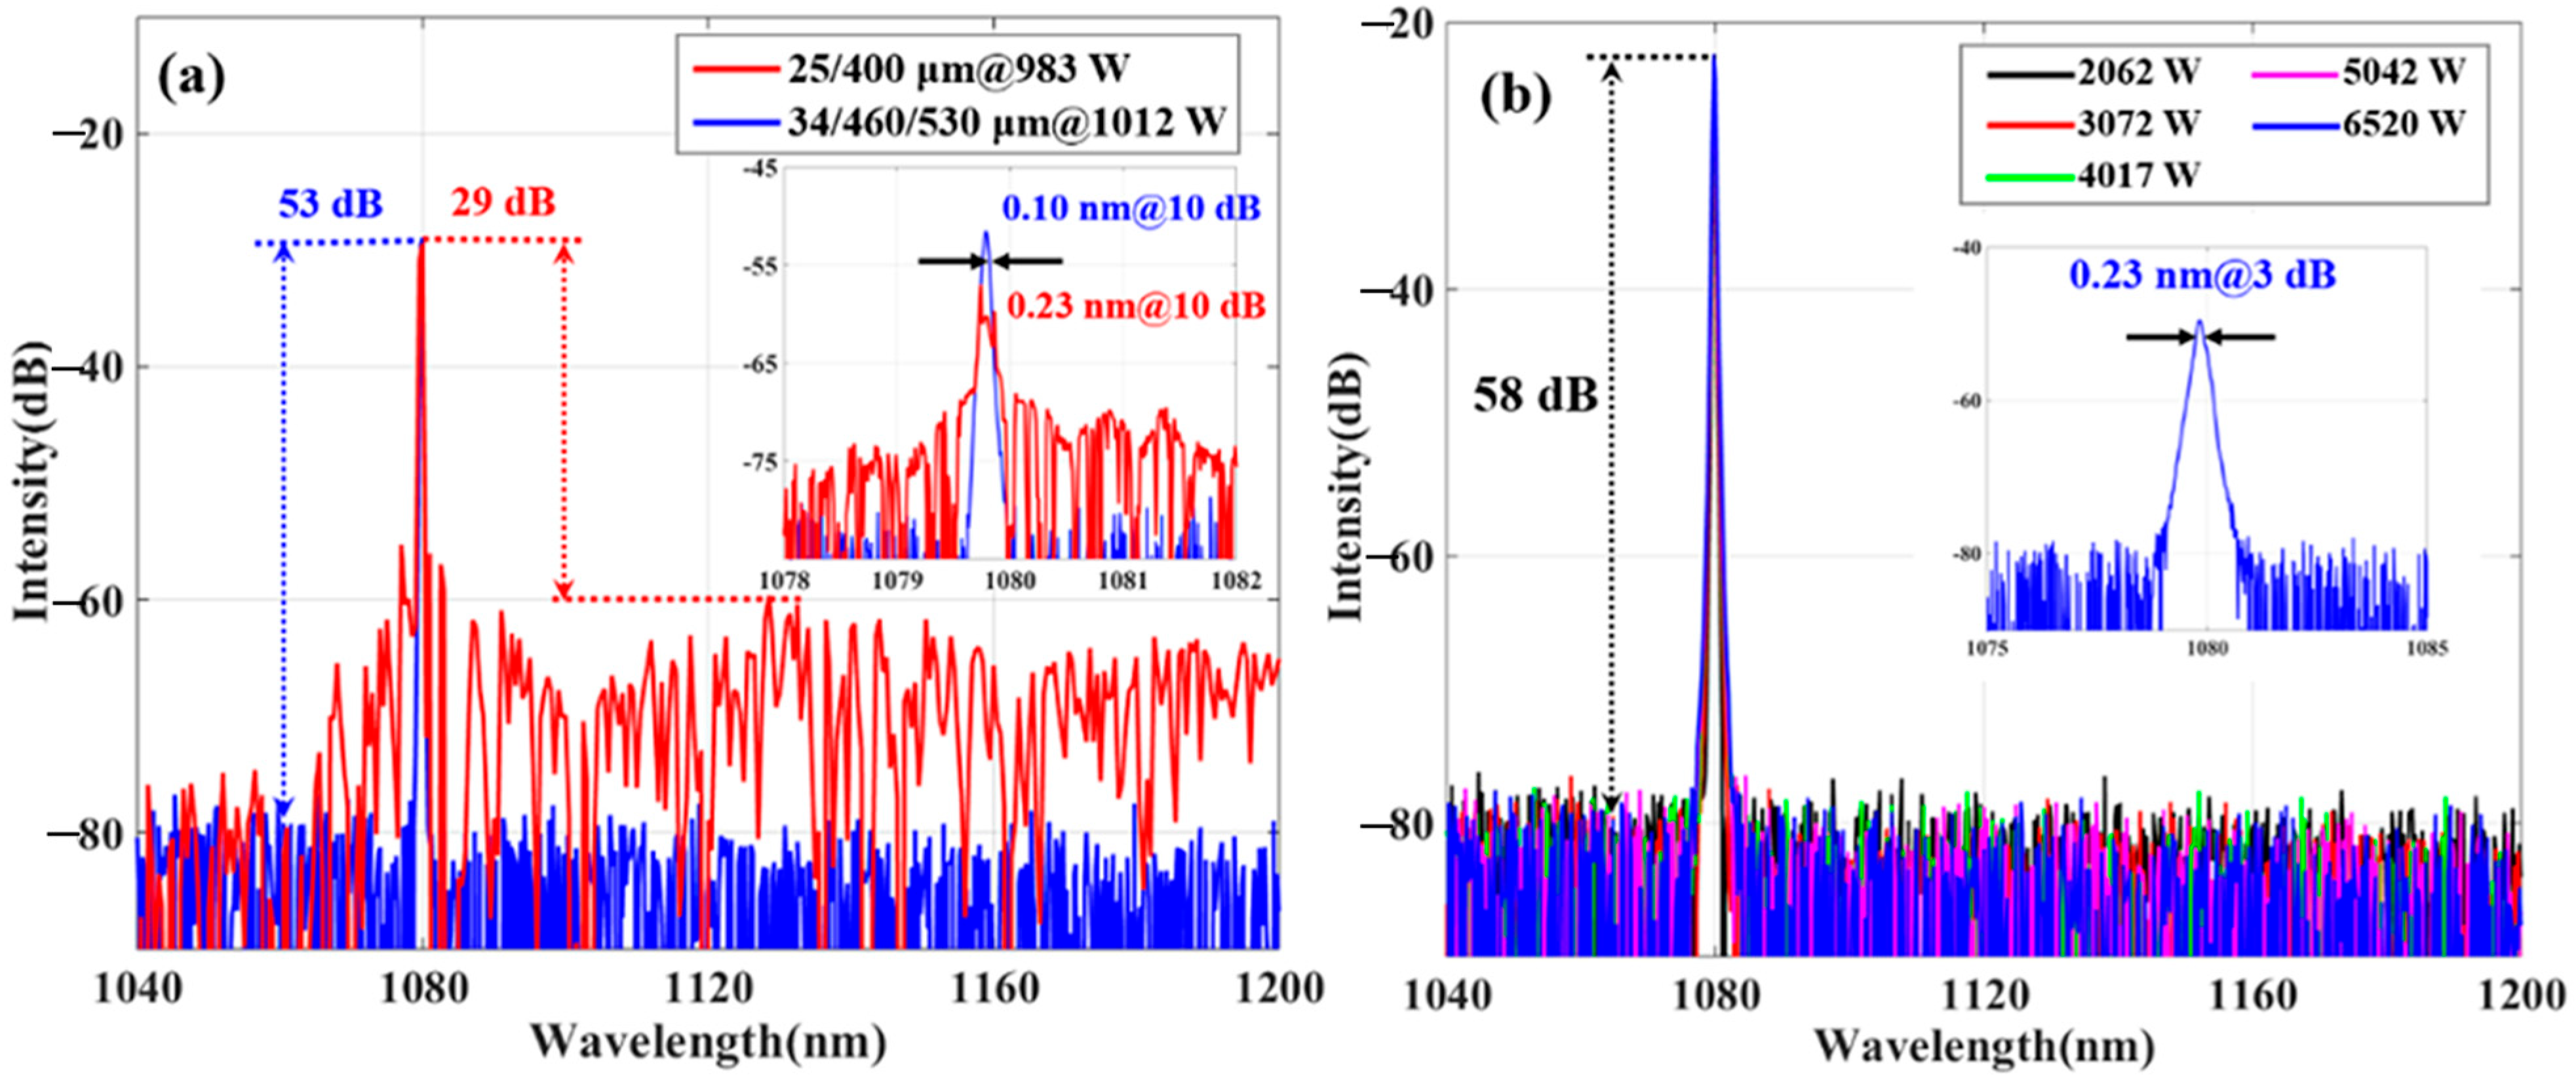
Figure 9a shows the spectrum of the pre-amplified seed light when the power is 100 W and the spectral SNR is greater than 45 dB. The experimental results from the above section show that there is no MI in the seed light at this time. The red curve in
Figure 9a shows the output spectrum at a power of 983 W for the main amplifier. The presence of a spectral secondary sideband in the range of −4.6 THz to 5.1 THz at the central wavelength 1080 nm indicates that the cascade MI phenomenon in the amplifier is consistent with the simulation results when the laser power is 983 W. The phenomenon that the Stokes light spectrum produced from cascaded MI is wider than that of the anti-Stokes light spectrum can be related to Raman gain. The self-pulse induced by the cascaded MI enhances the SRS effect and produces Raman light with a deviation of 29 dB from the main peak intensity. The stronger Raman light also produces positive feedback to the Stokes light generated by MI, which broadens the gain spectrum. The inset in
Figure 9a shows the zigzag spectral secondary sideband generated in the cascaded-MI gain spectrum range at a power of 983 W, presenting sawtooth spectral lines with a spectral interval of about 0.5 THz, which is consistent with the simulation results.
Figure 9b shows the output spectrum of the laser system in a wavelength range of 1078 nm to 1082 nm. The blue curve in
Figure 9b is the output spectrum of the pre-amplified seed source, whose 10 dB linewidth is 0.09 nm, and no secondary sidebands are found in the spectrum. The red curve in
Figure 9b shows the spectral linewidth of the main amplifier. Due to the occurrence of cascaded MI, the 10 dB linewidth in the seed light is broadened from 0.09 nm to 0.23 nm after being expanded by the main amplifier, and the main peak of the signal light, or the pump light, is split by the cascaded MI, creating a strong increase. The experimental results show that cascaded MI occurs during seed-light amplification in the few-longitudinal mode. The cascaded MI will excite the jagged spectral secondary sideband with a wide wavelength range, reduce the spectral SNR and cause spectral splitting in the signal light main peak, resulting in spectral broadening. These phenomena are consistent with the simulation results. This experiment validates the theoretical model of cascaded MI and illuminates its spectral evolution.
The red spectral line in
Figure 10a corresponds to the experimental results in
Figure 9a. In this case, the cascaded MI reaction occurs in the narrow-linewidth double-clad fiber amplification system with a 25/400 μm fiber, and there are jagged secondary sidebands in the output spectrum. The SRS effect is established due to the cascaded MI, and the spectral SNR is 29 dB. The blue spectral line in
Figure 10a shows the output spectrum of the narrow-linewidth triple-clad fiber amplifier with a 34/460/530 μm fiber when the output power is 1012 W. There are no spectral sidebands, and the spectral SNR is greater than 58 dB, indicating high spectral purity. It can be seen that a triple-clad fiber with a large mode field can effectively suppress MI. The red and blue curves in
Figure 10a show the spectral linewidth of the fiber at 25/400 μm and 34/460/530 μm, respectively. Due to the cascaded MI, the 10 dB linewidth of the seed light is broadened from 0.09 nm to 0.23 nm after being amplified by a 25/400 μm fiber amplifier, and the main peak of the signal light as the pump light is split by the cascaded MI with a strong increase. However, the 10 dB linewidth of the seed light amplified by the 34/460/530 μm fiber amplifier is only widened by 0.01 nm. When the output power of the triple-clad fiber laser experimental system is amplified to 6520 W, the spectral diagram is obtained, as shown in
Figure 10b.
Figure 10b shows the output spectral curve in the range from 1040 nm to 1200 nm when the output laser power increases from 2062 W to 6520 W, and no spectral sideband secondary peak appears with the increase in laser power. When the maximum output power is 6520 W, the SNR of the output spectrum is higher than 58 dB. The illustration in
Figure 10b shows the spectral linewidth of the laser with the 3 dB linewidth of 0.23 nm at maximum output power, without spectral sidebands. The experimental results are consistent with the simulation results. An increase in the area of the mode field can effectively suppress cascaded MI and spectral broadening and produces a laser output with high power and high spectral purity.
