In this section, we present numerical results when some of the parameters that can be controlled in a Zeno-type experiment are varied in order to observe their influence on the evolution of the V system under consideration.
3.1. Weak “Measurement Pulse” and Few Pulse Measurements
In this set of results, we analyse when the strength of the interaction is “weak” either because (a) the amplitude of the measuring field is itself low, i.e., or (b) because the number of measurements is small or (c) both of these instances at the same time.
For each of these cases, the system is prepared with 100% of its population occupying level .
Figure 3 shows the population evolution of each level when
for 12 measurements pulses (
Figure 3a) and for 52 measurements pulses (
Figure 3b). We can see that, with the same value for the Rabi frequency, with few measurement pulses, almost no population is transferred to level
, as we can expect because of the weak interaction. However, as the number of measurement pulses is increased, the share of population of level
is slightly increased, even if we have this weak interaction.
This evolution is also shown when
= 20 and
= 3.256 for
n = 12 (
Figure 3c) and
n = 52 (
Figure 3d), respectively. Again, we can see that changing the number of measurement pulses alters the evolution of the atomic population. In this particular instance, as
is about six times the value of
and
n = 12 the population share between levels
and
is practically the same (
Figure 3c). On the other hand, when
n is increased to 52 (
Figure 3d), the population in level
is greatly increased.
So, when we have or a few times bigger than , by changing the number of measurement pulses (and, consequently, the time interval between measurements ) the behaviour of the population transfer can be deeply altered.
Now, in
Figure 4, we have eight measurement pulses in the full
pulse but this time
= 700. In this case, the population of the system is mostly (and equally) distributed between
and
with a smaller fraction of the population for level
, as can be expected because the stronger interaction between levels
and
is dictated by the value of
.
Note that, in the examples of
Figure 3d and
Figure 4, the maximum transfer of population to level
is similar (about 10%); however, the change in the number of measurement pulses and the increased value of
lead to a very different share of the population between levels
and
. So, not just the value of the Rabi frequency
may alter the population transfer but also, in combination with a change in
n, the population sharing among the three available levels can be altered.
Figure 5 shows two examples of how
changes when the strength of the external field is low (below saturation) and the number of measurement pulses is increased from 0 up to 52,
= 20 for
Figure 5a and
= 100 for
Figure 5b. In this case, the Zeno Effect may not occur, regardless of the number of measurements made. We can see that for each measurement
n, the trajectory of the population density
cannot be kept constant over time as is expected in a Zeno dynamic. Recall that, as
n increases, there is different temporal spacing for
, as defined by
Figure 2.
In the 3D graphics below, when there are no measurement pulses, (n = 0) is just the coherent transfer of population form level to ; then, as the number of measurements pulses increases, we can see how the evolution of the system changes, although it is not enough to freeze the system’s evolution. It is worth to note that, from an ideal Zeno experiment, the number of measurement pulses grows towards infinity; then, even if the external field is “low”, the continuous measurement will freeze the evolution of our system. However, in a real experiment, both and are finite and there is a maximum of these time intervals that can be accommodated in a pulse, so in practice we are limited in how many pulses we can apply and whether or not the Zeno-behaviour can be achieved.
In
Figure 5, as we can see, stronger interaction with the external field results in a more complex evolution with more oscillations, although they are smaller in amplitude. For the first example (
Figure 5a), we go from the coherent transfer of population to, as
n grows, just a couple of oscillations in
. When
is increased (
Figure 5b), we can notice that, with
n up to around 20, we predominantly observe a population transfer to level
. However, while increasing the number of measurement pulses, we enter a behaviour with more oscillations but a smaller amplitude, i.e., towards a freezing of the population in level
. So, as stated before, in the limit where the duration of the measurement pulses decreases and the number of measurement pulses is increased, we would recover the Zeno dynamics.
So far, in the examples shown above, we have seen that the behaviour of the population transfer within a pulse can be greatly modified either by changing the number of measurement pulses or by changing the strength of the interaction between levels and .
So, what would happen if we keep increasing the value of until saturation?
3.2. Freezing of Atomic Populations by Measurement Pulses beyond Saturation
The graphs we present below show the manipulation of the trajectories of the three atomic levels. They have in common that during the pulse and decay , the levels and interact strongly through , i.e, at the saturation intensity (or above) of the to transition, with n = 52 and consequently short time intervals .
In
Figure 6 we present a case in which the population has been equally prepared, such that
=
=
= 33%. Under this strong interaction and at the scale of the figure, there seems to be no variation in the
(
i = a, b, c) levels and each population level remains constant (
Figure 6 and
Figure 7).
However, zooming in on
Figure 6, we can observe that indeed there is a very small population oscillation between states
and
dictated by the applied pulses at
. So, in a coarse scale, we can not see a change in the population levels. Just when we go to a finer scale (the third decimal figure) the small population exchanges can be observed. Note, that for this graph, the three lines (red, green and blue) are also superimposed.
So, under strong
interaction, as we see in
Figure 6, the
,
and
states maintain the initial population distribution, no matter how the system is originally prepared.
Similarly,
Figure 7 shows, as in the previous figure, over the duration of the
pulse, there is no change in population under the condition of a strong interaction mediated by a large
.
Of course, the examples shown above are classical archetypes of Zeno dynamics. Here, they are shown in order to compare what happens when there is very strong interaction by setting well above saturation, opposite to what we saw in the previous section when we modified either n or the value of .
3.3. Entropy and the Role of Strength
Let us determine the entropy between the measuring system with a single mode field with frequency . As we will see in what follows, the entropy is at its maximum when we have a Zeno-type dynamic, no matter what the initial population distribution might be.
As this system is bipartite, the Schmidt decomposition guarantees that for any instant in time
t, we find bases {
} for the atom and {
} for the field, such that state of the system can be written as
We also find that the reduced density matrices of the atom and field in these bases are identical
Based on Equation (
7), we parameterize the density matrix in this basis specified by
and
with components of the Bloch vector [
23]
and then we obtain
where we know that, for a mixed state
holds.
Then, to numerically evaluate the entropy between the measurement system and a single electromagnetic field mode (
), we use the Von Neumann entropy [
24]:
Figure 8 shows the time evolution of entropy for different frequency values of
and different sets of initial population values. For these simulations, the parameters
,
,
,
and
n are as described in
Figure 6 and
Figure 7.
In the first three instances, the initial population has been set in just one of the three levels of the system. In the next three examples, a mixture of populations among the levels was prepared.
The first obvious observation is that, as the value of is increased towards saturation and beyond, we obtain a Zeno-type dynamic—where the population distribution is frozen—and the entropy rapidly tends to its maximum and remains there for the whole simulation.
Is also worth pointing out that, as general trends from these graphics, if the system is prepared with all its population either in or , regardless of the value, the entropy starts with a value of zero, whereas if the system in prepared in , the entropy always will start at its maximum possible value.
In
Figure 8d, where the simulation is prepared with
=
= 0.5 and no population in level
, we can observe that the entropy does not begin at its maximum value, like in
Figure 8a, nor in zero, as in
Figure 8b or
Figure 8c. Meanwhile, for
Figure 8e,f, where at the beginning there is population en each of the three levels (although with different proportions) and specially as level
is populated, the entropy starts from the maximum value. Note that, for these last two examples, there are variations in the entropy, but the size of them is very small, and its value always lays very close to the maximum.
So, we also could interpret changes in entropy as a measure of what the strength of should be in order to alter the evolution of these kinds of systems, from a pure coherent evolution ( = 0) to a Zeno-type dynamic when 100 and well beyond saturation, in which we have freezing of the atomic populations.
3.4. Driving a System via Zeno-Type Measurements
Here, we present the driving of an atomic V-type three level system via Zeno-type measurements combined with periods of free evolution while also showing the calculation of entropy between the levels and .
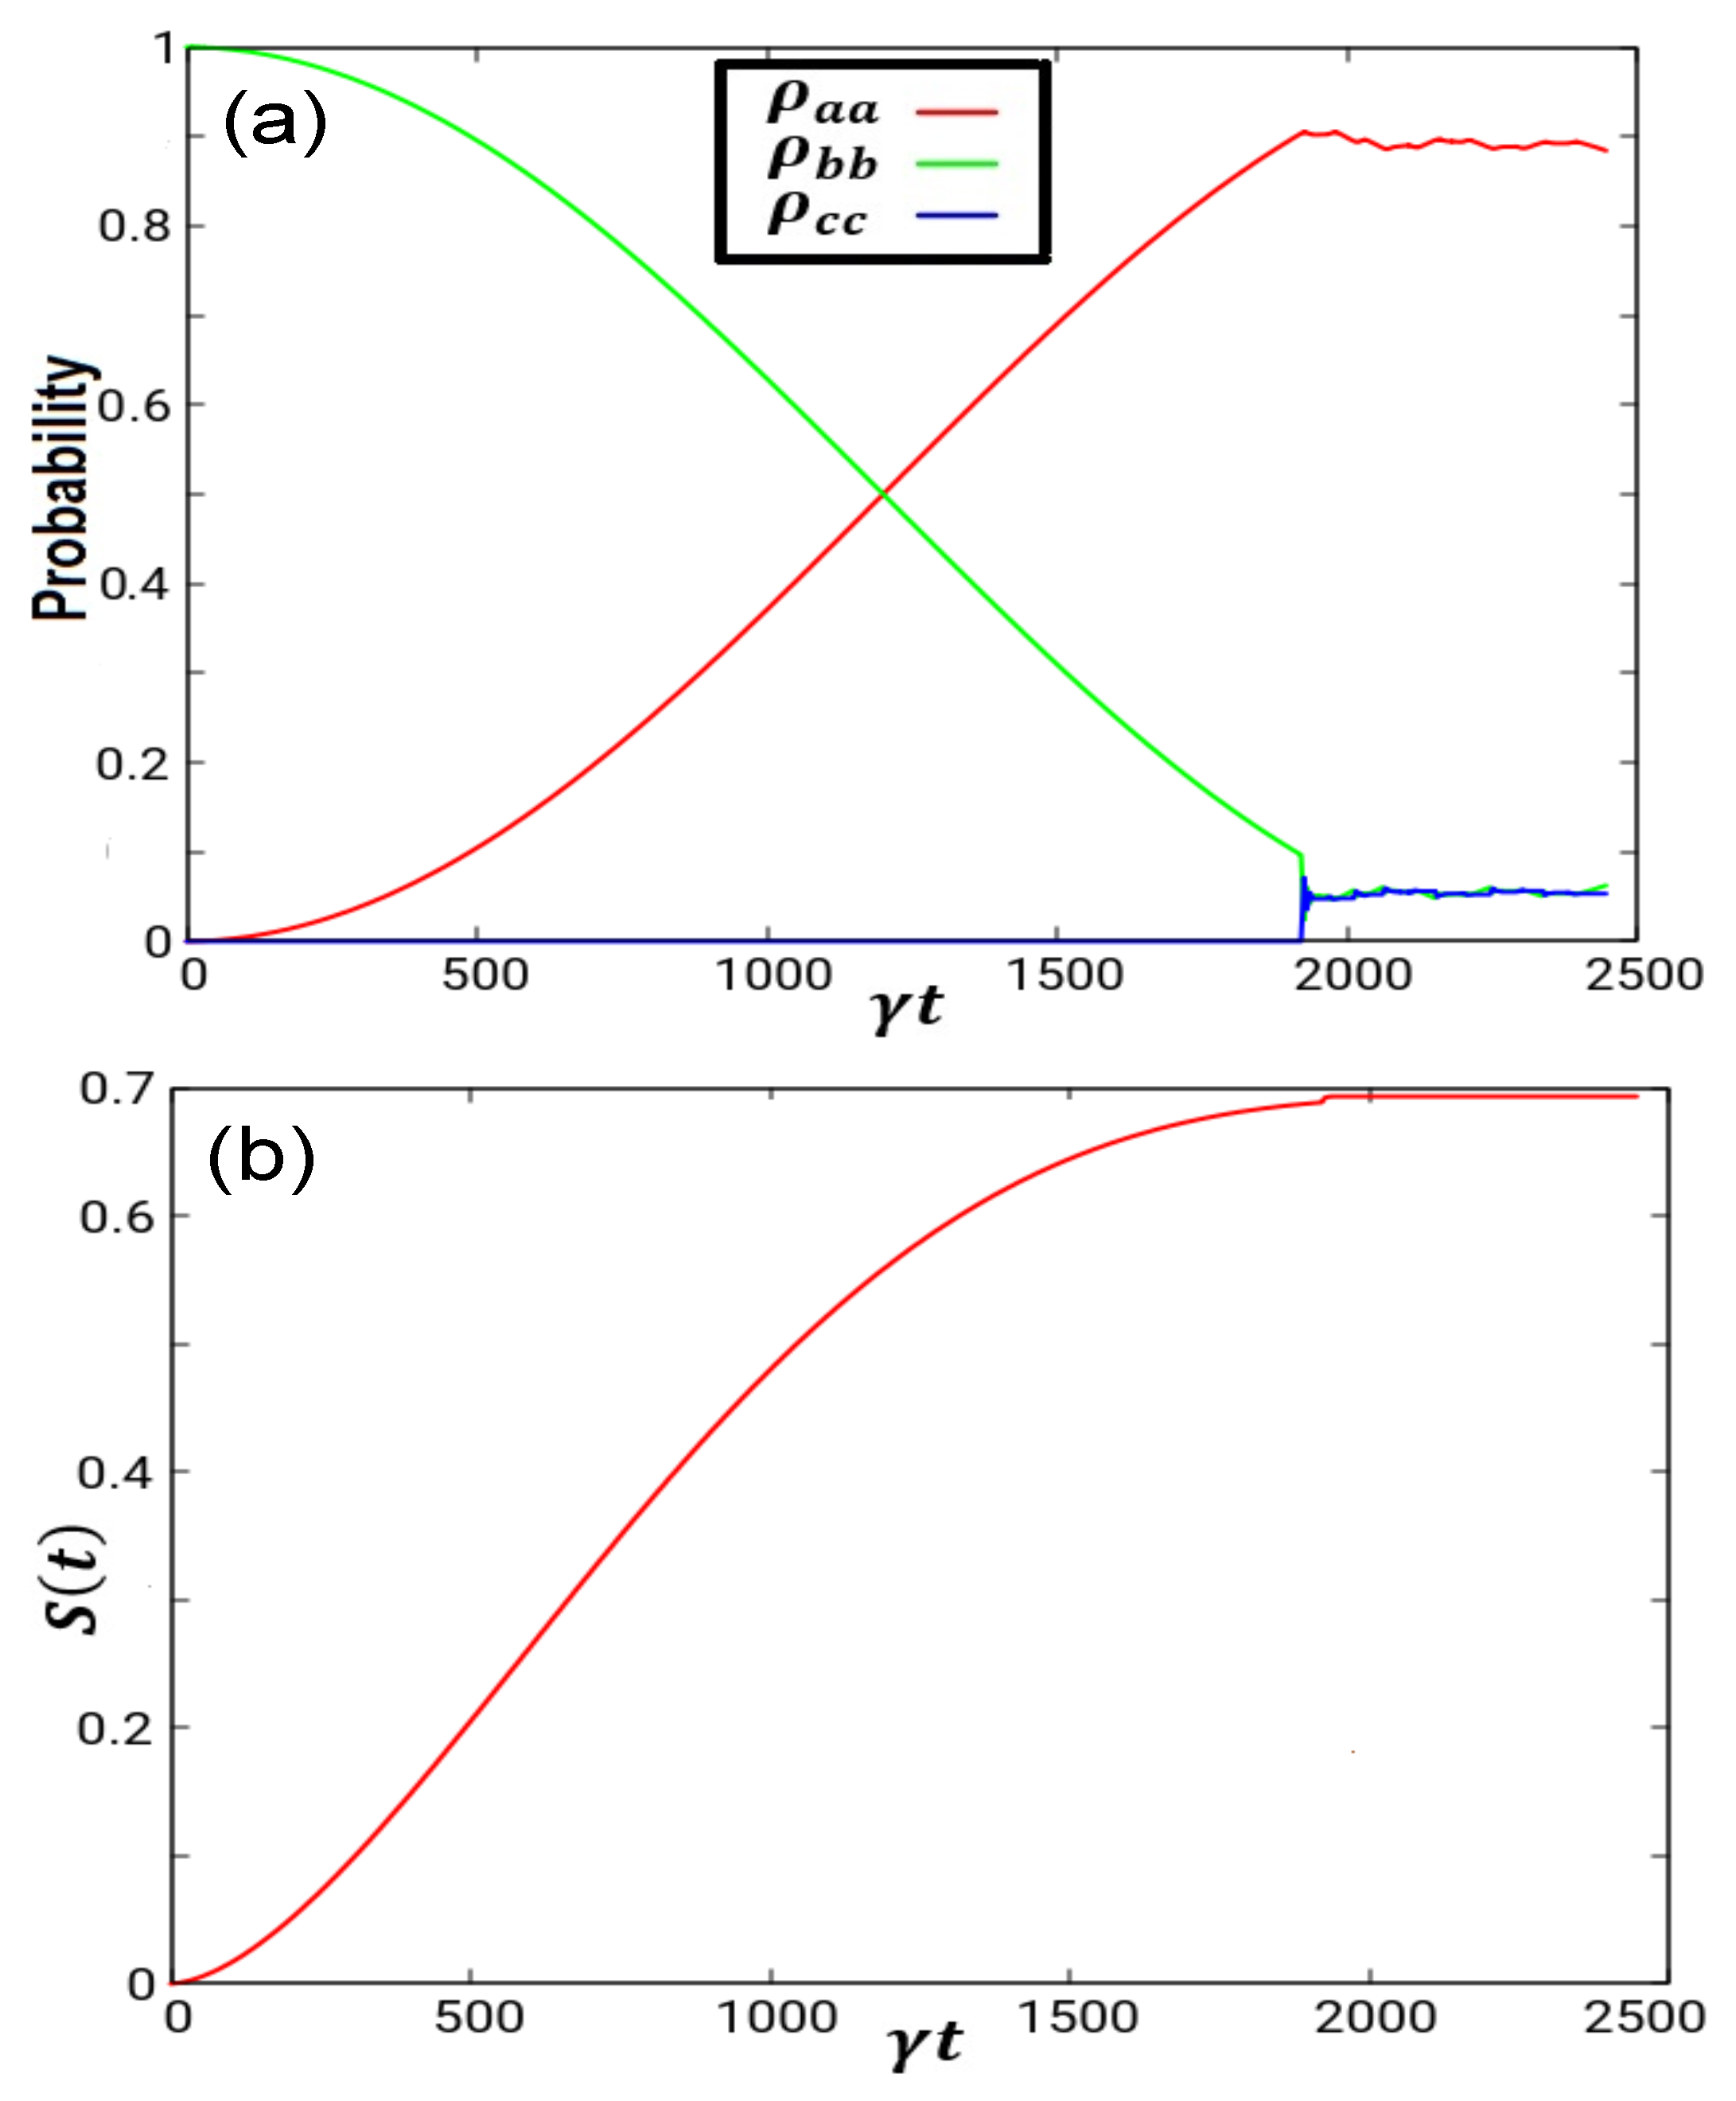
Figure 9a presents a system evolving from its initial state (with all the population in
) where the pulse driving the
↔
transition has been applied until
= 1920. By then, 90% of the population has been transferred to state
and the rest has been distributed to the other two states, i.e., it is just a typical example of coherent transfer of population where the driving pulse has been paused before finishing the full
pulse.
Figure 9b shows the entropy of the event.
In
Figure 10a, we present an example where, from the start of the simulation and up to
= 2405, all the population is equally split in states
and
and no population in
, while a
-pulse and measurement pulses (
n = 52) with
= 1000 are applied.
This time, we follow the evolution of the system for a time equivalent to
= 40,000. After the time
= 2405 (the duration of the
-pulse) just the
is left on and no more measurement pulses are applied. As can be observed in the figure, we have a coherent evolution between states
and
and the decaying of the population of level
, in this case from 0.5 to around 0.22 in the simulation time showed here. As level
decays, the population lost by this level is gained by the other two.
Figure 10b shows the entropy evolution of this example.
Figure 11 shows an example where, starting from a population distribution of 33% in each level, we have just the presence of the
with no measurement pulses from the very beginning; hence, we obtain the coherent evolution of the levels
and
and the decay from level
.
So, assume that for a particular experiment and starting from the initial conditions illustrated in
Figure 11, we would need to reach a population of 25% in level
. We could wait a period equivalent to
15,000 and from there start with measurement pulses with
larger than the saturation intensity, so the population in
(and
and
) will remain constant.
So, we can have a method that starts from some arbitrary set of initial values for the population levels, allowing us to design a sequence of Zeno-type measurements (i.e., a -pulse and measurements pulses) followed by time intervals when or (or both) are present to reach a desired final population distribution set.
As an example, in
Figure 12, once again we start with a population distribution of 33% in each level. From there, a Zeno-type interval which keeps the populations unchanged, followed by a period where just the
field is present (with the concomitant decay from level
), then another time interval (from
= 7615 up to
= 10,000) when Zeno-type measurement is applied, so the population distribution remains unchanged. Note that the population in
has been increased to 35%. From there, and up to
= 23,200, neither
nor
are present, so, the population from level
starts to decay to
and the population in
remains constant as, in this time scale, decay from
to
plays no role. From
= 23,200 up to 25,500, just
is present, so we have coherent evolution of
and
while
continues its decay. Finally, from 25,500 up to 30,000, a new period of Zeno-type dynamics is applied, such that population in
reaches 40% while the rest of the population is equally distributed between
and
.
Figure 12b shows the entropy evolution of this example.
So, we have shown a simple example of how the population distribution can be manipulated to obtain a different share of the population among the accessible states by applying different pulse sequences.
3.5. Discussion
In this paper, we have shown numerical calculations based on the description, with Bloch equations, of a V-type atomic system, and presented its evolution when subject to two electromagnetic fields, one inducing a -pulse and a second one being used as a sequence of “measurement pulses” within the time interval of the -pulse. This representation has been used before to describe Zeno-type dynamics. Here, we use it in a more general fashion, as we explore what occurs when some of the parameters relevant to the model are changed such that an incomplete Zeno dynamic is obtained.
In
Section 3.1 we analyze some of the consequences of varying either the number (
n) of applied measurements pulses or the strength (
). We have seen that when the number of measurements pulses is reduced and/or the
is changed, the evolution of the population at each level may be profoundly altered, which in turn, suggests a method that could be used to control the time-evolution of the atomic populations in each level. In
Section 3.2, we have shown typical examples of Zeno-type dynamics when the strength of
is well above saturation, in comparison with the previous section. We recall that Zheng et al. [
25] have shown experimentally in NMR qubits that by changing the measurement pulse duration (
according to our notation) the Zeno dynamics can be changed or even be suppressed. So indeed, Zeno-type dynamics can be used to control the evolution of a qubit.
Section 3.3 shows the results where
is changed, from well above saturation towards
zero. As we have seen, from saturation and beyond, we already know we have Zeno-type dynamics and in the graphics of this section, we can observe that the value of the entropy always reaches the maximum. So, although the entropy is calculated between the “auxiliary” measurement system and the single mode field (
), if this quantity is maximized and remains constant during the simulation, then we know that we have a Zeno-type dynamic where the population in all three levels remains constant.
It is also interesting to ask a general question about the minimum field strength (or “how many photons are needed”) required to change the dynamics of a system, and this study may pave the way to a more systematic study of such a question. Based on earlier experiments with atoms with few photons in cavities, it can be argued that just one is enough; in this cavity-assisted system, we have quantum revivals with a mean photon number of one. However, in the situation studied here, we do not have the presence of the enhancing cavity but a three-level system (or an ensemble of them) confined in a region of space (by an ion trap, for example). In such a situation, we must still consider the valid question of whether one photon is enough to modify the dynamics of a system. We could phrase this question differently: how many photons are needed to collapse the wavefunction?
We have discussed how, starting from sequences of Zeno-type measurements and time intervals where just the
field is applied, a control in the population distribution can be obtained for the system studied here. These results should be applicable to any type of V-type system, trapped atoms or solid state quantum qubits, for example. In
Section 2, our simulations show that a careful combination of the strength of the measurements pulses and/or the number of them can greatly alter the evolution of the system.
Finally, in
Section 3.4, we have shown that is possible to drive the population levels of a V-type system (within the limits of the Bloch equations), in principle, in a deterministic way, such that, starting with a given set of initial population in each level, we could reach any other desired distribution of population in each of the atomic levels as long as we can find a suitable sequence of pulse measurement combined with free evolution of the atom.
At this point, needless to say, in our simulations we have not intended to obtain the most efficient pulse sequence to achieve the fastest route from state A (initial populations ) to state B (). Such questions will be addressed in future studies.
3.6. Conclusions
As was mentioned before, for the implementation of quantum technologies, the best possible control of the diverse parts of the system must be achieved. In this context, we have presented results showing how, by changing the parameters normally used to induce a Zeno-type dynamics (the freezing of the atomic populations due to frequent measurements) in a V type system, control of the population levels can be achieved.
As intuition would suggest, we would expect that by changing the strength of the field, we can modify the system behaviour, as shown by the simulations. However, as we have also presented, weak pulses combined with a change of the number of pulses can lead to a very different dynamical behaviour. We also showed how the calculation of the entropy is a useful parameter for determining whether we have a Zeno dynamics.
So, with a careful selection of relevant parameters such as the field strength or the number of the measurement pulses, the control of the population’s levels can be realised. We have shown that for different initial conditions in the population levels, an appropriate sequence of pulses followed by time intervals when just one external field is present can be used to achieve any another needed distribution between the accessible states.

