Article

Capture Dynamics of Dielectric Microparticles in Hollow-Core-Fiber-Based Optical Traps

1
School of Physical Science and Engineering, Beijing Jiaotong University, Beijing 100044, China
2
School of Optics and Photonics, Beijing Institute of Technology, Beijing 100081, China
*
Author to whom correspondence should be addressed.
These authors contributed equally to this work.
Photonics 2023, 10(10), 1154; https://doi.org/10.3390/photonics10101154
Submission received: 21 August 2023 / Revised: 12 October 2023 / Accepted: 12 October 2023 / Published: 13 October 2023
(This article belongs to the Special Issue Optical Fiber Sensors with a Specialty Fiber Tip)

Abstract

:
Optical traps formed in hollow-core fibers (HCFs) can overcome several limitations of conventional free-space optical tweezers. One of the key issues is to load particles from free space into the hollow core with high efficiency, in which process the capture dynamics of the particles in front of the HCF endface plays an important role. In this work, a comprehensive model of the trapping and capture process of the dielectric particles in front of HCF is established by taking into account the features of the fiber modes and the motional parameters of the particles. Stable capture positions are predicted based on analytical calculations of optical forces, and the dependencies of the equilibrium axial trapping position on the beam numerical aperture, the fiber core and particle diameters are provided. In addition, the trajectories and the capture dynamics of the particles are studied by solving the equation of motion for the particles under the impact of optical forces, predicting feasible parameter ranges of the initial amplitude and direction of particle launch velocity for achieving successful particle capture in front of HCF. The results can provide guidance for further improving the particle-loading efficiencies of the HCF-based optical traps, which may find applications of flying particle sensors and long-range particle binding in HCFs.

1. Introduction

Optical tweezers are one of the most revolutionary technologies in the field of optics and photonics, which are capable of manipulating micro- and nano-particles using the mechanical effects of light [1,2]. Due to the advantages of non-contact and nanometer precision manipulation, optical tweezers have become essential tools in many research fields, including fundamental physics [3], biology [4], and aerosol science [5]. Single-beam optical tweezers [2,6], also known as gradient force traps, use a highly focused single beam to levitate particles near the focal point. In contrast, dual-beam optical traps consist of two counter-propagating weakly focused laser beams that can achieve stable trapping through the balance of scattering forces over a long distance [7].
Ashkin [1] proposed the first horizontal dual-beam optical trap in the year 1970 achieving the manipulation of transparent latex microspheres in water. Ref. [8] built a dual-beam trap based on single-mode fibers, capturing polystyrene microspheres and yeast, proving that dual-beam optical trap can be realized through two single-mode fibers. Jess [9] et al. successfully captured polymer particles with 100 µm diameter at a power level of 800 mW in a dual-fiber trap configuration. Dual-beam trap permits multiple equilibrium trapping points between the two fiber endfaces. M. Kawano [10] et al. used fiber-based dual-beam optical trap to construct a multi-particle array, and then studied the binding dynamics of such an array. The residual misalignment between the two beams is found to introduce an imbalance of optical forces, causing the trapped particle to oscillate, rotate, and appear as complex motion behaviors [11].
Particle levitation and transport can also be achieved using ridge waveguides [12] and photonic crystal fibers [13,14,15,16,17,18]. An optical trap formed in hollow-core fiber (HCF) is a novel type of dual-beam trap with a super-long particle manipulation range. The system can selectively capture particles in front of the endface of the HCF and launch them into the hollow core [19], being levitated by the optical gradient forces. By changing the power differential between the counter-propagating beams, the particles can be propelled at a certain speed in either direction or stopped at a specific position along the fiber, by balancing the optical scattering forces from the two sides of the particle. In this configuration, the particles can be propelled over a long distance given by the fiber loss. In addition, HCF has the advantage of shielding the airflow on particles to form a stably optical trap. From the application point of view, Bykov [15] et al. constructed a flying particle sensor based on optically guided particles in HCF, demonstrating the function of distributed temperature, viscosity, and AC electric field sensing using flying particles.
HCF-based dual-beam optical traps can achieve precise alignment of the counter-propagating beams, avoiding particle oscillations and rotations induced by beam misalignment. One of the key steps in the experiment is to capture and to load particles into the hollow core with high efficiency. This requires an understanding of the stably trapping conditions in front of the fiber endface as well as the dependence of trapping dynamic on the particle motion initial parameters, which are essential for further improving the particle capture the successful rate. In this work, we report a detailed analysis of the optical gradient and scattering forces, as well as the capture dynamics by solving the particle equation of motion. By modeling the motion states of particles during the capture process, we investigate the conditions for stable particle capture and the axial stable capture position.

2. Optical Forces in Dual-Beam Trap in Front of HCF Endface

The sketch of the HCF-based optical trapping system is illustrated in Figure 1. A laser beam with a central wavelength of 1064 nm is split into p and s polarizations after passing through a half-wave plate (HWP) and a polarization beam splitter (PBS). Focusing lenses are used to couple the beams into both ends of a horizontally placed HCF. The splitting ratio of the two beams can be adjusted by rotating the HWP. The optical trap formed in front of the HCF endface (the zoomed area in Figure 1) involves a diverging beam exiting from the HCF and a converging beam coupled into the hollow core from free space through lens 2. The waist of the p- and s-beam, which have orthogonal polarizations, are both located at the fiber endface as illustrated in the inset of Figure 1. The definition of the considered coordinate system is also sketched in Figure 1. Due to the symmetry of the system along the z axis (horizontal axis), only the particle motion in the x-z plane cut along y = 0 is considered.
Particles in the trap are subject to gradient and scattering forces. When the fundamental mode is launched into the HCF from both ends, under Gaussian approximation [19], the light intensity coupled into the HCF (+z direction) at the beam center can be written as I0,+z = 2P+/( π w 0 , + z 2 ), where P+ is the launched power through lens 2, w0,+z is the corresponding beam waist radius. For the beam emitted from HCF (−z direction), its waist diameter is related to the fiber core diameter D as w0,−z = 0.345D [20], giving a corresponding light intensity I0,−z = 5.33P/D2, where P- is the transmitted power from HCF. In this situation, the configuration forms an asymmetric dual-beam trap due to the difference in the counter-propagating beam divergence. Under Rayleigh approximation, the scattering forces along the z axis generated from the +z and −z beam in front of the HCF endface read as:
F s c a t , z ( r ) = z ^ 0.67 α z π 5 n m d p 6 I 0 , z c λ 4 ( m 2 1 m 2 + 2 ) 2 1 1 + d z 2 z 2 e 16.8 x 2 D 2 ( 1 + d z 2 z 2 )
F s c a t , + z ( r ) = z ^ 0.67 α z π 5 n m d p 6 I 0 , + z c λ 4 ( m 2 1 m 2 + 2 ) 2 1 1 + d + z 2 z 2 e 2 x 2 ω 0 , + z 2 ( 1 + d + z 2 z 2 )
where d + z 1 = λ / π w 0 , + z 2 , d z 1 = 2.67 λ / D 2 , λ is the optical wavelength, r = x 2 + z 2 is the distance from the particle with respect to the origin in the x-z plane, c is the vacuum speed of light, dp is the particle diameter, np and nm is the refractive index of the particle and the surrounding medium, respectively, and m = np/nm. The correction factor αz takes into account the deviation of the Rayleigh approximation from the explicit solution of Maxwell equations when the particle diameter is approaching to wavelength λ. To estimate the correction factor, T-matrix method was also applied to calculate the optical forces, which is developed on the basis of generalized Lorentz–Mie theory to accurately solve the electromagnetic scattering problem [21]. Figure 2a–d compares the calculated axial optical force using Rayleigh approximation (FRL, z, red) and T-matrix approach (FTM, z, blue) for silica particles with diameters dp = 100 nm, 200 nm, 300 nm, and 400 nm. It can be seen the Rayleigh model agrees well with the T-matrix method when dp~λ/10, and the deviation grows as the particle size increases. Figure 2e,f (red dots) plots, respectively, the correction factor αz = FRL,z/FTM,z and αx = FRL,x/FTM,x, thus the ratio between the axial and radial optical forces, calculated using Rayleigh approximation and T-matrix method. It is found that αz more strongly depends on dp, and αx is close to unity for the considered range of dp. Given the particle refractive index, empirical equations relating the optical forces obtained from the Rayleigh approximation to the T-matrix method can be established for different particle diameters. The blue lines in Figure 2e,f are the corresponding polynomial fit to obtain the empirical equations. In the case of axial force, the fitting equation reads as:
α z = F R L , z / F T M , z = 21.52 d p 2 7.96 d p + 1.712
In the case of radial force, the fitting equation is:
α x = F R L , x / F T M , x = 0.78 d p 2 0.97 d p + 1.25
With Equations (3) and (4), the optical forces can be rapidly calculated even if the Rayleigh approximate becomes invalid.
Since the counter-propagating beam was set with orthogonal polarizations, the mutual interference between the beams can be strongly mitigated. In addition, the path difference of the counter-propagating beams can be set longer than the laser coherence length to further eliminate the interference effect [10]. Under this assumption, the total scattering force along z axis can be considered as the sum of the two contributions:
F s c a t , z ( r ) = F s c a t , + z ( r ) + F s c a t , z ( r )
Note the effect of lateral scattering force is negligible due to the small beam divergence.
The gradient force on the particle in the x and z directions are, respectively:
F g r a d , x ( r ) = x ^ α x π n m d p 3 x c ( m 2 1 m 2 + 2 ) [ I 0 , + z w 0 , + z 2 ( 1 + d + z 2 z 2 ) 2 e 2 x 2 w 0 , + z 2 ( 1 + d + z 2 z 2 ) + 8.4 I 0 , z D 2 ( 1 + d z 2 z 2 ) 2 e 16.8 x 2 D 2 ( 1 + d + z 2 z 2 ) ]
F g r a d , z ( r ) = z ^ 1.57 α z n m d p 3 z c ( m 2 1 m 2 + 2 ) [ ( 1 2 x 2 w 0 , + z 2 ( 1 + d + z 2 z 2 ) ) d + z 2 I 0 , + z ( 1 + d + z 2 z 2 ) 2 e 2 x 2 w 0 , + z 2 ( 1 + d + z 2 z 2 ) + ( 1 16.8 x 2 D 2 ( 1 + d z 2 z 2 ) ) d z 2 I 0 , z ( 1 + d z 2 z 2 ) 2 e 16.8 x 2 D 2 ( 1 + d z 2 z 2 ) ]
Given the gradient forces, when a small offset Δx from the equilibrium position of the trap is present along x axis, the particle is expected to experience a restoring force in the transverse direction:
F g r a d , x = k g r a d , x Δ x
kgrad,x is the transverse stiffness of the trap.

3. Equilibrium Trapping Positions in Front of the HCF Endface

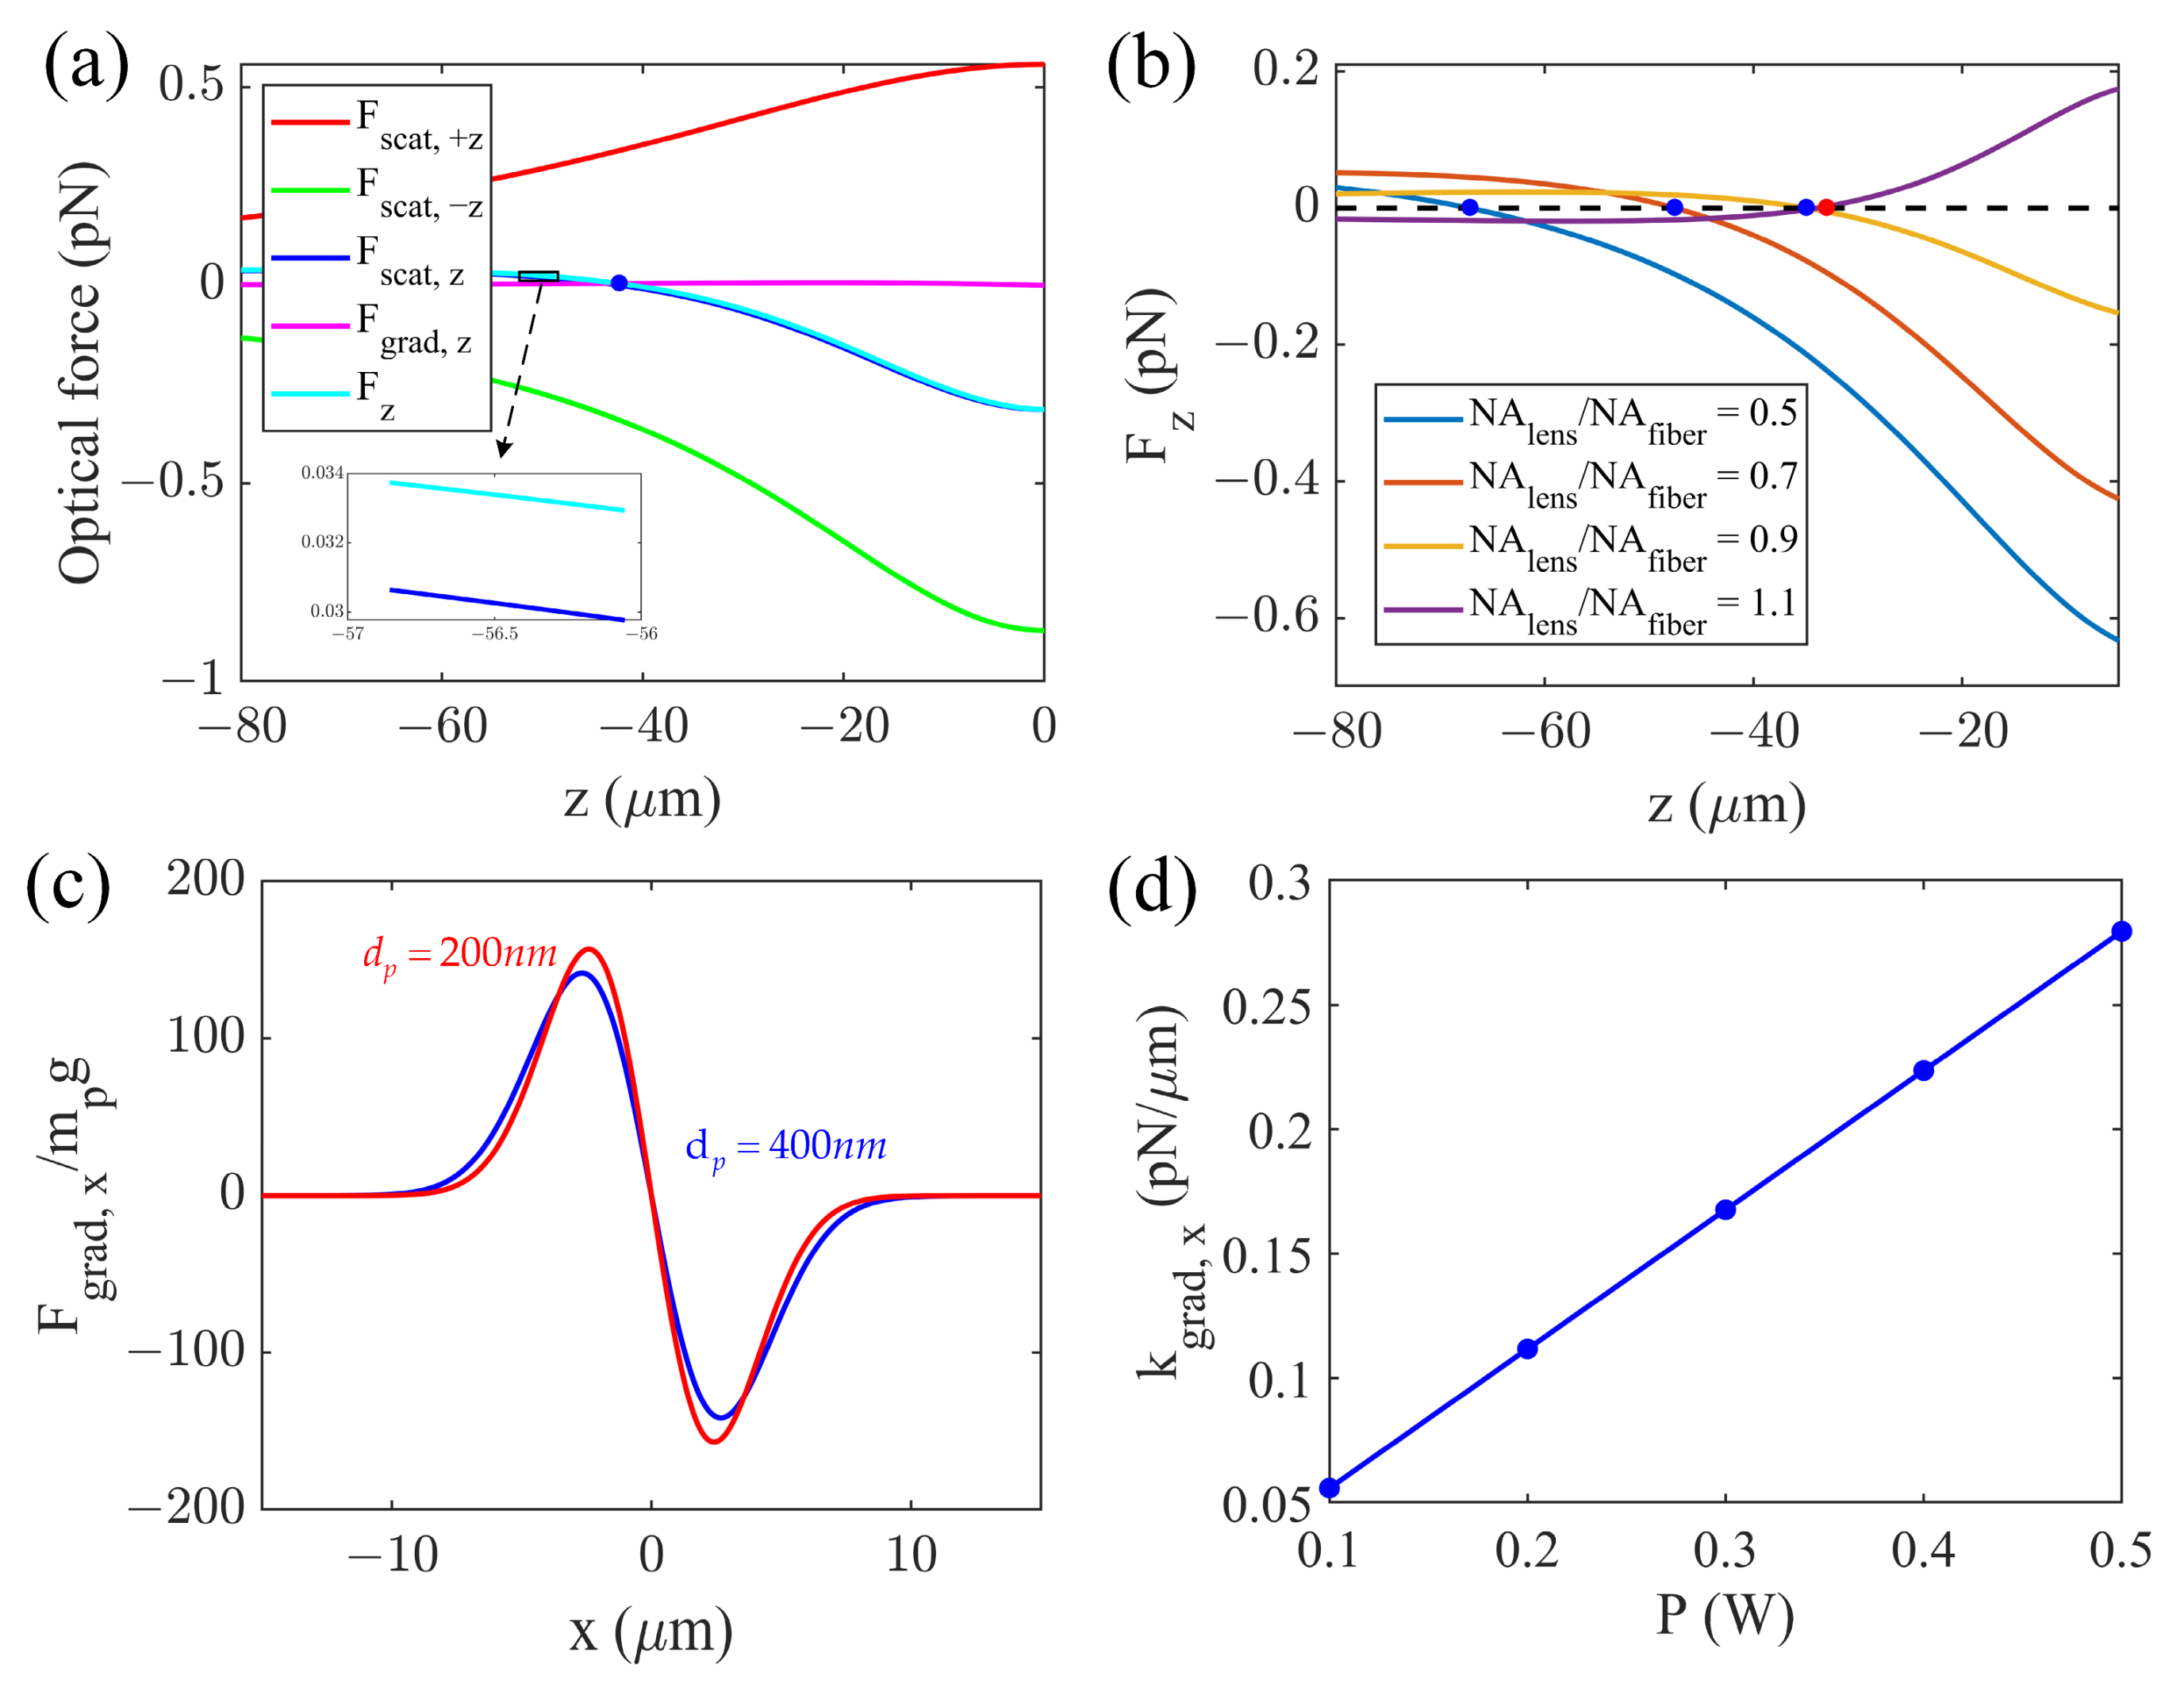
Based on the optical force calculation, the equilibrium positions of the trap (zeq) in front of the HCF endface can be predicted. Figure 3a plots the calculated Fscat,+z, Fscat,−z, Fscat,z, Fgrad,z and Fz = Fscat,z + Fgrad,z over z, where z = 0 denotes the position of fiber endface. The simulation parameters are set as follows: np = 1.45 (silica), nm = 1 (air), dp = 0.4 μm, the numerical aperture of the focusing lens (NAlens) and the fundamental mode of HCF (NAfiber = λw0,−z) is 0.08 and 0.1, respectively, D = 9.8 μm, λ = 1064 nm, and P+ = P = 100 mW. It can be seen that for dp = 0.4 μm silica particle, under the considered parameters, Fgrad,z is about one-tenth of Fz, the contribution of which is negligible. The blue dot marks the stable axial trapping point in which the Fz = 0 and the slope F z / z < 0 . Figure 3b plots the simulation curve of Fz over z under different ratios of NAlens/NAfiber. It can be seen that when NAlens/NAfiber is less than 1, stable trapping points (blue dots) are present and the positions of which become closer to the fiber endface when NAlens/NAfiber is approaching unity. In contrast, when NAlens/NAfiber is greater than 1, the slope F z / z is positive when Fz = 0 (red dot), indicating that it is an unstable trapping position. Thus, when the counterpropagating beams have equal power, it is necessary to satisfy NAlens < NAfiber in order to achieve stable particle trapping in front of the HCF endface.
In addition, to stably trap the particle in front of the HCF, the transverse gradient force needs to be strong enough to balance the gravity of the particle. Figure 3c shows the ratio of transverse gradient force Fgrad,x with respect to particle gravity mpg (mp is the particle mass, g is the acceleration of gravity) at the axial stable trapping point for different particle diameters. It is interesting to note that Fgrad,x/mpg barely changes for particles of different sizes, and the maximum Fgrad,x can be two orders or magnitude stronger than mpg. This indicates that for the considered particle diameters, optical gradient forces are able to form a deep enough trapping potential to overcome the particle random Brownian motion and thus achieve a stable capture of particles in front of HCF. Figure 3d plots the corresponding transverse trapping stiffness kgrad,x under different trapping powers (P = P+ + P = 2P+) for silica particle with dp = 0.4 μm, showing that kgrad,x increases linearly with the trapping power, as expected from the theory of optical tweezers.
The equilibrium position of the axial particle trapping is expected to depend on the particle diameter and the trapping beam divergence. Figure 4a plots the contour lines of equilibrium trapping position zeq versus particle diameter dp and NAlens/NAfiber when NAfiber = 0.05 (D = 19.6 μm). It can be observed that the NAlens has a more significant impact on the value of zeq than particle diameter dp. As dp increases, zeq decreases, thus the stable trapping point becomes farther from the HCF endface, the dependence of zeq on dp also becomes weaker. This is because for smaller particles, the amplitude of axial scattering (Fscat,z) and gradient forces (Fgrad,z) acted on the particle are comparable, both of which can affect the value of zeq. Since the beams propagating along +z and −z directions have distinct divergence, their difference in Fgrad,z can introduce a strong size-dependent effect. As the particle size increases, Fscat,z turns to be much greater Fgrad,z (see Figure 4c), the impact of Fgrad,z on zeq diminishes. In this situation, the value of zeq mainly depends on the balance between P+ and P−, which is independent on dp. Figure 4b displays the results when NAfiber = 0.1 (D = 9.8 μm). Compared with Figure 4a, it can be seen that the stable equilibrium trapping position becomes closer to the HCF endface when NAfiber is larger (thus for a smaller core diameter).
Figure 4c plots the effect of particle sizes on the value of zeq when NAlens = 0.08 and NAlens = 0.1, corresponding to the situation marked by the black-dashed line in Figure 4b. It can be observed that the stable trapping point moves farther from the endface when dp increases, and zeq varies sharply when dp < 0.3 μm as explained in the previous paragraph. When NAlens is varied, as shown in Figure 4d, the smaller the fiber core diameter, the closer the axial stable equilibrium point to the endface of the fiber. This is because the beam exiting the HCF has a larger divergence for a smaller core diameter, The corresponding outgoing beam intensity and the optical forces drop faster along z axis, causing the equilibrium trapping point to move towards the fiber endface.

4. Particle Capture Dynamics in Front of the HCF Endface

We further investigate the dynamics of the particle capture process in front of the HCF endface by solving the equations of motion in the x and z directions:
m p d 2 x d t 2 + 3 π η d p d x d t = F g r a d , x m p g
m p d 2 z d t 2 + 3 π η d p d z d t = F g r a d , z + F s c a t , z
where the related optical scattering and gradient forces are calculated by Equations (1)–(7), the terms of 3πηdpdz/dt and 3πηdpdx/dt are the corresponding viscous drag force acting on the particle in the z and x directions, η is the viscosity of air. The Runge–Kutta method was applied for numerically solving Equations (9) and (10), from which the particle trajectories and speed during the capture process can be explicitly obtained. The absolute and relative error tolerances of the iteration operation were both set as 10−6, which have been validated with the simulation convergence. The initial condition of the particle motion is given by the starting position (x0, z0) and the initial velocity (v0x, v0z). For convenience, the initial velocity is expressed in terms of its amplitude v0 and angle of incident θ0 = arctan (−v0x/v0z); thus, θ denotes the angle between the direction of the particle’s initial velocity with respective to +z axis (see inset of Figure 5b). The simulation parameters were set as x0 = 10 μm, z0 = −100 μm, np = 1.45, nm = 1, dp = 0.4 μm, mp = 0.87 fg, P+ = P = 10 mW, NAfiber = 0.1, and NAlens = 0.08.
The area enclosed at the right-hand side of the solid boundary lines in Figure 5a represents the regime that the particle cannot be captured. The cyan and red lines plot, respectively, the case of silica particles with dp = 0.44 μm and 0.4 μm. It can be seen that larger particles are more difficult to be captured in the given v0-θ0 parameter space due to their greater inertia. It is interesting to note that if the particles could be captured at one specific angle of incident (e.g., 0.51π when dp = 0.44 μm), it would be captured at any other incident angles. Figure 5a could be conveniently used to determine the suitable parameter space so as to increase the particle capture success rate.
Figure 5b plots the corresponding particle trajectories in the x–z plane in the vicinity of the HCF endface for the three marked cases (yellow dots) in Figure 5a when dp = 0.4 μm. It can be seen that for cases 1 and 3, starting from the initial position (red dot), the optical gradient force is capable of reducing v0x, guiding the particle towards the fiber endface and finally to the equilibrium position (red cross) after several seconds. For case 2, since the particle has a relatively high initial velocity, it quickly passes through the beam with a short duration of light–particle interaction time. The particle therefore cannot be captured by the beam since the particle momentum is too large to balance and the particle’s trajectory is barely changed by the optical forces. When the particle speed is slow enough to be captured by the beam (cases 1 and 3), its trajectory can be rapidly varied by the optical forces within a short period of time, as shown in the insets of Figure 5b.

5. Discussions

The initial position of the particle may also influence the particle capture dynamics. Figure 6 plots the trajectories of silica particles under different initial positions. The simulation parameters are set as dp = 0.4 μm, P+ = P = 10 mW, θ0 = π/4, v0 = 11.1 m/s. The red, blue, and cyan dots represent the situation when the initial position is (10 μm, −100 μm), (12 μm, −120 μm), and (1 μm, −100 μm), respectively. In case A, the particle can be stably captured by the beam. If the particle can be stably captured from a certain initial position (case A), under the same initial speed and angle of incident, it could also be captured when the incident from a position further from the optical axis (Case B). This is because air viscous drag could only reduce the kinetic energy of the particle and thus its speed. When the particle is incident from a position closer to the optical axis, it may escape from the trap due to a higher moving speed.
It is worth noting that multiple-particle trapping is also possible along the axial direction similar to the case of the longitudinal optical binding effect previously reported in HCF [19]. In this situation, once a particle is captured by the beam, the analysis of equilibrium positions as well as the conditions for capturing a secondary particle needs to take into account the particle–particle interaction and the optical binding forces. This will be investigated as future work.

6. Conclusions

The equilibrium trapping conditions and the dynamics of the particle capture process in the HCF-based dual-beam trap configuration are systematically investigated. It is found that the numerical aperture of the focusing lens is required to be less than that of the HCF to achieve stable particle trapping in front of the HCF endface. The parameter spaces for successful particle capture in front of HCF endface, in terms of particle initial velocity and its incident angle, are also given. The results provide a theoretical basis and a convenient look-up table for choosing suitable particle loading parameters including particle diameter, refractive index, numerical aperture of focusing lens and HCF, initial position and velocity of the loaded particles, which are expected to routinely guide lab experiments and numerous applications of HCF-based optical traps, for instance nano-particle deliveries and flying particle sensors.

Author Contributions

Supervision, S.X.; conceptualization, S.X.; methodology, K.L. and R.W.; software, K.L.; validation, K.L., R.W. and S.X.; writing—original draft preparation, K.L. and R.W.; writing—review and editing, K.L., S.X., S.S., F.X. and Y.J. All authors have read and agreed to the published version of the manuscript.

Funding

This work was supported by National Natural Science Foundation of China (No. 62275021) and Beijing Natural Science Foundation (No. 4232078).

Institutional Review Board Statement

Not applicable.

Informed Consent Statement

Not applicable.

Data Availability Statement

Not applicable.

Conflicts of Interest

The authors declare no conflict of interest.

References

  1. Ashkin, A. Acceleration and trapping of particles by radiation pressure. Phys. Rev. Lett. 1970, 24, 156. [Google Scholar] [CrossRef]
  2. Ashkin, A.; Dziedzic, J.M.; Bjorkholm, J.E.; Chu, S. Observation of a single-beam gradient force optical trap for dielectric particles. Opt. Lett. 1986, 11, 288–290. [Google Scholar] [CrossRef] [PubMed]
  3. Kheifets, S.; Simha, A.; Melin, K.; Li, T.; Raizen, M.G. Observation of Brownian motion in liquids at short times: Instantaneous velocity and memory loss. Science 2014, 343, 1493–1496. [Google Scholar] [CrossRef] [PubMed]
  4. Bustamante, C.; Macosko, J.C.; Wuite, G.J. Grabbing the cat by the tail: Manipulating molecules one by one. Nat. Rev. Mol. Cell Biol. 2000, 1, 130–136. [Google Scholar] [CrossRef] [PubMed]
  5. Hopkins, R.J.; Mitchem, L.; Ward, A.D.; Reid, J.P. Control and characterisation of a single aerosol droplet in a single-beam gradient-force optical trap. Phys. Chem. Chem. Phys. 2004, 6, 4924–4927. [Google Scholar] [CrossRef]
  6. Bustamante, C.J.; Chemla, Y.R.; Liu, S.; Wang, M.D. Optical tweezers in single-molecule biophysics. Nat. Rev. Methods Primers 2021, 1, 25. [Google Scholar] [CrossRef]
  7. Tauro, S.; Bañas, A.; Palima, D.; Glückstad, J. Dynamic axial stabilization of counter-propagating beam-traps with feedback control. Opt. Express 2010, 18, 18217–18222. [Google Scholar] [CrossRef]
  8. Constable, A.; Kim, J.; Mervis, J.; Zarinetchi, F.; Prentiss, M. Demonstration of a fiber-optical light-force trap. Opt. Lett. 1993, 18, 1867–1869. [Google Scholar] [CrossRef]
  9. Jess, P.; Garcés-Chávez, V.; Smith, D.; Mazilu, M.; Paterson, L.; Riches, A.; Herrington, C.; Sibbett, W.; Dholakia, K. Dual beam fibre trap for Raman microspectroscopy of single cells. Opt. Express 2006, 14, 5779–5791. [Google Scholar] [CrossRef]
  10. Kawano, M.; Blakely, J.; Gordon, R.; Sinton, D. Theory of dielectric micro-sphere dynamics in a dual-beam optical trap. Opt. Express 2008, 16, 9306–9317. [Google Scholar] [CrossRef]
  11. Rafferty, A.; Preston, T.C. Trapping positions in a dual-beam optical trap. J. Appl. Phys. 2021, 130, 183105. [Google Scholar] [CrossRef]
  12. Kim, J.; Shin, J.H. Stable, free-space optical trapping and manipulation of sub-micron particles in an integrated microfluidic chip. Sci. Rep. 2016, 6, 33842. [Google Scholar] [CrossRef] [PubMed]
  13. Benabid, F.; Knight, J.; Russell, P.S.J. Particle levitation and guidance in hollow-core photonic crystal fiber. Opt. Express 2002, 10, 1195–1203. [Google Scholar] [CrossRef] [PubMed]
  14. Gherardi, D.M.; Carruthers, A.E.; Čižmár, T.; Wright, E.M.; Dholakia, K. A dual beam photonic crystal fiber trap for microscopic particles. Appl. Phys. Lett. 2008, 93, 041110. [Google Scholar] [CrossRef]
  15. Schmidt, O.; Garbos, M.; Euser, T.; Russell, P.S.J. Metrology of laser-guided particles in air-filled hollow-core photonic crystal fiber. Opt. Lett. 2012, 37, 91–93. [Google Scholar] [CrossRef]
  16. Bykov, D.; Schmidt, O.; Euser, T.; Russell, P.S.J. Flying particle sensors in hollow-core photonic crystal fibre. Nat. Photonics 2015, 9, 461–465. [Google Scholar] [CrossRef]
  17. Xie, S.; Sharma, A.; Romodina, M.; Joly, N.Y.; Russell, P.S.J. Tumbling and anomalous alignment of optically levitated anisotropic microparticles in chiral hollow-core photonic crystal fiber. Sci. Adv. 2021, 7, eabf6053. [Google Scholar] [CrossRef]
  18. Li, Y.; Xin, H.; Zhang, Y.; Lei, H.; Zhang, T.; Ye, H.; Saenz, J.J.; Qiu, C.-W.; Li, B. Living nanospear for near-field optical probing. ACS Nano 2018, 12, 10703–10711. [Google Scholar] [CrossRef]
  19. Bykov, D.S.; Xie, S.; Zeltner, R.; Machnev, A.; Wong, G.K.; Euser, T.G.; Russell, P.S.J. Long-range optical trapping and binding of microparticles in hollow-core photonic crystal fibre. Light Sci. Appl. 2018, 7, 22. [Google Scholar] [CrossRef]
  20. Travers, J.C.; Chang, W.; Nold, J.; Joly, N.Y.; Russell, P.S.J. Ultrafast nonlinear optics in gas-filled hollow-core photonic crystal fibers. JOSA B 2011, 28, A11–A26. [Google Scholar] [CrossRef]
  21. Nieminen, T.A.; Loke, V.L.; Stilgoe, A.B.; Knöner, G.; Brańczyk, A.M.; Heckenberg, N.R.; Rubinsztein-Dunlop, H. Optical tweezers computational toolbox. J. Opt. A Pure Appl. Opt. 2007, 9, S196. [Google Scholar] [CrossRef]
Figure 1. Schematic diagram of HCF-based optical trap. Inset: the red solid and dashed lines represent the beam profile focused by Lens 2 and emitted from HCF, with arrows indicating the beam propagation directions. HWP, half-wave plate; PBS, polarization beam splitter.
Photonics 10 01154 g001
Figure 2. Comparison of the calculated axial optical forces using Rayleigh approximation (red) and the T-matrix approach (blue) for silica particles with diameter of (a) 100 nm, (b) 200 nm, (c) 300 nm, and (d) 400 nm. (e) Ratio of optical forces calculated using the Rayleigh approximation (FRL) and the T-matrix (FTM) method in the axial and (f) radial directions.
Photonics 10 01154 g002
Figure 3. (a) Calculated optical gradient and scattering forces acted on the particle along the optical axis when dp = 0.4 μm, NAlens = 0.08 and NAfiber = 0.1. (b) Calculated Fz under different values of NAlens /NAfiber. (c) Ratio of the transverse gradient force and particle gravity at the equilibrium trapping point for different particle diameters when NAlens = 0.08 and NAfiber = 0.1. (d) Transverse optical stiffness versus optical powers when dp = 0.4 μm.
Photonics 10 01154 g003
Figure 4. (a) Contour lines of the axial equilibrium trapping position zeq versus particle diameter dp and NAlens/NAfiber when NAfiber = 0.05 and (b) NAfiber = 0.1. (c) The axial equilibrium trapping position versus dp when NAlens = 0.08 and NAfiber = 0.1, corresponding to the situation marked by the black-dashed line in (b). (d) The relationship between the equilibrium trapping position and NAlens under different core diameters when dp = 0.4 μm.
Photonics 10 01154 g004
Figure 5. (a) v0-θ0 parameter space in the x–z plane determining the particle capture capability. The solid lines are the boundary separating the space that can or cannot achieve particle capture for different particle diameters. The area enclosed at the right-hand side of the boundary represents the case that the particle cannot be captured. (b) Plots of particle trajectories in the vicinity of the HCF endface for the three cases marked in (a) when dp = 0.4 μm. The red dot indicates the particle initial position, the arrows indicate the direction of trajectories, and the cross indicates the equilibrium trapping position. The two insets plot the zoom in of the regime in which the particle trajectories are rapidly changed.
Photonics 10 01154 g005
Figure 6. Trajectories of the particles in front of the HCF endface for different initial positions (dots). The arrows indicate the direction of trajectories, and the crosses indicate the equilibrium trapping position (if possible).
Photonics 10 01154 g006
Disclaimer/Publisher’s Note: The statements, opinions and data contained in all publications are solely those of the individual author(s) and contributor(s) and not of MDPI and/or the editor(s). MDPI and/or the editor(s) disclaim responsibility for any injury to people or property resulting from any ideas, methods, instructions or products referred to in the content.