1. Introduction
Fiber surface plasmon resonance (SPR) sensors have attracted great research interest for decades in biomolecular interactions and chemical analysis, owing to their advantages of high sensitivity, being label-free, and requiring less sample [
1,
2,
3,
4,
5]. In the past few years, compared to traditional fiber SPR sensors, multi-core fiber SPR sensors have received more attention due to their lower mode noise and easier preparation [
6,
7]. The multi-core fiber SPR sensors commonly adopt the absolute wavelength demodulation method, which is conducive to calibration. The resonant wavelength would shift as the sample refractive index (n
s) varies; thus, the measurement of the resonant wavelength associated with n
s is used for refractive index sensing. The sensitivity can be enhanced by tuning the resonant wavelength to a longer wavelength range by adjusting the incident angle. However, within the usual operating range (600–1000 nm), the amplitude of sensitivity enhancement is limited. Moreover, as the SPR spectral width increases with the redshift of the resonant wavelength, accompanied by the influence of the spectral amplitude noise, the query accuracy of the resonant wavelength would be reduced, thereby degrading the actual resolution [
8].
In addition to wavelength interrogation, intensity interrogation is another widely used demodulation method in SPR sensing [
9,
10]. The intensity of the reflected light would change along with the variations of n
s; thus, the sensing is realized by detecting the intensity of the reflected light. Generally, the steeper the angular resonant response, the higher the sensitivity. The reflectivity dips at longer wavelengths are narrower than the dips at shorter wavelengths, so the sensitivity can be enhanced at longer wavelengths. In terms of resolution, it is mainly affected by the power fluctuation of the incident light, the noise level of the photodetector, and the accuracy of the data acquisition module. In other words, the factors that affect sensitivity and resolution do not overlap. Therefore, applying the intensity interrogation to a multi-core fiber SPR sensor is expected to enhance sensitivity without degrading the resolution. However, once the working wavelength and sensing film are selected, it is difficult to further improve the sensitivity unless a new sensitivity enhancement mechanism is adopted.
Differential intensity (DI) interrogation is developed to process the SPR signal to mainly optimize the resolution [
11,
12,
13,
14]. It is worth noting that within the measurement range, the intensity of the reflected light signal in the two sensing channels varies oppositely; one can be increased, and the other one can be reduced. Thus, if the differences between the enhanced and reduced signals could be amplified, the sensitivity would possibly be improved. This has been adopted in a refractive index sensor based on the mode competition effect on the dual-wavelength fiber laser [
15] and confirmed the sensitivity enhancement to 273.7 dB/RIUs using the DI method. One of the modes in the cavity is modulated by the change in external refractive index, which changes the intra-cavity loss of the mode. The mode competition effect in the cavity is triggered, resulting in the output intensity of the two modes changing oppositely. The mode competition effect has enhanced the sensing sensitivity of the dual-wavelength fiber laser sensor and could be adopted for fiber SPR sensors.
As a mode of SPR, coupled plasmon waveguide resonance (CPWR) is supported by a waveguide, usually composed of a prism/noble metal film/dielectric/analyte [
16], which fulfills the mode equation. Since the guided modes are related to waveguide parameters, the resonant condition can be modulated by the analyte. Similar to conventional SPR, the resonant wavelength redshifts with the increase in n
s, which is the principle of the CPWR sensor with wavelength interrogation. Compared with other modes of SPR, CPWR provides a narrower resonant spectrum; thus, dual-wavelength DI interrogation in the C-band can be achieved by using a CPWR structure with a single incident point [
17]. The reflectivity of two wavelengths located on both sides of the resonant wavelength shows opposite changes when n
s varies within the measurement range. The CPWR sensor not only has considerable sensitivity, but its working band is also compatible with the gain spectral range of erbium-doped fibers ranging from 1530 nm to 1565 nm. Therefore, it is feasible to improve sensitivity by combining a CPWR structure with a dual-wavelength fiber laser and utilizing the mode competition effect. For multi-core fiber SPR sensors, it is more suitable and convenient to use CPWR to verify the sensitivity enhancement mechanism instead of conventional SPR, as only two opposite planes need to be prepared. If conventional SPR is used to achieve dual-wavelength DI interrogation [
10], two sensing channels are required to transmit two wavelengths of light separately. In this case, when using a four-core fiber to fabricate a DI SPR probe, four planes need to be prepared. Compared to grinding two planes, it is more time-consuming. Furthermore, the difference in the incident angle for the two sensing channels should be controlled precisely, which would increase the difficulty of preparing a fiber probe.
In this work, inspired by the mode competition effect in a dual-wavelength fiber laser, we propose a new method to enhance the sensitivity of a fiber SPR sensor. We use a four-core fiber as a coupling element, and a fiber probe is fabricated by using the fiber grinding and polishing method. Two polished planes corresponding to the two symmetrical cores serve as sensing surfaces. We prepared ITO/Au/ITO/TiO2 film on the sensing surfaces and end face of the probe using vacuum coating technology. CPWR in the C-band is excited on the ITO/Au/ITO/TiO2 film of the sensing surfaces. The fiber probe is inserted into a dual-wavelength ring cavity fiber laser to adjust the intra-cavity loss at the two wavelengths. By modulating the reflectivity from the change in ns, the reflectivity at one wavelength decreases whereas the reflectivity at the other wavelength increases; thus, the cavity loss is adjusted, and then the mode competition effect is induced. The larger the loss of the mode, the lower the power obtained, enlarging the power difference between the two wavelengths that originate only from the reflectivity change. Consequently, the sensitivity of DI interrogation is greatly enhanced. To the best of our knowledge, this is the first report of a differential fiber SPR sensor based on the mode competition effect.
2. Fabrication of the Fiber Probe and Sensing Property
To fabricate the fiber probe, we built a grinding and polishing setup where two microscopes were used to observe the end face and side face of the fiber, respectively. The fiber (SM-4C1500(8.0/125)/001) is sourced from Fibercore Limited, Southampton, UK. We took a 1 m long fiber, cut the fiber, and manually ground and polished the two end faces of the fiber to ensure that the end faces are flat and perpendicular to the axial direction of the fiber. One end of the fiber was installed on a fixture for subsequent grinding and polishing, and the other end was connected to the fan-out module (FAN-4C, Fibercore) using a ceramic sleeve and a bare fiber adapter with an FC/PC connector. Using a red light source and the microscope that observes the end face, we determined the corresponding relationship between the four single-mode input terminals of the fan-out module and the four cores in the fiber.
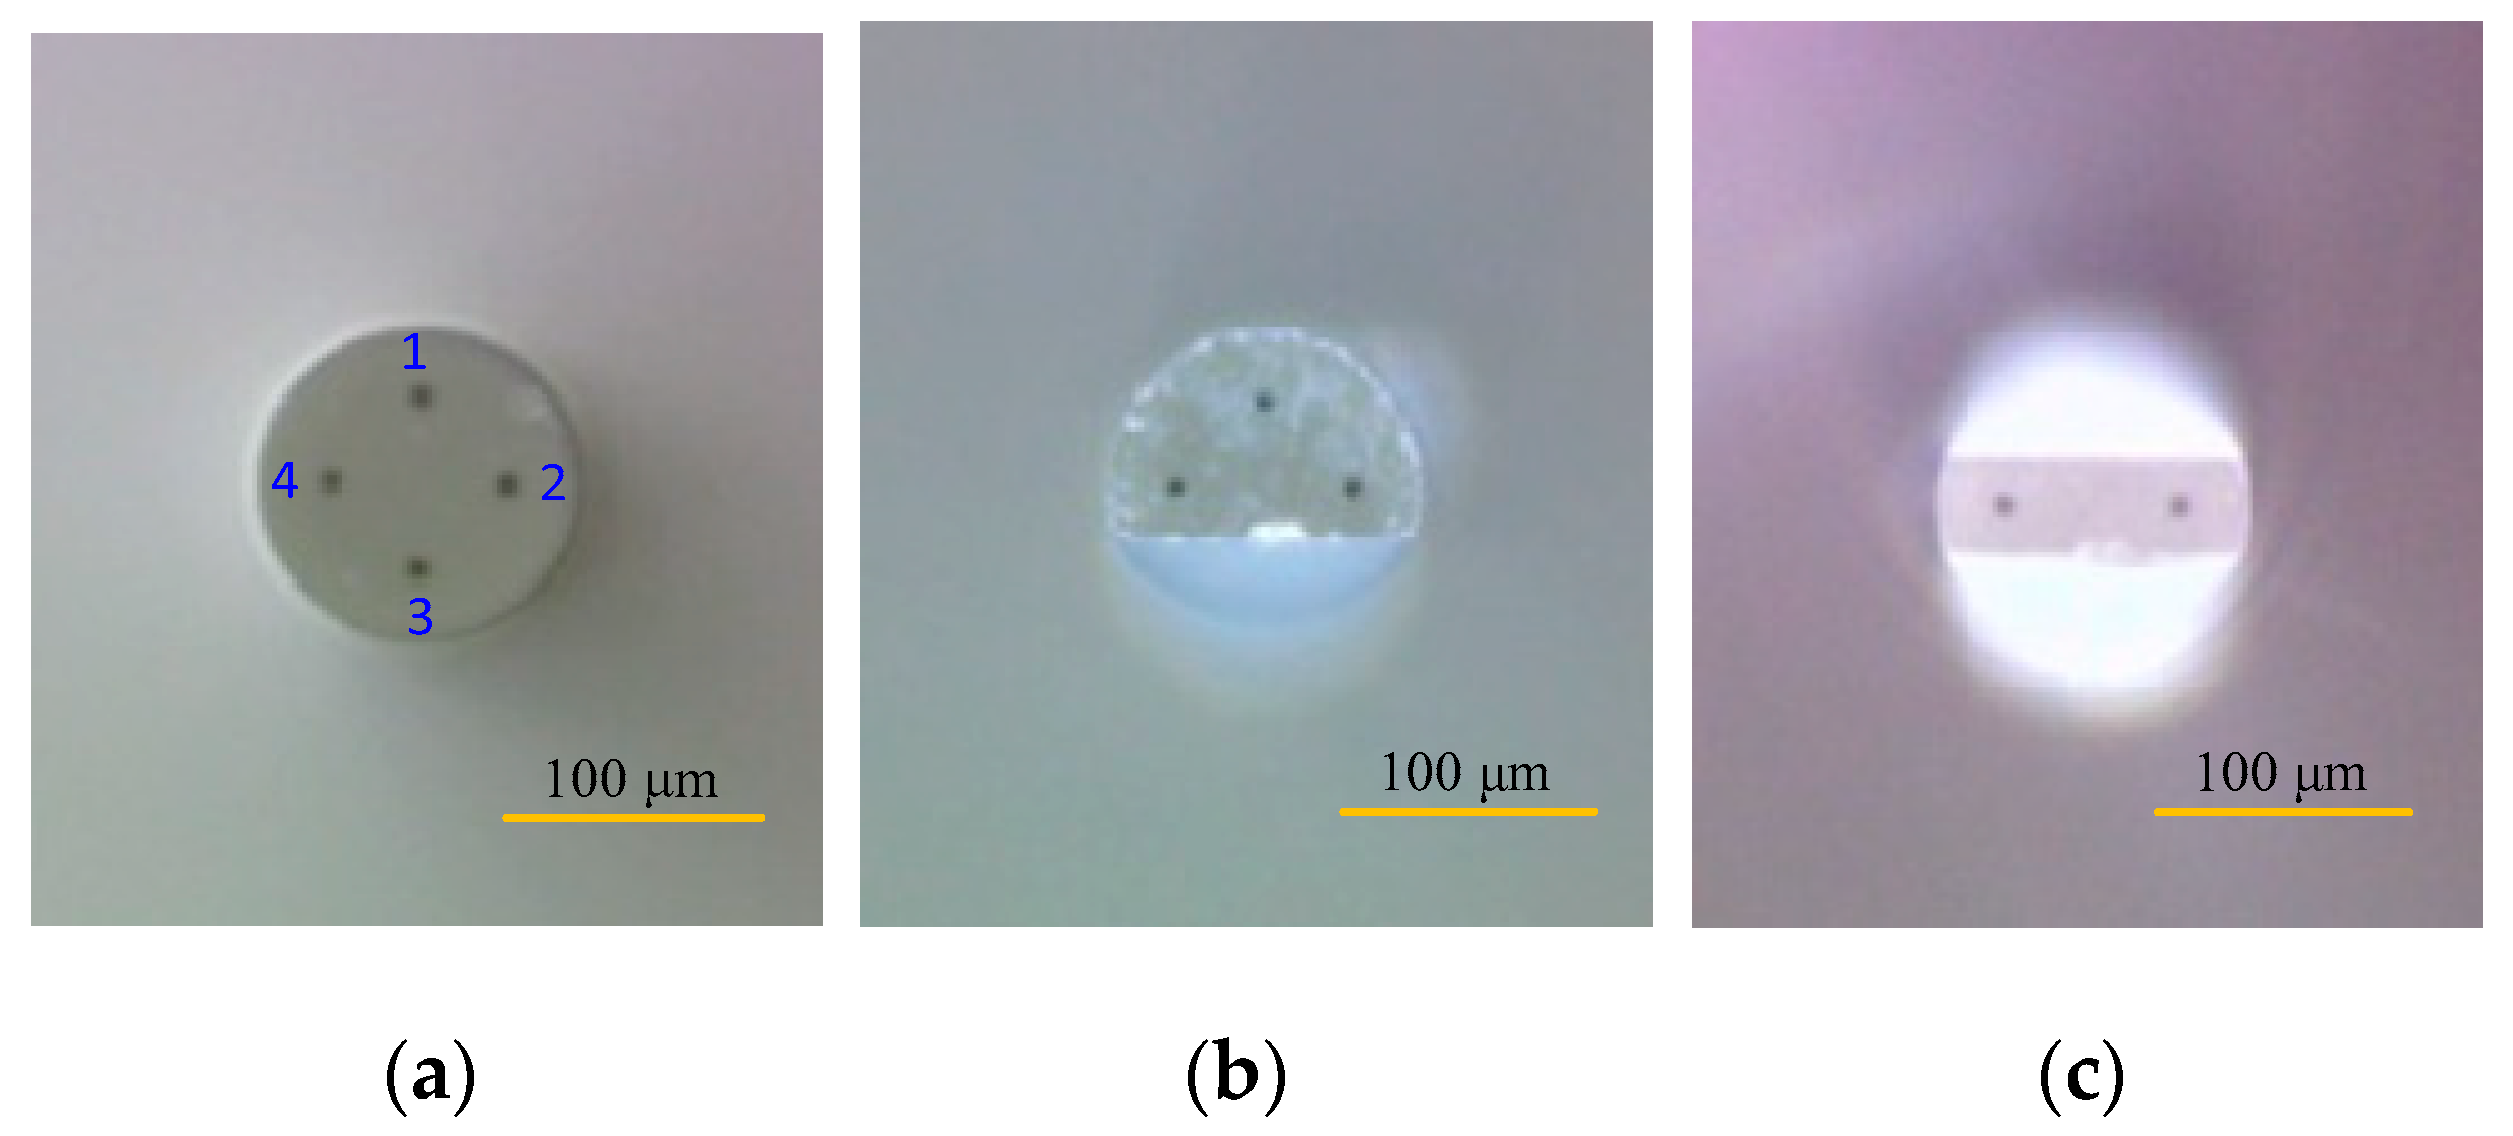
We named each core with a serial number, as shown in
Figure 1a. The four-core fiber is turned axially. When the straight line of cores #1 and #3 is perpendicular to the grinding disk, the fiber is pressed down to the point where the angle between the axial direction of the fiber and the horizontal direction is 16°. Then, the fiber is ground with 8000-grit grinding paper and then with 9000-grit grinding paper. When the grinding depth approaches 40 μm, the plane is polished with 12,000-grit polishing paper. Preparing a flat plane takes approximately 5–6 h. Then, the fiber is lifted up to the horizontal and rotated axially by 180°. The fiber is pressed down again. When the angle between the axial direction of the fiber and the horizontal direction is 16°, fiber grinding begins. The grinding depth for this second surface has a significant impact on the light reflection efficiency of the fiber probe. Therefore, to prevent insufficient or excessive grinding depth, it is necessary to monitor the light intensity reflected back by the fiber probe. We used the fan-out module to guide the light with a wavelength of 1550.12 nm emitted by a tunable laser (TFL-1550, Hefei Max-ray Photoelectric Technology Co., Ltd., Hefei, China) into core #3 and monitored the light intensity in core #1. When the light intensity reached its maximum, we stopped grinding and switched to polishing. After about 20 min of polishing, the fiber probe was prepared. Using the measurement function of the microscope, the angle between the axial direction of the fiber and the polished plane was measured to be approximately 15°.
To achieve dual-wavelength DI interrogation using CPWR in the C-band and considering the double excitation of CPWR on the fiber probe, we used an ITO/Au/ITO/TiO
2 film to excite P-CPWR due to its spectral width being narrower than that of S-CPWR [
17], which is more advantageous for achieving high DI sensitivity. An ITO/Au/ITO film was prepared by sputtering pure gold target and ITO target (In
2O
3:SnO
2 = 9:1) using two ion sputtering equipment (SBC-12, KYKY Technology Co., Ltd., Beijing, China). The coating process is similar to what we previously reported [
17]. For each layer, the background pressure is 4 Pa, the sputtering pressure is 5.5 Pa, and the target-substrate distance of each ion sputtering equipment is set to 30 mm. The Au film was sputtered for 100 s at a current of 4 mA. For both ITO layers, the sputtering lasted for 130 s at a current of 7 mA. TiO
2 film was capped on the ITO/Au/ITO film by using e-beam evaporation at a rate of 0.3 nm/s under a working pressure of 3.6 × 10
−2 Pa.
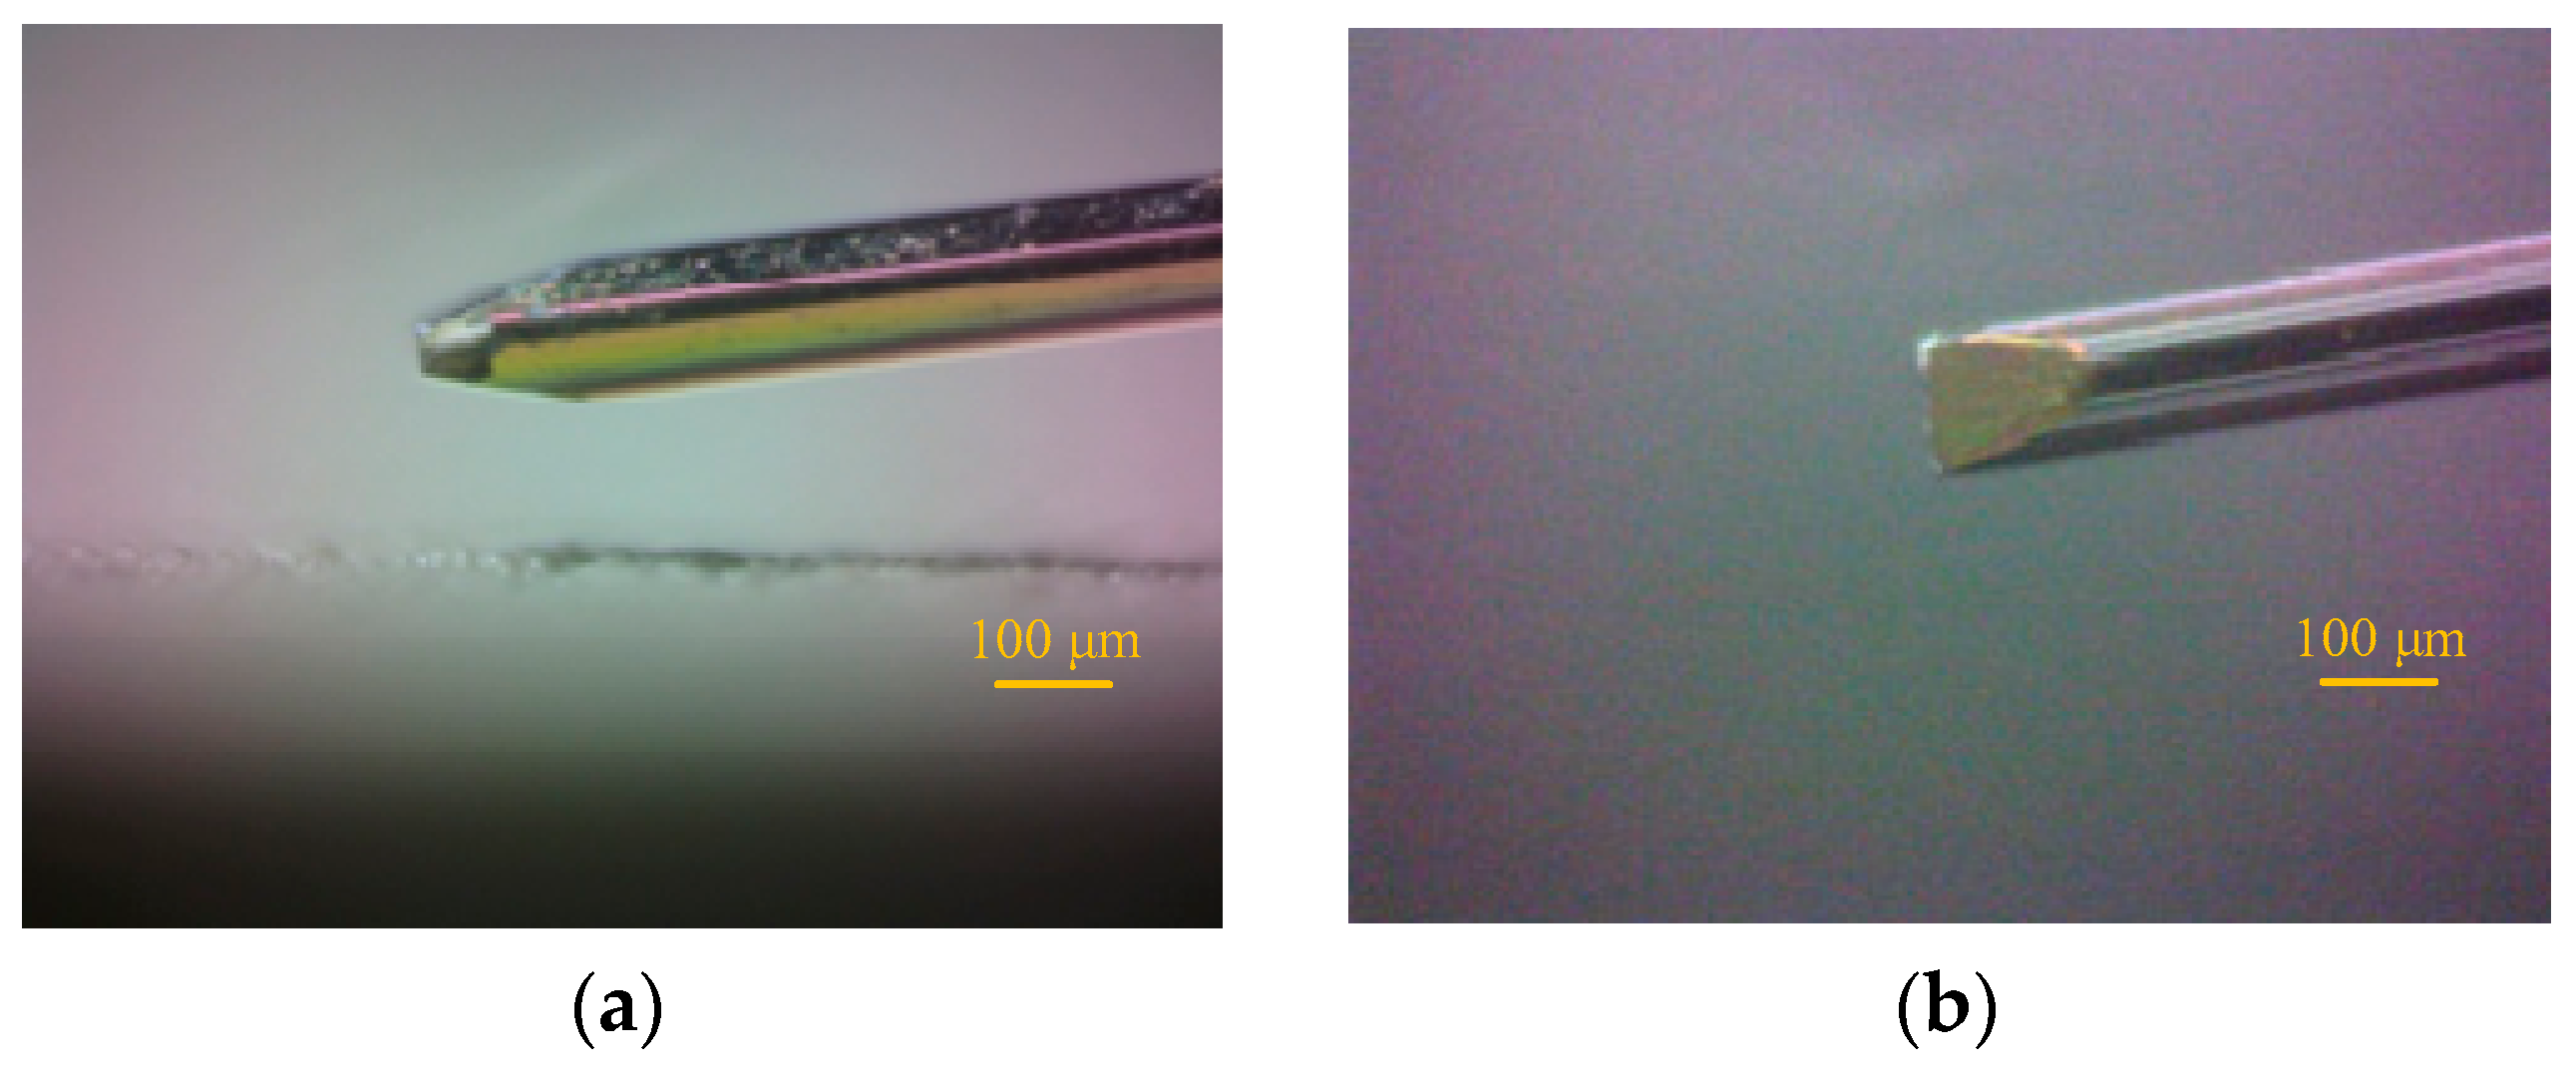
Figure 2 shows the fiber probe with ITO/Au/ITO/TiO
2 film. The ITO layers serve as adhesion layers to improve the stability of the sensing film on the fiber probe [
17].
To display the structure of the probe more clearly, we drew a sketch diagram of the probe. As shown in
Figure 3a, the C-band broadband light is incident from core #1 to the sensing layer at an angle of 75° and excites CPWR. The light reflected by the sensing layer reflects off the end face of the probe and excites CPWR one more time on the sensing layer coated on core #3. The remaining light is output from core #3. As can be seen in
Figure 3b, cores #2 and #4 were not ground in this work because the grinding process took too long and the probe broke many times during the grinding process. Therefore, even though by changing the grinding angle and adding two sensing surfaces, the measurement range can be expanded [
6], we only prepared a probe with a single sensing channel, which is sufficient to be used for the demonstration of our proposed sensitivity enhancement mechanism.
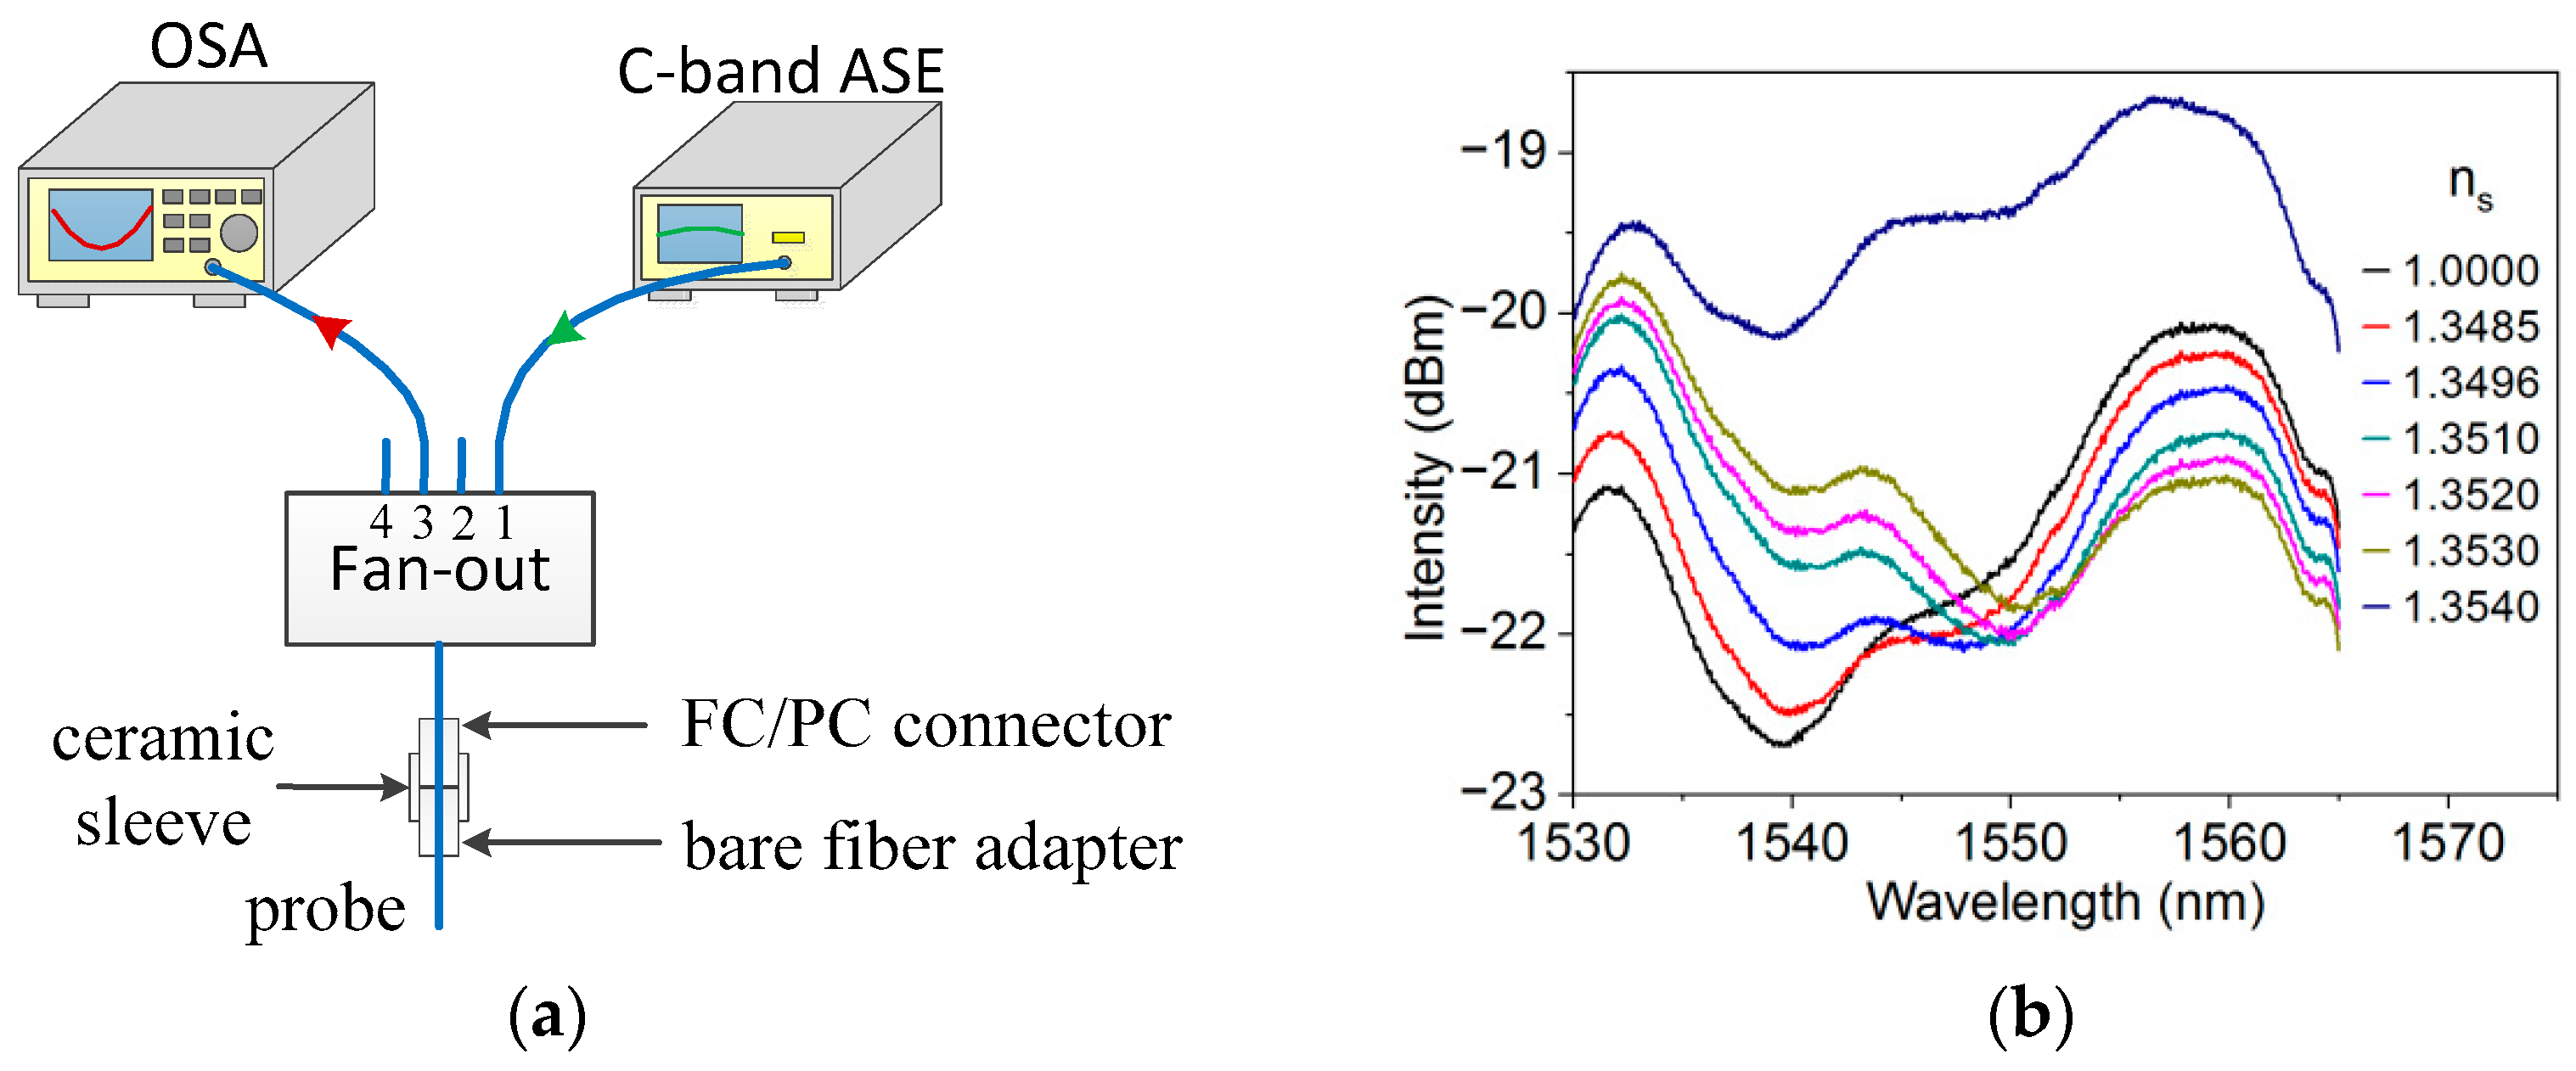
To evaluate the sensing property of the probe, we built a wavelength interrogation SPR sensing system, as shown in
Figure 4a. A light beam from a C-band amplified spontaneous emission (ASE) source (ASE-C-100-T-B, Hefei Max-ray Photoelectric Technology Co., Ltd., Hefei, China) enters the probe through the fan-out module. The four-core fiber port of the fan-out module comes with an FC/PC connector. The FC/PC connector was inserted into a ceramic sleeve to connect with the bare fiber adapter. We carefully rotated the bare fiber adapter axially to maximize the light intensity received by an optical spectrum analyzer (OSA, MS9710C, Anritsu Corp., Tokyo, Japan). A reference spectrum was recorded when the probe was in the air. The coupling losses in the C-band from the FC/PC connector to the bare fiber adapter were tested, and the results are as follows: 0.64 dB for core #1, 0.66 dB for core #2, 0.58 dB for core #3, and 0.57 dB for core #4. In the sensing test, glycerine aqueous solutions with an appropriate refractive index were sampled for detection to make sure CPWR could be excited. The temperature of the solutions was controlled at 27 ± 0.2 °C. Limited by our experimental conditions, 27 °C was the lowest temperature we could reach in the experiment. The refractive index was measured and calibrated by an Abbe refractometer with a resolution of 10
−4. Based on the refractive index of the water at a wavelength of 1550 nm, which is 1.3180 [
18], we recalibrated the Abbe refractometer to measure the refractive index of the solutions in the C-band. The optical spectrum analyzer recorded the CPWR spectra. The experimental CPWR spectra are shown in
Figure 4b. Obvious absorption occurred, but due to the flatness of the ASE spectrum, it is difficult to locate the position of the resonant wavelength.
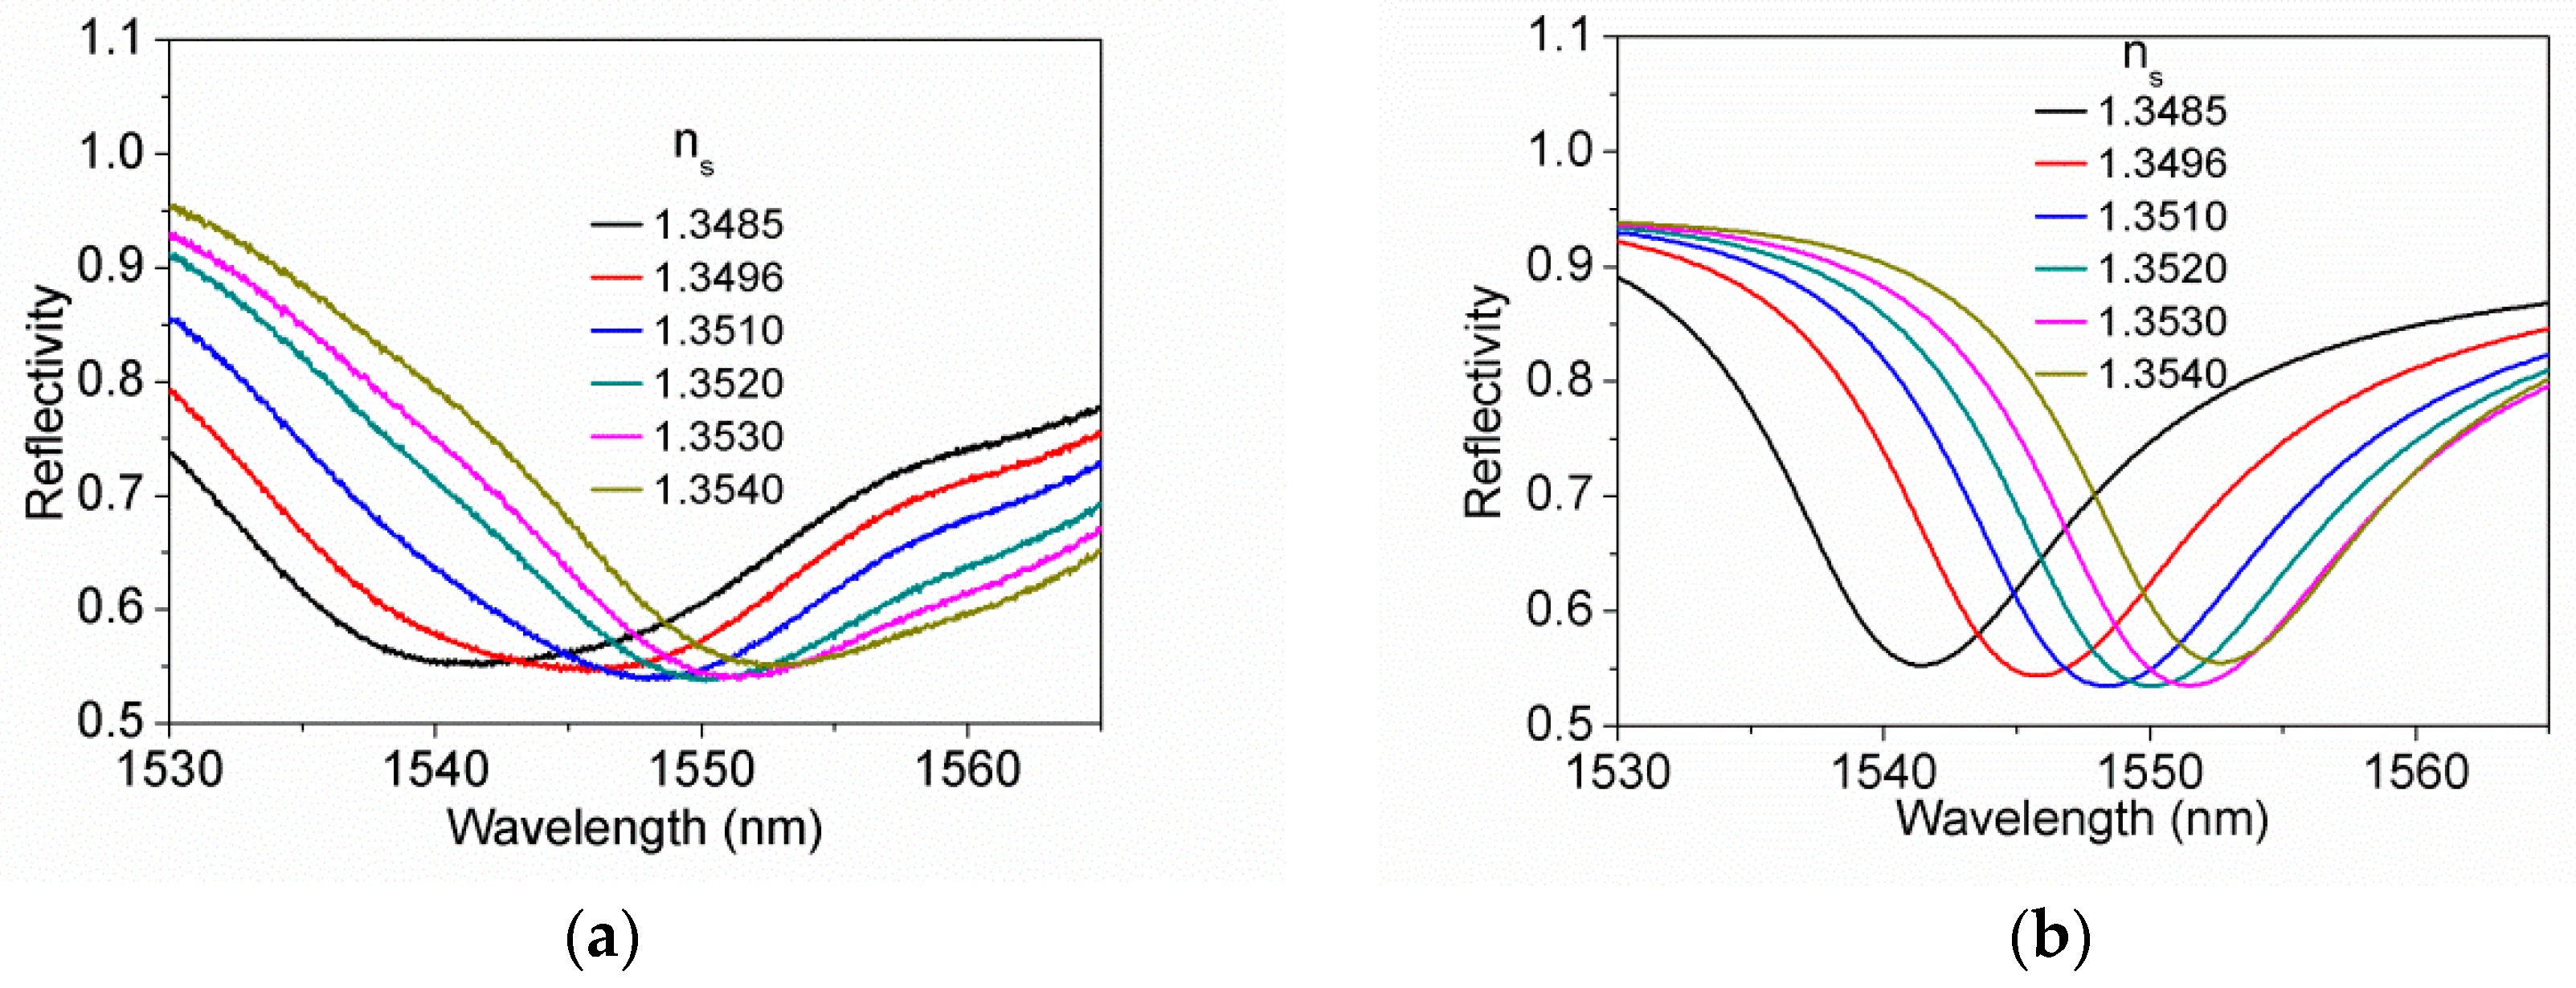
Figure 5a shows the normalized CPWR spectra at each n
s. The resonant wavelength increases from about 1541 nm to 1553 nm as n
s increases from 1.3485 to 1.3540. Compared with the reflectivity at other wavelengths, as n
s varies, the change in reflectivity is more significant near the wavelengths of 1540 nm and 1560 nm, which is beneficial for improving the sensitivity of DI interrogation. We used the Multilayer Transfer Matrix Method to fit the normalized CPWR spectra. During the fitting process, the dielectric constants of Au, TiO
2, and the fused silica in the literature were used [
19,
20,
21]. By adjusting the thickness of the Au film and TiO
2 film, the calculated spectra were compared with the experimental spectra. Since the normalized CPWR spectra shown in
Figure 5a were all involved in the fitting process, we obtained six sets of data on the thicknesses of the Au film and the TiO
2 film. The calculated thickness of the Au film is distributed between 56 nm and 58 nm, while the calculated thickness of the TiO
2 film is distributed between 548.7 nm and 549.8 nm. We simulated the CPWR spectra using the calculated thickness of the Au film and TiO
2 film.
Figure 5b shows the simulated CPWR spectra. It should be mentioned that the ITO layers may be discontinuous due to their low sputtering rate and short sputtering time; thus, there may be significant differences in the dielectric constants between the ITO layers and those reported in the literature [
22]. When estimating the thickness of the Au film and TiO
2 film, we ignored the influence of ITO layers and mainly referred to the value of the reflectivity at the resonant wavelength and the location of the resonant wavelength. The thickness we estimated should be the effective thickness, not the actual thickness. The reason is that the actual dielectric constants of Au film and TiO
2 film hardly match the values used in the fitting process, which are taken from the literature. Nevertheless, obvious CPWR occurred, and the experimental results are in good agreement with the simulations. The normalized CPWR spectra are broader and less regular than the simulated ones, which may be attributed to the following factors. First, due to the error in grinding angle, there may be a slight difference in the incident angle between the two excitations of CPWR. Second, the grinding surfaces are not completely flat, which not only leads to differences between the actual incident angles and the expected ones, but also affects the flatness of the sensing layer. Third, even if the four-core fiber meets the conditions for single-mode transmission, the incidence angle is still not single.
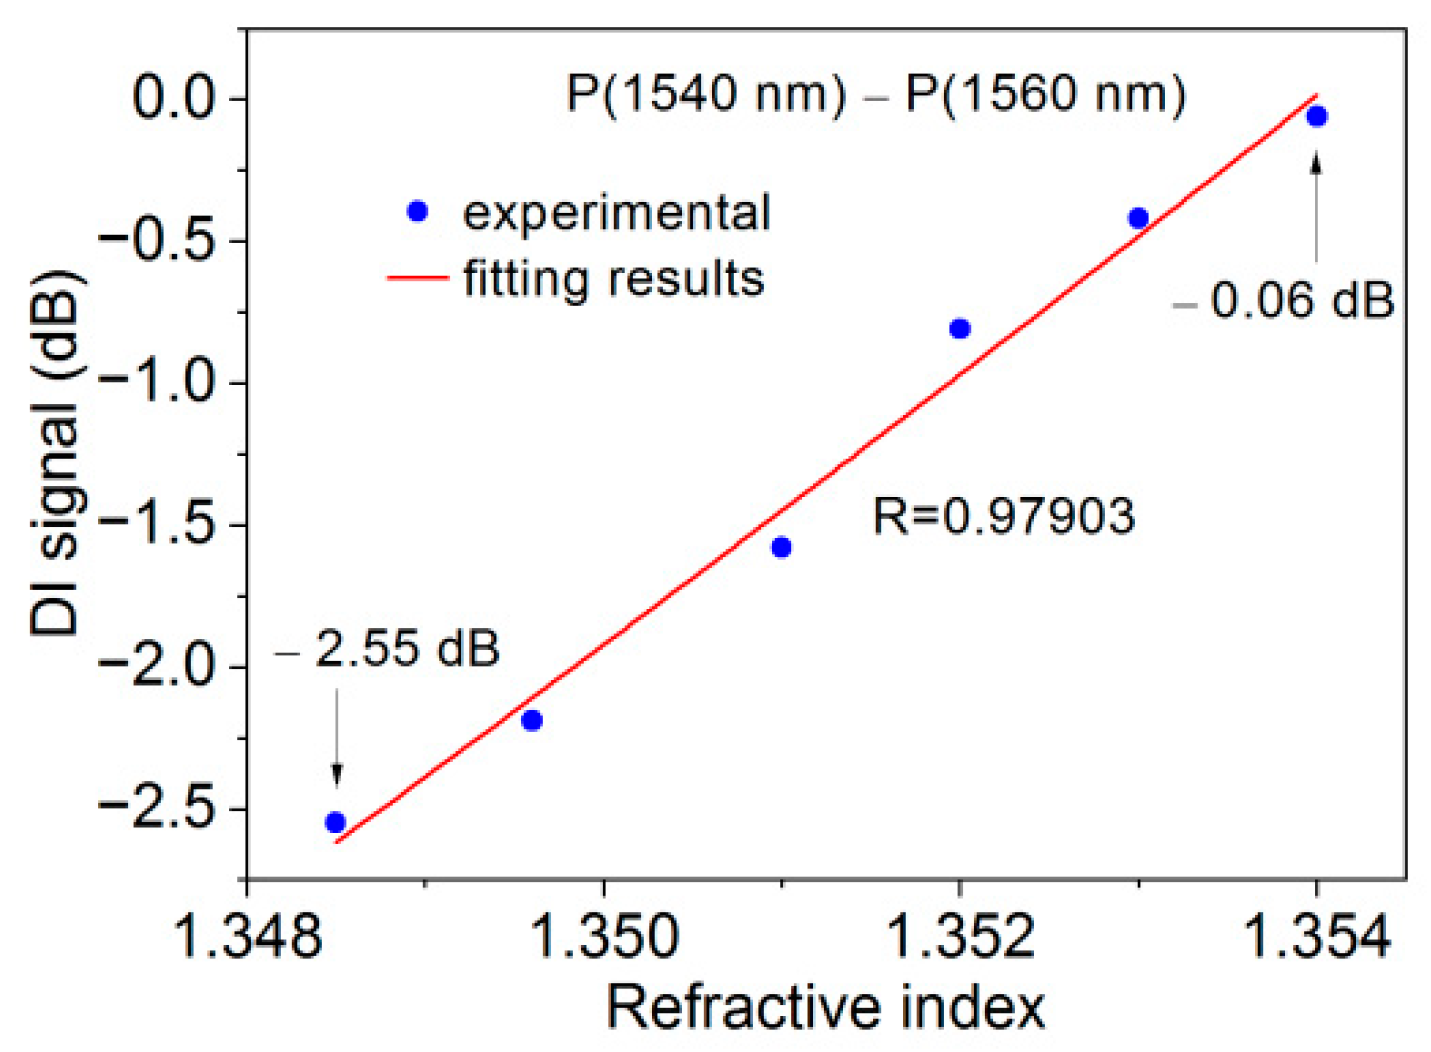
To reveal the behavior of DI interrogation, we extracted the power at a wavelength of 1540 nm and 1560 nm from the CPWR spectrum at each n
s and did the subtraction operation. As plotted in
Figure 6, the DI signal shows good linearity in the range of n
s from 1.3485 to 1.3540, which can be used to verify the sensitivity enhancement mechanism based on the mode competition effect. According to the results, the sensitivity can be derived as 452.7 dB/RIUs.
3. Dual-Wavelength Ring Cavity Fiber Laser with a Fiber Probe
To demonstrate that sensitivity can be enhanced by utilizing the mode competition effect, we inserted the probe into a dual-wavelength ring cavity fiber laser to form an active sensing scheme. As shown in
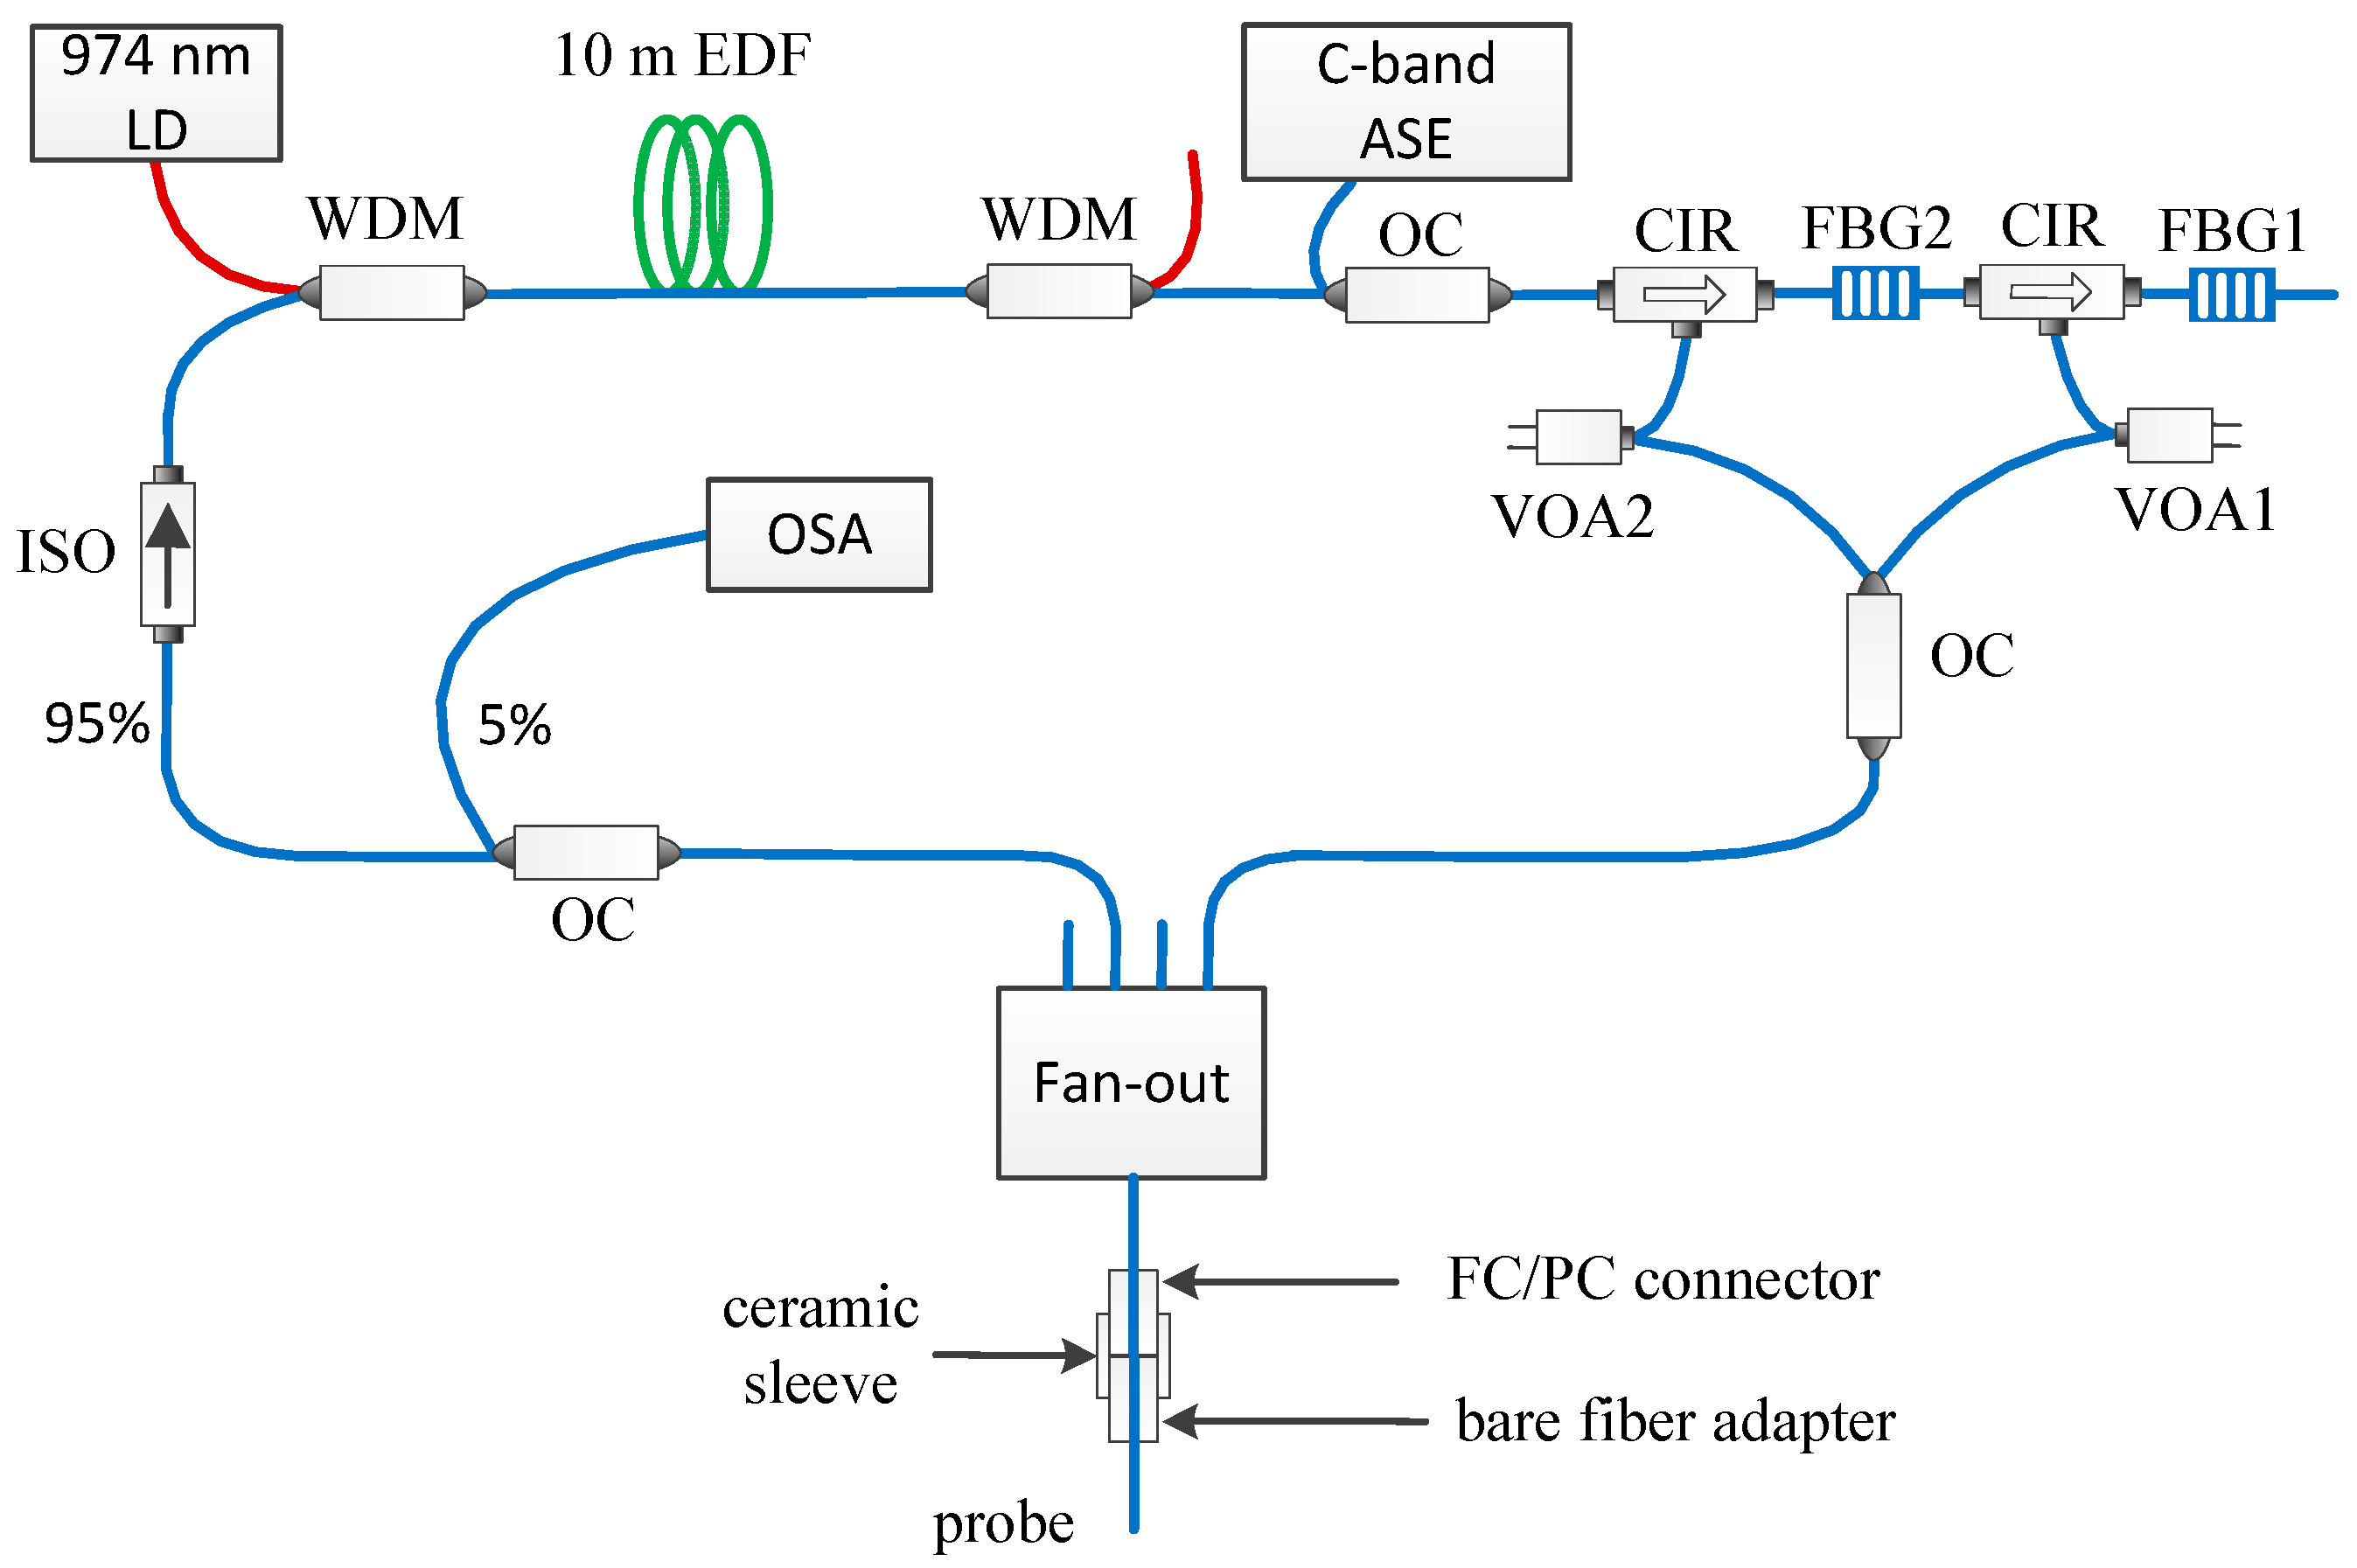
Figure 7, a ring cavity configuration for the dual-wavelength laser was adopted. Single-mode fiber devices were used in the laser. In fact, we initially chose to build a dual-wavelength linear cavity laser similar to that in the literature [
15]. However, we found that the laser power of the dual-wavelength linear cavity fiber laser was unstable, and the power fluctuation exceeded 5 dB, accompanied by a jump in the central wavelength of the laser. This may be attributed to the combined effect of spatial hole burning and the mode competition effect. A ring cavity laser can avoid the spatial hole burning effect and achieve more stable operation than a linear cavity laser [
23]. Therefore, we adopted a ring cavity structure to build a dual-wavelength fiber laser.
In the structure of the dual-wavelength ring cavity fiber laser, two fiber Bragg gratings (FBGs, denoted as FBG1 and FBG2, respectively) with a similar reflection of ~92% and a 3 dB bandwidth of ~0.27 nm are used to introduce dual-wavelength gain competition. The difference between the central wavelengths is 20 nm (λ1 = 1540.02 nm, λ2 = 1560.88 nm). We inject the light emitted by a C-band ASE source into the ring cavity through a 3 dB optical coupler (OC). The C-band ASE source is the one we used to test the CPWR responses before, and its maximum output power is 100 mW. The lights sampled by the FBGs pass through the circulators (CIR) and the tunable attenuators (VOAs, denoted as VOA1 and VOA2, respectively), which are combined by a 3 dB optical coupler and incident into the probe through the fan-out module. The light output from the probe is divided into two parts by an optical coupler (95:5), in which 5% of the power is received by the optical spectrum analyzer and the other 95% enters the ring cavity as a seed light to be amplified. We use an isolator (ISO) to ensure the unidirectional transmission of lasers in the ring cavity. A 974 nm laser with a maximum output power of 600 mW (FL-974-600-B, Hefei Max-ray Photonics Co., Ltd., Hefei, China) pumps the 10 m single mode erbium-doped fiber (EDF) (EDF3/6/125-23, YOFC Co., Ltd., Wuhan, China) through a WDM. The EDF has a typical peak absorption of 3.5 dB/m at a wavelength of 1529 nm. The seed light is amplified in the EDF and enters the next cycle. The remaining pump light is separated from a WDM. It should be mentioned that the gain of an EDF in the C-band is wavelength-dependent. Generally, the closer the wavelength is to the absorption peak wavelength, the greater the gain. For the lasing wavelengths we have chosen, the gain at λ1 would be larger than that of λ2, which would have a significant impact on the power characteristic of the dual-wavelength laser. However, we have to choose the two lasing wavelengths as we have done, as the width of the normalized CPWR spectra does not support DI interrogation using the narrowly spaced dual wavelengths.
To verify the effect of ASE injection, we investigated the relationship between the laser power and pump power without ASE injection when there is only one lasing wavelength. As shown in
Figure 8a, the laser power at λ
2 is about 50 times that at λ
1. This is mainly due to the insertion loss of the circulators as well as the imperfect reflection and transmission characteristics of the FBGs, which increased the mode loss of λ
1. When we switched the positions of two FBGs, the results were opposite, with the laser power at λ
1 much higher than at λ
2. In subsequent experiments, we have been using the layout shown in
Figure 7. The threshold feature is also obvious, with lasing thresholds of 38 mW for both wavelengths. In the case of dual-wavelength lasing, we adjusted the loss of VOAs to ensure that the output power at the two wavelengths is consistent at the threshold pump power, and then tested the relationship between the laser power and pump power. As shown in
Figure 8b, the laser mode of λ
1 was effectively amplified, while the other was suppressed to a level less than 8 nW.
We adjusted the loss of VOAs to observe the behavior of the mode competition.
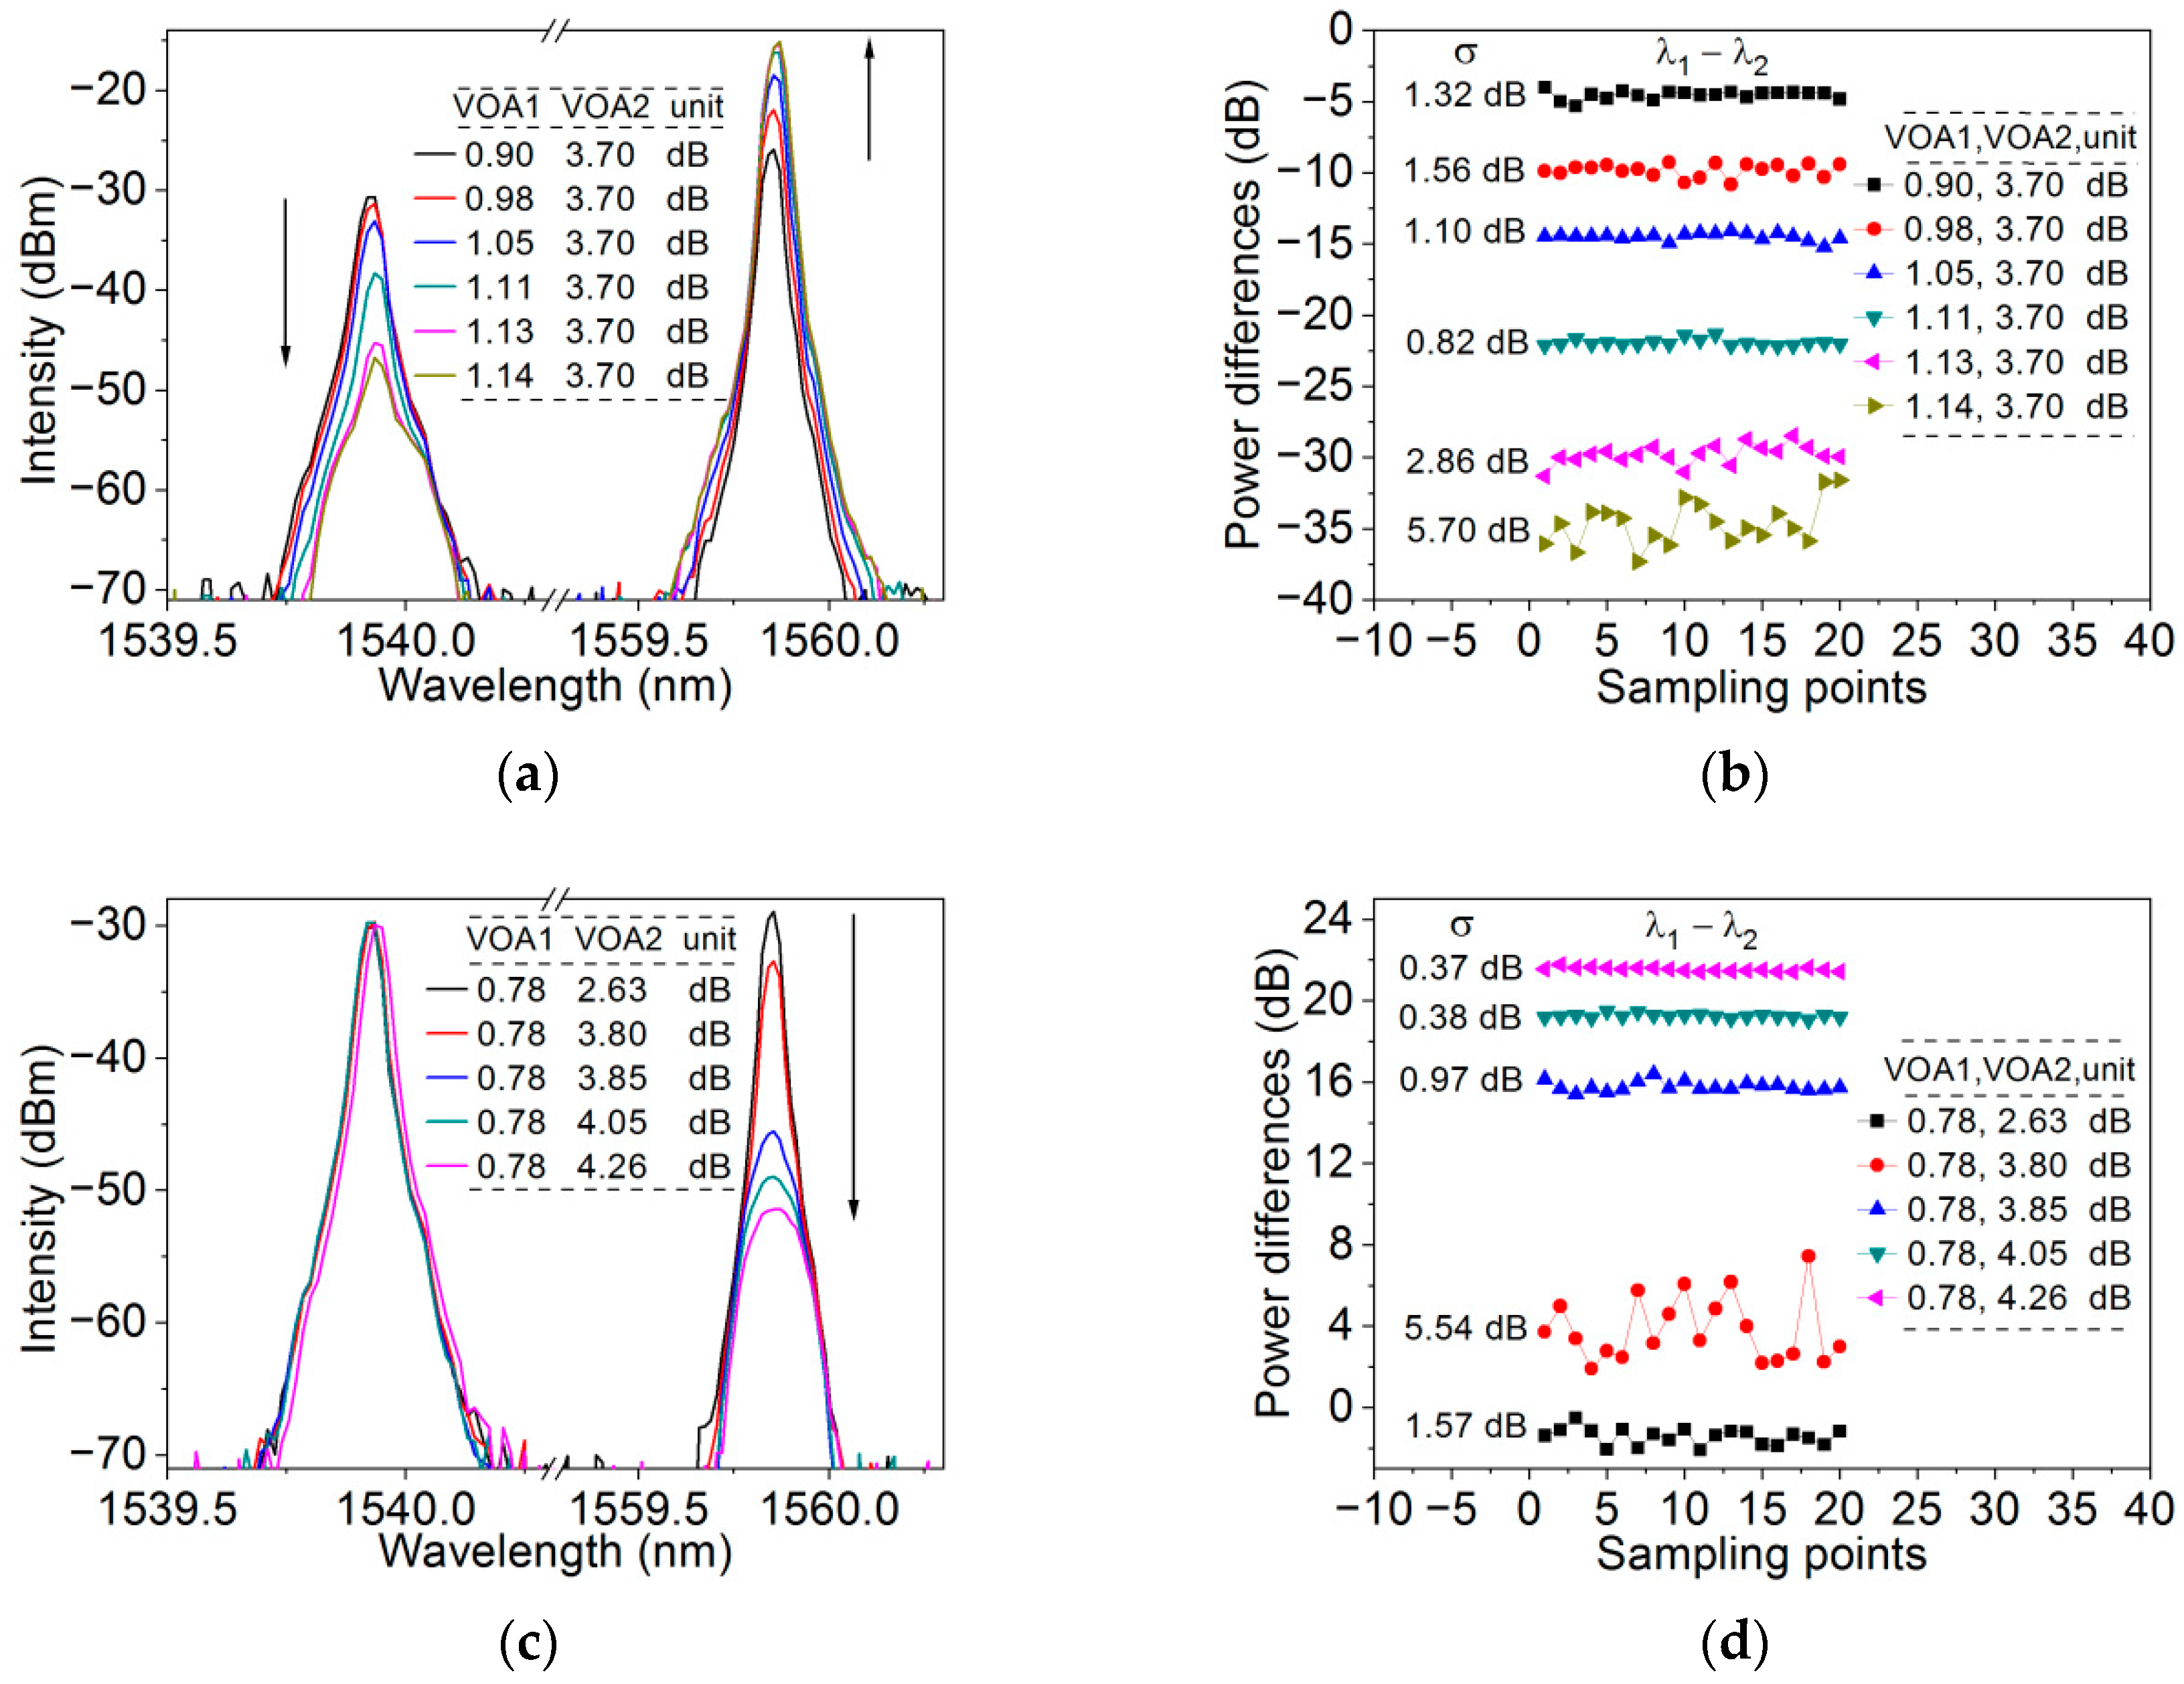
Figure 9a shows that when the loss of VOA2 is fixed at 3.70 dB, as the loss of VOA1 increases, the laser power of λ
1 drops and that of λ
2 rises. This is the result of the mode competition effect. The increasing loss at the laser mode of λ
1 reduces the number of erbium ions in the upper level consumed by the mode of λ
1, and the released erbium ions are consumed by the mode of λ
2. In the test, the probe was in the air, and the pump power was set to 201.6 mW. We also tested the stability of the laser power difference at each loss setting. The laser power of the dual wavelength was recorded every minute and lasted for 20 min; the results are shown in
Figure 9b. The maximum fluctuation of the power difference, expressed as σ, reaches 5.7 dB, indicating that the laser power is very unstable, which would be very detrimental to the resolution of the sensor.
Figure 9c shows that when the loss of VOA1 is fixed at 0.78 dB, as the loss of VOA2 increases, the laser power at λ
2 drops, but the change in laser power at λ
1 is minimal. This implies that, in contrast, the power change at λ
1 has a greater impact on the power at λ
2. The possible explanations for this phenomenon are as follows: as the loss of the mode of λ
2 increases, the number of erbium ions in the upper level consumed by the mode of λ
2 reduces. However, the amount of released erbium ions is not large enough to increase the power at λ
1, as the mode of λ
1 already occupies a considerable amount of erbium ions. We believe that the phenomenon is related to the gain characteristics of the EDF that we use. As for the stability of the power difference, it is also poor; σ reaches 5.54 dB, as shown in
Figure 9d.
The mode competition effect is the main reason for the power instability of the dual-wavelength laser. In the experiment, by adjusting the losses of the two modes separately, both modes can oscillate simultaneously. However, because of the gain competition caused by the homogeneous gain broadening of the EDF, the two modes competed with each other by seizing erbium ions at similar energy levels in the EDF [
24,
25]. In this case, the power instability of the dual-wavelength lasers may be caused by the power fluctuations of the spontaneous emission of the EDF. We disconnected the isolator and the adjacent optical coupler and then tested the stability of the power difference of the seed light. During a monitoring period of 20 min, the maximum fluctuation in the power difference between two wavelengths was 0.13 dB. This also means that a dual-wavelength light with such instability was amplified by the EDF in the laser. As a result, a light with a higher power occupied an advantage in the mode competition while the other was suppressed. Ultimately, the power of the dual-wavelength lasers became unstable. In the laser, if the dual-wavelength light being amplified by the EDF is stable, the ability of both modes to consume erbium ions at the upper level would be stable, and then the power of the dual-wavelength lasers would be stabilized.
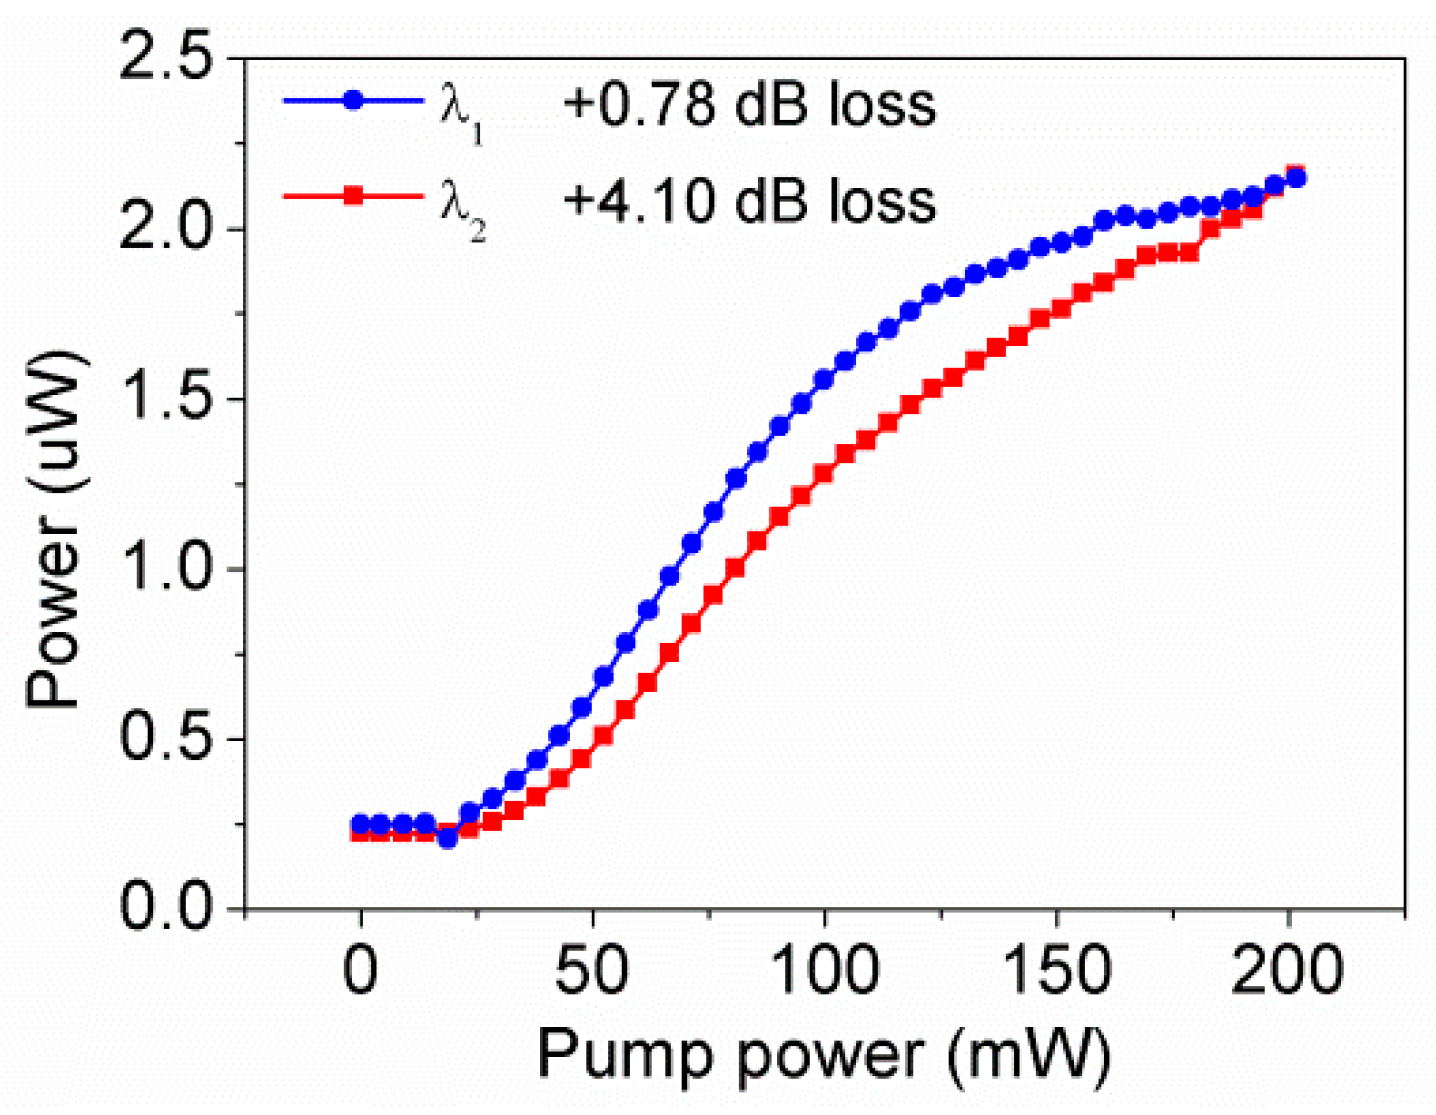
We injected the light emitted by the C-band ASE source into the ring cavity, and the power was set to 100 mW. The injected broadband light passed through the two FBGs and became narrowband light with dual wavelength; 95% of the narrowband light enters EDF as a seed light after being reflected by the probe. Without the pump, we tested the stability of the seed light and found that the maximum fluctuation in the power difference between the two wavelengths was 0.03 dB. Moreover, the power of the seed light was more than 10 dB higher than that of the seed light without ASE injection. The relationship between the laser power and pump power shown in
Figure 10 is quite different from that without ASE injection. Owing to the ASE injection, even if the pump power is absent, there is still about 0.25 μW of power at both wavelengths. Besides, the variation trend of the laser power with pump power for two wavelengths is similar, and the power of the two wavelengths at the same pump power is close. Therefore, it is concluded that with the ASE injection, the dual-wavelength lasers mainly came from the amplification of the seed light rather than the fluorescence generated from the EDF. We also tested the stability of laser power when the ASE injection power was less than 100 mW and found that it was still more stable when the injection power was 100 mW. Due to the maximum output power of the ASE source being 100 mW, we did not attempt to increase the injection power. Additionally, higher injection power may excessively weaken the mode competition effect, which is not conducive to enhancing sensitivity. We also tested the power of the dual-wavelength lasers when the pump power increased from 201.6 mW to 300 mW. We found that the power of the dual-wavelength lasers increased very slowly. Due to the maximum power that the fused biconical taper WDM we use can withstand being 300 mW, we did not attempt to increase the pump power.
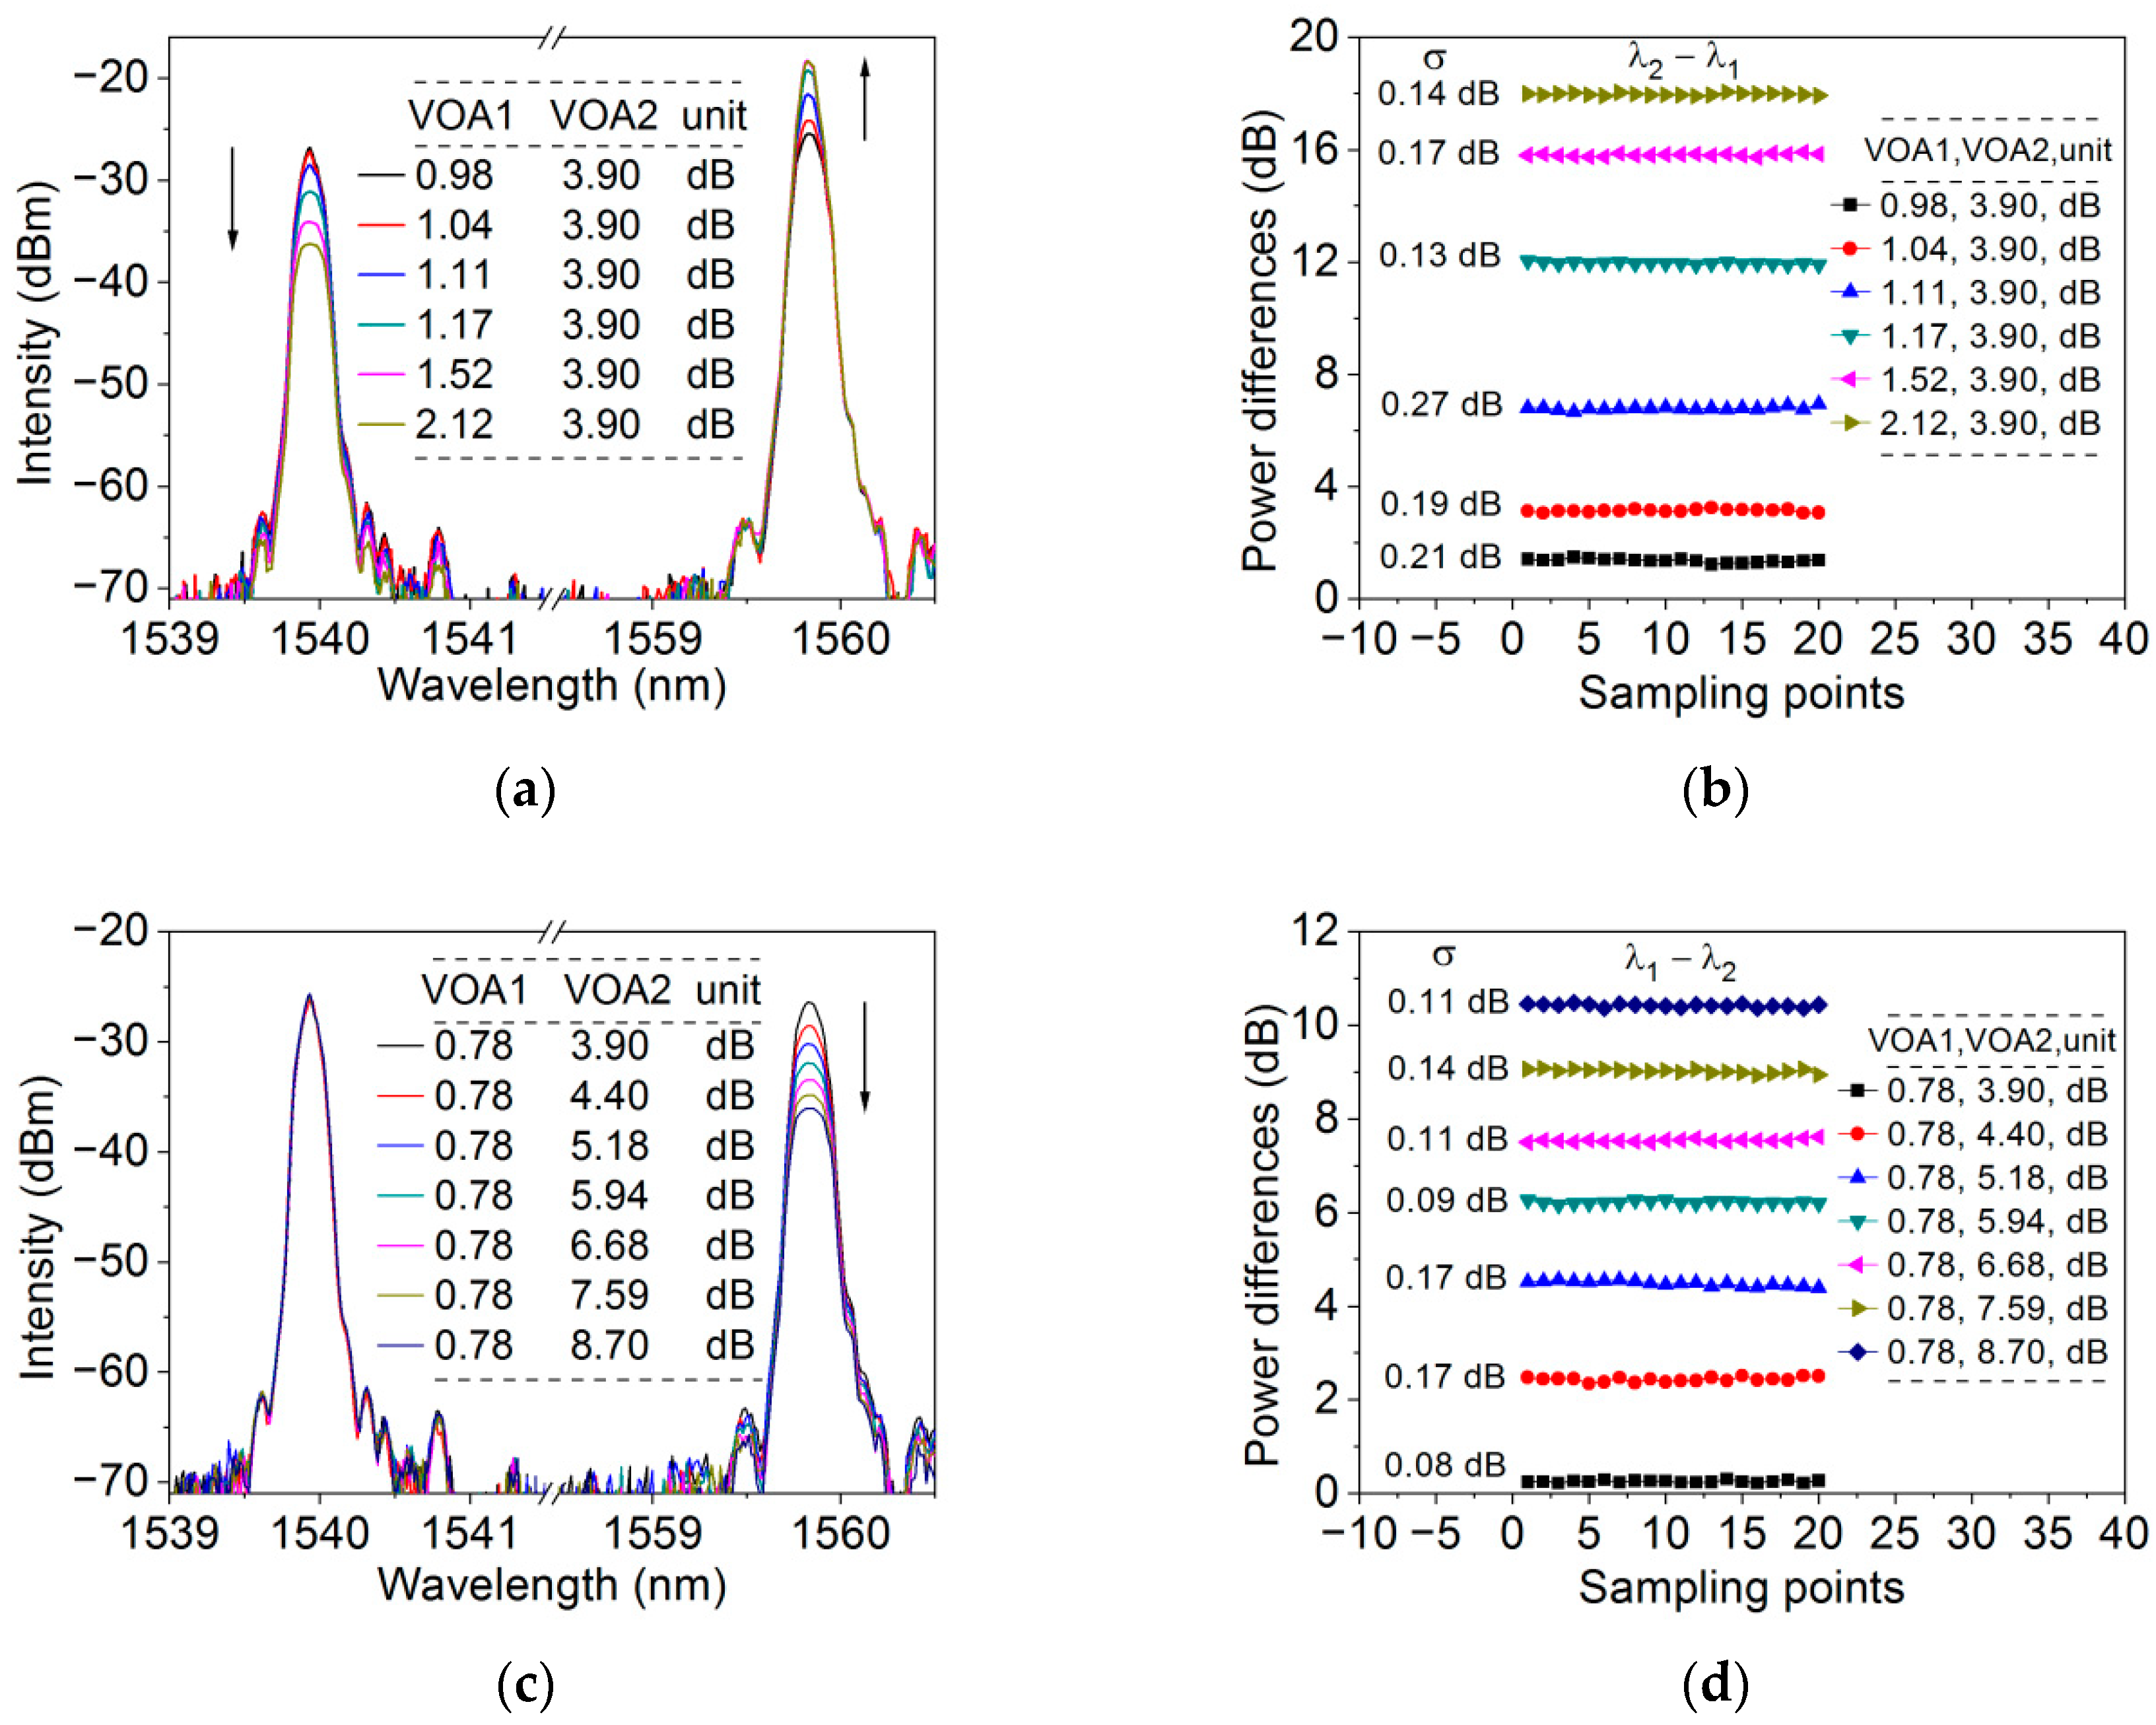
Figure 11a shows the spectra of the dual-wavelength laser with ASE injection when the loss of VOA1 increases and the loss of VOA2 is fixed at 3.90 dB. As the loss of VOA1 increases, the laser power at λ
1 drops and that at λ
2 rises. The side lobes appearing in the spectra originate from the reflective spectrum of the FBGs. The corresponding testing results for stability are shown in
Figure 11b. The maximum fluctuation of the power difference is 0.27 dB, which is more than 20 times smaller than the fluctuation without ASE injection.
Figure 11c shows the spectra of the dual-wavelength laser when the loss of VOA2 increases and the loss of VOA1 is fixed at 0.78 dB. Similar to the results without ASE injection, the laser power at λ
1 remains basically unchanged. The corresponding testing results for stability show that the maximum fluctuation of the power difference can be as small as 0.08 dB, as shown in
Figure 11d. This is beneficial for the resolution of the sensor.
4. Active Differential Intensity (DI) Sensing Test and Discussion
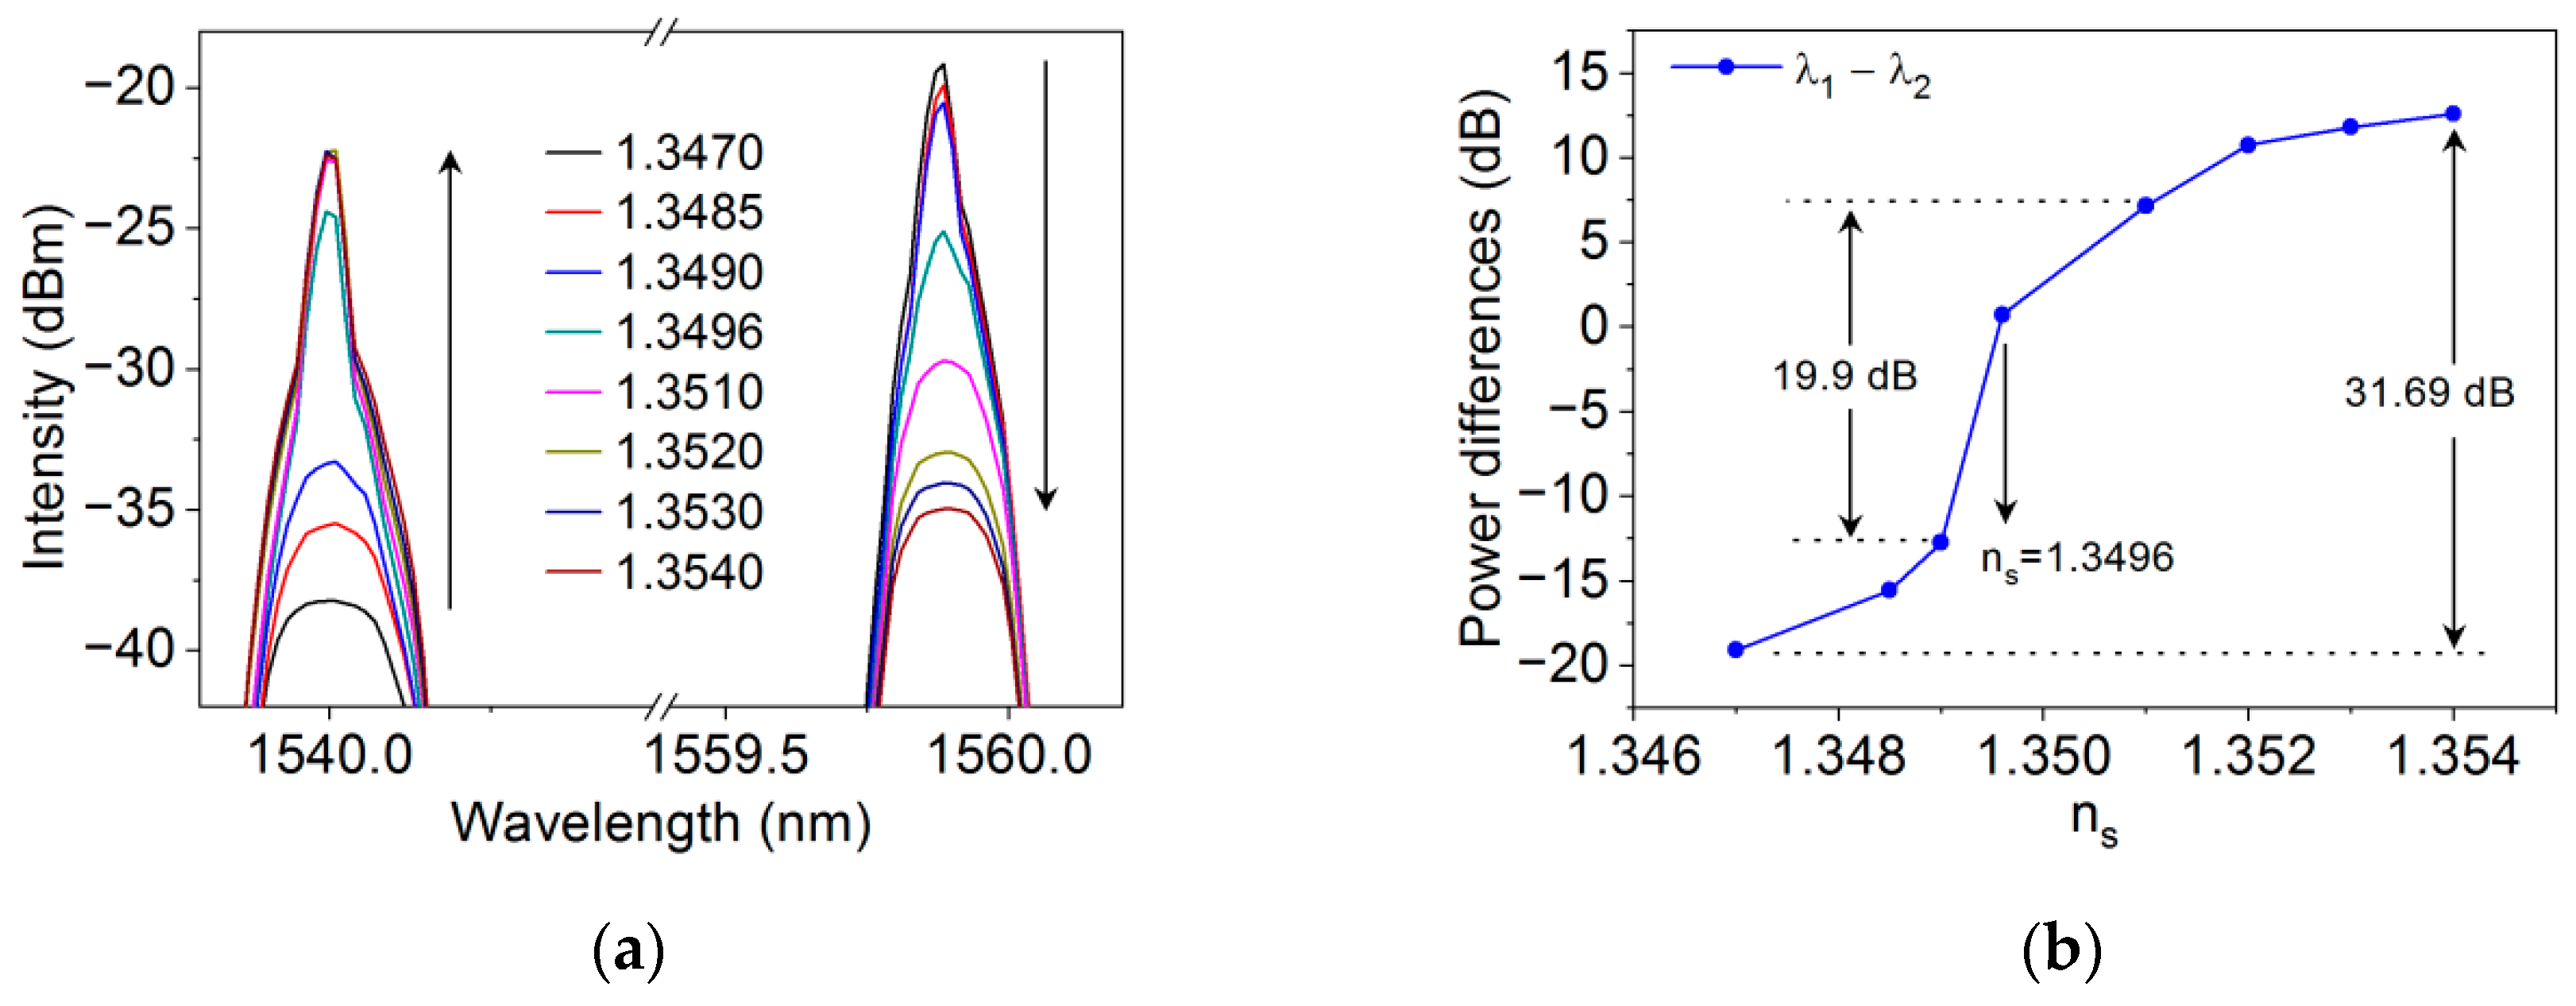
In the refractive index sensing process, we selected the glycerine solution with n
s = 1.3490 and immersed the probe into the solution. By adjusting the loss of VOAs, we obtained dual-wavelength lasers with approximately equal intensity output. Then, we measured the response of the constructed active sensing system shown in
Figure 7 against glycerine solutions with different n
s from 1.3455 to 1.3540. It can be seen from
Figure 12a,b, that the intensity of the light at λ
2 dropped significantly as n
s increased, while the intensity of the light at λ
1 rose. The power difference reaches up to 32.09 dB.
The phenomenon implied that the mode competition effect played a major role. Because of the gain competition caused by the homogeneous gain broadening of EDF, the intensity of the two laser lights with different wavelengths would compete with each other by seizing erbium ions at similar energy levels in EDF. In our case, the power at the two lights was balanced at n
s = 1.3490. Once n
s changed, the reflectivity of the two lights provided by CPWR changed oppositely, i.e., the loss of the two modes corresponding to the two wavelengths varied oppositely, breaking the former balance, resulting in the power of one mode with a lower loss increasing more while the power of the other mode decreased more, thus enhancing the sensitivity of DI interrogation. As can be seen in
Figure 12b, the power difference, i.e., the DI signal, increases with the increase in n
s; although it did not change linearly, it was monotonic. The average sensitivity of 3775 dB/RIUs was estimated, and considering that the maximum fluctuation in the power difference previously tested was 0.27 dB, a resolution of 7.2 × 10
−5 RIUs can be expected.
The advantage of the proposed active sensing scheme is that when the probe is in a solution with a refractive index within the measurement range, we can easily balance the power of the dual-wavelength lasers by setting the loss of VOAs. This may be beneficial for improving sensitivity, as near the balanced position, the DI signal undergoes more drastic changes with the variation of n
s, resulting in higher sensitivity. We set the loss of VOAs to balance the power of the dual-wavelength lasers when the probe is in a solution with the refractive indices of 1.3496, 1.3510, and 1.3520, respectively, and conducted corresponding sensing tests. The results are shown in
Figure 13a–f. After analysis, the average sensitivities we obtained were 4527 dB/RIUs, 5702 dB/RIUs, and 5158 dB/RIUs, respectively.
It is worth noting that after the power of the dual-wavelength lasers was balanced at n
s = 1.3510, the sensing test results showed that the DI signal exhibits good linearity and drastic changes in the n
s range of 1.3496–1.3520. This can be explained by the response of CPWR, as shown in
Figure 5a. For both wavelengths of 1540 nm and 1560 nm, when the n
s decreases from 1.3510 to 1.3496, or increases from 1.3510 to 1.3520, the change in reflectivity is relatively greater, which means that the variation in intra-cavity loss is larger, ultimately leading to a larger change in the DI signal. In fact, we hope that the DI signal has good linearity throughout the entire measurement range. However, it is possible that, owing to the low doping concentration of the EDF we use, the EDF cannot provide sufficiently high gain, which leads to low efficiency and low power of the dual-wavelength laser. Adopting EDF with a higher doping concentration may improve the output characteristics of the dual-wavelength laser, thereby obtaining a more linear DI response and higher sensitivity, from which the resolution of the sensor can also benefit. Nevertheless, our experimental results can validate the feasibility of the proposed approach to enhance the sensitivity of DI interrogation by utilizing the mode competition effect.
