Communication

Photonic Crystal-Based Water Concentration Estimation in Blood Using Machine Learning for Identification of the Haematological Disorder

1
Malaviya National Institute of Technology, Jaipur 302017, India
2
Swami Keshvanand Institute of Technology, Management & Gramothan, Jaipur 302017, India
3
Poornima College of Engineering, Jaipur 302022, India
*
Author to whom correspondence should be addressed.
Photonics 2023, 10(1), 71; https://doi.org/10.3390/photonics10010071
Submission received: 26 November 2022 / Revised: 30 December 2022 / Accepted: 2 January 2023 / Published: 9 January 2023
(This article belongs to the Special Issue Optical Machine Learning for Communication and Networking)

Abstract

:
Human blood is made up primarily of water. Water is significantly involved in balancing the human body. It affects the component of blood like mean corpuscular hemoglobin (MCH), mean corpuscular hemoglobin concentration (MCHC), and mean platelets volume (MPV). The water concentration varies from 80 to 90% in blood. The change in water concentration changes the refractive index of plasma, and the change in the refractive index of plasma also changes the refractive index of blood. The proposed structure is designed to analyze the water concentration in human blood by analyzing the shifting in resonant peak and this shifting is processed by machine learning algorithm to estimate the concentration of water in human blood. Nanocavity ring structures in the waveguide region are designed as sensing nodes in this proposed structure. The air hole radius of these Nanocavity ring structures is 80 and 50 nm, whereas the proposed structure’s dimension is 12.15 by 8.45 μm2. The sensitivity of the design structure is 570 nm/RIU, and the quality factor is 650. The structure is simulated through the Finite Difference Time Domain (FDTD) method.

1. Introduction

Blood is a crucial part of the human body. It is a reasonably quickly circulating fluid that provides nutrition, oxygen, and waste removal from the body. Even though blood is mostly liquid with many cells and proteins suspended in it and a thicker liquid than pure water. Blood is composed of several components, but the plasma and blood cells are important among them. These blood cells comprise several components, such as red blood cells (RBCs), white blood cells (WBCs), and platelets [1], whereas plasma contains water and Albumin. The refractive index of plasma is dependent on water and albumin concentration [2] whereas the refractive index of blood cells is dependent on RBC and platelets concentration. The concentration of water plays a vital role in the refractive index of plasma and blood components MCH, MPV, and MCHC [3,4]. Slight changes may directly influence the blood parameter. The amount of ingested water retained in the circulation can’t be accurately estimated by looking at the blood’s water content as a percentage of body weight since corpuscles take up a more significant proportion of a blood sample’s volume [5,6]. As the concentration of corpuscles increases, the percentage of water in the sample decreases. The relation between blood refractive index is dependent on the concentration of RBCs and plasma, with the concentration ratio of 45% and 55%, respectively in a normal person [7,8]. For a person identified with blood diseases, the concentration of RBC or plasma changes, and according to those changes, the refractive index of blood changes [9,10]. The blood plasma is extracted from Centrifuging anticoagulation whole blood at 2500 rpm for 10 min yielding plasma and erythrocytes. After centrifuging the blood, saline water solution cleaned the erythrocytes and spun them down at a low speed until the supernatant was clear [11]. Homolysis was released when erythrocyte samples were thawed and frozen four times (20 °C). Once cell membranes were removed from the dialysis saline solution (pH 7.4), the concentration was deposited in the dialysis to eliminate small molecular weight impurities. All samples are always kept at pH 7.4 [12]. Diseases such as kidney and liver disorders affect the concentration of water in the blood. Therefore, the concentration of water in the blood may be used to detect the presence of these decreases. The challenge is in getting high sensitivity and reliability apart from other things. The materials, structures and characteristics of sensors play a crucial role in determining their sensitivity and reliability. Photonic crystal structures are very well suited for estimating the concentration of water in the blood because the refractive index of blood (and of blood plasma) is a function of the concentration of water in the blood. This paper reports the development of a photonic crystal device that can estimate change (or shift) in refractive index when the material filling the cavity of the device is changed. It is therefore possible to find the refractive index in two states, the sensor cavity filled with air and the cavity filled with a blood sample. This will lead to the estimation of water concentration in the blood hemoglobin by the Equation (1) [13,14]
η b l o o d = η r b c f r b c + η p l f p l
where η represent the refractive index, η b l o o d is the refractive index of blood, η r b c is the refractive index of RBC, η p l is the refractive index of plasma, f r b c is the concentration of RBC in blood and f p l is the concentration of plasma in blood. For normal conditions the concentration of RBC, concentration of plasma and refractive index of RBC is constant. As the concentration of water changes, the refractive index of plasma also changes and due to this change in the refractive index of plasma, the refractive index of blood also changes.
η b l o o d = 0.45 η r b c + 0.55 η p l
The refractive index of plasma is calculated by Equation (3)
η p l = η w a t e r f w a t e r + η A l f A l
where η p l is the refractive index of plasma, η w a t e r is the refractive index of water, η A l is the refractive index of Albumin, f w a t e r is the concentration of water in plasma and f A l is the concentration of Albumin in plasma. The water and albumin concentrations in plasma are 90% and 10%, respectively. For a normal person the water and albumin
η p l = 0.9 η w a t e r + 0.1 η A l
Equation (4) is used to calculate the refractive index by the concentration of water and Albumin. If the water concentration or albumin concentration changes, the refractive index of plasma also changes. The Cauchy equation calculates the refractive index of plasma is given in Equation (5) [9]
η p l ( λ ) = A + B λ 2 + C λ 4
where η p l ( λ ) is the refractive index of plasma dependent on the wavelength ( λ ) of the input signal. A, B, and C are the Cauchy equation’s constant parameters. The values of the A, B, and C parameters are dependent on the material. For plasma cells, the value of A, B, and C for the plasma concentration of 5.5 g/dL in the blood are as follows:
A = 1.3353
B = 4404.8 nm2
C = −91,925,000 nm4
The refractive index of plasma at a particular wavelength is calculated by the equation [15,16].
Figure 1 shows the refractive index variation with the wavelength of plasma given by the Cauchy relation. As the wavelength increases, the refractive index of plasma decreases. The refractive index of plasma is 1.3387 at 1550 nm wavelength. Table 1 shows the effect of water concentration on different parameters.
This water-related parameter is also dependent on other parameters like the shape of the plasma, the refractive index of surrounding liquid of plasma. Table 1 shows the different parametric values of less and normal water conditions and the variation of one parameter is also may affect the variation of other parameters. To analyze the critical condition according to the water concentration and these parameter variations, a machine learning model is used. This machine learning model is used to analyze the condition based on all parameter variations and notify for critical conditions else notify that no serious issue. The working of this model is shown in Figure 2.
For this model initially data is prepare for identification of disease. This data contain the refractive index of plasma and surrounding liquid and structure of plasma, height and weight of person. The refractive index of plasma is measures through design structure. After the detection of plasma refractive index for different parameter, analyze to identify that any serious health issue or not.
This paper designs a two-dimension PhC biosensor for the estimation of water concentration. In Section 1, the effect of water concentration is discussed. The introduction and literature related to the effect of water concentration are discussed in this section. Section 2 discussed the numerical analysis of the photonic structure to calculate the photonic bandgap of the device and sensitivity and quality factor parameters. The parameter of the designed structure and designing of the proposed structure is discussed in Section 3. Section 4 discussed the simulation result and conclusion of this paper.

2. Numerical Analysis

A photonic crystal is the periodic arrangement of two dielectric materials having different refractive indexes. The periodic arrangement of two different dielectric materials is like that of atoms of two different materials in the extrinsic semiconductor [17,18,19]. The optical signal transmission through this photonic structure is defined by the photonic crystal’s essential characteristics, i.e., photonic bandgap (PBG). The photonic bandgap is the region where the probability of having photons is significantly less. If the photons are excited in this region, the photon (optical signal) can travel easily without any interaction. The wavelength of this region is calculated by the Equation (6) [20,21]
λ = a f
where a is the lattice constant and f is the region’s frequency where the bandgap exists. Figure 3 shows the photonic bandgap of the design structure. From Figure 3, the photonic bandgap lies in between two regions 0.305–0.446 μ m 1 and 0.686–0.7229 μ m 1 . The wavelength of the exciting signal that lies in the region is calculated as λ = 0.48/0.305 to 0.48/0.446 μm is 1.07 to 1.573 μm and λ = 0.48/0.686 to 0.48/0.7229 μm is 0.664–0.7 μm.
The photonic bandgap is calculated using the equations of light governing TE and TM modes. These equations are used to define the transmission of light through the structure and in analyzing the controlling region of light. The light governing Maxwell’s equation is calculated by solving Maxwell’s equation for the dielectric medium. Maxwell’s equation for the dielectric medium is as follows [22,23,24,25]:
· D = 0
· B = 0
× E = B t
× H = D t
The electric and magnetic field equation is solved by putting the value of t as j ω . The solution is defined as:
× E r j ω μ 0 H r = 0
× H r + j ω ε 0 ε r E r = 0
By solving these equations for H ( r ) , the magnetic field equation is written as:
× 1 ε ( r ) × H ( r ) = ω c 2 H ( r )
Solving these equations for E ( r ) , the electric field equation is written as:
× × E ( r ) = ω c 2 ε r · E r
For optimization of the proposed structure, two important parameters are used. These two essential parameters, i.e., sensitivity and quality factors, are essential for defining the accuracy and reliability of the proposed structure Sensitivity is the ability to measure or detect the minimum refractive index changes. It is the ratio of shifting in the position of the resonant peak and change in the refractive index responsible for resonant peak shifting respectively. The unit of sensitivity is nm/RIU. For an excellent sensor, the sensitivity value should be higher. The sensitivity is mathematically defined as [26]:
S ( n m / R I U ) = Δ λ Δ η
The quality factor is calculated as the confinement of the optical signal in the waveguide region. It defines the shape and value of full width at half maximum (FWHM). The quality factor is calculated as [26,27,28]
Q = f 0 Δ f
where f 0 is the position of resonant peak and Δ f is the full width at half maximum (FWHM). This FWHM is the difference between the two wavelengths at which the magnitude is equal to half of its maximum value.

3. Design Structure

The photonic biosensor is designed with a silicon substrate material having a refractive index of 3.45 at a wavelength of 1550 nm. The air holes are inserted in this substrate material at a periodic interval with a hexagonal lattice structure. The distance between the centre of air holes (lattice constant) of this design structure is 0.48 μm and the radius of air holes is 0.14 μm so the essential condition of r / a is satisfied as follows:
0.25 r a 0.4
where r is the radius of air holes and a is the lattice constant. This r / a condition is essential for better confinement of optical signal in the waveguide region. The ratio of r / a for this design structure is 0.29.
The line defect as a waveguide of this structure is inserted to transmit the optical signal. In this waveguide region, the sensing cavity is introduced. The refractive index of this sensing cavity is the refractive index of plasma, and this plasma refractive index varies according to the concentration of water in plasma.
The line defect is created in this design structure for the proper transmission of the optical signal. Along with this line defect, point defect is also introduced in this design structure. The radius r a of point defect a is 0.2 μm. the radius r b of point defect b is 0.08 μm and for c point defect the radius r c is 0.05 and lattice constant d c is 0.4 μm. The other parameters of the design structure are shown in Table 2.
Figure 4 shows the proposed structure for analysing the water concentration in blood. In this Figure 3—point defect cavity is shown as a, b and c. The lattice dimension of this structure is 17*21 and the size of this structure is 12.15*8.45 μm. The thickness of the silicon wafer is 1 μm. Air is used as a cladding region.

4. Result and Discussion

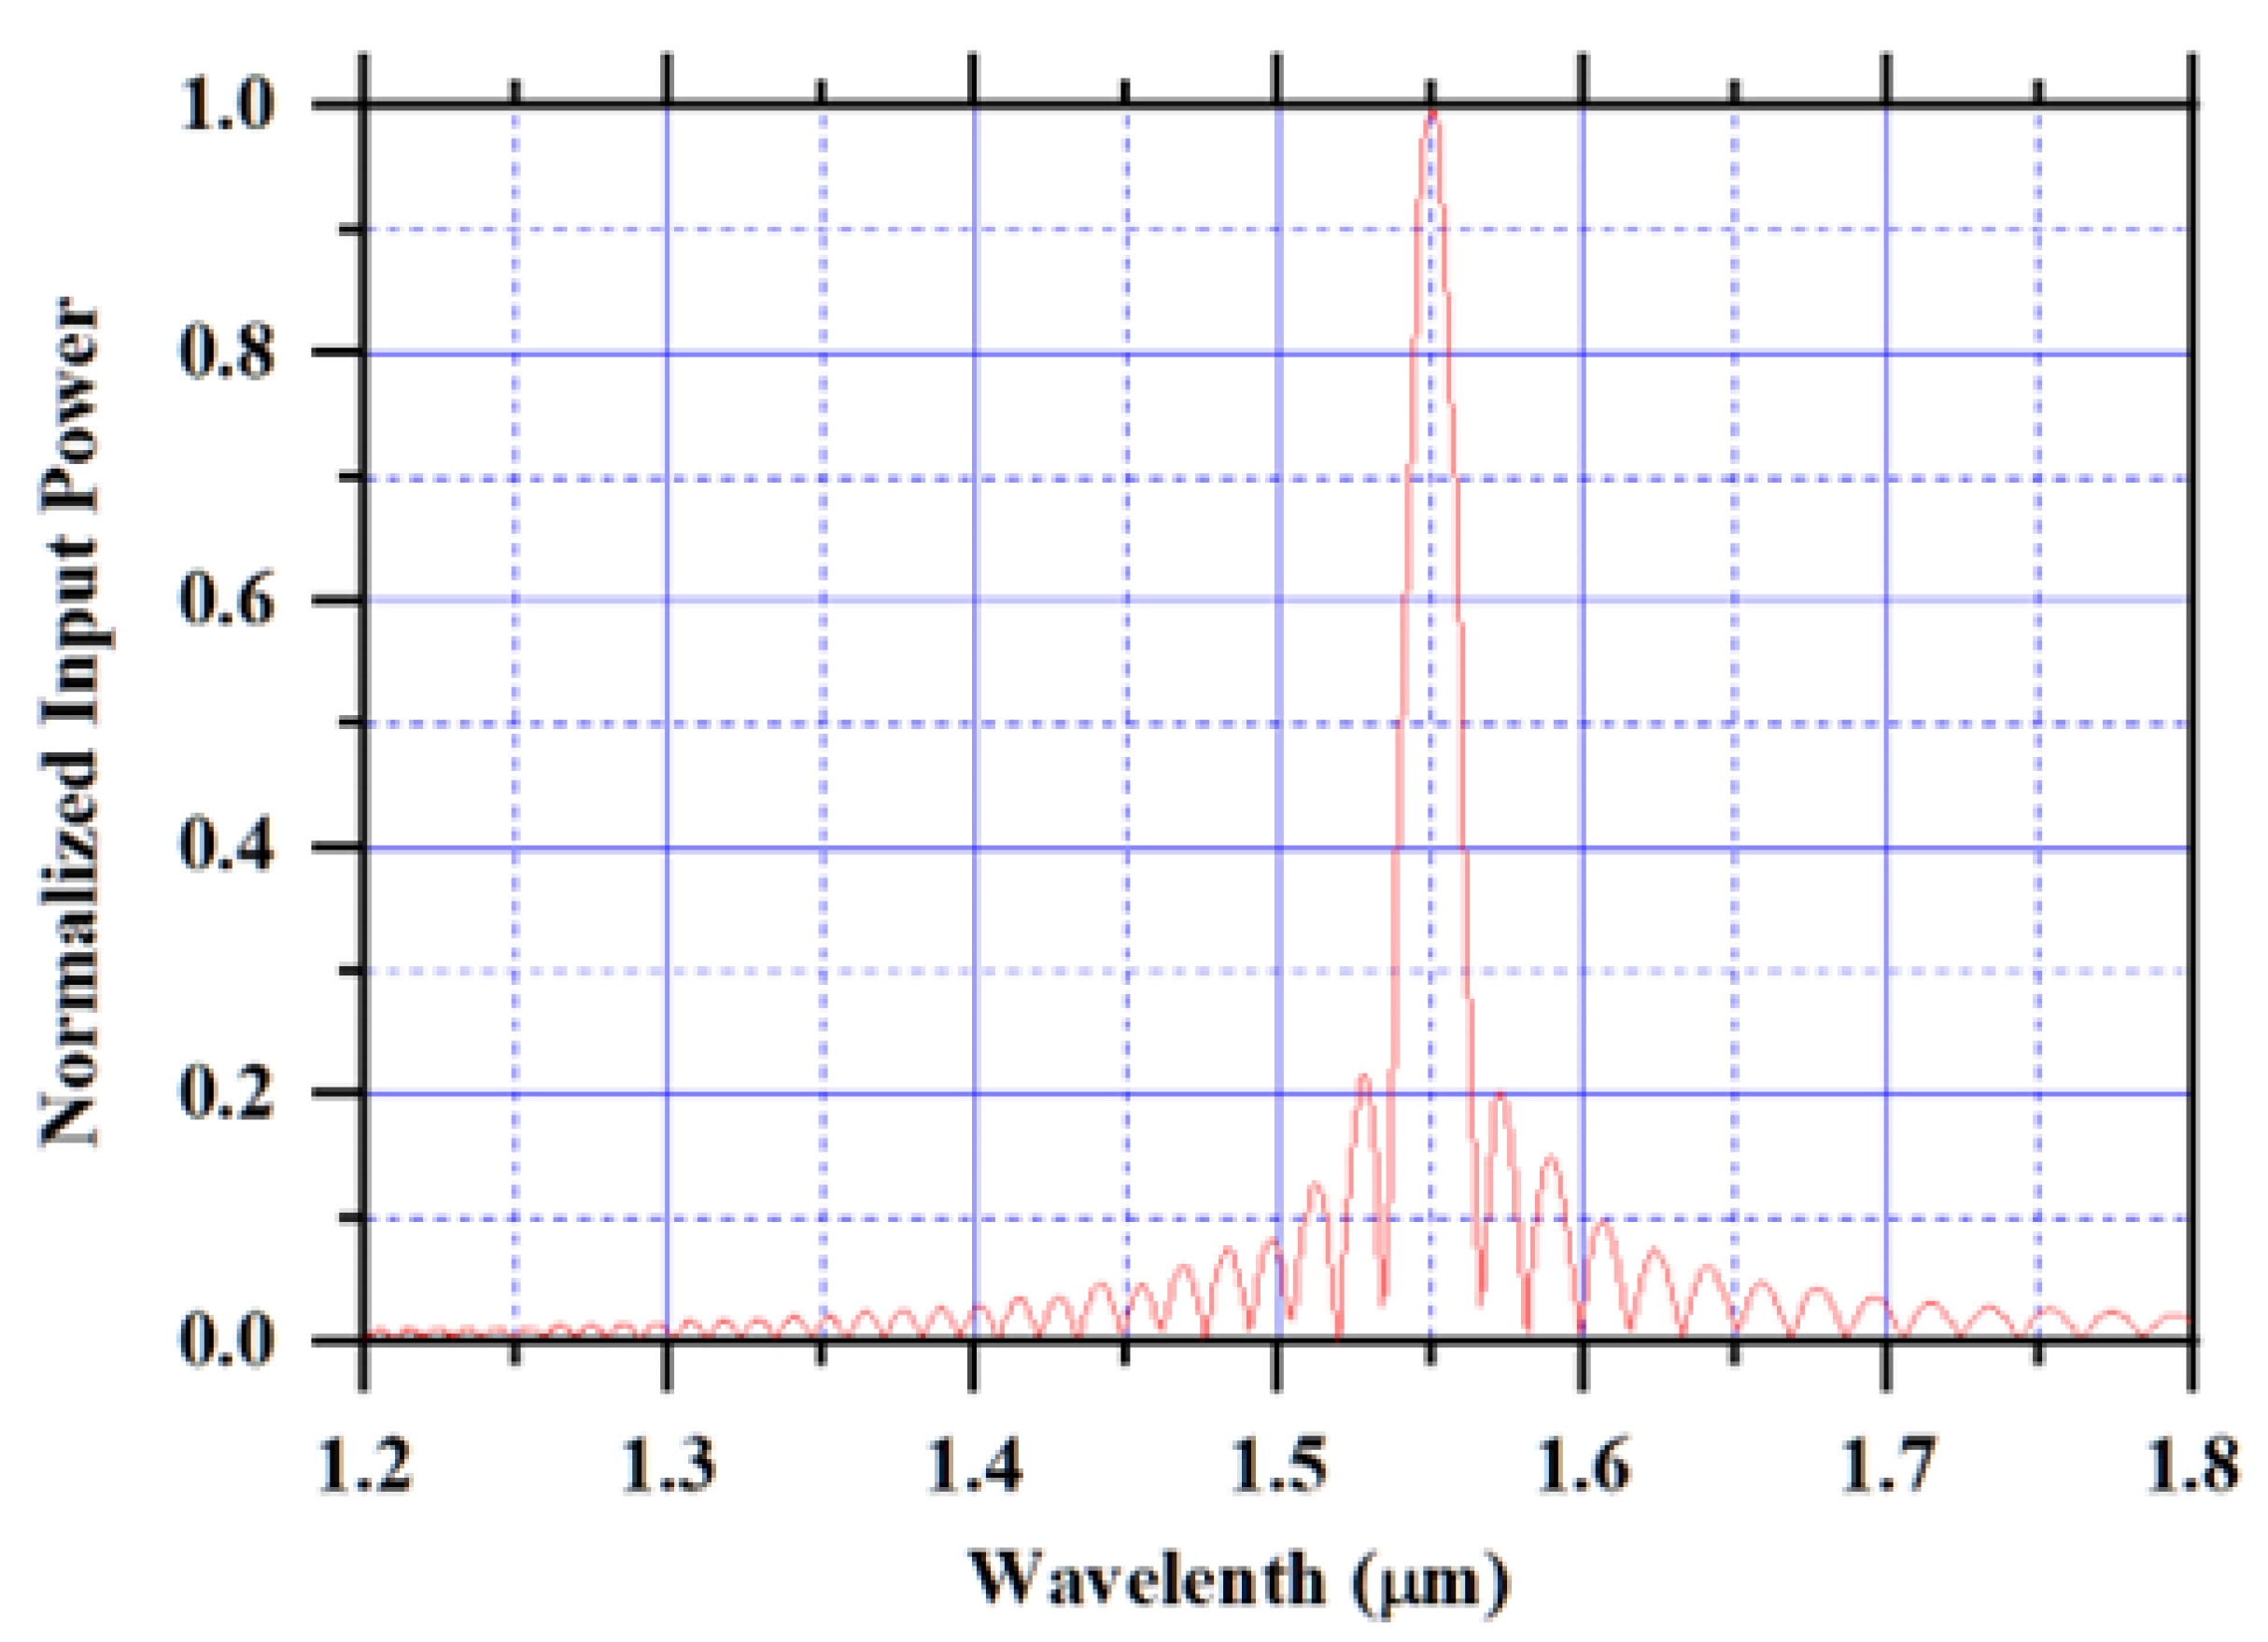
The continuous wave Gaussian pulse is applied as input. This input signal has a wavelength of 1550 nm. Figure 5 represents the normalized input power transmitted through the input port and Figure 6 represents the normalized output power received at the output port of the design structure. This figure represents that only 50% of power is received at the output port which means this structure confines only 50% of power in the waveguide region and the rest power will radiate in the design structure. This 50% signal confinement is only because of the point defect region with a higher air hole radius. When this region’s air holes radius is less, more signal is radiated in the design.
Table 3 represents the water concentration and the variation of refractive index in plasma. Equation (2) represents the relation between the refractive index of water, the refractive index of albumin, the concentration of water and the concentration of plasma. The refractive index of water and albumin is constant. The concentration of water and albumin changes, and according to this refractive index of plasma changes. This variation is shown in Table 3. This table shows that the refractive index of plasma changes from 1.3309 to 1.2714 as the water concentration is reduced from 90% to 80% in the blood, respectively.
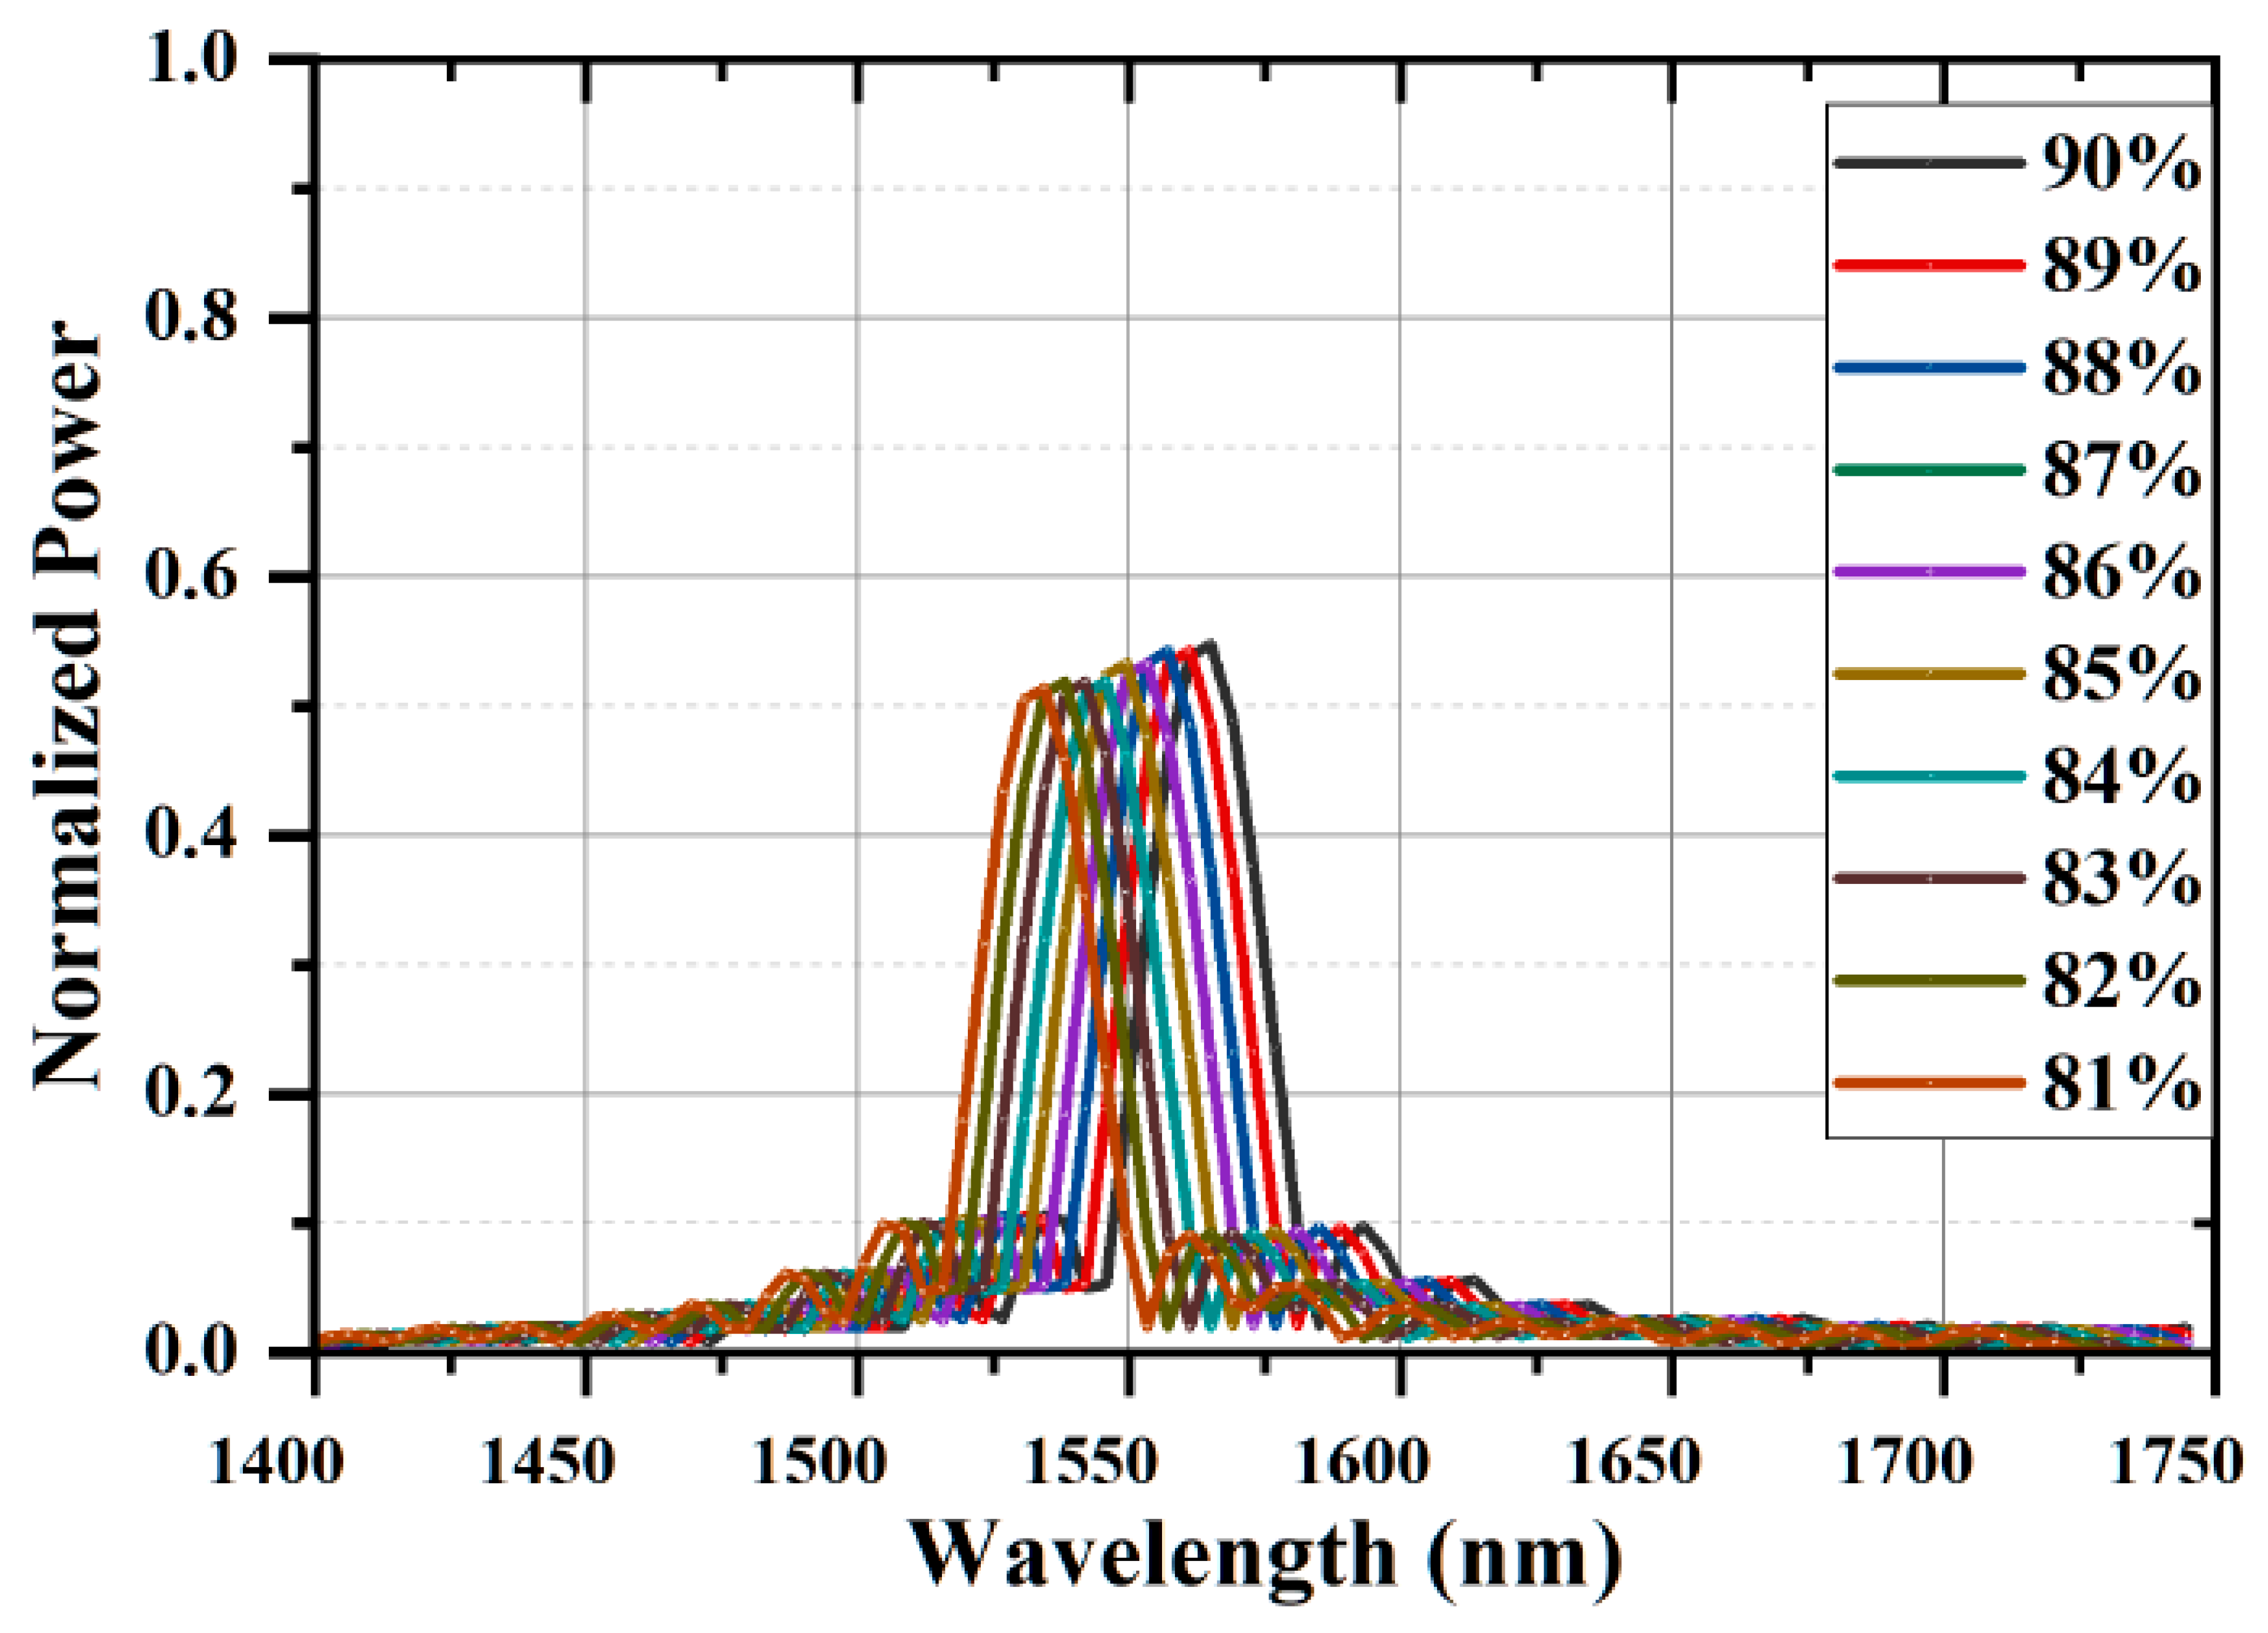
Table 4 shows the effect of water concentration on the refractive index of blood. As the water concentration is changed, the refractive index of plasma changes and as the refractive index of plasma changes the refractive index of whole blood changes. According to these changes in the refractive index of plasma and whole blood, the position of the resonant peak is shifted. This shift in resonant peak is detected through a photo spectrometer. Table 5 shows the refractive index and position of the resonant peak respective to the refractive index of sensing region. The sensitivity of the design structure is around 570 nm/RIU.
From Table 5, it is clearly shown that when the refractive index of plasma is reduced, the resonant peak is also shifted to a lower wavelength. Table 6 shows the refractive index of blood according to the concentration of water. As the concentration of water changes, the resonant peak is shifted to a lower position. Table 5 and Table 6 indicate that either the refractive index of blood or the refractive index of plasma may be used as an analyte refractive index to measure the water concentration in blood.
This detected resonant peak through the spectrometer is used to identify the refractive index of plasma, According to this refractive index of plasma, the age of the person and weight of the person is processed by the supervised learning algorithm and decision tree method to detect the reason for this variation. Although the identification of these parameters is crucial because for better implementation of this an accurate data-set is required.

5. Conclusions

This paper proposed a nano-cavity-based photonic structure for analyzing the water concentration in blood. Water is a very crucial component in blood to maintain various parameters. The proposed structure is a two-dimensional structure with a dimension of 12.15*8.45 μm. Due to this compact structure and the higher sensitivity of photonic crystals, these devices are widely used as a biosensor. The water concentration in the blood significantly changes the refractive index of plasma and the refractive index of blood. The sensitivity of this design structure is 570 nm/RIU and the normalized output power is approximately 54%. This higher sensitivity is beneficial for detecting a minor change in the refractive index. It can detect the MCHC, MCV and MCV and identify the possibility of disease at an early stage using supervised learning and decision tree mechanism. Hence, this photonic structure with a more accurate decision tree for the prediction of disease at an early stage has wider use in medical applications.

Author Contributions

For the execution of concept and drafting of this manuscript, the author contribution is as follows: Conceptualization, investigation, validation and writing—original draft preparation done by A.A.; writing—review and editing done by N.M., K.K.C. and R.P.; supervision and writing—review and editing, G.S. and S.K.B. All authors have read and agreed to the published version of the manuscript.

Funding

This research received no external funding.

Institutional Review Board Statement

Not applicable.

Informed Consent Statement

Not applicable.

Data Availability Statement

Not applicable.

Conflicts of Interest

The authors declare no conflict of interest.

References

  1. Malekshahi, M. Evolution of intense laser pulse spot size propagating in collisional plasma embedded in a magnetic field with variable direction. Phys. Plasmas 2017, 25, 012302. [Google Scholar] [CrossRef]
  2. Naumenko, E.K. Back-scattered radiation from the capillary network under the influence of low-power laser heating (Invited Paper). In Saratov Fall Meeting 2004: Optical Technologies in Biophysics and Medicine VI; SPIE: Bellingham, WA, USA, 2005; pp. 195–201. [Google Scholar]
  3. Lijnema, T.H.; Huizenga, J.R.; Jager, J.; Mackor, A.J.; Gips, C.H. Gravimetric determination of the water concentration in whole blood, plasma and erythrocytes and correlations with hematological and clinic chemical parameters. Clin. Chim. Acta 1993, 214, 129–138. [Google Scholar] [CrossRef] [PubMed]
  4. Kim, H.K.; Kim, S.H.; Ryu, J.K. Changes in the Blood Components Caused by Water Intake. Korean J. Clin. Lab. Sci. 2007, 49, 227–232. [Google Scholar] [CrossRef] [Green Version]
  5. Rodak, B.F.; Frisma, G.A.; Keohane, E.M. Hematology: Clinical Principles and Applications, 4th ed.; Elesvier: Amsterdam, The Netherlands, 2012; pp. 1–6. [Google Scholar]
  6. Coban, E.; Ozdogan, M.; Yazicioglu, G.; Akcit, F. The mean platelet volume in patients with obesity. Int. J. Clin. Pract. 2005, 59, 981–982. [Google Scholar] [CrossRef]
  7. Elblbesy, M.A. The refractive index of human blood measured at the visible spectral region by single-fiber reflectance spectroscopy. AIMS Biophys. 2021, 8, 57–65. [Google Scholar] [CrossRef]
  8. Meinke, M.C.; Müller, G.J.; Helfmann, J.; Friebel, M. Optical properties of platelets and blood plasma and their influence on the optical behavior of whole blood in the visible to near-infrared wavelength range. J. Biomed. Opt. 2007, 12, 014024. [Google Scholar] [CrossRef]
  9. Liu, S.; Deng, Z.; Li, J.; Wang, J.; Huang, N.; Cui, R.; Zhang, Q.; Mei, J.; Zhou, W.; Zhang, C.; et al. Measurement of the refractive index of whole blood and its components for a continuous spectral region. J. Biomed. Opt. 2019, 24, 1–5. [Google Scholar] [CrossRef]
  10. Gienger, J.; Smuda, K.; Müller, R.; Bär, M.; Neukammer, J. Refractive index of human red blood cells between 290 nm and 1100 nm determined by optical extinction measurements. Sci. Rep. 2019, 9, 4623. [Google Scholar] [CrossRef] [Green Version]
  11. Jin, Y.L.; Chen, J.Y.; Xu, L.; Wang, P.N. Refractive index measurement for biomaterial samples by total internal reflection. Phys. Med. Biol. 2006, 51, N371–N379. [Google Scholar] [CrossRef]
  12. Friebel, M.; Meinke, M.C. Determination of the complex refractive index of highly concentrated hemoglobin solutions using transmittance and reflectance measurements. J. Biomed. Opt. 2005, 10, 064019. [Google Scholar] [CrossRef]
  13. Heller, W. Remarks on refractive index mixture rules. J. Phys. Chem. 1965, 69, 1123–1129. [Google Scholar] [CrossRef]
  14. Tuchin, V.V. Handbook of Optical Biomedical Diagnostics: Methods; Society of Photo-Optical Instrumentation Engineers (SPIE): Bellingham, WA, USA, 2016. [Google Scholar]
  15. Kohl, M.; Cope, M.; Essenpreis, M.; BÖCker, D. Influence of glucose concentration on light scattering in tissue-simulating phantoms. Opt. Lett. 1994, 19, 2170–2172. [Google Scholar] [CrossRef] [PubMed] [Green Version]
  16. Oduncuoğlu, M. Refractive Index Formula of Blood as a Function of Temperature and Concentration. An. Acad. Bras. Ciênc. 2021, 93, e20201634. [Google Scholar] [CrossRef] [PubMed]
  17. Yablonovitch, E. Inhibited spontaneous emission in solid-state physics and electronics. Phys. Rev. Lett. 1987, 58, 2059. [Google Scholar] [CrossRef] [PubMed] [Green Version]
  18. John, S. Strong localization of photons in certain disordered dielectric superlattices. Phys. Rev. Lett. 1987, 58, 2486–2489. [Google Scholar] [CrossRef] [PubMed] [Green Version]
  19. Wu, F.; Wu, X.; Xiao, S.; Liu, G.; Li, H. Broadband wide-angle multilayer absorber based on a broadband omnidirectional optical Tamm state. Opt. Express. 2021, 29, 23976–23987. [Google Scholar] [CrossRef]
  20. Nair, R.V.; Vijaya, R. Photonic crystal sensors: An overview. Prog. Quantum Electron. 2010, 34, 89–134. [Google Scholar] [CrossRef]
  21. Scherer, A.; Painter, O.; Vuckovic, J.; Loncar, M.; Yoshie, T. Photonic crystals for confining, guiding, and emitting light. IEEE Trans. Nanotechnol. 2002, 1, 4–11. [Google Scholar] [CrossRef]
  22. Biswas, U.; Rakshit, J.K.; Bharti, G.K. Design of photonic crystal microring resonator based all-optical refractive-index sensor for analyzing different milk constituents. Opt. Quantum Electron. 2020, 52, 19. [Google Scholar] [CrossRef]
  23. Joannopoulos, J.D.; Villeneuve, P.R.; Fan, S. Photonic crystals: Putting a new twist on light. Nature 1997, 386, 143–149. [Google Scholar] [CrossRef]
  24. Joannopoulos, J.D.; Johnson, S.G.; Winn, J.N.; Meade, R.D. Photonic Crystals: Molding the Flow of Light, 2nd ed.; Princeton University Press: Princeton, NJ, USA, 2008. [Google Scholar]
  25. Troia, B.; Paolicelli, A.; Leonardis, F.D.; Passaro, V.M.N. Photonic Crystals for Optical Sensing: A Review. Adv. Photonic Cryst. 2013, 241–295. [Google Scholar] [CrossRef] [Green Version]
  26. Agarwal, A.; Sahu, S.; Mudgal, N.; Singh, G.; Bhatnagar, S.K. Photonic Crystal Cavities based Biosensors: A Review. In Proceedings of the 2020 International Conference on Emerging Trends in Communication, Control and Computing (ICONC3), Lakshmangarh, India, 21–22 February 2020; pp. 1–5. [Google Scholar]
  27. Agarwal, A.; Mudgal, N.; Sahu, S.; Singh, G.; Bhatnagar, S.K. Design of a Nanocavity Photonic Crystal Structure for Biosensing Application. Opt. Wirel. Technol. Proc. OWT 2021, 771, 321–330. [Google Scholar]
  28. Agarwal, A.; Mudgal, N.; Saharia, A.; Singh, G.; Bhatnagar, S.K. Silicon nitride based photonic biosensor for analyzing blood diseases. Mater. Today Proc. 2022, 66, 3507–3510. [Google Scholar] [CrossRef]
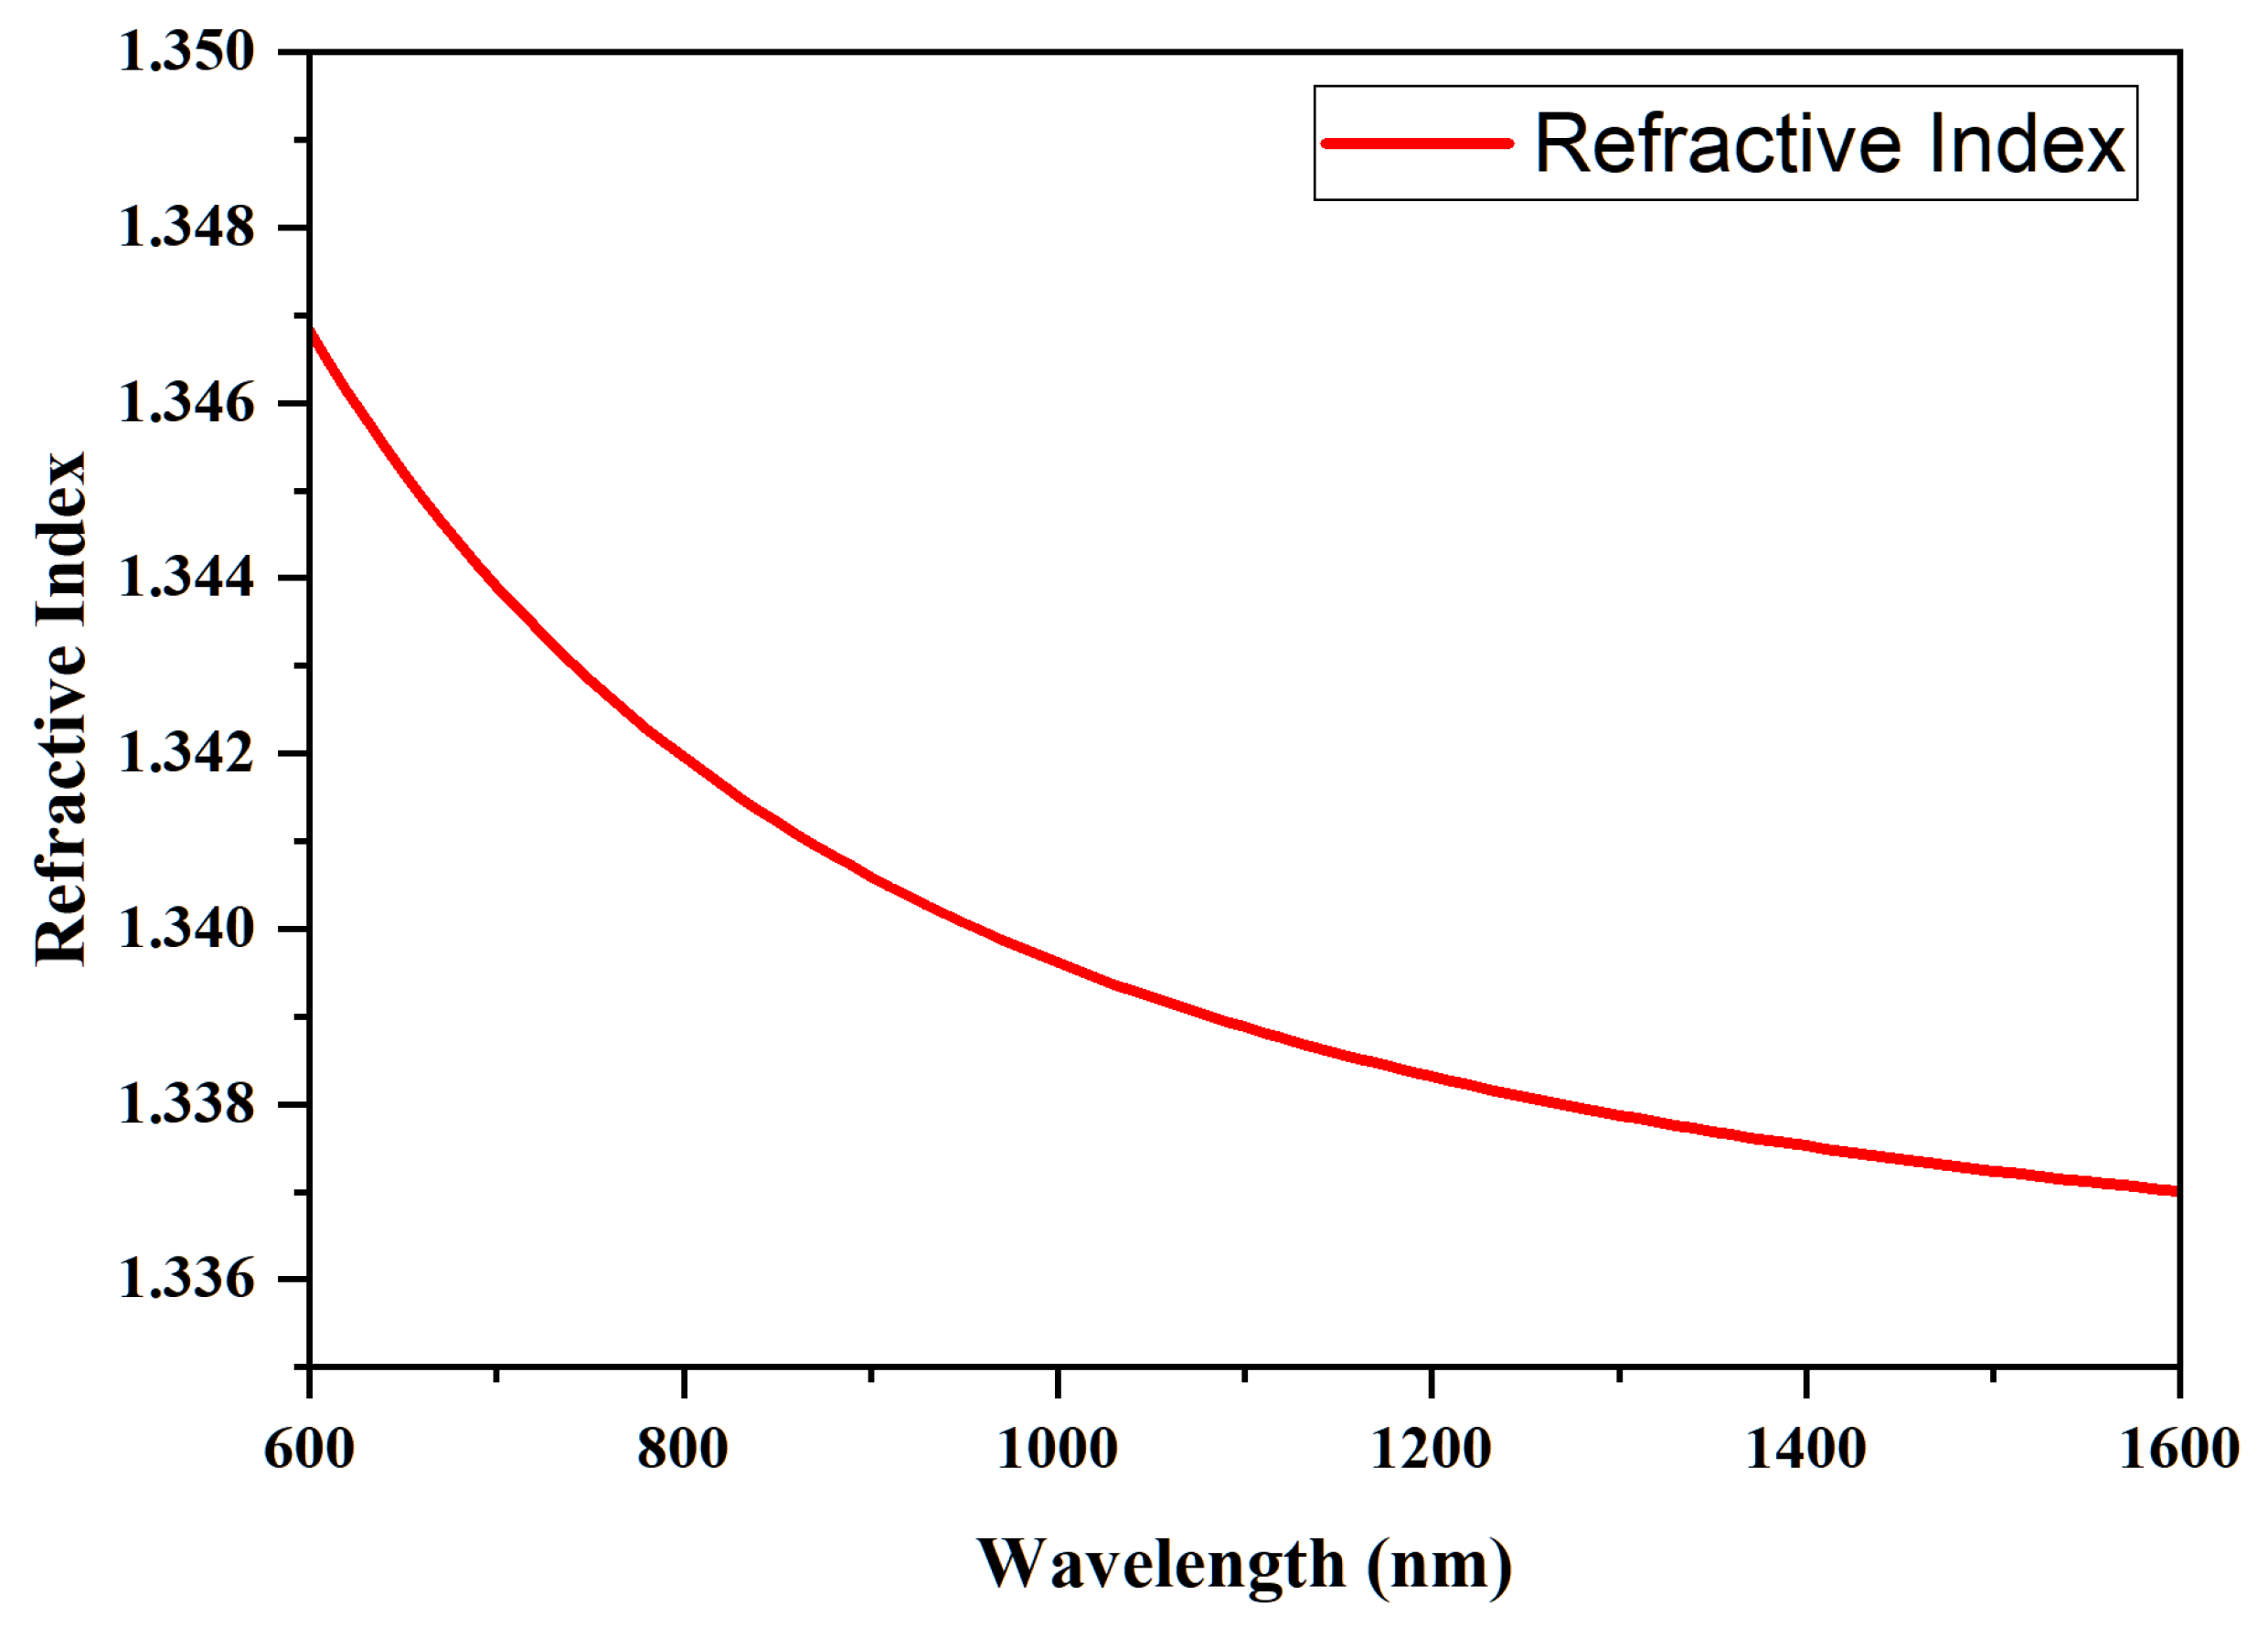
Figure 1. Variation of the refractive index of plasma with a wavelength of the signal.
Photonics 10 00071 g001
Figure 2. Machine Learning model for identification of hematological disorder.
Photonics 10 00071 g002
Figure 3. Photonic bandgap of the design structure.
Photonics 10 00071 g003
Figure 4. Design structure for detection of water concentration in blood.
Photonics 10 00071 g004
Figure 5. Normalized input power of the design structure.
Photonics 10 00071 g005
Figure 6. Normalized output power of the design structure.
Photonics 10 00071 g006
Table 1. Effect of water concentration in changing hematological parameters [4].
Hematologic ParametersLess Water ConcentrationNormal Water Concentration
WBC ( × 10 3 / μ L)6.9756.63
RBC ( × 10 6 / μ L)4.7924.78
Hgb (g/dL)12.23810.9
MCV (fL)87.6382.67
MCH (pg)26.5424.67
MCHC (g/dL)30.129.067
MPV (fL)10.9511.6
Table 2. Design parameters of the proposed structure.
Design ParameterParameter Value
Substrate materialSilicon (Si)
Refractive index of the substrate3.45
Refractive index of sensing cavityRefractive index of plasma
Lattice constant0.48 μm
Radius of air holes0.14 μm
Radius of point defect a0.20 μm
Radius of point defect b0.08 μm
Radius of point defect c0.05 μm
Lattice constant for point defect c0.405 μm
Photonic band gap region0.305–0.446 μ m 1
0.686–0.723 μ m 1
Table 3. Water concentration in blood and refractive index of plasma.
f (Water) η (Water)f (Albumin) η (Albumin) for 55 g/L η (pl)
90%1.3310%1.33871.3309
89%1.3310%1.33871.3243
88%1.3310%1.33871.3177
87%1.3310%1.33871.3110
86%1.3310%1.33871.3044
85%1.3310%1.33871.2978
84%1.3310%1.33871.2912
83%1.3310%1.33871.2846
82%1.3310%1.33871.2780
81%1.3310%1.33871.2714
Table 4. Variation of the refractive index of blood with water concentration.
Water Percentagef (RBC) η (RBC)f (Plasma) η (Plasma) η (Blood)
90%45%1.3355%1.33091.3305
89%45%1.3355%1.32431.3267
88%45%1.3355%1.31771.3232
87%45%1.3355%1.3111.3196
86%45%1.3355%1.30441.3159
85%45%1.3355%1.29781.3123
84%45%1.3355%1.29121.3087
83%45%1.3355%1.28461.3050
82%45%1.3355%1.2781.3014
81%45%1.3355%1.27141.2978
Table 5. Position of resonant peak and sensitivity of the design structure with the change of refractive index of plasma.
Water ConcentrationRefractive Index of Plasma η (pl)Position of Resonant Peak (nm)Sensitivity (nm/RIU)
90%1.33091571.25Reference
89%1.32431567.52565
88%1.31771563.79565
87%1.3111559.82574
86%1.30441556.23567
85%1.29781552.15577
84%1.29121548.67569
83%1.28461544.84571
82%1.2781541.23567
81%1.27141537.90560
Table 6. Position of resonant peak and sensitivity of the design structure with change in the refractive index of blood.
Water ConcentrationRefractive Index of blood η (Blood)Position of Resonant Peak (nm)Sensitivity (nm/RIU)
90%1.33051571.10Reference
89%1.32691568.97570
88%1.32321566.92571
87%1.31961564.73579
86%1.31591562.76575
85%1.31231560.51575
84%1.30871558.60572
83%1.30501556.49578
82%1.30141554.51574
81 %1.29781552.68573
Disclaimer/Publisher’s Note: The statements, opinions and data contained in all publications are solely those of the individual author(s) and contributor(s) and not of MDPI and/or the editor(s). MDPI and/or the editor(s) disclaim responsibility for any injury to people or property resulting from any ideas, methods, instructions or products referred to in the content.