


Abstract
Bacterial density, cell morphology, and carbon stock (C stock) were quantified in seven Brazilian reservoirs (Serra da Mesa, Manso, Itumbiara, Corumbá, Furnas, Mascarenhas de Moraes, and Luis Carlos Barreto) to evaluate spatial and seasonal patterns in these tropical freshwater systems. Subsurface water samples were collected before, during, and after the rainy season. Bacterial density, cell volume, elongation, and biomass were determined using epifluorescence microscopy, and bacterial C stock was estimated from biomass integrated over the 0.5 m sampling depth. C stock varied among reservoirs and sampling periods, with the highest values consistently observed in the largest reservoir (Serra da Mesa, 1.9·10−5 g C). Although bacterial densities showed limited temporal variation, biomass peaked before the rainy season. Density and biomass were negatively correlated with water transparency and positively correlated with turbidity, suggesting that particle-associated organic and inorganic matter influences bacterial biomass accumulation. These findings highlight how environmental conditions shape bacterial biomass and carbon storage in tropical reservoirs, contributing to a broader understanding of microbial carbon pools in these ecosystems.
1. Introduction
Heterotrophic bacteria play a central role in biogeochemical processes in aquatic ecosystems, particularly in the cycling and transformation of carbon (C) [1,2]. Rather than serving as an energy source for primary producers, the C associated with bacterioplankton represents a substantial component of the organic carbon pool available to heterotrophic consumers and higher trophic levels [3]. Consequently, bacterial biomass contributes significantly to the structure and functioning of aquatic food webs [4].
The C content of bacterial cells varies widely, and its quantification often requires estimating cell volume, as biomass can be derived from biovolume measurements [5,6]. Variations in cell size and morphology are influenced by ecological interactions, including predation pressure, which can select for elongated or filamentous forms as a defense strategy [7,8,9]. Thus, bacterial size is an important trait mediating predator–prey interactions [2,10]. Bacterial biomass and production also respond to nutrient availability and primary production, consistent with the Growth Rate Hypothesis, which links growth rate, RNA content, and cellular phosphorus demand [11,12,13].
Accordingly, bacterial density and biomass vary with limnological factors such as inorganic nutrient concentrations, the quantity and quality of organic matter, predation, viral lysis, and other environmental drivers [14,15,16]. Understanding these controls is essential for elucidating how carbon and nutrients flow through planktonic food webs [17,18]. Because these processes are strongly context-dependent, bacterial abundance and biomass must be evaluated across spatial and temporal gradients to accurately characterize their role in carbon cycling [19].
Spatial variability in bacterial communities is shaped by hydrodynamic processes such as mixing, resuspension, and riverine inputs [20], while predation exerts strong top-down control on bacterial dynamics [21]. Temporal changes in bacterial density, biomass, and carbon stock (C stock) have been documented in multiple freshwater systems [22]. Temperature further modulates bacterial activity by influencing dissolved organic matter availability and metabolic rates [23]. For example, bacteria from temperate regions often exhibit higher biomass production at elevated temperatures [24], with growth typically peaking in summer. In contrast, tropical microorganisms generally operate near their thermal optima year-round [25,26]. Nevertheless, microbial contributions to carbon cycling in tropical reservoirs south of the Equator differ from those in temperate systems [27,28,29], as tributary rivers exert strong physical, chemical, and biological influences on reservoir conditions [30,31,32].
In many tropical countries, hydroelectric reservoirs represent a major source of electricity [33,34]. However, most available data on reservoir microbial ecology originate from temperate regions and may not reflect the dynamics of tropical systems [35]. Expanding microbial datasets from tropical reservoirs is therefore essential for improving global assessments of carbon cycling.
Beyond their ecological relevance, carbon-driven microbial processes have increasingly been linked to broader environmental mechanisms with implications for public health. Environmental carbon pools can influence microbial communities, as a possible increase in antimicrobial resistance has been observed in environments with lower availability of organic carbon, representing a competitive advantage for bacteria under stronger nutrient limitation [36]. Carbon cycling also depends on climate-related processes, given the interactions between bacterial C stock and temperature. Liang et al. [37] reported a global tendency toward reduced microbial C stocks in soils, which may have significant consequences for climate change, food security, and ecosystem integrity. Additionally, climate-driven shifts in aquatic microbial communities can intensify the proliferation of pathogens, toxins, and antimicrobial resistance, highlighting the need to understand how bacterial C stocks respond to environmental variation [38]. These connections underscore the importance of characterizing bacterial C stock in tropical reservoirs, as such information contributes not only to limnological understanding but also to broader environmental assessments relevant to public health.
The aim of this study was to estimate bacterial C stock in tropical hydroelectric reservoirs, assess seasonal variability, and identify the environmental factors influencing the distribution of heterotrophic bacteria in these ecosystems. This study provides an integrated assessment of bacterial C stock across multiple large tropical reservoirs, combining morphological, biomass, and C stock estimates with environmental drivers across contrasting hydrological periods. Unlike previous studies that focused on single systems or short-term dynamics, our work offers a spatially and seasonally resolved baseline for microbial carbon pools in tropical hydroelectric reservoirs. These findings contribute to filling a major knowledge gap in tropical limnology, where microbial carbon dynamics remain underrepresented in global carbon cycle assessments.
2. Materials and Methods
Sampling was conducted in seven Brazilian hydroelectric reservoirs located above the Tropic of Capricorn: Serra da Mesa (SDM) (13°49′ S, 48°18′ W), Manso (MAN) (15°27′ S, 56°17′ W), Itumbiara (ITB) (18°41′ S, 49°08′ W), Corumbá (CRB) (18°38′ S, 48°51′ W), Furnas (FUR) (21°06′ S, 46°25′ W), Mascarenhas de Moraes (MS) (20°28′ S, 47°05′ W), and Luis Carlos Barreto (LC) (20°15′ S, 47°26′ W). The last three reservoirs are located along the Grande River and form a cascade system. These reservoirs differ markedly in morphology, hydrodynamics, and limnological characteristics (Table 1).
Table 1.
Area (km2), volume (km3), flooding duration (age—years at the time of sampling), phytoplankton biomass (BFITO—μg C L−1), zooplankton biomass (BZOO—mg C L−1), temperature (TEMP—°C), water transparency (SECCHI—m), turbidity (TURB—NTU), conductivity (COND—mS cm−1), concentrations of dissolved carbon (DOC—mg L−1), total nitrogen (TN—μg L−1), and total phosphorus (TP—μg L−1) at the same points in the reservoirs and sample periods for the bacterial community. The value n following the name of each reservoir indicates the number of sampling points associated with that reservoir in each of the three sampling periods. Source: Database of the Carbon Balance Project in FURNAS Centrais Elétricas S.A. Reservoirs.
Water samples were collected from the subsurface (0.5 m depth) at upstream, downstream, and dam-adjacent sites in each reservoir, as well as from their main tributary rivers. Sampling occurred during three hydrological periods: (i) the beginning of the rainy season (“pre-rain”: November 2003 for SDM and MAN; November 2004 for ITB and CRB; November 2005 for FUR, MS, and LC); (ii) the end of the rainy season (“post-rain”: March 2004 for SDM and MAN; March 2005 for ITB and CRB; April 2006 for FUR, MS, and LC); and (iii) the dry season (July 2004 for SDM and MAN; August 2005 for ITB and CRB; August 2006 for FUR, MS, and LC). All samples were processed immediately after collection to ensure the reliability of the data obtained for both abiotic and biotic analyses, including the fixation and handling of microbiological samples to avoid alterations in bacterial cell density and morphology.
2.1. Bacterial Density
Water samples for bacterial counts were fixed with 4% formalin. Subsamples were filtered onto black polycarbonate Millipore filters (0.2 μm pore size) and stained with acridine orange following Hobbie et al. [39]. Total bacterial density was determined by counting 20 randomly selected microscopic fields per filter using an Olympus IX-71 epifluorescence microscope (Olympus Corporation, Tokyo, Japan).
2.2. Bacterial Biomass
To estimate bacterial biovolume and carbon content, we followed the methodological procedures described in references Massana et al. [40] and Norland [41], which provide the standard equations and analytical framework for converting cell dimensions into biovolume and biomass. To this end, images of bacterial cells were captured using an Evolution VF high-resolution cooled color video camera coupled to the microscope and processed with Image Pro Plus 6.0 software. Cell area and elongation were quantified using Image Tool 3.0. Each analyzed image contained at least 25 cells.
Cell volume (V) was estimated from measured cell area (A) using the equation [40]:
Cell carbon biomass (Bc) was then calculated using the allometric relationship [41]:
where Bc is expressed in fg C cell−1 and 120 is the conversion factor for fg C.μm−3. Average cell biomass was multiplied by total bacterial density to obtain the mean bacterial biomass for each sample. Relationships between cell volume and elongation were evaluated for each reservoir and sampling period.
2.3. Total Bacterial Cell Count and Bacterial Carbon Stock
The total number of bacterial cells in each reservoir was estimated by multiplying the mean bacterial density measured at 0.5 m depth by the surface area of the reservoir (Table 1). This approach assumes that subsurface density is representative of the epilimnetic layer sampled. Total bacterial C stock was calculated by multiplying the estimated total number of cells by the mean cell carbon biomass for each reservoir and sampling period.
2.4. Statistical Analysis
One-way ANOVA followed by Tukey’s post hoc tests was used to compare bacterial density, bacterial biomass, and bacterial C stock among reservoirs, sampling sites, and hydrological periods. All data were normal and homogeneous in their distribution. Statistical significance was set at p < 0.05. Spearman’s rank correlation was used to assess relationships between bacterial variables and environmental parameters.
2.5. Relationships with Environmental Variables
Correlation analyses were performed between dependent variables (bacterial density and biomass) and independent variables, including temperature, water transparency, turbidity, dissolved organic carbon (DOC), total nitrogen (TN), total phosphorus (TP), and carbon biomass of phytoplankton and zooplankton. Environmental data were obtained from the Carbon Balance in Furnas Centrais Elétricas S.A. Reservoirs Project database, to which this study belongs (Table 1). Additionally, principal component analysis (PCA) was conducted to explore multivariate relationships between bacterial attributes and environmental variables. PCA data were analyzed in the R program (version 4.5.3).
3. Results
3.1. Bacterial Density
Bacterial density varied among reservoirs and hydrological periods (Table 2). To avoid unnecessary repetition of units in the bacterial density results presented here, all values are expressed as cells·106·mL−1. Serra da Mesa consistently exhibited the highest densities across all sampling periods (pre-rain: 1.3; post-rain: 0.5; dry: 0.5), whereas Mascarenhas de Moraes showed the lowest values (pre-rain: 0.2; post-rain: 0.2; dry: 0.1). In all reservoirs, bacterial density peaked in the pre-rain period, with values significantly higher than those observed in the post-rain and dry periods (SDM: 1.3; MAN: 0.4; ITB: 0.9; CRB: 1.1; FUR: 0.3; MS: 0.2; LC: 0.2). The lowest densities occurred during the dry season, similar to those recorded in the post-rain period.
Table 2.
Estimated number of bacterial cells (BD—cells·1012·m−2) and bacterial carbon stock (BB—mg C·m−2) in each reservoir integrated over the sampling depth (0.5 m).
During the pre-rain period, reservoirs formed two distinct groups based on bacterial density (Table 2). In the dry season, Serra da Mesa, Itumbiara, and Corumbá exhibited the highest densities (0.5, 0.8, and 0.4, respectively), significantly different from the remaining reservoirs. In the post-rain period, three groups emerged: (i) Serra da Mesa and Manso (0.5–0.6), (ii) Itumbiara and Corumbá (0.3), and (iii) Furnas, Mascarenhas de Moraes, and Luis Carlos Barreto (0.2). A similar grouping pattern was observed in the dry period, with Furnas, Mascarenhas de Moraes, and Luis Carlos Barreto presenting the lowest densities (0.1).
3.2. Bacterial Biomass
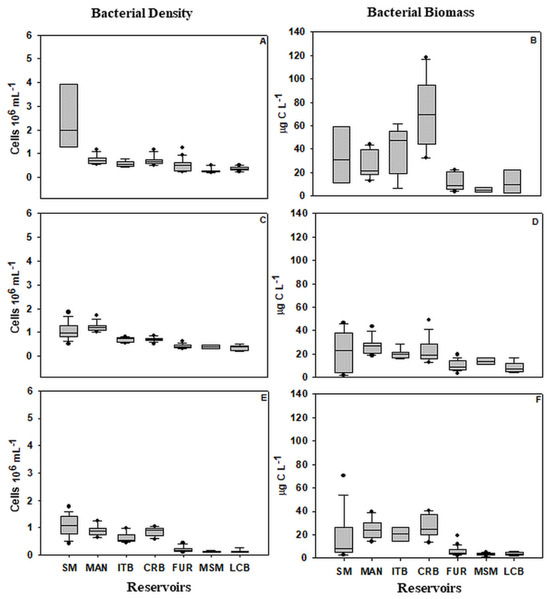
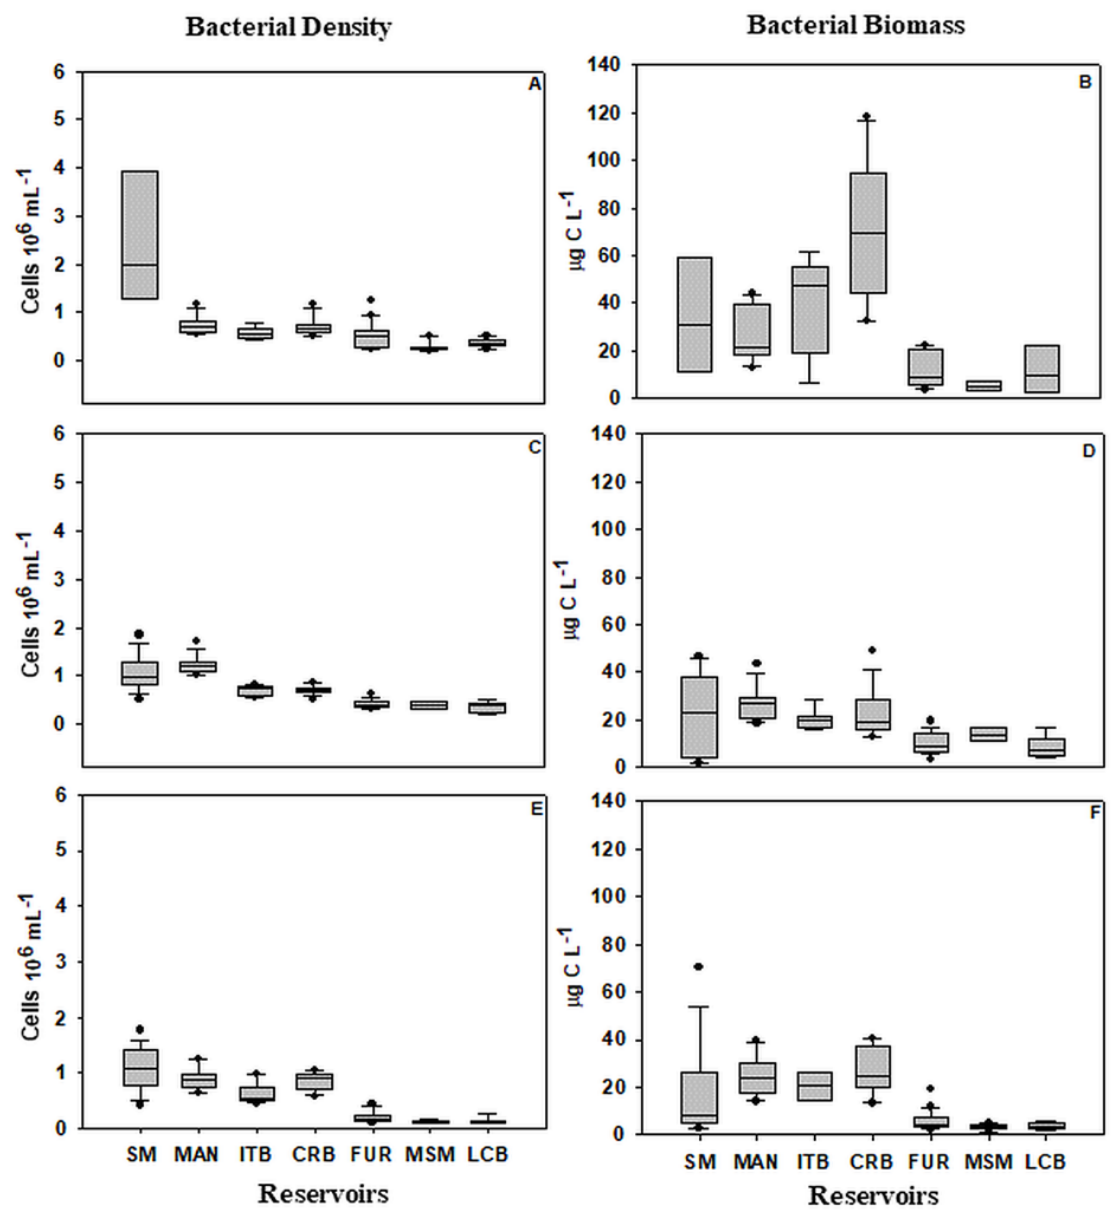
Average bacterial biomass ranged from 5.8 to 36 μg C·L−1 (Luis Carlos Barreto and Corumbá, respectively), with no significant differences among reservoirs when all periods were pooled (Table 2). However, biomass was significantly higher in the pre-rain period compared with the other periods (Figure 1). In this season, Corumbá exhibited the highest biomass (0.23 μg C·L−1), significantly exceeding values from the other reservoirs. Differences were also observed between Itumbiara and Furnas. In the post-rain period, Serra da Mesa, Manso, Itumbiara, and Corumbá showed the highest biomasses (11–13 μg C·L−1), whereas the cascade reservoirs of the Grande River exhibited the lowest values (4.3–6.7 μg C·L−1). During the dry period, Corumbá again showed the highest biomass (14 μg C·L−1), separating the reservoirs into two groups: (a) Serra da Mesa, Manso, Itumbiara, and Corumbá, and (b) Furnas, Mascarenhas de Moraes, and Luis Carlos Barreto.
Figure 1.
Boxplots showing mean, median, and standard deviation of bacterial density (cells·106·mL−1—(A,C,E)) and bacterial biomass (μg C·L−1—(B,D,F)) in the Serra da Mesa (SM), Manso (MAN), Itumbiara (ITB), Corumbá (CRB), Furnas (FUR), Mascarenhas de Moraes (MSM), and Luis Carlos Barreto (LCB) reservoirs across hydrological periods: pre-rain (A,B), post-rain (C,D) and dry (E,F).
3.3. Total Bacterial Cell Count and Bacterial Carbon Stock
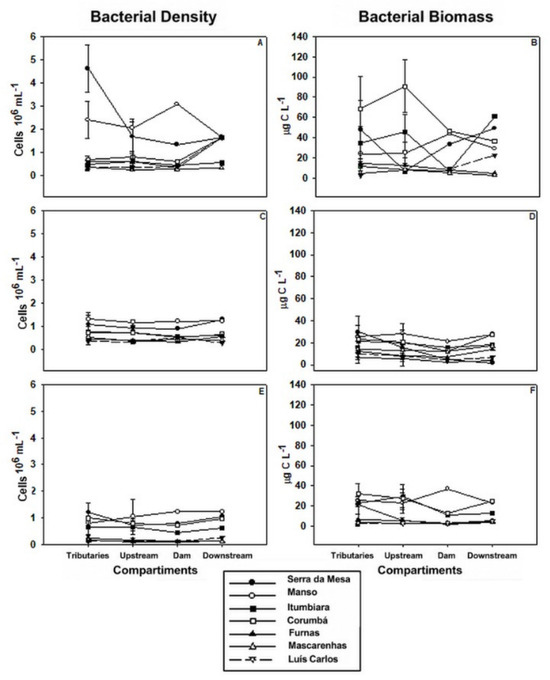
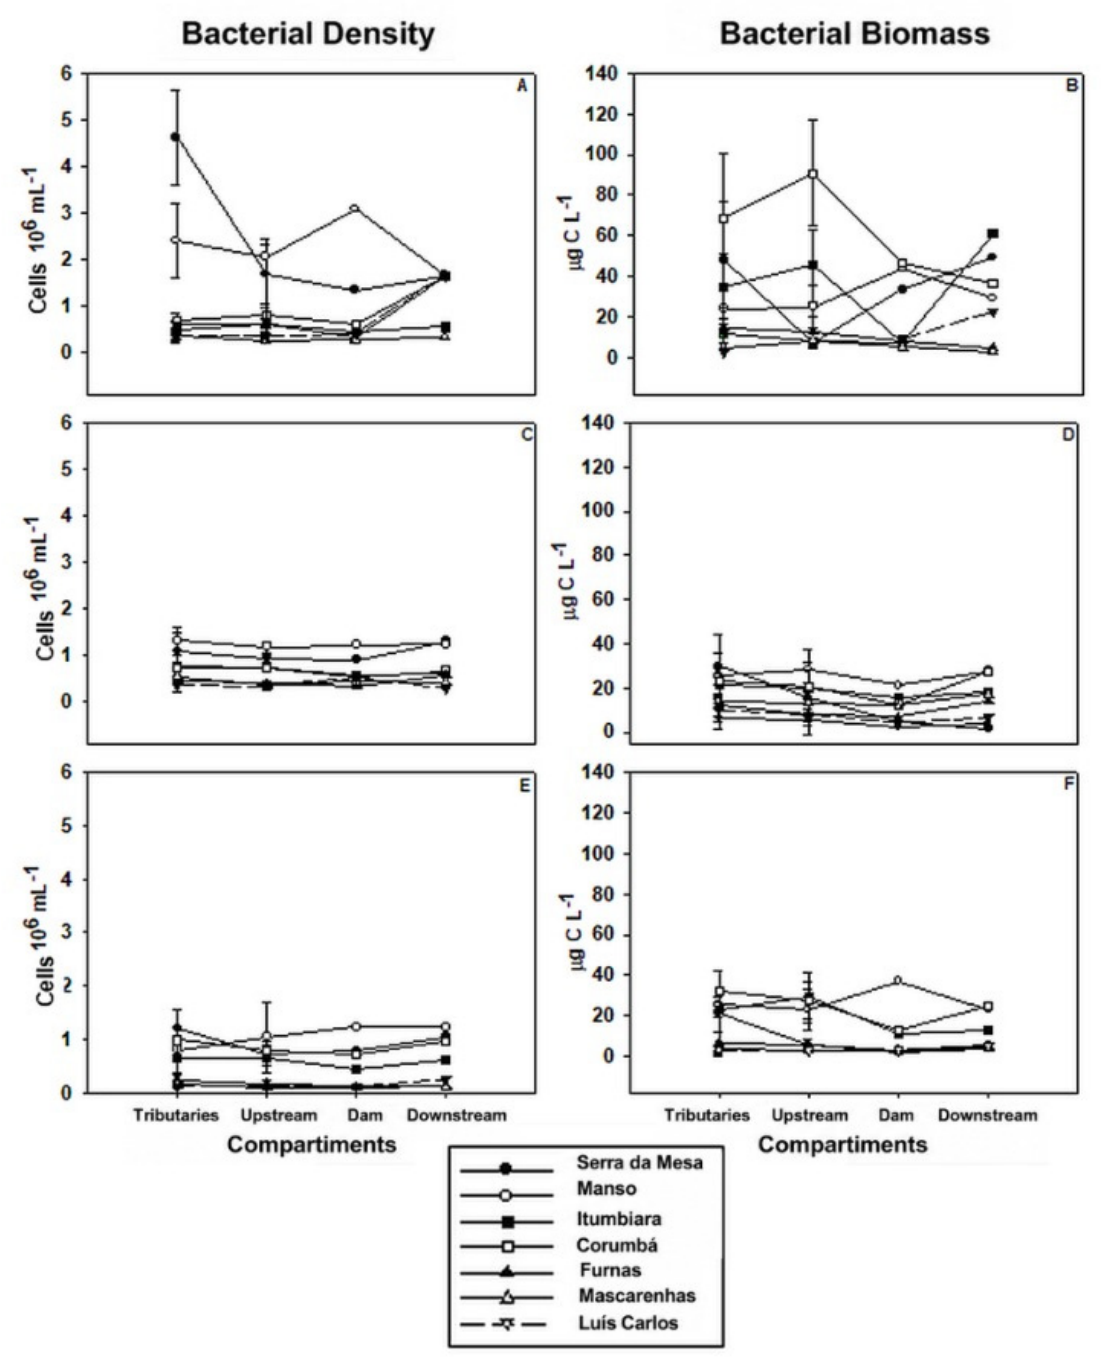
Tributaries of Serra da Mesa exhibited the highest bacterial densities in the pre-rain period (22.3; Table 3). Upstream and dam sites in Manso also showed elevated values. Downstream densities were similar among Serra da Mesa, Manso, Corumbá, Furnas, and Luis Carlos Barreto (Figure 2A). In the post-rain period, Manso showed the highest densities in tributaries, upstream, and dam compartments (0.6; Table 2), while Serra da Mesa exhibited the highest downstream density (Figure 2C). In the dry period, Serra da Mesa tributaries again showed the highest density (9.59; Table 3), and Manso presented the highest upstream, dam, and downstream values (Figure 2E).
Table 3.
Estimated number of bacterial cells (BD—cells·1020) and bacterial carbon stock (BB—10−5 g C) from data integrated with a collection depth of 0.5 m in the studied reservoirs.
Figure 2.
Total bacterial density (cells·106·mL−1—(A,C,E)) and total bacterial biomass (μg C·L−1—(B,D,F)) in tributary, upstream, dam, and downstream compartments of the seven reservoirs in the compartments of the seven studied reservoirs across hydrological periods: pre-rain (A,B), post-rain (C,D) and dry (E,F).
Bacterial biomass in tributaries, upstream, and dam compartments was highest in Corumbá during the pre-rain period (36 mg C·L−1; Table 2). Downstream biomass peaked in Itumbiara during this period (Figure 2B). In the post-rain period, Serra da Mesa tributaries showed the highest biomass (1.91; Table 3), while Manso exhibited the highest upstream and dam values (13 mg C·L−1; Table 2). Downstream biomass was highest in Manso and Corumbá (Figure 1D). In the dry period, Corumbá tributaries showed the highest biomass, and upstream values were highest in Itumbiara and Corumbá. Manso exhibited the highest dam biomass, and downstream values were similar between Manso and Corumbá (Figure 1F).
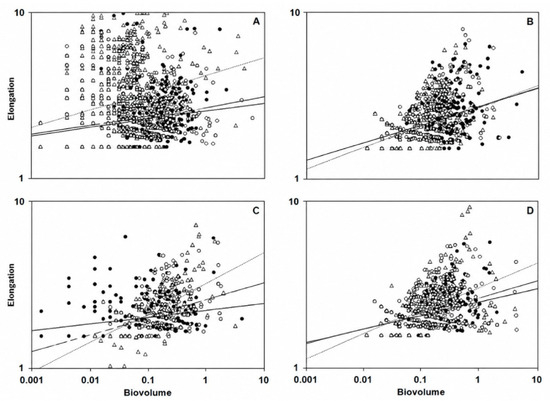
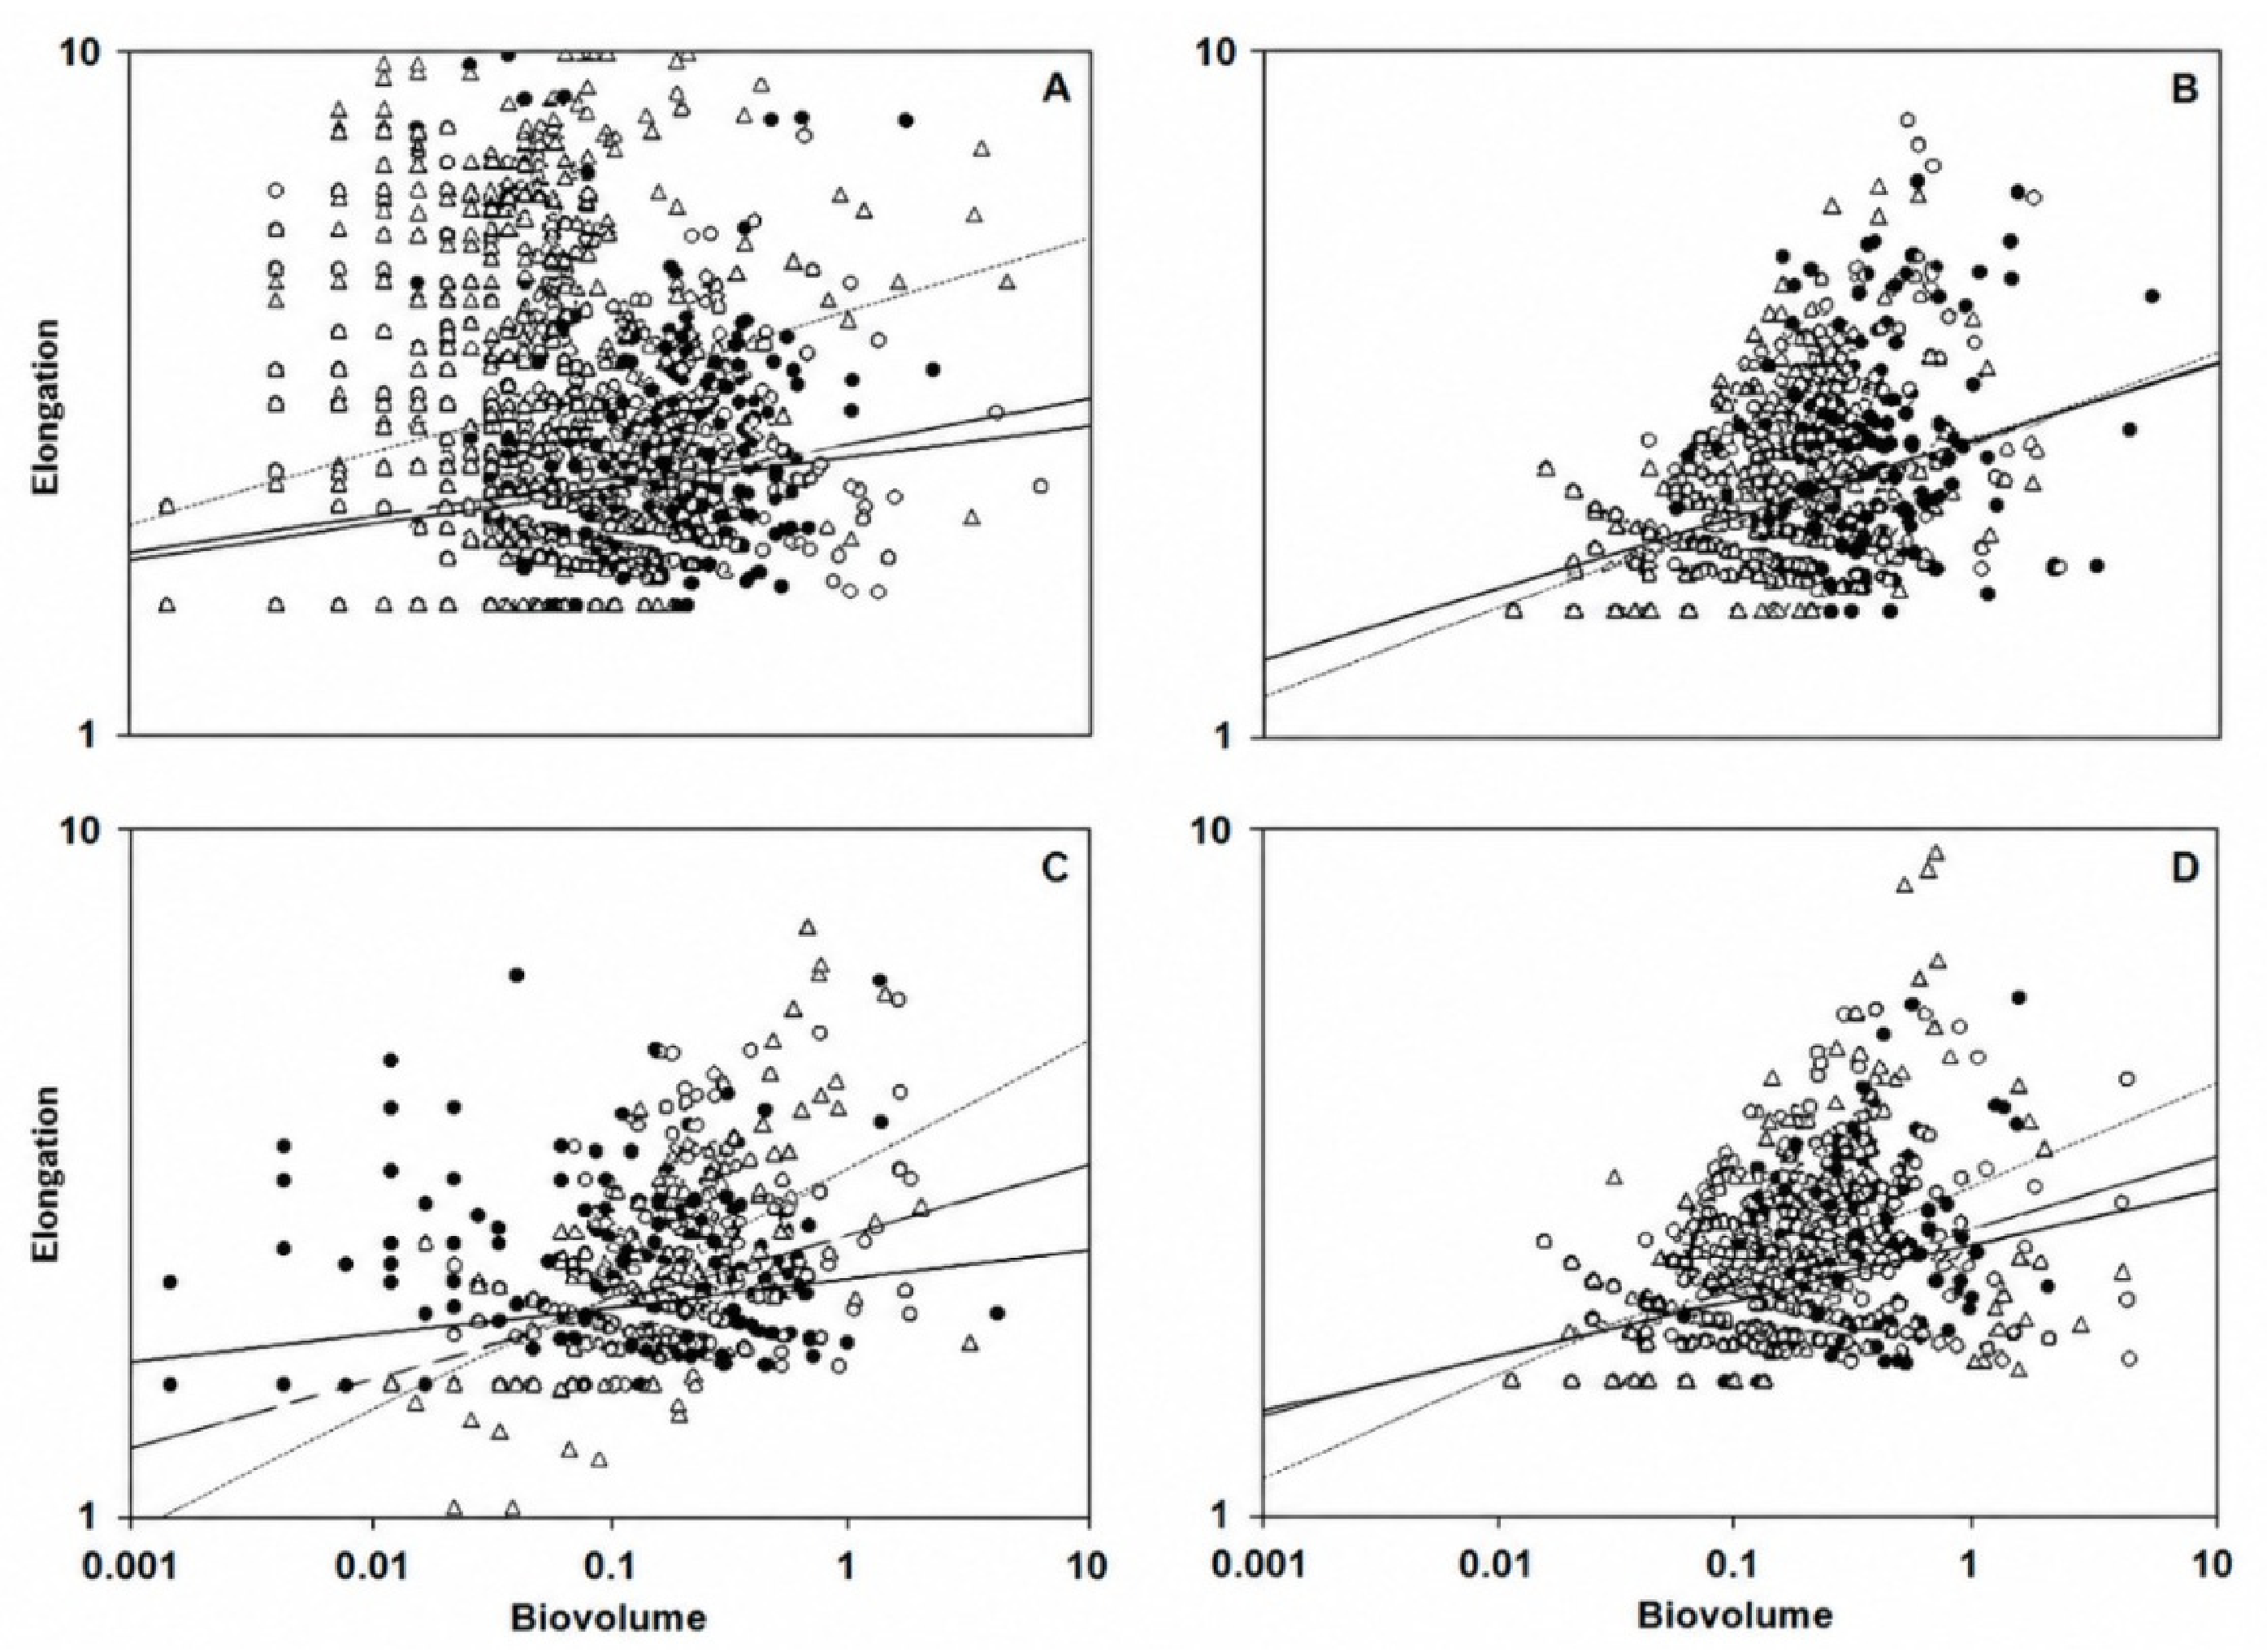
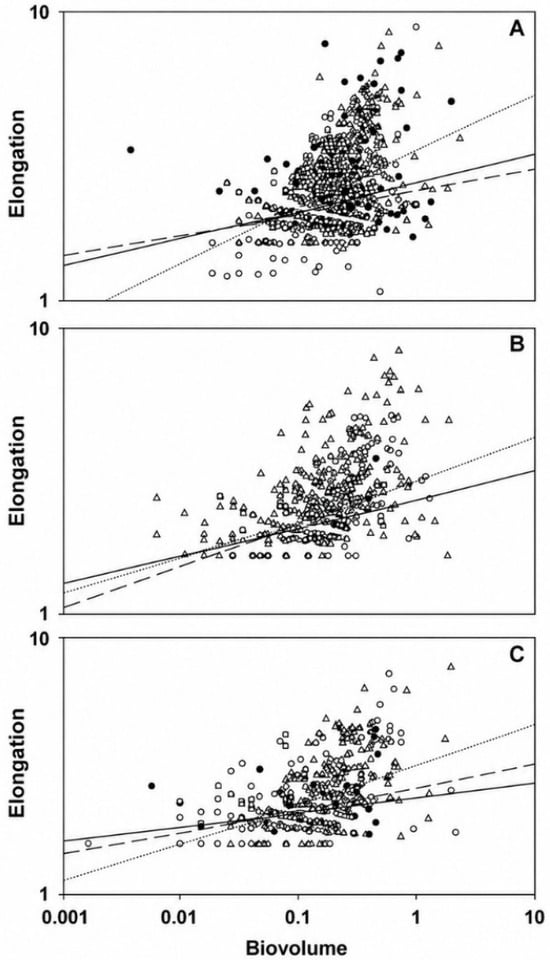
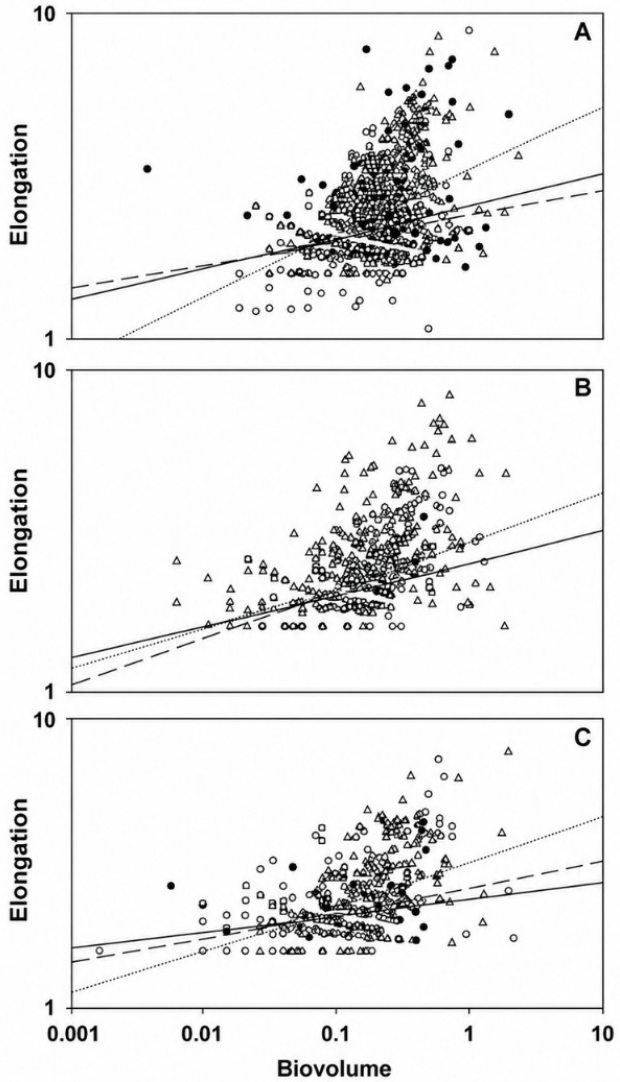
Bacterial cell elongation and volume varied significantly among periods in most reservoirs (Figure 3 and Figure 4). In Serra da Mesa, Itumbiara, Corumbá, and Furnas, elongation in the pre-rain and post-rain periods was similar but differed from the dry period. In Mascarenhas de Moraes and Luis Carlos Barreto, cell size remained similar across all periods. Cell volume ranged from 0.27 to 0.37 µm3 in the pre-rain period (Serra da Mesa and Itumbiara), 0.21 to 0.31 µm3 in the post-rain period (Itumbiara and Corumbá), and 0.20 to 0.30 µm3 in the dry period (Itumbiara and Mascarenhas de Moraes).
Figure 3.
Bacterial elongation and biovolume (logarithmic scale) found in the Serra da Mesa (A), Manso (B), Itumbiara (C) and Corumbá (D) reservoirs during the pre-rain (filled circles and solid line), post-rain (empty circles and dashed line) and dry (empty triangles and dotted line) periods.
Figure 4.
Bacterial elongation and biovolume (logarithmic scale) found in the Furnas (A), Mascarenhas de Moraes (B), and Luis Carlos Barreto (C) reservoirs during the pre-rain (filled circles and solid line), post-rain (empty circles and dashed line) and dry (empty triangles and dotted line) periods.
Corumbá exhibited the highest bacterial C stock per area, whereas the cascade reservoirs of the Grande River showed the lowest values (Table 2). The estimated total number of bacterial cells was significantly higher in Serra da Mesa than in the other reservoirs. Serra da Mesa also had the highest C stock, similar only to Itumbiara. Although both total cell number and C stock tended to be higher in the pre-rain period, differences among periods were not statistically significant (Table 3).
3.4. Relationships with Environmental Variables
Correlation analyses (Table 4) revealed negative relationships between bacterial density and water transparency in the three cascade reservoirs. In Furnas, density correlated positively with turbidity and dissolved organic carbon (DOC). In Luis Carlos Barreto, density correlated negatively with total phosphorus (TP). In Manso, density correlated negatively with phytoplankton biomass. In Itumbiara, density correlated negatively with zooplankton biomass and positively with nitrogen concentration. In Corumbá, density correlated positively with DOC and TP.
Table 4.
Correlations (r2) between bacterial density (BD) and biomass (BB) with phytoplankton biomass (BFITO) and zooplankton biomass (BZOO), water transparency (SECCHI), turbidity (TURB), dissolved organic carbon (DOC), total nitrogen (TN) and phosphorus (TP) in the studied reservoirs.
Bacterial biomass in Itumbiara was negatively correlated with zooplankton biomass. In Corumbá, biomass correlated positively with DOC and total phosphorus, similar to density. In Furnas, biomass correlated positively with turbidity, whereas in Luis Carlos Barreto it correlated negatively with water transparency (Table 4).
Across all sampling periods, bacterial density and biomass were negatively correlated with water transparency and positively correlated with turbidity (Table 5). In the pre-rain period, density correlated positively with DOC and total nitrogen. In the post-rain period, density correlated positively with phytoplankton biomass and negatively with total nitrogen. In the dry period, both density and biomass correlated negatively with total nitrogen and phosphorus.
Table 5.
Correlations (r2) between total bacterial density (BD) and total bacterial biomass (BB) with total phytoplankton biomass (BFITO), total zooplankton biomass (BZOO), water transparency (SECCHI), turbidity (TURB), dissolved organic carbon (DOC), total nitrogen (TN), and total phosphorus (TP) considering the data from all reservoirs together in the different analyzed periods.
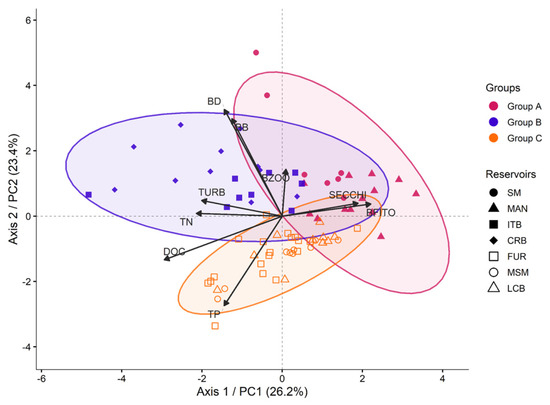
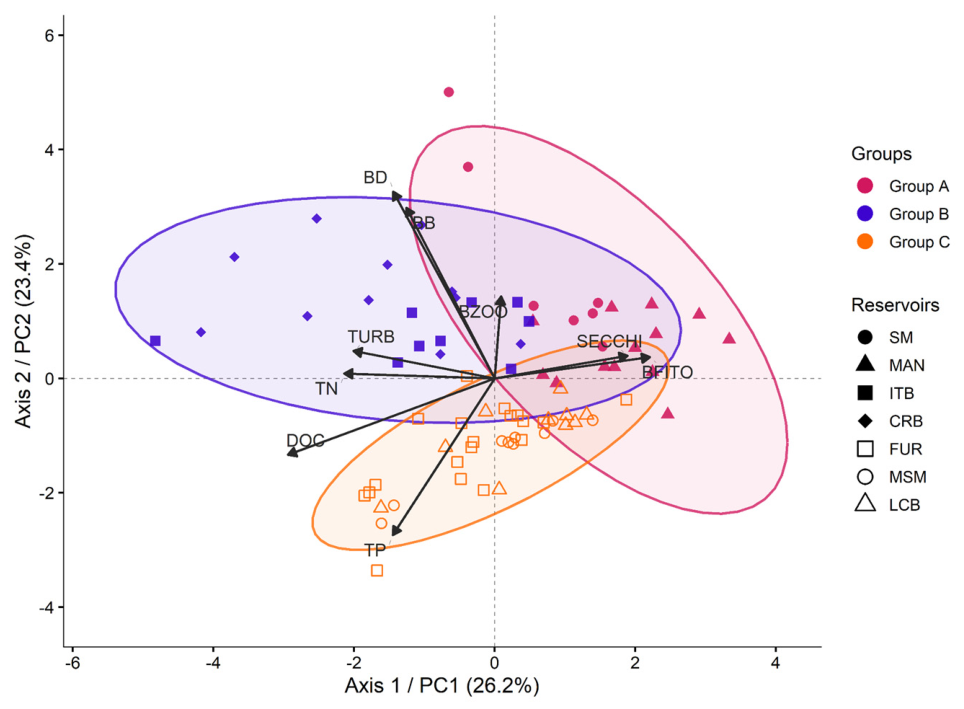
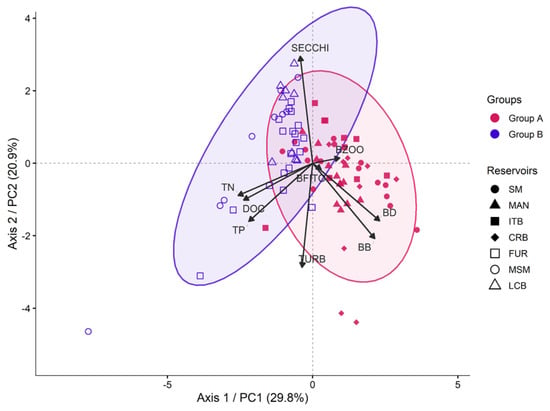
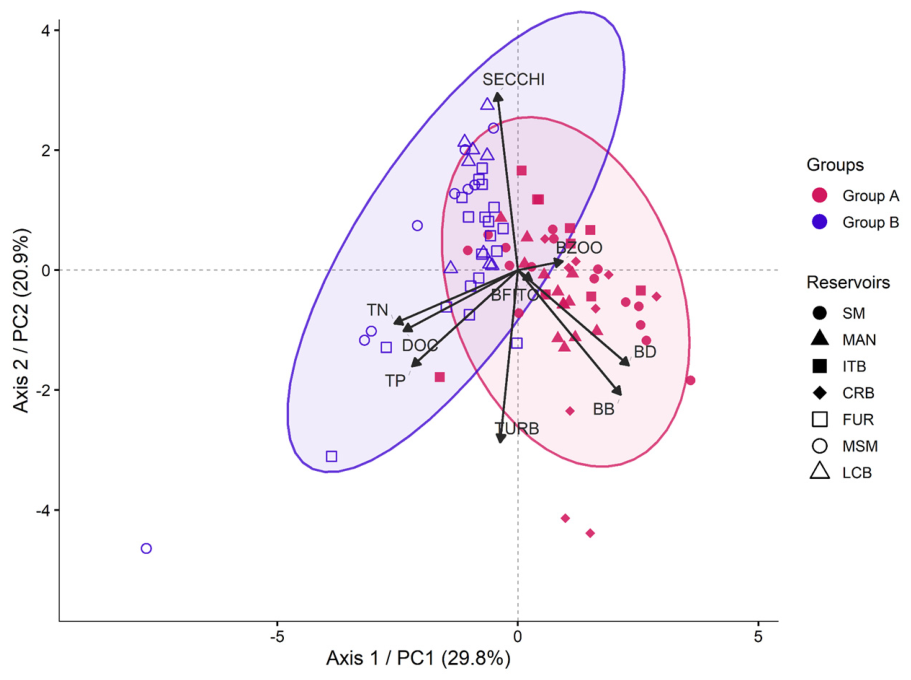
Principal component analysis (PCA) revealed distinct reservoir groupings across periods. In the pre-rain period, the first two axes explained ~50% of the variance. Axis 1 was associated with DOC (–0.53) and phytoplankton biomass (0.39), while axis 2 was associated with total phosphorus (–0.48), bacterial density (0.58), and biomass (0.53). Reservoirs grouped into: (a) Serra da Mesa and Manso; (b) Itumbiara and Corumbá; and (c) Furnas, Mascarenhas de Moraes, and Luis Carlos Barreto (Figure 5).
Figure 5.
Principal component analysis of biotic and abiotic variables with the two main axes and the distribution of reservoir points according to these variables in Serra da Mesa (SM), Manso (MAN), Itumbiara (ITB), Corumbá (CRB), Furnas (FUR), Mascarenhas de Moraes (MSM) and Luis Carlos Barreto (LCB) during the pre-rain period.
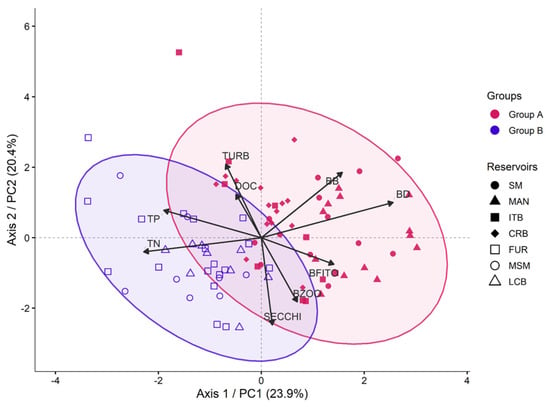
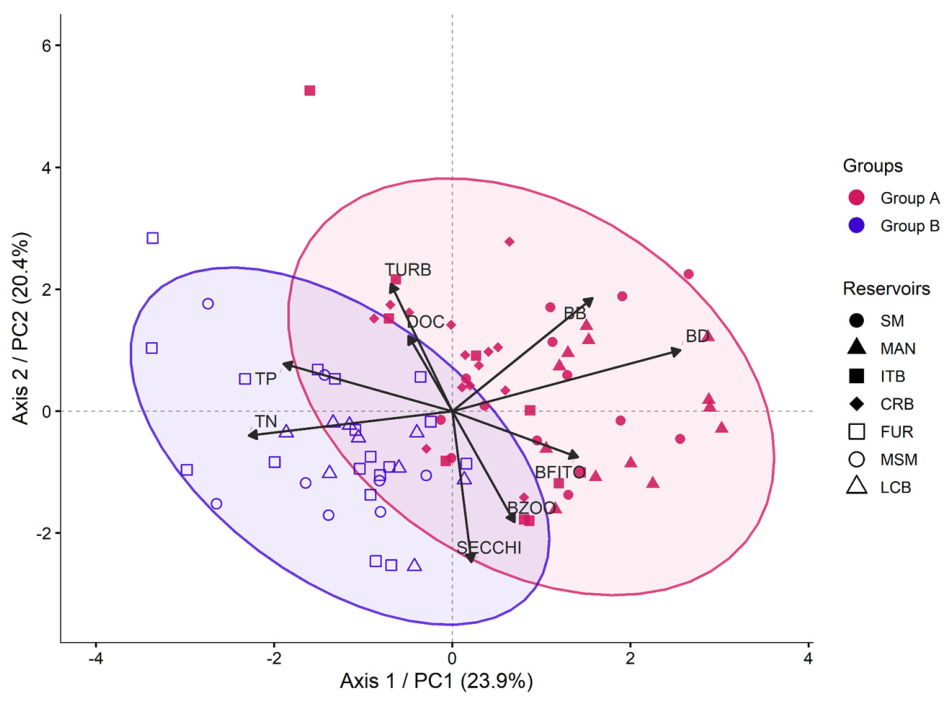
In the post-rain period, the first two axes explained 44% of the variance. Axis 1 was associated with bacterial density (0.56) and total nitrogen (–0.50), while axis 2 was associated with turbidity (0.45) and transparency (–0.54). Reservoirs formed two groups: (a) Serra da Mesa, Manso, Itumbiara, and Corumbá; and (b) the three cascade reservoirs (Figure 6).
Figure 6.
Principal component analysis of biotic and abiotic variables with the two main axes and the distribution of reservoir points according to these variables in Serra da Mesa (SM), Manso (MAN), Itumbiara (ITB), Corumbá (CRB), Furnas (FUR), Mascarenhas de Moraes (MSM) and Luis Carlos Barreto (LCB) during the post-rain period.
In the dry period, the first two axes explained 51% of the variance. Axis 1 was associated with total nitrogen (–0.48), DOC (–0.45), and bacterial density (0.43), while axis 2 was associated with turbidity (–0.54) and transparency (0.56). Groupings were similar to those observed in the post-rain period (Figure 7).
Figure 7.
Principal component analysis of biotic and abiotic variables with the two main axes and the distribution of reservoir points according to these variables in Serra da Mesa (SM), Manso (MAN), Itumbiara (ITB), Corumbá (CRB), Furnas (FUR), Mascarenhas de Moraes (MSM) and Luis Carlos Barreto (LCB) during the dry period.
4. Discussion
Bacterial density and biomass varied markedly among reservoirs and hydrological periods, reflecting the combined influence of local environmental conditions and regional hydrodynamics. Similar patterns have been reported for cascade systems, where reservoirs connected along the same river tend to exhibit comparable temporal responses [42]. In general, bacterial community structure is shaped by both top-down and bottom-up forces: predators exert top-down control by removing cells or selectively consuming specific morphotypes [43], whereas bottom-up control is driven by nutrient availability, organic matter quality, and stoichiometric constraints that regulate bacterial metabolism and growth [44,45].
Beyond these ecological mechanisms, the observed patterns in bacterial C stock may also intersect with broader environmental processes linked to public health. Increases in microbial biomass can influence the environmental dissemination of antimicrobial resistance [36], while carbon-mediated shifts in nutrient cycling may affect plant health [46], soil fertility, and food security [47]. Additionally, carbon turnover is sensitive to climate-driven stressors with implications for human health [37,38]. Although these connections extend beyond the scope of our dataset, they highlight that variations in bacterial C stock in tropical reservoirs may have indirect relevance for public-health-related environmental processes. Understanding these broader implications requires considering the ecological strategies that shape bacterial responses within these systems.
Bacteria employ several strategies to reduce predation pressure [48,49]. Simek et al. [50] and Pernthaler et al. [51] proposed two mechanisms: (i) rapid growth compensating for losses to grazers and (ii) morphological elongation, which reduces edibility. Filamentous bacteria can represent a substantial fraction of total biomass in natural systems, ranging from 11–83% [52,53]. In the present study, elongated cells were particularly frequent in Serra da Mesa, but this pattern should be interpreted cautiously, as morphological variation may reflect multiple ecological drivers, including predation pressure, nutrient limitation, and inputs of soil-derived bacteria transported by tributaries. Variation in cell size within the same environment cannot be attributed solely to trophic state [54,55]. Moreover, because only surface samples were analyzed, potential contributions from deeper layers or sediment-associated bacteria could not be assessed.
Serra da Mesa, the largest reservoir in the study, exhibited the highest bacterial density, biomass, and C stock. The absence of significant correlations between bacterial variables and environmental parameters in this reservoir may reflect its large spatial heterogeneity, which supports diverse ecological niches [56]. Similar patterns were observed by Lindström [57], who found no consistent relationships between bacterial biomass and environmental variables in Swedish lakes. In contrast, the remaining reservoirs showed significant correlations with environmental factors, consistent with findings from tropical ecosystems [58,59,60].
Interactions between bacteria and phytoplankton can involve competition for limiting nutrients, mutualistic exchanges, or differential resource limitation [61,62]. The negative correlation between bacterial density and phytoplankton biomass in Manso may reflect competition for nutrients, although indirect effects mediated by unmeasured variables cannot be excluded. In Itumbiara, negative correlations between bacterial variables and zooplankton biomass suggest potential top-down control. Zooplankton are key regulators of the microbial loop [63], and their grazing can influence the availability of C, N, and P in aquatic systems [64,65]. However, these correlations do not imply causation, and the strength of zooplankton–bacteria interactions may depend on the specific composition of zooplankton communities, which was not assessed in this study.
In Corumbá and Furnas, positive correlations between bacterial density and dissolved organic carbon (DOC) suggest that DOC availability may support bacterial growth, consistent with observations from Comerma et al. [22]. Although the origin of DOC was not determined, the patterns observed are compatible with recent DOC inputs contributing to bacterial production.
The grouping of the three cascade reservoirs (Furnas, Mascarenhas de Moraes, and Luis Carlos Barreto) across all periods highlights the strong longitudinal connectivity within the Grande River system [66]. These reservoirs are also the oldest in the dataset, which likely contributes to their more stable bacterial community structure due to reduced availability of labile organic matter [67]. According to the Continuous Reservoir Cascade Concept [68], biological communities in cascade systems reflect integrated changes along lateral, vertical, and longitudinal gradients.
Bacterial C stock varied substantially among reservoirs, demonstrating that bacterial contributions to total carbon pools are highly system-specific [69]. Reservoir size alone did not predict C stock. For example, Itumbiara—despite being the third largest—had the second highest number of bacterial cells, and Corumbá, although smaller than Mascarenhas de Moraes, exhibited higher density, biomass, and C stock. These patterns indicate that intrinsic environmental characteristics, rather than size alone, regulate bacterial abundance and carbon storage, consistent with ecological theory [70]. The younger age of Corumbá may explain its higher bacterial biomass relative to Mascarenhas de Moraes, as recently flooded reservoirs typically contain more labile organic matter [71]. The consistently high biomass in Corumbá suggests that its bacterial cells contain more carbon per cell, even when density is not elevated.
In Lake Tanganyika, Pirlot et al. [72] reported low bacterial carbon content despite high densities, attributed to nutrient limitation and the dominance of spiral-shaped bacteria with high surface-area-to-volume ratios. This highlights how morphological and physiological traits influence carbon storage at the cellular level.
Across all reservoirs and sampling periods, bacterial density and biomass were negatively correlated with water transparency and positively correlated with turbidity, suggesting that suspended particles may play an important role in structuring bacterial communities [73]. Suspended material can directly enhance bacterial growth by providing organic and inorganic substrates [74] or indirectly by reducing light penetration, thereby limiting phytoplankton and reducing competition for nutrients [75]. In highly turbid environments, bacterial biomass can exceed 50% of total microbial biomass [76], as phytoplankton growth becomes light-limited [77]. Attached bacteria, which were not quantified in this study, may also contribute substantially to carbon processing in particle-rich environments.
Nutrient uptake by bacteria varies with nutrient concentration, stoichiometry, and community composition [78,79,80]. In this study, correlations between bacterial biomass and total nitrogen shifted from positive (pre-rain) to negative (post-rain and dry), suggesting seasonal changes in nutrient limitation. Similar positive relationships between bacterial biomass and nitrogen have been reported by Carr et al. [81]. Bacterial density and biomass were positively correlated with total phosphorus in Corumbá but negatively correlated in Luis Carlos Barreto and during the dry period, indicating that phosphorus limitation varies spatially and seasonally.
As previously demonstrated for greenhouse gas fluxes in these same reservoirs [35], bacterial C stocks also exhibit substantial spatial heterogeneity. These results reinforce the importance of quantifying bacterial carbon when assessing carbon cycling in aquatic ecosystems. Even as estimates, these measurements provide essential insights into microbial contributions to carbon storage and transformation in tropical reservoirs. Future research should incorporate high-resolution molecular tools, such as 16S rRNA sequencing, to characterize taxonomic and functional diversity associated with carbon processing. Vertical sampling across thermal layers, including sediment–water interfaces, would also improve estimates of whole-reservoir C stocks. Integrating bacterial carbon dynamics with food-web structure, nutrient stoichiometry, and hydrodynamic modeling will be essential for understanding how tropical reservoirs respond to climate-driven changes in water level, temperature, and organic matter inputs.
5. Conclusions
This study demonstrates that bacterial C stock in tropical reservoirs varies markedly across spatial and hydrological gradients, reflecting the combined influence of reservoir morphology, hydrodynamics, and environmental conditions. The highest C stocks were observed in large and hydrologically dynamic systems, whereas older cascade reservoirs exhibited lower values, likely due to reduced availability of labile organic matter. Across all reservoirs, bacterial density and biomass were strongly associated with turbidity and negatively related to water transparency, highlighting the importance of suspended particles in structuring microbial communities. These findings provide a baseline for understanding microbial carbon pools in tropical hydroelectric reservoirs and underscore the need for future studies incorporating vertical profiles, molecular approaches, and long-term monitoring to better resolve the ecological mechanisms driving bacterial carbon storage in these ecosystems.
Author Contributions
Conceptualization, A.D., F.R. and D.E.C.; methodology, A.D. and D.E.C.; software, A.D., L.M.F., A.L.d.M., R.d.S.A., H.T.C. and D.E.C.; validation, A.D., F.R. and D.E.C.; formal analysis, A.D., L.M.F., A.L.d.M., R.d.S.A., H.T.C. and D.E.C.; data curation, A.D., L.M.F., A.L.d.M., R.d.S.A., H.T.C., F.R. and D.E.C.; writing—original draft preparation, A.D., L.M.F., A.L.d.M., R.d.S.A., H.T.C., F.R. and D.E.C.; project administration, F.R. and D.E.C.; funding acquisition, F.R. All authors have read and agreed to the published version of the manuscript.
Funding
This research was funded and logistically supported by FURNAS Centrais Elétricas S.A., Brazil (“Projeto Balanço de Carbono nos Reservatórios de FURNAS”—Process number 14.566/2003-UFJF).
Data Availability Statement
The raw data supporting the conclusions of this article will be made available by the authors on request.
Acknowledgments
We would like to thank Paulo César Abreu (in memoriam) for their collaboration in discussing this article and Camila Portela da Silva for her valuable assistance in processing the data.
Conflicts of Interest
The authors declare no conflicts of interest.
References
- Braun, A.; Spona-Friedl, M.; Avramov, M.; Elsner, M.; Baltar, F.; Reinthaler, T.; Herndl, G.J.; Griebler, C. Reviews and synthesis: Heterotrophic fixation of inorganic carbon—Significant but invisible flux in environmental carbon cycling. Biogeosciences 2021, 18, 3689–3700. [Google Scholar]
- Gralka, M.; Szabo, R.; Stocker, R.; Cordero, O.X. Trophic interactions and the drivers of microbial community assembly. Curr. Biol. 2020, 30, R1176–R1188. [Google Scholar] [CrossRef] [Scilit] [PubMed]
- Ferrer-González, F.X.; Widner, B.; Holderman, N.R.; Glushka, J.; Edison, A.S.; Kujawinski, E.B.; Moran, M.A. Resource partitioning of phytoplankton metabolites that support bacterial heterotrophy. ISME J. 2021, 15, 762–773. [Google Scholar] [PubMed]
- Cotner, J.B.; Biddanda, B.A. Small players, large role: Microbial influence on biogeochemical processes in pelagic aquatic ecosystems. Ecosystems 2002, 5, 105–121. [Google Scholar] [CrossRef] [Scilit]
- Whitman, W.B.; Coleman, D.C.; Wiebe, W.J. Prokaryotes: The unseen majority. Proc. Natl. Acad. Sci. USA 1998, 95, 6578–6583. [Google Scholar] [CrossRef] [Scilit] [PubMed]
- Wheeler, J.D.; Secchi, E.; Rusconi, R.; Stocker, R. Not just going with the flow: The effects of fluid flow on bacteria and plankton. Annu. Rev. Cell Dev. Biol. 2019, 35, 213–237. [Google Scholar] [CrossRef] [Scilit] [PubMed]
- Hahn, M.W.; Höfle, M.G. Flagellate predation on a bacterial model community: Interplay of size-selective grazing, specific bacterial cell size, and bacterial community composition. Appl. Environ. Microbiol. 1999, 65, 4863–4872. [Google Scholar] [CrossRef] [Scilit] [PubMed]
- Langenheder, S.; Jürgens, K. Regulation of bacterial biomass and community structure by metazoan and protozoan predation. Limnol. Oceanogr. 2001, 46, 121–134. [Google Scholar] [CrossRef] [Scilit]
- Goh, Y.; Røder, H.; Chan, S.; Ismail, M.; Madsen, J.; Lee, K.; Sørensen, S.; Givskov, M.; Burmølle, M.; Rice, S.; et al. Associational resistance to predation by protists in a mixed species biofilm. Appl. Environ. Microbiol. 2023, 89, e0174122. [Google Scholar] [CrossRef] [Scilit] [PubMed]
- Nakano, S.; Kawabata, Z. Changes in cell volume of bacteria and heterotrophic nanoflagellates in a hypereutrophic pond. Hydrobiologia 2000, 428, 197–203. [Google Scholar] [CrossRef] [Scilit]
- Elser, J.J.; Dobberfuhl, D.R.; Mackay, N.A.; Schampel, J.H. Organism size, life history, and N:P stoichiometry: Toward a unified view of cellular and ecosystem processes. BioScience 1996, 46, 674–684. [Google Scholar]
- Elser, J.J.; Fagan, W.F.; Denno, R.F.; Dobberfuhl, D.R.; Folarin, A.; Huberty, A.; Interlandi, S.; Kilham, S.S.; McCauley, E.; Schulz, K.L.; et al. Nutritional constraints in terrestrial and freshwater food webs. Nature 2000, 408, 578–580. [Google Scholar] [CrossRef] [Scilit] [PubMed]
- Elser, J.J.; Devlin, S.P.; Yu, J.; Baumann, A.; Church, M.J.; Dore, J.E.; Hall, R.O., Jr.; Hollar, M.; Johnson, T.; Vick-Majors, T.; et al. Sustained stoichiometric imbalance and its ecological consequences in a large oligotrophic lake. Proc. Natl. Acad. Sci. USA 2022, 119, e220030. [Google Scholar] [CrossRef] [Scilit]
- Meyer, J.L. The microbial loop in flowing waters. Microb. Ecol. 1994, 28, 195–199. [Google Scholar] [CrossRef] [Scilit] [PubMed]
- Pesce, S.; Fajon, C.; Bardot, C.; Bonnemoy, F.; Portelli, C.; Bohatier, J. Effects of the phenylurea herbicide diuron on natural riverine microbial communities in an experimental study. Aquat. Toxicol. 2006, 78, 303–314. [Google Scholar] [CrossRef] [Scilit] [PubMed]
- Chevallereau, A.; Pons, B.J.; van Houte, S.; Westra, E.R. Interactions between bacterial and phage communities in natural environments. Nat. Rev. Microbiol. 2022, 20, 49–62. [Google Scholar] [PubMed]
- Gasol, J.M.; Comerma, M.; García, J.C.; Armengol, J.; Casamayor, E.O.; Kojecká, P.; Simek, K. A transplant experiment to identify the factors controlling bacterial abundance, activity, production, and community composition in a eutrophic canyon-shaped reservoir. Limnol. Oceanogr. 2002, 47, 62–77. [Google Scholar] [CrossRef] [Scilit]
- Cotner, J.B.; Hall, E.; Scott, J.; Heldal, M. Freshwater bacteria are stoichiometrically flexible with a nutrient composition similar to seston. Front. Microbiol. 2010, 1, 132. [Google Scholar] [CrossRef] [Scilit] [PubMed]
- Lønborg, C.; Baltar, F.; Calleja, M.L.; Morán, X.A.G. Heterotrophic bacteria respond differently to increasing temperature and dissolved organic carbon sources in two tropical coastal systems. J. Geophys. Res. Biogeosci. 2022, 127, e2022JG006890. [Google Scholar] [CrossRef] [Scilit]
- Zhang, T.; Xu, S.; Yan, R.; Wang, R.; Gao, Y.; Kong, M.; Yi, Q.; Zhang, Y. Similar geographic patterns but distinct assembly processes of abundant and rare bacterioplankton communities in river networks of the Taihu Basin. Water Res. 2022, 211, 118057. [Google Scholar] [CrossRef] [Scilit] [PubMed]
- Mondav, R.; Bertilsson, S.; Buck, M.; Langenheder, S.; Lindström, E.S.; Garcia, S.L. Streamlined and abundant bacterioplankton thrive in functional cohorts. mSystems 2020, 5, e00316-20. [Google Scholar] [CrossRef] [Scilit] [PubMed]
- Comerma, M.; García, J.C.; Romero, M.; Armengol, J.; Simek, K. Carbon flow dynamics in the pelagic community of the Sau reservoir (Catalonia, NE Spain). Hydrobiologia 2003, 504, 87–98. [Google Scholar] [CrossRef] [Scilit]
- Minor, E.C.; Oyler, A.R. Dissolved organic matter in large lakes: A key but understudied component of the carbon cycle. Biogeochemistry 2023, 164, 295–318. [Google Scholar]
- Kirchman, D.L.; Rich, J.H. Regulation of bacterial growth rates by dissolved organic carbon and temperature in the equatorial Pacific Ocean. Microb. Ecol. 1997, 33, 11–20. [Google Scholar] [CrossRef] [Scilit] [PubMed]
- Pomeroy, L.R.; Wiebe, W.J. Temperature and substrate as interactive limiting factors for marine heterotrophic bacteria. Aquat. Microb. Ecol. 2001, 23, 187–204. [Google Scholar] [CrossRef] [Scilit]
- Amado, A.M.; Meirelles-Pereira, F.; Vidal, L.O.; Sarmento, H.; Suhett, A.L.; Farjalla, V.F.; Cotner, J.B.; Roland, F. Tropical freshwater ecosystems have lower bacterial growth efficiency than temperate ones. Front. Microbiol. 2013, 4, 167. [Google Scholar] [CrossRef] [Scilit] [PubMed]
- Peduzzi, P.; Schiemer, F. Bacteria and viruses in the water column of a tropical freshwater reservoir. Environ. Microbiol. 2004, 6, 707–715. [Google Scholar] [CrossRef] [Scilit] [PubMed]
- Giani, A.; Taranu, Z.E.; von Rückert, G.; Gregory-Eaves, I. Comparing key drivers of cyanobacteria biomass in temperate and tropical systems. Harmful Algae 2020, 97, 101859. [Google Scholar] [CrossRef] [Scilit] [PubMed]
- Gruca-Rokosz, R. Quantitative fluxes of the greenhouse gases CH4 and CO2 from the surfaces of selected Polish reservoirs. Atmosphere 2020, 11, 286. [Google Scholar] [CrossRef] [Scilit]
- Torloni, C.E. Management of fishing resources in CESPS reservoirs. Acta Limnol. Bras. 1994, 5, 177–186. [Google Scholar]
- Mizael, J.D.O.S.S.; Cardoso-Silva, S.; Frascareli, D.; Pompêo, M.L.M.; Moschini-Carlos, V. Ecosystem history of a tropical reservoir revealed by metals, nutrients, and photosynthetic pigments preserved in sediments. Catena 2020, 184, 104242. [Google Scholar] [CrossRef] [Scilit]
- Atique, U.; An, K.G. Landscape heterogeneity impacts water chemistry, nutrient regime, organic matter and chlorophyll dynamics in agricultural reservoirs. Ecol. Indic. 2020, 110, 105813. [Google Scholar] [CrossRef] [Scilit]
- Hart, A.J. A Critical Analysis of Sustainable Resettlement in the Context of International Development and Hydropower. Ph.D. Thesis, University of Johannesburg, Johannesburg, South Africa, 2021. [Google Scholar]
- Singh, M.R.; Singh, K.T. Environmental and socio-economic impacts of hydropower project: A case study of the Loktak Hydroelectric Project in Manipur. EPRA Int. J. Socio-Econ. Environ. Outlook 2023, 10, 1–6. [Google Scholar] [CrossRef] [Scilit]
- Roland, F.; Vidal, L.; Pacheco, F.; Barros, N.; Assireu, A.; Ometto, J.; Cimbleris, A.; Cole, J. Variability of carbon dioxide flux from tropical (Cerrado) hydroelectric reservoirs. Aquat. Sci. 2010, 72, 238–293. [Google Scholar] [CrossRef] [Scilit]
- Xu, Q.; Zhang, H.; Vandenkoornhuyse, P.; Guo, S.; Kuzyakov, Y.; Shen, Q.; Ling, N. Carbon starvation raises capacities in bacterial antibiotic resistance and viral auxiliary carbon metabolism in soils. Proc. Natl. Acad. Sci. USA 2024, 121, e2318160121. [Google Scholar] [CrossRef] [Scilit] [PubMed]
- Liang, Y.; Hu, H.; Crowther, T.; Jörgensen, R.; Liang, C.; Chen, J.; Sun, Y.; Liu, C.; Ding, J.; Huang, A.; et al. Global decline in microbial-derived carbon stocks with climate warming and its future projections. Natl. Sci. Rev. 2024, 11, nwae330. [Google Scholar] [CrossRef] [Scilit] [PubMed]
- Yu, H. Climate change unveils hidden microbial dangers. Environ. Sci. Ecotechnol. 2025, 24, 100544. [Google Scholar] [CrossRef] [Scilit] [PubMed]
- Hobbie, J.E.; Daley, R.J.; Jasper, S. Use of Nuclepore filters for counting bacteria by fluorescence microscopy. Appl. Environ. Microbiol. 1977, 33, 1225–1228. [Google Scholar] [CrossRef] [Scilit] [PubMed]
- Massana, R.; Gasol, J.M.; Bjørnsen, P.K.; Blackburn, N.; Hagström, Å.; Hietanen, S.; Hygum, B.H.; Kuparinen, J.; Pedrós-Alió, C. Measurement of bacterial size via image analyses of epifluorescence preparations. Sci. Mar. 1997, 61, 397–407. [Google Scholar]
- Norland, S. The relationship between biomass and volume of bacteria. In Handbook of Methods in Aquatic Microbial Ecology; Kemp, P.F., Sherr, B.F., Sherr, E.B., Cole, J.J., Eds.; Lewis Publishers: Boca Raton, FL, USA, 1993; pp. 303–307. [Google Scholar]
- Yue, Y.; Wang, F.; Fu, Z.; Tang, Y.; Ma, J.; Qin, Y.; Li, M.; Yang, M.; Chen, X.-P. Differential response of microbial diversity and abundance to hydrological residual time and age in cascade reservoirs. J. Soils Sediments 2021, 21, 1290–1301. [Google Scholar]
- Fu, X.; Song, Q.; Li, S.; Shen, Y.; Yue, S. Dynamic changes in bacterial community structure are associated with distinct priming effect patterns. Soil Biol. Biochem. 2022, 169, 108671. [Google Scholar] [CrossRef] [Scilit]
- Lee, Z.M.P.; Poret-Peterson, A.T.; Siefert, J.L.; Kaul, D.; Moustafa, A.; Allen, A.E.; Allen, A.E.; Dupont, C.L.; Eguiarte, L.E.; Souza, V.; et al. Nutrient stoichiometry shapes microbial community structure in an evaporitic shallow pond. Front. Microbiol. 2017, 8, 949. [Google Scholar] [CrossRef] [Scilit] [PubMed]
- Luo, X.; Xiang, X.; Huang, G.; Song, X.; Wang, P.; Yang, Y.; Fu, K.; Che, R. Bacterial community structure upstream and downstream of cascade dams along the Lancang River. Environ. Sci. Pollut. Res. 2020, 27, 42933–42947. [Google Scholar] [CrossRef] [Scilit]
- Petersen, S. Role of Novel Microorganisms for Maintaining Soil Carbon Pool and Plant Health. In Sustainable Plant Nutrition and Soil Carbon Sequestration; Edrisi, S.A., Dubey, P.K., Rao, C.S., Baral, H., Chaturvedi, R.K., Abhilash, P.C., Eds.; Springer: Cham, Switzerland, 2024. [Google Scholar]
- Huber, S.; Rosinger, C.; Bodner, G.; Bernadini, L.; Bieber, M.; Mentler, A.; Sae-Tun, O.; Schaf, B.; Keiblinger, K. Highway to health: Microbial pathways of soil organic carbon accrual in conservation farming systems. Geoderma 2024, 452, 117115. [Google Scholar] [CrossRef] [Scilit]
- Seiler, C.; van Velzen, E.; Neu, T.R.; Gaedke, U.; Berendonk, T.U.; Weitere, M. Grazing resistance of bacterial biofilms: A matter of predators’ feeding trait. FEMS Microbiol. Ecol. 2017, 93, fix112. [Google Scholar] [CrossRef] [Scilit]
- Wang, C.; Liu, X.; Zhang, P.; Wang, Y.; Li, Z.; Li, X.; Wang, R.; Shang, Z.; Yan, J.; He, H.; et al. Bacillus licheniformis escapes from Myxococcus xanthus predation by deactivating myxovirescin A. Environ. Microbiol. 2019, 21, 4755–4772. [Google Scholar] [CrossRef] [Scilit] [PubMed]
- Simek, K.; Vrba, J.; Pernthaler, J.; Posch, T.; Hartman, P.; Nedoma, J.; Psenner, R. Morphological and compositional shifts in an experimental bacterial community influenced by protists. Appl. Environ. Microbiol. 1997, 63, 587–595. [Google Scholar] [CrossRef] [Scilit] [PubMed]
- Pernthaler, J.; Posch, T.; Simek, K.; Vrba, J.; Amann, R.; Psenner, R. Contrasting bacterial strategies to coexist with a flagellate predator. Appl. Environ. Microbiol. 1997, 63, 596–601. [Google Scholar] [CrossRef] [Scilit] [PubMed]
- Jürgens, K.; Stolpe, G. Seasonal dynamics of crustacean zooplankton, heterotrophic nanoflagellates, and bacteria in a shallow eutrophic lake. Freshw. Biol. 1995, 33, 27–38. [Google Scholar] [CrossRef] [Scilit]
- Sommaruga, R.; Psenner, R. Permanent presence of grazing-resistant bacteria in a hypereutrophic lake. Appl. Environ. Microbiol. 1995, 61, 3457–3459. [Google Scholar] [CrossRef] [Scilit] [PubMed]
- Vrede, K.; Heldal, M.; Norland, S.; Bratbak, G. Elemental composition (C, N, P) and cell volume of exponentially growing and nutrient-limited bacterioplankton. Appl. Environ. Microbiol. 2002, 68, 2965–2971. [Google Scholar] [CrossRef] [Scilit] [PubMed]
- Gallet, R.; Violle, C.; Fromin, N.; Jabbour-Zahab, R.; Enquist, B.J.; Lenormand, T. The evolution of bacterial cell size: The internal diffusion-constraint hypothesis. ISME J. 2017, 11, 1559–1568. [Google Scholar] [CrossRef] [Scilit] [PubMed]
- Heino, J.; Soininen, J. Regional occupancy in unicellular eukaryotes: A reflection of niche breadth, habitat availability, or size-related dispersal capacity? Freshw. Biol. 2006, 51, 672–685. [Google Scholar] [CrossRef] [Scilit]
- Lindström, E.S. Investigation of influential factors on bacterioplankton community composition: Results from a field study of five mesotrophic lakes. Microb. Ecol. 2001, 42, 598–605. [Google Scholar] [CrossRef] [Scilit] [PubMed]
- Rahman, M.M.; Hamidah, H. Water quality influence the phytoplankton and bacteria abundance: A comparison between shallow freshwater and saltwater ponds. Desalin. Water Treat. 2020, 188, 436–443. [Google Scholar] [CrossRef] [Scilit]
- de Moura, C.G.B.; Rocha, E.; de Attayde, J.L.; Noyma, N.; de Oliveira Vidal, L.; Fonseca, L.M.; Roland, F.; Amado, A.M. Fresh terrestrial detritus fuels both heterotrophic and autotrophic activities in a tropical reservoir. Hydrobiologia 2022, 849, 3931–3946. [Google Scholar]
- da Rosa, L.M.; de Souza Cardoso, L.; Silveira, M.H.; Crossetti, L.O.; Canterle, E.R.B.; Cavalcanti, J.R.; Roland, F.; Amado, A.M. Daily responses of the planktonic food web to environmental dynamics in a vegetated littoral zone. Limnologica 2023, 102, 126096. [Google Scholar] [CrossRef] [Scilit]
- Danger, M.; Oumarou, C.; Benest, D.; Lacroix, G. Bacteria can control stoichiometry and nutrient limitation of phytoplankton. Funct. Ecol. 2007, 21, 202–210. [Google Scholar]
- Scott, J.T.; Back, J.A.; Taylor, J.M.; King, R.S. Does nutrient enrichment decouple algal–bacterial production in periphyton? J. N. Am. Benthol. Soc. 2008, 27, 332–344. [Google Scholar] [CrossRef] [Scilit]
- Glibert, P.M.; Mitra, A. From webs, loops, shunts, and pumps to microbial multitasking. Limnol. Oceanogr. 2022, 67, 585–597. [Google Scholar] [CrossRef] [Scilit]
- Schenone, L.; Modenutti, B.; Martyniuk, N.; Bastidas Navarro, M.; Laspoumaderes, C.; Balseiro, E. Modelling key variables for understanding the effects of grazing and nutrient recycling by zooplankton. Freshw. Biol. 2021, 66, 2322–2337. [Google Scholar] [CrossRef] [Scilit]
- Wan, L.; Cao, L.; Song, C.; Cao, X.; Zhou, Y. Regulation of the nutrient cycle pathway and the microbial loop structure by different types of dissolved organic matter. Environ. Sci. Technol. 2022, 57, 297–309. [Google Scholar] [CrossRef] [Scilit] [PubMed]
- Jorcin, A.; Nogueira, M.G. Temporal and spatial patterns based on sediment and sediment–water interface characteristics along a cascade of reservoirs (Paranapanema River, Southeast Brazil). Lakes Reserv. Res. Manag. 2005, 10, 1–12. [Google Scholar] [CrossRef] [Scilit]
- Mari, X.; Rochelle-Newall, E.; Torréton, J.P.; Pringault, O.; Jouon, A.; Migon, C. Water residence time: A regulatory factor of the DOM to POM transfer efficiency. Limnol. Oceanogr. 2007, 52, 808–819. [Google Scholar] [CrossRef] [Scilit]
- Barbosa, F.A.R.; Padisák, J.; Espíndola, E.L.G.; Borics, G.; Rocha, O. The Cascading Reservoir Continuum Concept (CRCC) and Its Application to the River Tietê-Basin, São Paulo, State, Brazil. In Theoretical Reservoir Ecology and Its Applications; Tundisi, J.G., Straskraba, M., Eds.; Backhuys Publishers: Leiden, The Netherlands, 1999; pp. 425–437. [Google Scholar]
- Sutfin, N.A.; Wohl, E.E.; Dwire, K.A. Banking carbon: A review of organic carbon storage and physical factors influencing retention in floodplains and riparian ecosystems. Earth Surf. Process. Landf. 2016, 41, 38–60. [Google Scholar]
- Yodzis, P.; Innes, S. Body size and consumer–resource dynamics. Am. Nat. 1992, 139, 1151–1175. [Google Scholar] [CrossRef] [Scilit]
- Wang, J.; Fan, H.; He, X.; Zhang, F.; Xiao, J.; Yan, Z.; Feng, J.; Li, R. Response of bacterial communities to variation in water quality and physicochemical conditions in a river–reservoir system. Glob. Ecol. Conserv. 2021, 27, e01541. [Google Scholar] [CrossRef] [Scilit]
- Pirlot, S.; Vanderheyden, J.; Descy, J.; Servais, P. Abundance and biomass of heterotrophic microorganisms in Lake Tanganyika. Freshw. Biol. 2005, 50, 1219–1232. [Google Scholar] [CrossRef] [Scilit]
- Azhdarpoor, A.; Salehi, N.; Heidari, H.; Sarmadipour, M.; Mahmoudian, H. Relationship between turbidity and microbial load of water in Salman Farsi Dam Reservoir. J. Environ. Pollut. Manag. 2019, 2, 201. [Google Scholar]
- Turner, A.; Millward, G.E.; Tyler, A.O. The distribution and chemical composition of particles in a macrotidal estuary. Estuar. Coast. Shelf Sci. 1994, 38, 1–17. [Google Scholar] [CrossRef] [Scilit]
- Ewins, C.H. Turbidity and Nutrients Drive Species-Specific Responses of Freshwater Plankton in Mesocosms. Ph.D. Thesis, Queen’s University, Kingston, ON, Canada, 2023. [Google Scholar]
- Goosen, N.K.; Kromkamp, J.; Peene, J.; van Rijswijk, P.; van Breugel, P. Bacterial and phytoplankton production in the maximum turbidity zone of three European estuaries: The Elbe, Westerschelde, and Gironde. J. Mar. Syst. 1999, 22, 151–171. [Google Scholar] [CrossRef] [Scilit]
- Faithful, J.W.; Griffiths, D.J. Turbid flow in a tropical reservoir (Lake Dalrymple, Queensland, Australia): Responses to a summer storm event. Lakes Reserv. Res. Manag. 2000, 5, 231–247. [Google Scholar] [CrossRef] [Scilit]
- Zhang, Y.; Ji, Z.; Pei, Y. Nutrient removal and microbial community structure in an artificial–natural coupled wetland system. Process Saf. Environ. Prot. 2021, 147, 1160–1170. [Google Scholar] [CrossRef] [Scilit]
- Yadav, A.N.; Yadav, N.; Kour, D.; Kumar, A.; Yadav, K.; Kumar, A.; Rastegari, A.; Sachan, S.; Singh, B.; Chauhan, V.; et al. Bacterial community composition in lakes. In Freshwater Microbiology; Academic Press: London, UK, 2019; pp. 1–71. [Google Scholar]
- Orland, C.; Yakimovich, K.M.; Mykytczuk, N.C.; Basiliko, N.; Tanentzap, A.J. Think global, act local: The small-scale environment mainly influences microbial community development and function in lake sediment. Limnol. Oceanogr. 2020, 65, S88–S100. [Google Scholar]
- Carr, G.M.; Morin, A.; Chambers, P.A. Bacteria and algae in stream periphyton along a nutrient gradient. Freshw. Biol. 2005, 50, 1337–1350. [Google Scholar] [CrossRef] [Scilit]

Disclaimer/Publisher’s Note: The statements, opinions and data contained in all publications are solely those of the individual author(s) and contributor(s) and not of MDPI and/or the editor(s). MDPI and/or the editor(s) disclaim responsibility for any injury to people or property resulting from any ideas, methods, instructions or products referred to in the content. |
© 2026 by the authors. Licensee MDPI, Basel, Switzerland. This article is an open access article distributed under the terms and conditions of the Creative Commons Attribution (CC BY) license.