Article

Studies of Volatile Organic Compounds Emission from Bottom Sediments of Mid–Forest Eutrophic Lake with the Use of Proton Transfer Reaction Mass Spectrometry

by
Józef Antonowicz
1,* and
Tomasz Wróblewski
2,*
1
Department of Environmental Chemistry and Toxicology, Pomeranian University in Słupsk, Arciszewskiego St. 22b, 76-200 Słupsk, Poland
2
Department of Physics, Pomeranian University in Słupsk, Arciszewskiego St. 22b, 76-200 Słupsk, Poland
*
Authors to whom correspondence should be addressed.
Limnol. Rev. 2025, 25(4), 49; https://doi.org/10.3390/limnolrev25040049 (registering DOI)
Submission received: 8 September 2025 / Revised: 7 October 2025 / Accepted: 10 October 2025 / Published: 14 October 2025
(This article belongs to the Special Issue Trends in the Trophic State of Freshwater Ecosystems)

Abstract

In 2023, studies were conducted on volatile organic compounds (VOCs) emitted from the bottom sediments of the mid-forest eutrophic lake. Lake Łętowskie is located in northern Poland and covers an area of 402 hectares. It is part of the “Łętowskie Lake and the vicinity of Kępice” Protected Landscape Area. Bottom sediment samples were collected from five sites located on the lake. The study sites differed in shoreline development: forest, agricultural land, and the central part of the lake. The emissions from the bottom sediment to the atmosphere of 20 volatile organic compounds were measured in the samples using a proton transfer reaction mass spectrometer (PTR-MS). This analytical technique enables the detection and determination of concentrations of volatile organic compounds characterized by proton affinity greater than that of water. The VOC data obtained showed different characteristics for study sites bordering forests and agricultural areas, which was supported by statistical analysis. The VOC data obtained from Lake Łętowskie were compared with results from neighboring lakes, demonstrating similarities to those observed in a lake with a forest catchment area.

1. Introduction

In the aquatic environment, lakes’s VOCs (volatile organic compounds) largely come from bottom sediments [1]. VOC compounds in bottom sediments are supplied by organic matter derived from the decay of fauna and flora [2]. Bottom sediments provide a place for the deposition of matter at the lake bottom resulting from soil erosion, rock erosion in the catchment area, deposition of dead plant and animal remains, as well as precipitation of insoluble organic and inorganic salts from the lake water solution [3]. Bottom sediments are a source of information about the entire lake ecosystem. This is a site for the deposition of matter, biochemical changes, as well as a deposit that can be released into the future [3,4]. Bottom sediments are biologically active, characterized by the release of common odors, which include VOCs. Research on VOC content in the aquatic environment may be important for environmental monitoring. It should be noted that some compounds present in bottom sediments, such as sulfur derivatives or aromatic hydrocarbons lake phenol, may be toxic to aquatic organisms. Due to their penetration into drinking water sources, they may also pose a threat to humans.
The PTR-MS apparatus is characterized by very high sensitivity in detecting VOCs while simultaneously measuring the concentration of a wide range of positively ionized VOC particles. This method does not require chemical interference with the sample and the required time for the analysis is short. These features are key in analyses where the risk of VOC contamination prior to testing is not absent [5]. PTR-MS analyses can be used in comparative studies of biological materials, screening studies to identify VOCs with specific characteristics and for determining so-called “fingerprints” [6,7]. A disadvantage of the method is the difficulty in identifying the analyzed VOCs. The device, however, determines the m/z (mass-to-charge ratio) of VOCs, but it can correspond to more than one compound, as well as their isomers. The problems mentioned are discussed more broadly in the work of Wróblewski et al. [5,8]. Despite the inability to directly identify VOCs, the PTR-MS method allows for the visualization of the odours in the form of a graph of the m/z of individual VOCs. The PTR-MS technique has found its application in various areas. Studies of VOC emissions from the decomposition of organic waste [2], VOC emissions from plants and their products [9,10], and also from fungi such as Muscodor albus [11] have been documented. Studies have been conducted on VOCs in forest areas [12,13], and various soil types [14,15].
Asensio et al. [15] found that dry soil is an absorber for VOCs rather than their source, however, an increase in temperature and soil moisture strongly influence the VOC detection rate [16]. This certainly translates into the detection of VOCs from water-saturated lake bottom sediments, which often have an intense odor in this state, whereas its intensity diminishes after drying. In the study by Byliński et al. [17], the use of PTR-MS for VOC analysis in water and dried sludge from wastewater treatment plants was tested. It was found that stabilized, dewatered sludge still contained a significant amount of odorous compounds, and the PTR-MS measurement technique could be useful in monitoring the concentration levels of selected compounds.
The aim of this study was to evaluate the VOC m/z differences between study sites with different shoreline development: forest, agricultural land and comparison the VOC characteristics from Lake Łętowskie with those of neighboring lakes studied.

2. Materials and Methods

2.1. Study Area

Lake Łętowskie is located in northern Poland. The site is part of the Protected Landscape Area “Łętowskie Lake and the vicinity of Kępice” (Journal of Laws of the Słupsk Voivodeship No. 9, item 23). The lake covers 402 ha, with a volume of 33.1 million m3 [18], (Table 1). The maximum depth of the lake is 18.7 m, and the area with this depth lies in the centre. The average depth of the lake, however, is 8.2 m, resulting from large areas of shallow water near the shores [18]. Additional research by Ptak [19] indicates the depletion of water resources of Lake Łętowskie. The lake is surrounded by extensive forests, nearly three-quarters of its shoreline. It is a place with valuable old trees and dense forests, which provide breeding sites and hiding places for land and water birds [20,21]. According to data of Municipality of Sławno [22] in the coastal zone of Lake Łętowkie 20 species of breeding birds were observed.

2.2. Sampling

During the summer of 2023 bottom sediment samples were collected from five study sites located in representative areas of the lake, including the northwestern (site 1), southwestern (site 2), southeastern (site 3), and northeastern (site 4) parts, as well as the central part of the lake, which is the deepest point of the lake with a depth of approximately 18 m (site 5) (Figure 1). At research stations 1–3 and 5, the bottom sediments were dark in colour and contained a large amount of organic matter, while at station 4 they were lighter in colour with a large amount of sand. Three sub-samples were collected at each sampling sites. The southwestern (site 2) and southeastern (site 3) sites are located in the immediate forest catchment area, while the site in the northwestern part (site 1) has a different character and borders agricultural land. Bottom sediment samples from the studied lake were collected using an Ekman grab. The top layer of bottom sediments was collected; it is estimated that the thickness of the collected sediments was no greater than 5 cm.

2.3. Laboratory Analyses of Volatile Organic Compounds

Bottom sediment samples weighing 15 g were placed in closed PTFE vessels with a fixed capacity of 50 mL. To avoid memory effects from one measurement of sample to the next sample, the PTR-MS apparatus was flushed with laboratory air between each measurements. Moreover before each measurement, mass spectra were also examined to control the signal decay to the background level [1]. Next, four stable mass spectra were recorded for each subsample, from which the average value was calculated.
The following 20 positively ionized particles with their mass to charge ratios (m/z): were selected for analysis: 57, 61, 63, 69, 75, 81, 83, 85, 87, 95, 97, 99, 101, 109, 111, 127, 129, 137, 149, 157. The study used a set of m/z VOC compounds proposed for comparable studies in the article: “Study of Volitile Organic Compounds in Emission form Bottom Sediments of…” [1], characterized by a large intensity of m/z VOC.
The High Sensivity Quadrupole Proton Transfer Mass Spectrometer (PTR-MS) Ionicon Analytic GmbH (Austria) was used to examine the concentrations of volatile organic compounds (VOCs) in fumes from bottom sediments of Lake Łętowskie. VOC measurements were performed analogously to those described in detail in the work of Antonowicz and Wróblewski [1], using the studies by Hansel et al. [23] and Biasoli et al. [24].

2.4. Statistical Anaysis

The statistical analysis was performed in the Past (ver. 4.16c) statistical program [25,26] and the Statistica (ver. 13.3) program [27]. The Kolmogorov–Smirnov normality test was used to determine the distribution type of variables. If the series had a normal distribution, ANOVA analysis and then the pairwise Tukey test were used. Statistica program was used to perform multivariate cluster analysis (Ward method, Euclidean distance).

3. Results

Table 2 presents the basic statistical parameters of the studied VOCs, including the arithmetic mean, median, minimum and maximum values, upper and lower quartiles, standard deviation, and coefficients of variation. High mean values were obtained for VOCs with m/z = 57 and 61, at 9.84 and 12.91 [ppb], respectively. Low mean values were observed for compounds with m/z = 63, 81, 95, 129, 137, and 149, at 1.14, 1.12, 1.38, 1.32, and 1.05 [ppb], respectively. High coefficients of variation were observed for VOCs with low concentrations, at 61.26% for VOCs with m/z = 137; 59.98% for VOCs with m/z = 149, 58.45% for VOCs with m/z = 81, and 55.52% for VOCs with m/z = 75. Lower CVs were observed for VOCs with higher concentrations: m/z = 57 (23.10%), m/z = 69 (23.79%), and for compounds with m/z = 83 (27.59%). The highest average concentration of the compound with m/z = 61 was nearly 20 times higher than the lowest concentration observed for the compound with m/z = 149.
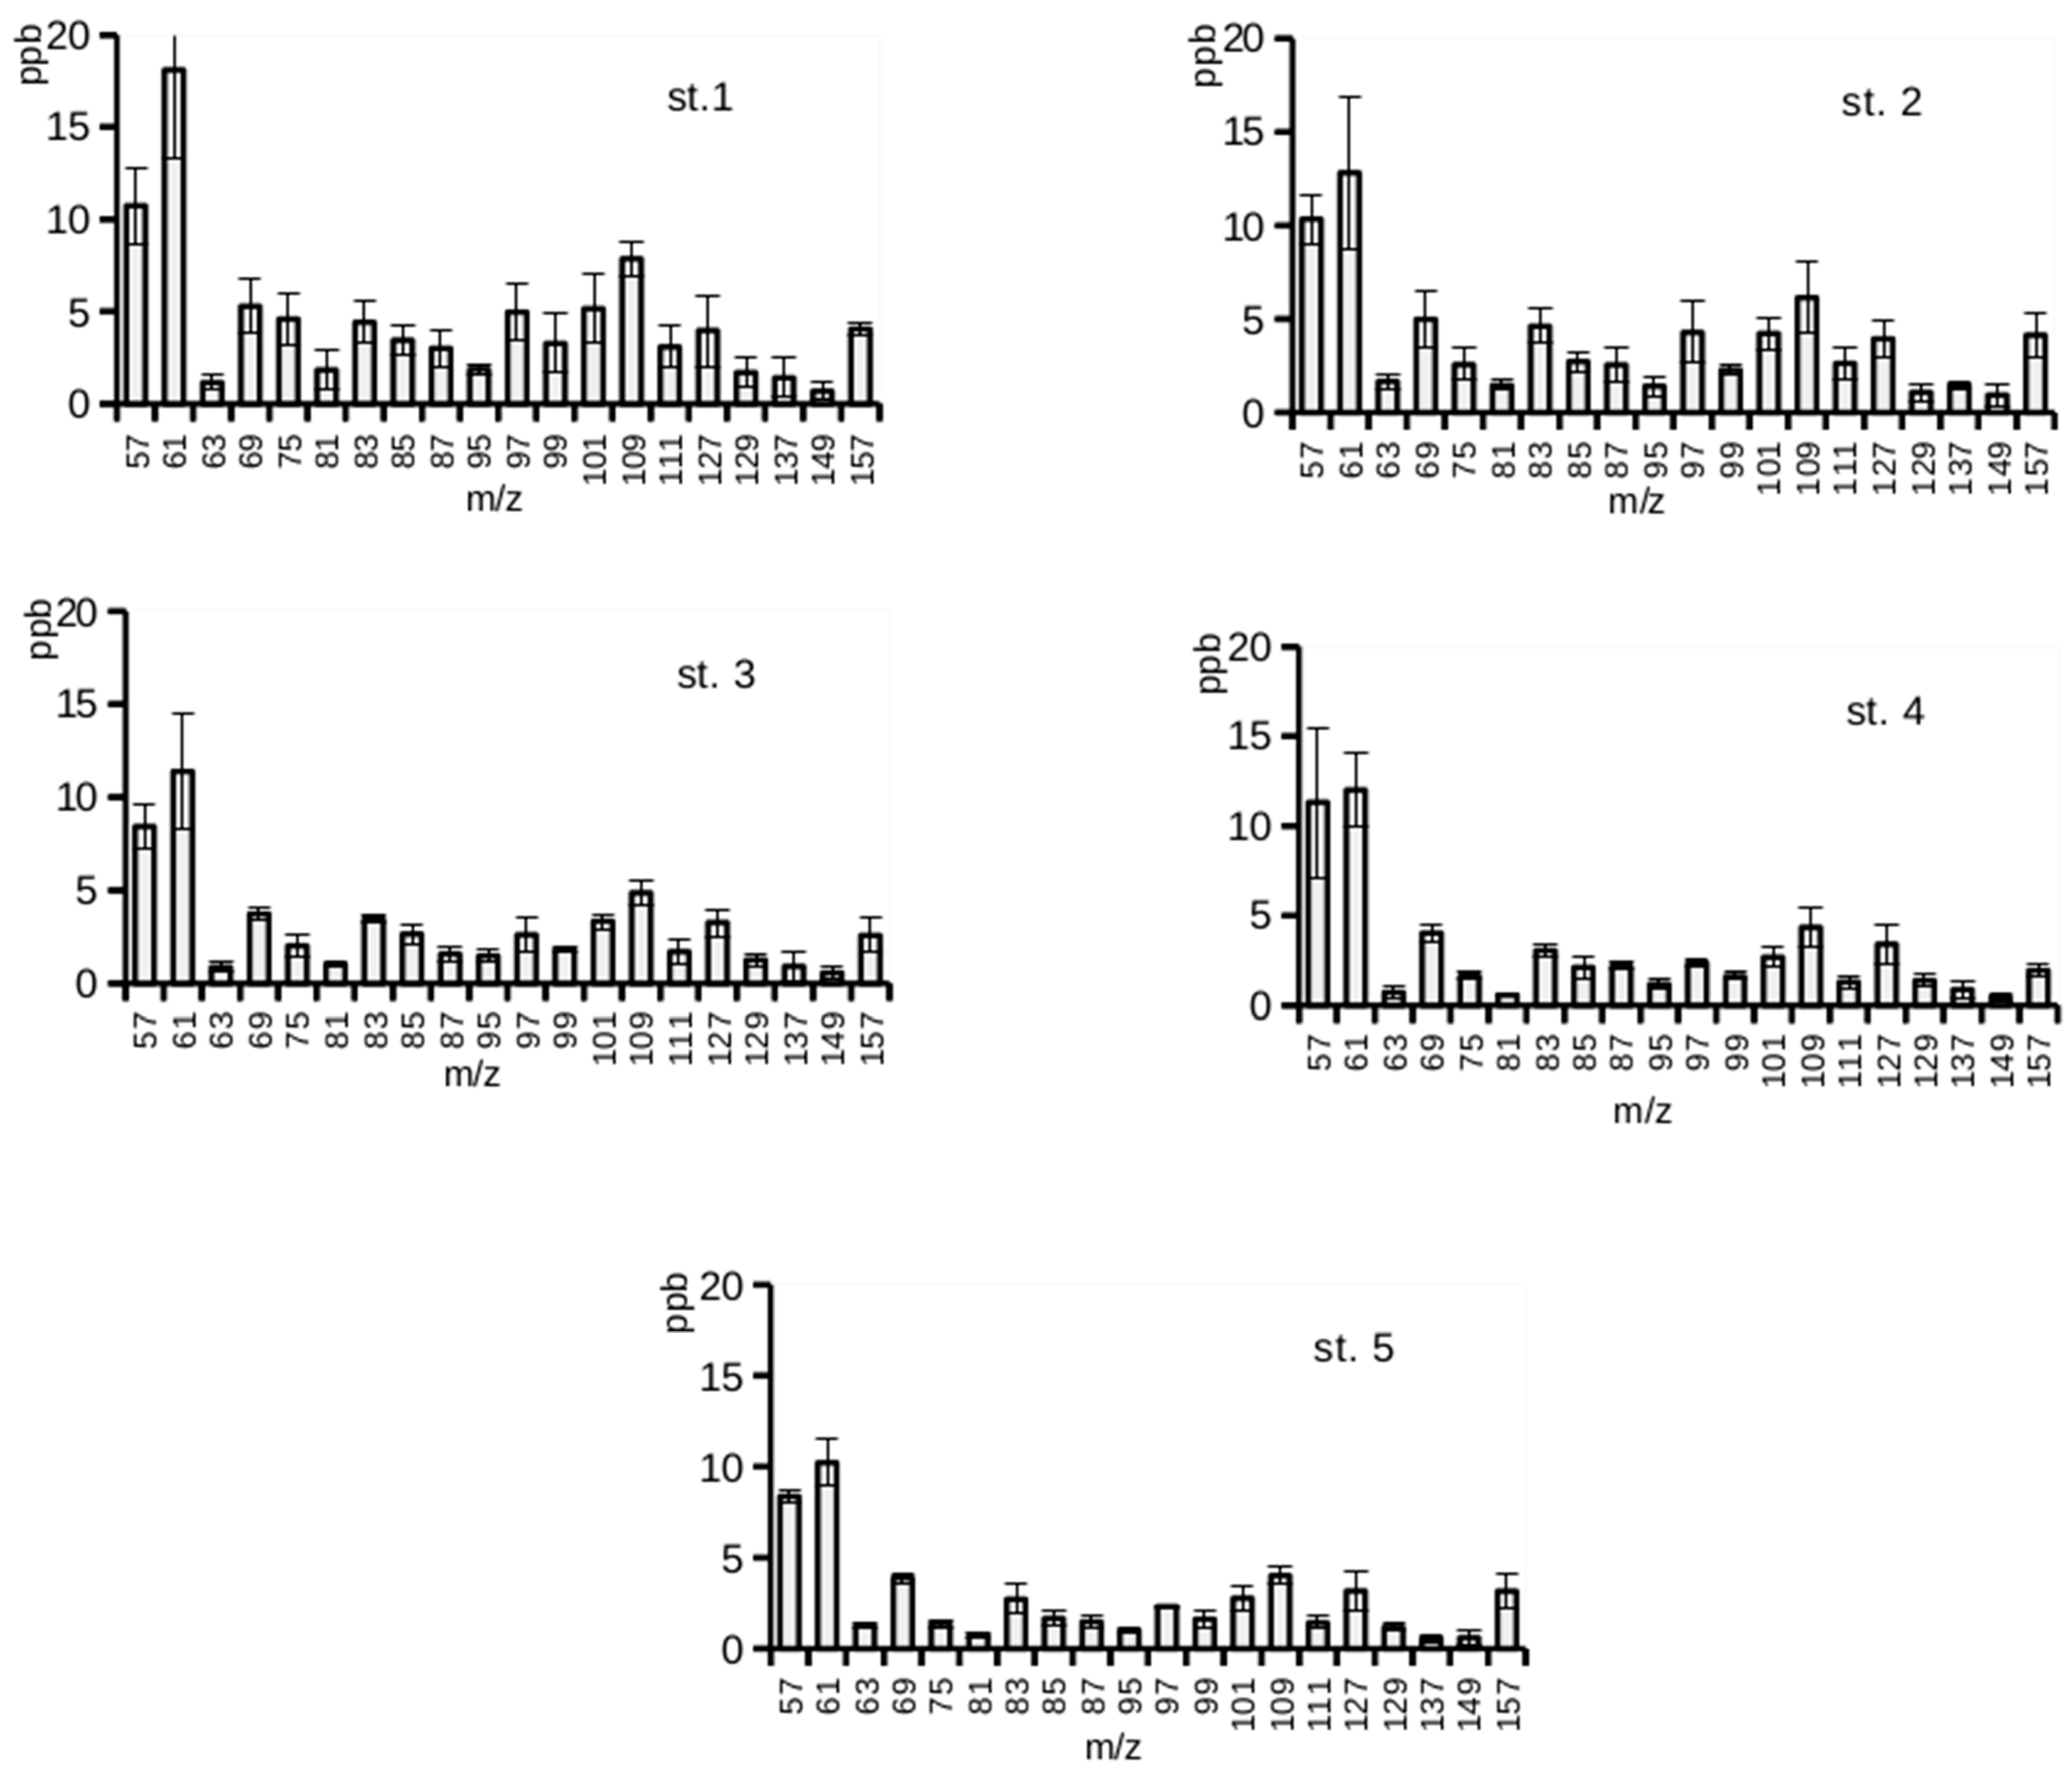
Figure 2 presents the concentrations of 20 VOCs with m/z ranging from 57 to 157, selected according to the locations of the study sites established at Lake Łętowskie. At all studied sites, i.e., site 1 (site near the shoreline occupied by agricultural land and a village), site 4 (site near a village and forests), and sites surrounded by forest: 2, 3, and 5, the highest VOC concentrations were observed, with m/z values of 57 and 61. The highest m/z values of 75, 85, and 109 were observed at site 1.
Site 5, with its greatest depth, was characterized by the lowest VOC concentrations of most of the studied compounds among the sites in Lake Łętowskie. At sites 1 and 2, most of the studied compounds showed higher VOC concentrations than at the other sites. The analyzed m/z VOCs can be ranked as follows in order of increasing concentration: 149 > 137 > 81 > 63 > 129 > 95 > 111 > 99 > 87 > 75 > 85 > 157 > 97 > 127 > 101 > 83 > 69 > 109 > 57 > 61.
Table 3 presents the results of the ANOVA and Tukey statistical tests. Statistically significant differences were found for 8 of the 20 compounds tested. The VOCs mentioned have the corresponding m/z: 63, 75, 83, 85, 97, 109, 111, and 157. Statistically significant differences were found between site 1 (located near agricultural land and the village of Łętowo) and site 5, the deepest part of the lake (over 18 m), for VOCs with m/z: 75, 85, and 109. Statistically significant differences were also found between sites 1 and 4 (located near the forest and the village of Łętowo) for compounds with m/z = 75 and m/z = 109, and between site 1 and site 3 (located near the forest) for m/z = 75. Statistically significant differences were also found between site 4 and site 2 (located entirely within the forest) for compounds with m/z = 63.
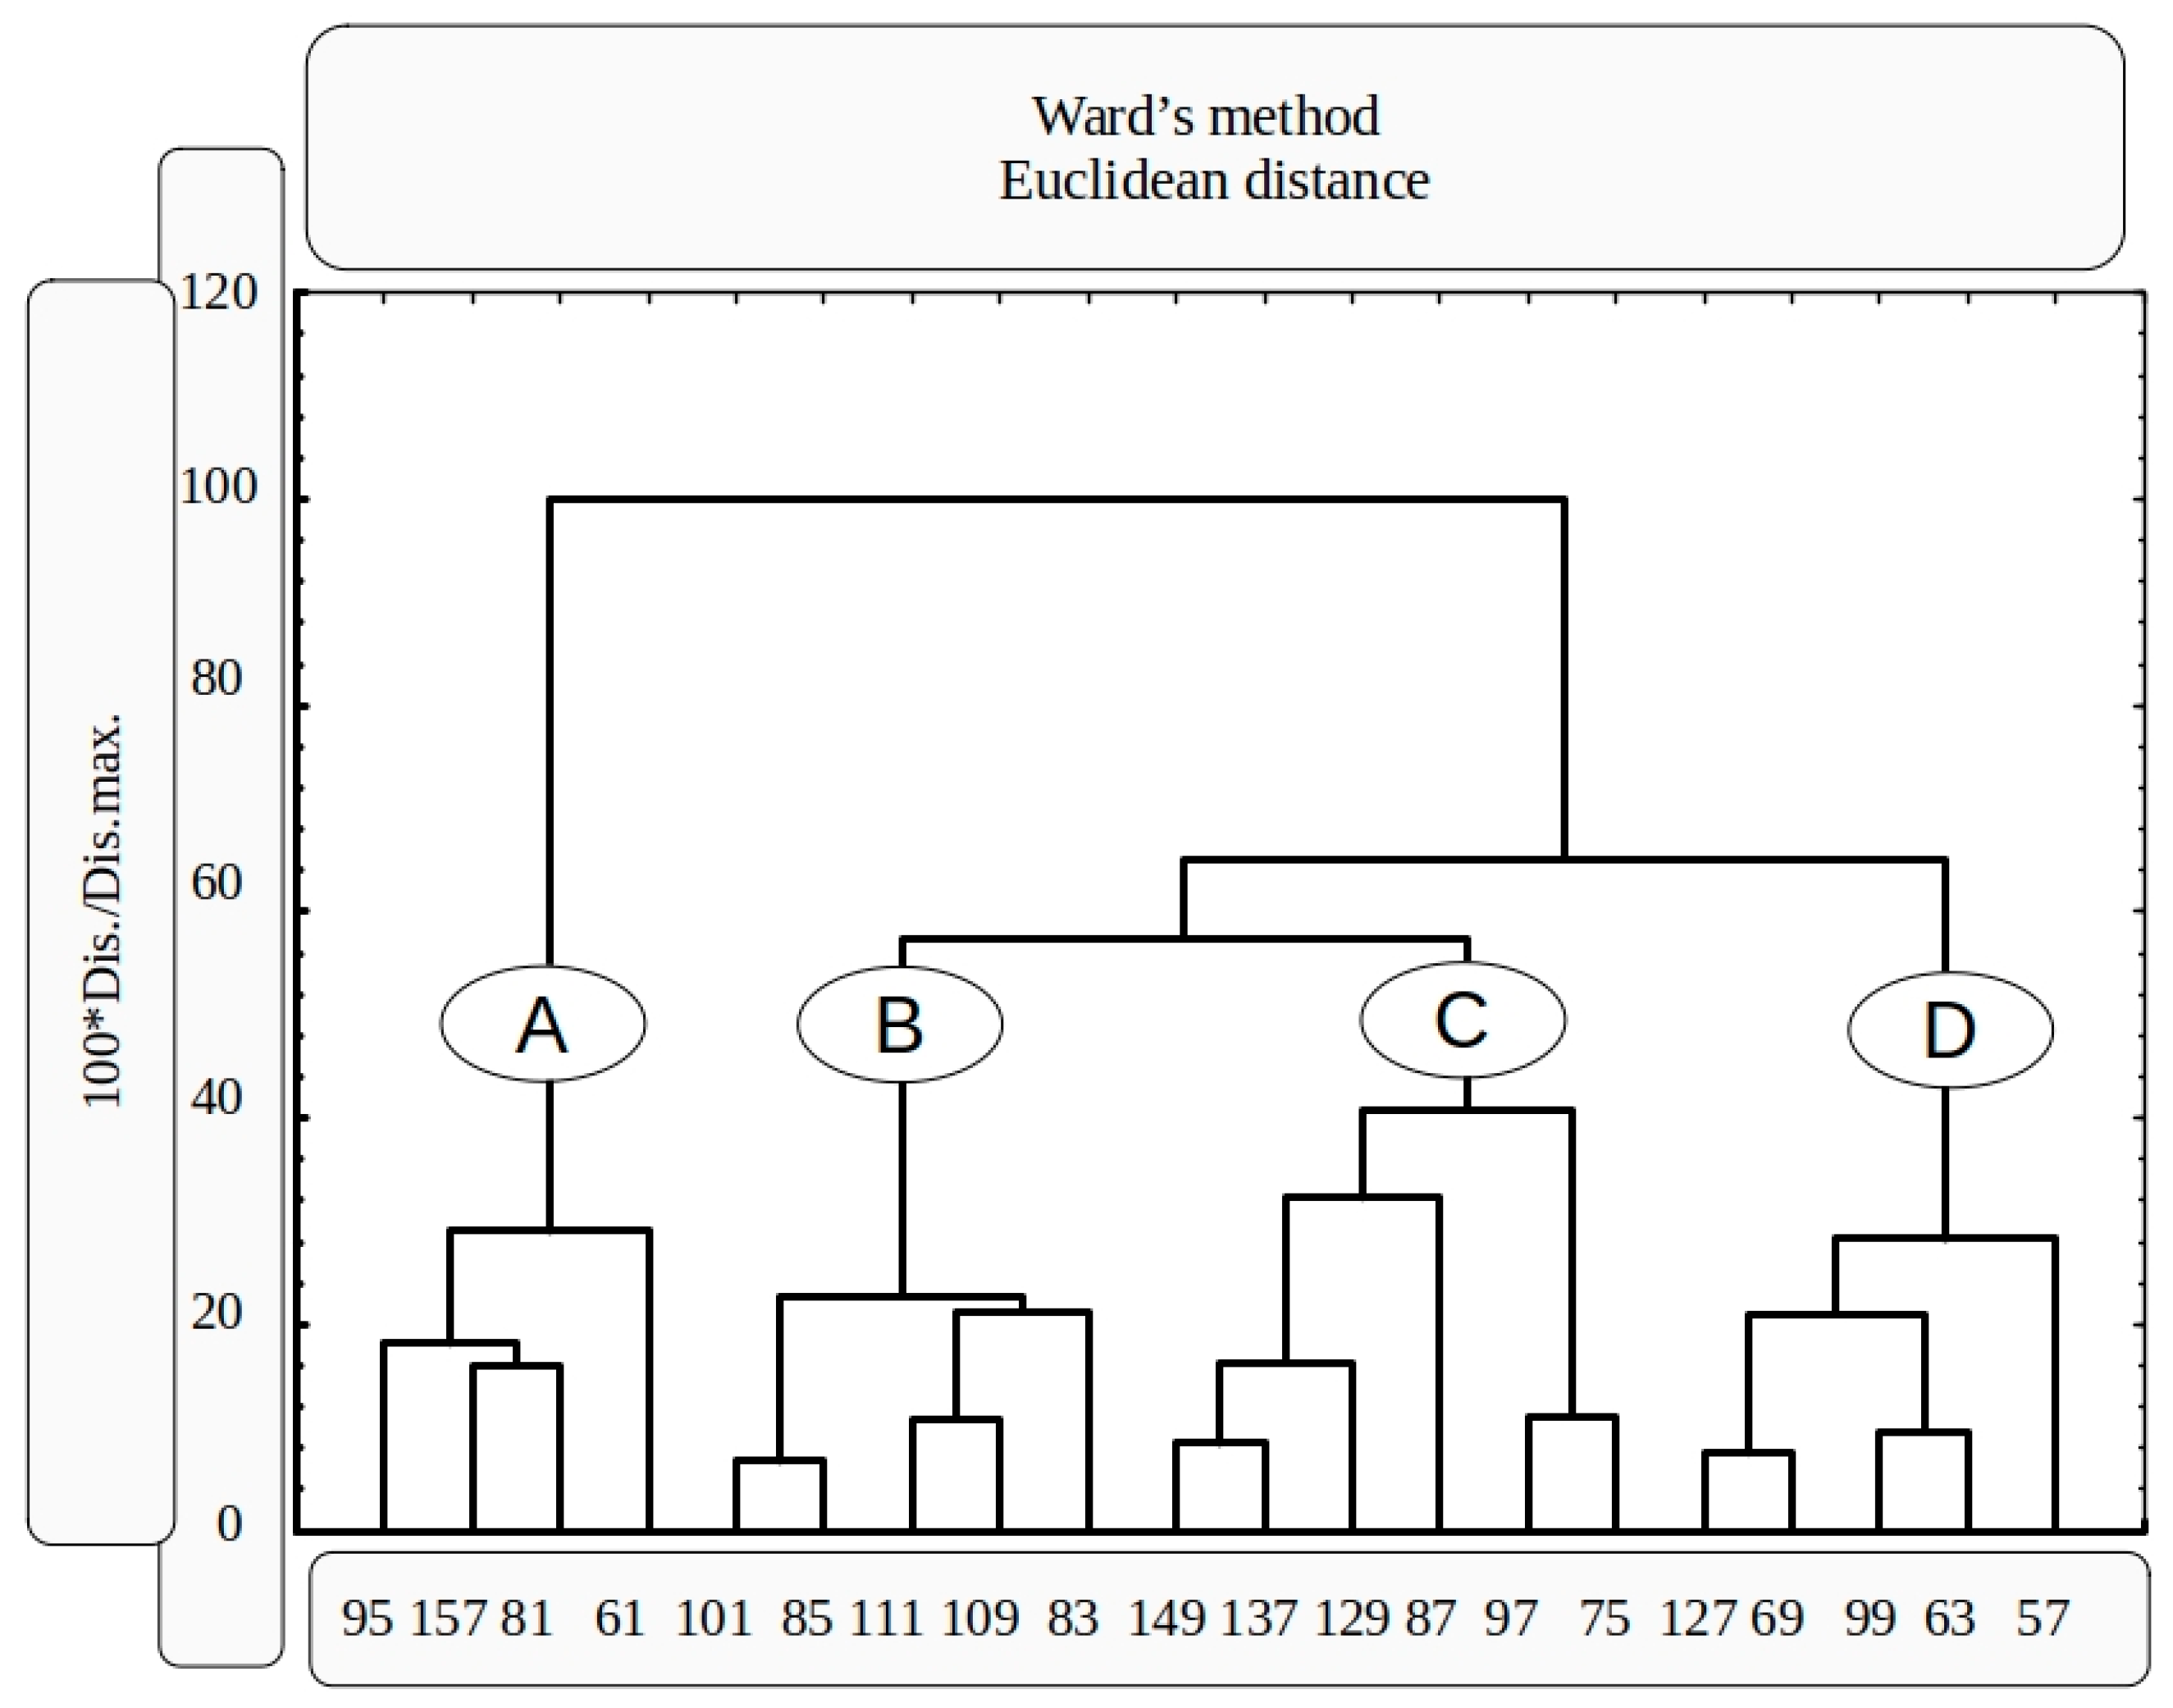
Figure 3 shows a multidimensional cluster analysis. It distinguishes 4 main clusters grouping compounds with specific m/z. Cluster A—m/z = 95, 157, 81, 61; cluster B—m/z = 101, 85, 111, 109, 83; cluster C—m/z = 149, 137, 129, 87, 97, 75; cluster D—m/z = 127, 69, 99, 63, 57.

4. Discussion

The VOC research conducted in the study on Lake Łętowskie, as well as the studies of Lakes Rychnowskie, Łazienkowskie, and Jeleń presented in the paper [1], highlight common and differentiating features of the VOC composition of the bottom sediments from the aforementioned lakes. The results of the studies on three lakes: Rychnowskie, Łazienkowskie, and Jeleń showed that the composition of VOC emitted from the bottom sediments of distant lakes differs between them, while maintaining similarities for lakes connected by a river isthmus (which allows for constant exchange of water between Lake Łazienkowskie and Lake Rychnowskie) [1].
Analyzing the identical 20 m/z VOC composition from Lake Łętowskie, one can draw analogies to the studies conducted on Lake Jeleń [1]. It is noticeable that in the bottom sediments collected from Lake Jeleń and Lake Łętowskie, significantly lower (2–3 times) concentrations of the tested m/z VOCs were observed than the same 20 m/z VOCs from Lakes Rychnowskie and Łazienkowskie [1]. Jeleń and Łętowskie are lakes surrounded by forests and are exposed to municipal pollution to a small extent. In contrast, Lakes Łazienkowskie and Miejskie were previously exposed to municipal sewage discharges, which resulted in poor water quality in them [28], and currently, surface runoff together with urban pollution contribute a lot to their state [1]. Clear identification of VOC compounds using PTR-MS is difficult and focuses rather on the probable occurrence of the compound and comparison of PTR-MS results with other analytical techniques [5]. The PTR-MS technique only allows the m/z ratio of the tested compound to be determined. The measured m/z values of VOCs may correspond to more than one chemical compound. Although the PTR-MS technique uses soft ionisation, some compounds may undergo fragmentation, which can also hinder the identification of VOCs. In such situations, fragmentation ions of compounds with higher molecular masses increase the ion signal intensity for ions with lower m/z. However, despite the disadvantages of this technique, due to its high sensitivity and the lack of need for chemical interference in the sample, it can be very helpful in comparative studies [5,29].
This should be kept in mind when interpreting data. Attempts have been made in the literature to identify VOC compounds in sediments or similar materials, e.g., soils, according to the m/z they may constitute. Its analysis shows that the presented m/z values may correspond to the following chemical compounds: methylketene 1-butanol (fragment) (m/z = 57) [30,31]; acetic acid and 1-propanal (m/z = 61) [2,17,31,32]; dimethylsulfide and ethanediol (m/z = 63) [2,17,30,31,32], methylketene as well as butene (m/z = 57) [30]; isoprene and furan (m/z = 69) [2]; methyl acetate and propanoic acid, diethyl ether (m/z = 75) [33]; monoterpenes fragment (m/z = 81) [34]; methylfuran (m/z = 83) [35], furanone, cyclopentanone (m/z = 85) [36]; butanedione (m/z = 87) [36], dimethyl disulphide and phenol (m/z = 95) [31]; furfural (m/z = 97) [33]; hex-2-enal (m/z = 99) [37]; trans-hex-2-en-1-ol, cis-hex-2-en-1-ol, hexanal (m/z = 101), benzyl alcohol (m/z = 109) [37]; benzanediols (m/z = 111) [36]; dimethyltrisulphide (m/z = 127) [29], naphthalene (m/z = 129) [38]; 3-phenyl propanol (m/z = 137) [37]; phthalic anhydride (m/z = 149) [39]; 1,2(3)-dimethylnaphthalene (m/z = 157) [29].
For m/z = 57 and m/z = 61, high concentrations were observed in Lake Łętowskie at all sites, and the highest at site 1 for m/z = 61 (Figure 2). Values of m/z = 57 and 61 were also high in Lake Łazienkowskie and Rychnowskie [1]. According to [2,17,31,32], m/z = 61 probably represents acetic acid. This compound is formed as a result of the decomposition of plant material, such as fallen leaves [40], which are then degraded by microorganisms into simpler organic compounds, as a result of the oxidation of fermentation products to ethyl alcohol. VOCs are formed by the degradation of organic residues [2], Leff and Fierer [40] indicate that the main source of VOCs in soils is emission from plant root systems and associated mycorrhiza. Interactions between macroflora, fauna, and microorganisms are important elements of VOC formation. Therefore, the measured VOCs represent various stages of degradation and metabolism of organic compounds [41], including the oxidation of alcoholic fermentation products to acetic acid.
M/z = 63 recorded in bottom sediments may result from the presence of dimethylsulfide [2,17,30,31,32]. In lake bottom sediments, this compound occurs when oxygen deficits occur in the near-bottom zone. Oxygen deficits were observed in Lakes Łazienkowskie and Rychnowskie [28]. Hence, this would explain why the concentration of m/z = 63 was high in the Rychnowskie (ca. 260 ppb) and Łazienkowskie (ca. 35 ppb) lakes [1] while in Lake Jeleń (ca. 2 ppb) [1] and Lake Łętowskie it was at the level of about 1 ppb (Table 2).
Furthermore, it is noticeable that in Lake Łętowskie, m/z = 63 and m/z = 127 in cluster analysis (Figure 3) and in Lake Jeleń in the work of Antonowicz and Wróblewski [1] occur in one cluster. It can be assumed that in the bottom sediments of these lakes, the metabolism of sulfur compounds could proceed to two m/z, which can be identified as dimethylsulfide (m/z = 63) [2,17,30,31,32] and dimethyltrisulphide (m/z = 127) [29].
The VOC concentrations observed at site 5 were, on average, the lowest of all the sites studied (Figure 2). It is located in the central part of the lake with over 18 m in depth. Bottom sediments emitted VOCs at site 5 (dominance of organic matter), although in similar proportions to those observed at sites 2–4 (2 and 3 dominance of organic matter, st. 4 with a large amount of sand), at significantly lower concentrations. This is likely due to the fact that these are older sediments that flow into the depths and are stored there, hence the intensity of their release decreases. Due to the lack of underwater vegetation, light access, and lower temperatures, biochemical processes slow down, and the intensity of VOC emissions decreases, likely resulting in the lower VOC concentrations observed at site 5.

5. Summary

VOC emissions from the bottom sediments of a forest Lake Łętowskie were comparable to those observed in Lake Jeleń. They were significantly lower than those in Lakes Rychnowskie and Łazienkowskie, which were subject to urban pollution pressure.
It is noticeable that Lake Łętowskie site 1, with the strongest influence of the agricultural catchment, differed in terms of VOC emissions from sites with stronger influences from the forest catchment.
Bottom sediments collected from the deepest part of Lake Łętowskie emitted lower VOC concentrations than in areas closer to the shore, where biochemical reactions were more intense.

Author Contributions

Conceptualization, J.A. and T.W.; methodology, T.W.; software, J.A.; formal analysis, T.W.; investigation, J.A. and T.W.; data curation, T.W.; writing—original draft preparation, J.A. and T.W.; writing—review, T.W.; visualization, J.A.; funding acquisition, J.A. All authors have read and agreed to the published version of the manuscript.

Funding

This research was funded by an internal Pomeranian University in Słupsk grant no. 7.4.14.

Data Availability Statement

The original contributions presented in the study are included in the article; further inquiries can be directed to the author/s.

Conflicts of Interest

The authors declare no conflict of interest.

References

  1. Antonowicz, J.; Wróblewski, T. Study of Volatile Organic Compounds in Emission from Bottom Sediments of Three Lakes with Impact of Anthropopression Using the ProtonTransfer Reaction Mass Spectrometry. Limnol. Rev. 2024, 24, 205–216. [Google Scholar] [CrossRef]
  2. Mayrhofer, S.; Mikoviny, T.; Waldhuber, S.; Wagner, A.O.; Innerebner, G.; Franke-Whittle, I.H.; Märk, T.D.; Hansel, A.; Insam, H. Microbial community related to volatile organic compound (VOC) emission in household biowaste. Environ. Microbiol. 2006, 8, 1960–1974. [Google Scholar] [CrossRef] [PubMed]
  3. Bojakowska, I.; Dobek, P.; Kucharzyk, J. Geochemical characteristics of sediments of reservoir Zadebie in Skierniewice. Biul. Państwowego Inst. Geol. 2017, 470, 9–16. [Google Scholar] [CrossRef]
  4. Trojanowski, J.; Trojanowska, C. Balance and circulation of nutrients in a shallow coastal lake Gardno (North Poland). Arch. Environ. Prot. 2007, 33, 45–57. [Google Scholar]
  5. Wróblewski, T.; Kamińska, A.; Włodarkiewicz, A.; Ushakou, D. Studies of volatile organic compounds emission from Fragaria vesca and Fragaria ananassa using proton transfer reaction mass spectrometry. Acta Phys. Pol. B Proc. Suppl. 2020, 12, 899–906. [Google Scholar] [CrossRef]
  6. Ciesa, F.; Höller, I.; Guerra, W.; Berger, J.; Dalla Via, J.; Oberhuber, M. Chemodiversity in the Fingerprint Analysis of Volatile Organic Compounds (VOCs) of 35 Old and 7 Modern Apple Cultivars Determined by Proton-Transfer-Reaction Mass Spectrometry (PTR-MS) in Two Different Seasons. Chem. Biodivers. 2015, 12, 800–812. [Google Scholar] [CrossRef]
  7. Roslund, K.; Lehto, M.; Pussinen, P.; Hartonen, K.; Groop, P.H.; Halonen, L.; Metsälä, M. Identifying volatile in vitro biomarkers for oral bacteria with proton-transfer-reaction mass spectrometry and gas chromatography-mass spectrometry. Sci. Rep. 2021, 11, 16897. [Google Scholar] [CrossRef]
  8. Blake, R.S.; Monks, P.S.; Ellis, A.M. Proton-transfer reaction mass spectrometry. Chem. Rev. 2009, 109, 861–896. [Google Scholar] [CrossRef]
  9. Kreuzwieser, J.; Cojocariu, C.; Jüssen, V.; Rennenberg, H. Elevated atmospheric CO2 causes seasonal changes in carbonyl emissions from Quercus ilex. New Phytol. 2002, 154, 327–333. [Google Scholar] [CrossRef]
  10. Beauchamp, J.; Wisthaler, A.; Hansel, A.; Kleist, E.; Miebach, A.; Niinemets, Ü.; Schurr, U.; Wildt, J. Ozone induced emissions of biogenic VOC from tobacco: Relationships between ozone uptake and emission of LOX products. Plant. Cell. Environ. 2005, 28, 1334–1343. [Google Scholar] [CrossRef]
  11. Ezra, D.; Jasper, J.; Todd, R.; Knighton, B.; Grimsrud, E.; Strobel, G. Proton transfer reaction–mass spectrometry as a technique to measure volatile emissions of Mucodor albus. Plant Sci. 2004, 166, 1471–1477. [Google Scholar] [CrossRef]
  12. Karl, T.; Guenther, A.; Spirig, C.; Hansel, A.; Fall, R. Seasonal variation of biogenic VOC emissions above a mixed hardwood forest in northern Michigan. Geophys. Res. Lett. 2003, 30, 23. [Google Scholar] [CrossRef]
  13. Grabmer, W.; Graus, M.; Lindinger, C.; Wisthaler, A.; Rappenglück, B.; Steinbrecher, R.; Hansel, A. Disjunct eddy covariance measurements of monoterpene fluxes from a Norway spruce forest using PTR-MS. Int. J. Mass Spectrom. 2004, 239, 111–115. [Google Scholar] [CrossRef]
  14. Schade, G.W.; Custer, T.G. OVOC emissions from agricultural soil in northern Germany during the 2003 European heat wave. Atmos. Environ. 2004, 38, 6105–6114. [Google Scholar] [CrossRef]
  15. Asensio, D.; Penuelas, J.; Filella, I.; Llusià, J. On-line screening of soil VOCs exchange responses to moisture, temperature and root presence. Plant Soil. 2007, 291, 249–261. [Google Scholar] [CrossRef]
  16. Asensio, D.; Penuelas, J.; Llusià, J.; Ogaya, R.; Filella, I. Interannual and interseasonal soil CO2 efflux and VOC exchange rates in a Mediterranean holm oak forest in response to experimental drought. Soil Biol. Biochem. 2007, 39, 2471–2484. [Google Scholar] [CrossRef]
  17. Byliński, H.; Barczak, R.J.; Gębicki, J.; Namieśnik, J. Monitoring of odors emitted from stabilized dewatered sludge subjected to aging using proton transfer reaction–Mass spectrometry. Environ. Sci. Pollut. Res. 2019, 26, 5500–5513. [Google Scholar] [CrossRef] [PubMed]
  18. Brodzińska, B.; Jańczak, J.; Kowalik, A.; Lamparska, A.; Rekowska, J.; Sziwa, R. Atlas Jezior Polski; Tom II [The atlas of Polish Lakes; Volume II]; Jańczak, J., Ed.; Scientific Publisher: Poznań, Poland, 1997; p. 256. [Google Scholar]
  19. Ptak, M. Changes in the area and bathymetry of selected lakes of the Pomeranian Lake District. Geogr. Works 2013, 133, 61–76. (In Polish) [Google Scholar]
  20. Sobczak, B. Forest Management Plan for the Period 1.01.2019 to 31.12.2028. Nature Conservation Plan; Regional Directorate of State Forests in Szczcinek: Szczecinek, Poland, 2018; p. 293. (In Polish)
  21. Żółkoś, K.; Meissner, W.; Kalisiński, M.; Górska, E.; Mellin, M.; Ibron, I.; Wysocki, D. Liczebność i rozmieszczenie kolonii czapli siwej Ardea cinerea w północnej Polsce [Number and distribution of the Grey Heron Ardea cinerea colonies in northern Poland]. Ornis Polonica 2010, 51, 30–42. (In Polish) [Google Scholar] [CrossRef]
  22. Municipality of Sławno, Poland. Official Website of the Sławno Commune Office. 2024. Available online: www.gminaslawno.pl (accessed on 1 October 2024).
  23. Hansen, M.J.; Adamsen, A.P.S.; Feilberg, A. Recovery of Odorants from an Olfactometer Measured by Proton-Transfer-Reaction Mass Spectrometry. Sensors 2013, 13, 7860–7871. [Google Scholar] [CrossRef]
  24. Biasioli, F.; Gasperi, F.; Aprea, E.; Mott, D.; Boscaini, E.; Mayr, D.; Märk, R.D. Coupling proton transfer reaction—mass spectrometry with linear discriminant analysis: A case study. J. Agric. Food Chem. 2003, 51, 7227–7233. [Google Scholar] [CrossRef]
  25. Hammer, Ø.; Harper, D.A.T.; Ryan, P.D. PAST: Paleontological Statistics software package for education and data analysis. Palaeontol. Electron. 2001, 4, 1–9. [Google Scholar]
  26. Hammer, Ø. PAST. In Paleontological Statistics. Reference Manual; Natural History Museum, University of Oslo: Oslo, Norway, 2023. [Google Scholar]
  27. TIBCO. Statistica (Data Analysis Software System), Version 13.3; TIBCO Software Inc.: Palo Alto, CA, USA, 2017. [Google Scholar]
  28. Trojanowski, J.; Trojanowska, C. Stan zanieczyszczenia jezior człuchowskich. Arch. Environ. Prot. 1999, 25, 91–109. [Google Scholar]
  29. Bianchi, A.P.; Varney, M.S.; Phillips, J. Analysis of volatile organic compounds in estuarine sediments using dynamic headspace and gas chromatography—Mass spectrometry. J. Chromatogr. A 1991, 542, 413–450. [Google Scholar] [CrossRef]
  30. Jordan, A.; Haidacher, S.; Hanel, G.; Hartungen, E.; Märk, L.; Seehauser, H.; Schottkowsky, R.; Sulzer, P.; Märk, T.D. A high resolution and high sensitivity proton-transfer-reaction time-of-flight mass spectrometer (PTR-TOF-MS). Int. J. Mass Spectrom. 2009, 286, 122–128. [Google Scholar] [CrossRef]
  31. Feilberg, A.; Bildsoe, P.; Nyord, T. Application of PTR-MS for Measuring Odorant Emissions from Soil Application of Manure Slurry. Sensors 2015, 15, 1148–1167. [Google Scholar] [CrossRef]
  32. Mancuso, S.; Taiti, C.; Bazihizina, N.; Costa, C.; Menesatti, P.; Giagnoni, L.; Arenella, M.; Nannipieri, P.; Renella, G. Soil volatile analysis by proton transfer reaction-time of flight mass spectrometry (PTR-TOF-MS). Appl. Soil Ecol. 2015, 86, 182–191. [Google Scholar] [CrossRef]
  33. Jardine, K.; Wegener, F.; Abrell, L.; Van Haren, J.; Werner, C. Phytogenic methyl acetate. Plant Cell Environ. 2014, 37, 414–424. [Google Scholar] [CrossRef]
  34. Kaser, L.; Karl, T.; Schnitzhofer, R.; Graus, M.; HerdlingerBlatt, I.S.; DiGangi, J.P.; Sive, B.; Turnipseed, A.; Hornbrook, R.S.; Zheng, W.; et al. Comparison of different real time VOC measurement techniques in a ponderosa pine forest. Atmos. Chem. Phys. 2013, 13, 2893–2906. [Google Scholar] [CrossRef]
  35. Märk, J.; Pollien, P.; Lindinger, C.; Blank, I.; Märk, T. Quantitation of furan and methylfuran formed in different precursor systems by proton transfer reaction mass spectrometry. J. Agric. Food Chem. 2006, 54, 2786–2793. [Google Scholar] [CrossRef]
  36. Muller, M.; Anderson, B.E.; Beyersdorf, A.J.; Crawford, J.H.; Diskin, G.S.; Eichler, P.; Fried, A.; Keutsch, F.N.; Mikoviny, T.; Thornhill, K.L. In situ measurements and modeling of reactive trace gases in a small biomass burning plume. Atmos. Chem. Phys. 2016, 16, 3813–3824. [Google Scholar] [CrossRef]
  37. Pyysalo, T.; Honkanen, E.; Hirvi, T. Volatiles of wild strawberries, Fragaria vesca L., compared to those of cultivated berries, Fragaria x ananassa cv. Senga Sengana. J. Agric. Food Chem. 1979, 27, 19–22. [Google Scholar] [CrossRef]
  38. Warneke, C.; Roberts, J.M.; Veres, P.; Gilman, J.; Kuster, W.C.; Burling, I.; Yokelson, R.; de Gouw, J.A. VOC identification and intercomparison from laboratory biomass burning using PTR-MS and PITMS. Int. J. Mass Spectrom. 2011, 303, 6–14. [Google Scholar] [CrossRef]
  39. Bruns, E.A.; Slowik, J.G.; El Haddad, I.; Kilic, D.; Klein, F.; Dommen, J.; Temime-Roussel, B.; Marchand, N.; Baltensperger, U.; Prévôt, A.S.H. Characterization of gas-phase organics using proton transfer reaction time-of-flight mass spectrometry: Fresh and aged residential wood combustion emissions. Atmos. Chem. Phys. 2017, 17, 705–720. [Google Scholar] [CrossRef]
  40. Leff, J.W.; Fierer, N. Volatile organic compound (VOC) emissions from soil and litter samples. Soil Biol. Biochem. 2008, 40, 1629–1636. [Google Scholar] [CrossRef]
  41. Insam, H.; Seewald, M.S.A. Volatile organic compounds (VOCs) in soils. Biol. Fertil Soils 2010, 46, 199–213. [Google Scholar] [CrossRef]
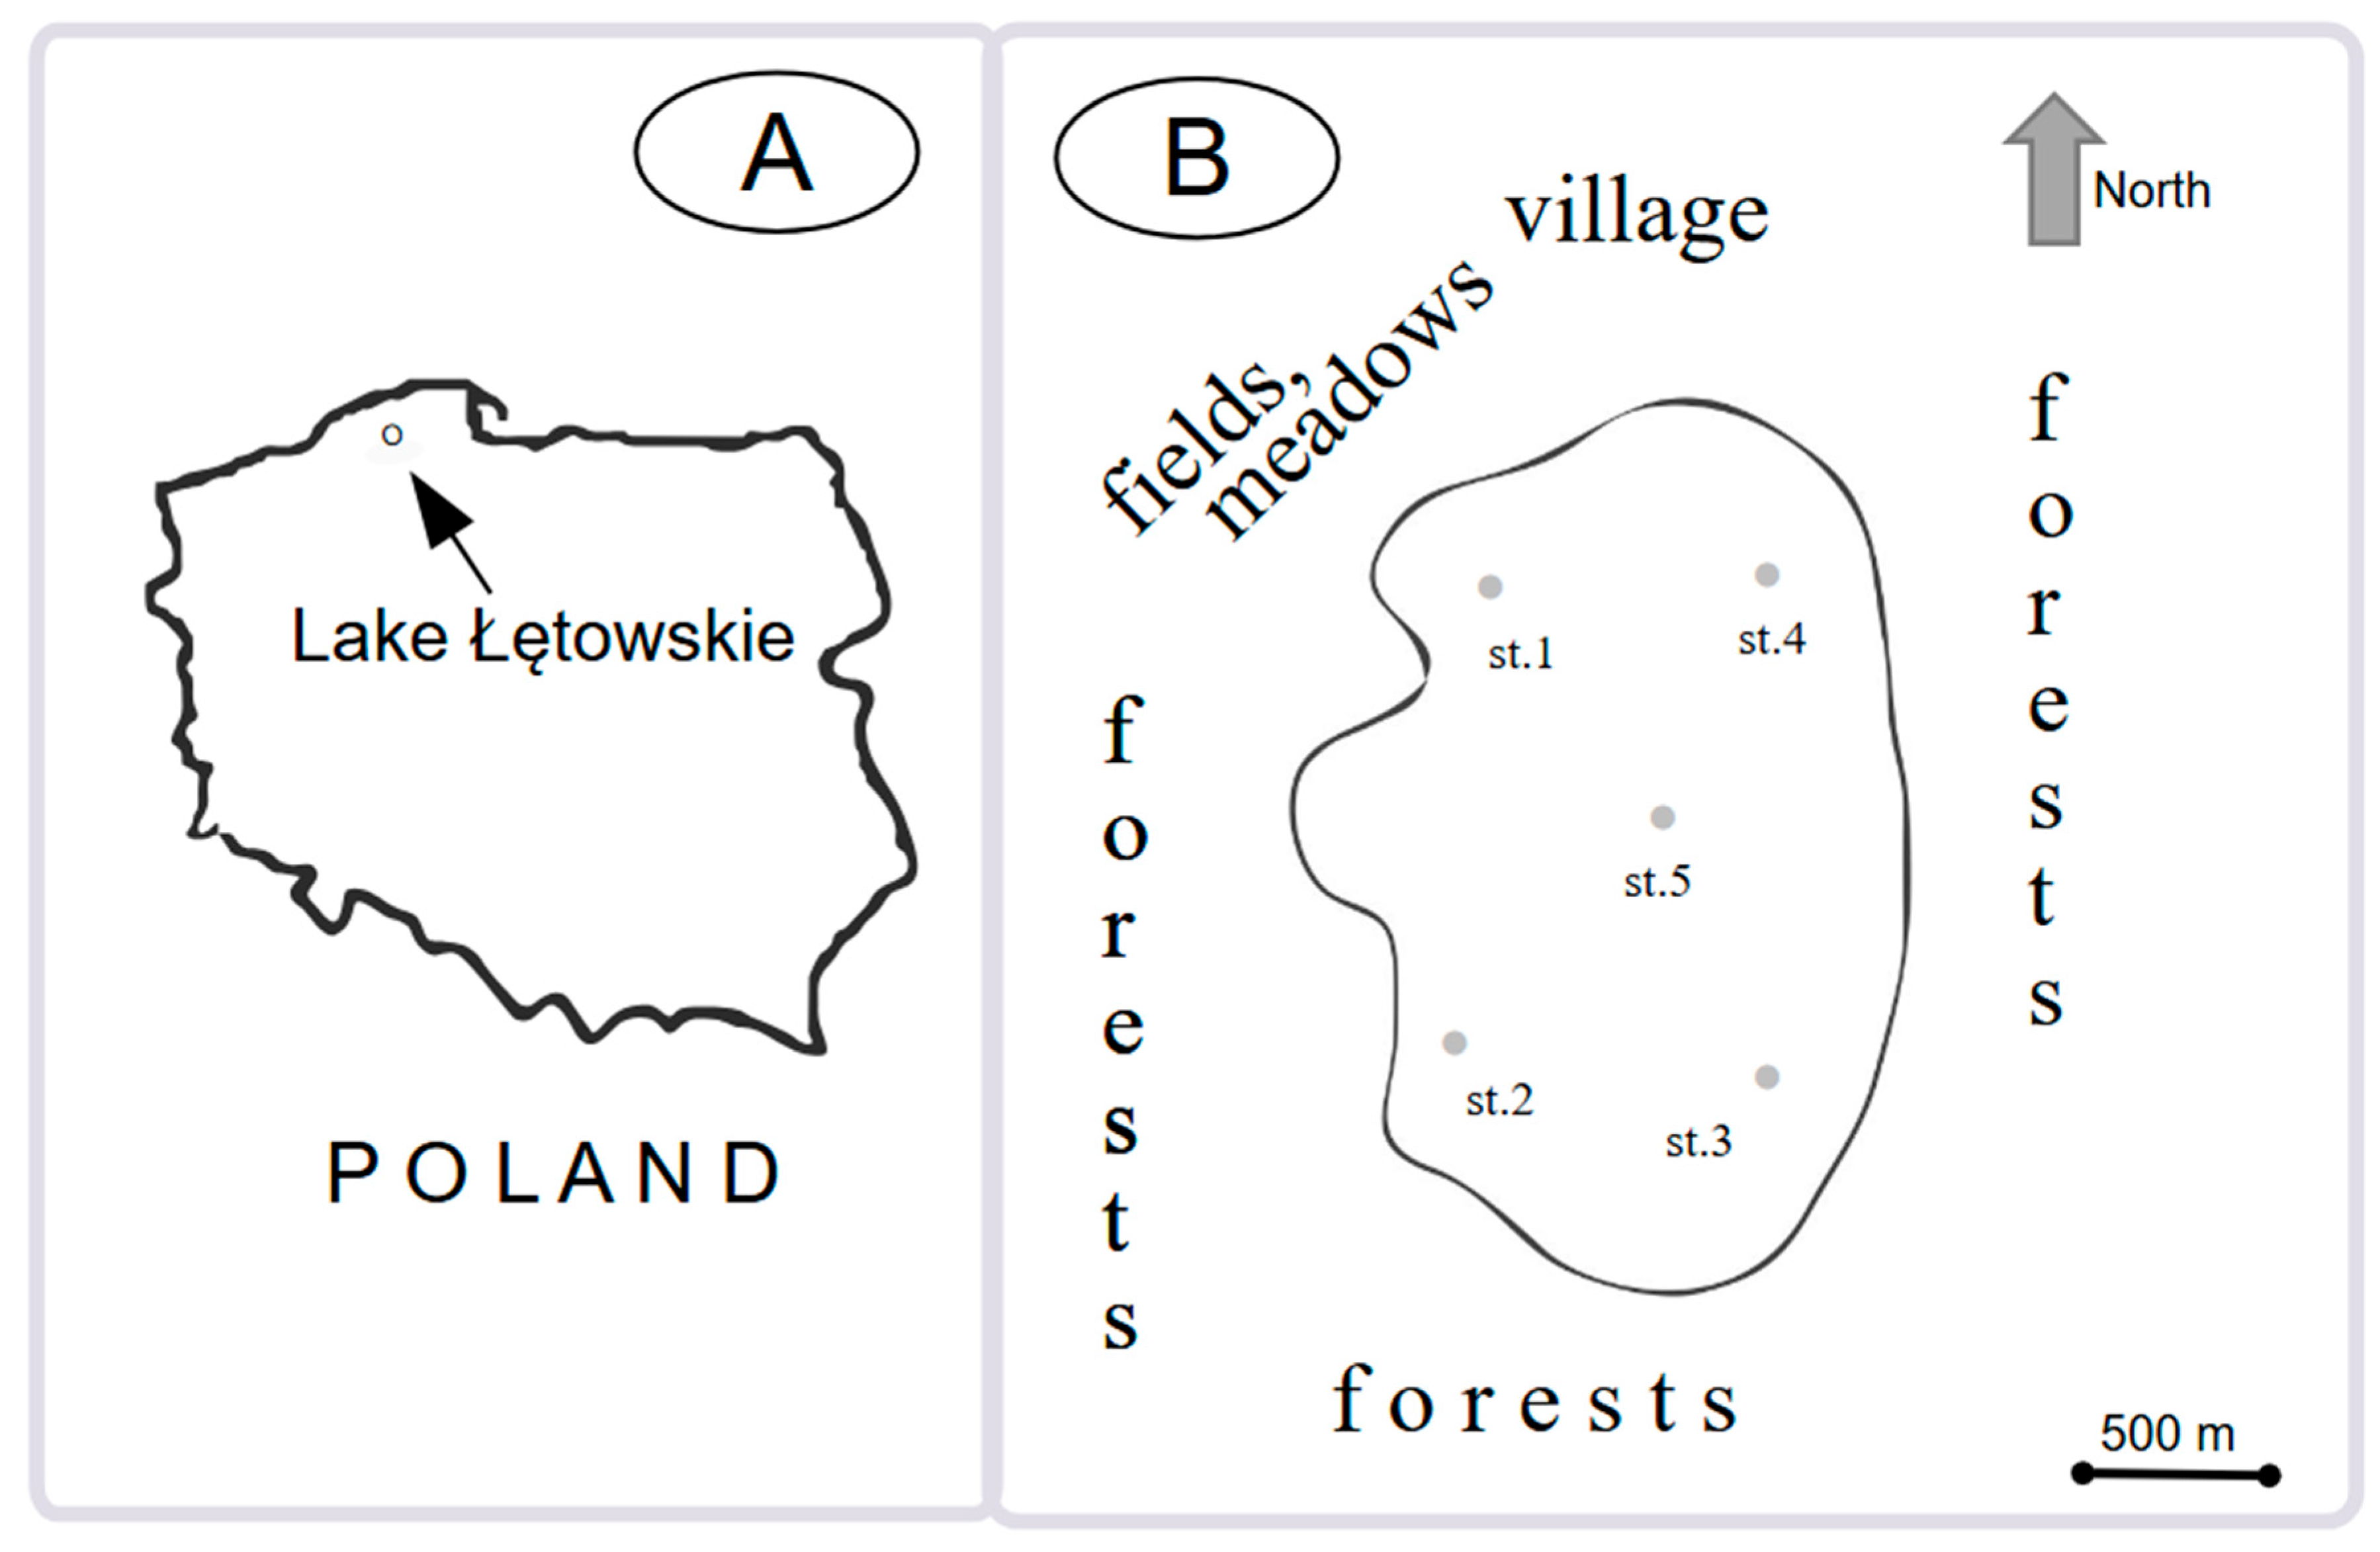
Figure 1. The location of Lake Łętowskie on the contour map of Poland (A). Location of the sampling stations on Lake Łętowskie (B).
Limnolrev 25 00049 g001
Figure 2. Obtained concentrations of analysed m/z VOCs at the test sites of Lake Łętowskie (n = 3).
Limnolrev 25 00049 g002
Figure 3. Multidimensional cluster analysis (Ward’s method, Euclidean distance) m/z concentrations of VOCs bottom sediments collected from Lake Łętowskie (A–D—clusters).
Limnolrev 25 00049 g003
Table 1. The morphometric data of Lake Łętowskie according to Brodzińska et al. [18].
Parameter and UnitValue
Latitude and longitude54°16.2′–16°49.7′
Surface area [ha]402.0
Volume [103 m3]33,128.5
Maximum depth [m]18.7
Average depth [m]8.2
Maximum length [m]2800
Maximum width [m]1900
Table 2. Basic statistical parameters for the studied m/z VOC in bottom sediments of Lake Łętowskie.
m/zMeanMedianMin.Max.Lower QuartileUpper QuartileSDCV
uppbppbppbppbppbppbppb%
579.849.457.2915.638.1511.032.2723.10
6112.9111.629.0822.289.7614.913.9830.79
631.141.160.412.060.751.430.4337.88
694.394.063.306.943.664.541.0423.79
752.441.981.186.111.463.431.3655.52
811.121.000.493.130.671.320.6658.45
833.663.451.835.713.223.901.0127.59
852.522.491.424.331.953.260.8132.02
872.162.061.134.111.512.750.8237.99
951.381.370.832.100.991.750.4129.37
973.312.521.706.702.364.341.4644.25
992.121.931.085.041.672.260.9142.88
1013.633.242.017.013.073.801.2935.47
1095.454.923.108.583.917.101.7432.03
1112.031.790.894.271.252.960.9546.68
1273.553.272.066.192.654.501.1131.37
1291.321.190.662.620.981.600.4735.46
1371.051.060.112.530.471.590.6461.26
1490.650.670.141.340.260.900.3959.98
1573.172.901.675.402.284.101.1335.60
Table 3. Results of the ANOVA test and the pairwise Tukey test for m/z VOC with respect to st. 1–5 on Lake Łętowskie.
m/zFpTukey Test
633.94*st. 4–st. 2
757.93**st. 1–st. 3, st. 1–st. 4, st. 1–st. 5
833.54*ns
853.65*st. 1–st. 5
973.90*ns
1095.81*st. 1–st. 4, st. 1–st. 5
1113.63*ns
1573.76*ns
Explanations: st.—sampling station, ns—nonsignificant, *—p < 0.05, **—p < 0.01.
Disclaimer/Publisher’s Note: The statements, opinions and data contained in all publications are solely those of the individual author(s) and contributor(s) and not of MDPI and/or the editor(s). MDPI and/or the editor(s) disclaim responsibility for any injury to people or property resulting from any ideas, methods, instructions or products referred to in the content.