Article

Consequences of the Construction of a Small Dam on the Water Quality of an Urban Stream in Southeastern Brazil

by
Lucas Galli do Rosário
1,*,
Ricardo Hideo Taniwaki
2 and
Luis César Schiesari
3,*
1
Graduate Program in Sustainability, University of São Paulo, Avenida Arlindo Béttio 1000, São Paulo 03828-000, SP, Brazil
2
Center for Engineering, Modeling and Applied Social Sciences, Federal University of ABC (UFABC), Avenida dos Estados 5001, B. Santa Terezinha, Santo André 09280-560, SP, Brazil
3
School of Arts, Sciences and Humanities, University of São Paulo, Avenida Arlindo Béttio 1000, São Paulo 03828-000, SP, Brazil
*
Authors to whom correspondence should be addressed.
Limnol. Rev. 2025, 25(4), 48; https://doi.org/10.3390/limnolrev25040048
Submission received: 15 July 2025 / Revised: 26 September 2025 / Accepted: 3 October 2025 / Published: 5 October 2025
(This article belongs to the Special Issue Functional Ecology of Urban Streams)

Abstract

The growth of the human population, combined with climate change, has made the provisioning of water resources to human populations one of the greatest challenges of recent decades. One commonly adopted solution has been the construction of small dams and reservoirs close to urban settlements. However, concerns have arisen that, despite their small size, small dams may have environmental impacts similar to those known for large dams. The severe water crisis observed between 2014 and 2015 led to the multiplication of small dams in southeastern Brazil, such as the one built on the Fetá stream at the Capivari River basin in the municipality of Louveira. This study aimed to contribute to the assessment of the impacts of small dam construction on water quality by monitoring basic parameters and nutrients during the filling and stabilization period of the Fetá reservoir. As expected, the interruption of water flow and the increase in water residence time led to increases in temperature, pH, electrical conductivity, dissolved oxygen and concentrations of dissolved carbon and nitrogen, as well as a reduction in turbidity. Consistent with the shallow depth of the water column, neither thermal nor chemical stratification was observed. Nevertheless, the water quality of surface and bottom layers was markedly different. Over time, water volume and water quality tended to stabilize. This research clearly demonstrates that small dams and reservoirs cause qualitatively similar environmental impacts to those of large-scale dams and reservoirs worldwide.

1. Introduction

The human population has been placing a significant, growing demand on the world’s freshwater reserves. Meeting this demand without jeopardizing other ecosystem services is one of the greatest environmental challenges of current times, requiring well-coordinated efforts to protect and properly manage existing water resources [1].
This challenge is further compounded by anthropogenic actions that have contributed to the intensification of climate change over the past decades. A combination of rising temperatures, decreasing rainfall, and intense seasonal drought periods has driven some of the most severe global water crises in recent history [2], which rank among the most financially damaging natural disasters worldwide [3]. This global trend was also observed in southeastern Brazil, where in 2014 and 2015, water availability and, consequently, the supply of water for basic human needs were drastically reduced [4].
Countries severely affected by the water crisis adopted emergency contingency plans, primarily selecting new watersheds with suitable hydrological regimes as alternative sources for temporary surface water retention and storage, thereby increasing water reserves [5]. This solution included the construction of new water storage and retention structures that could be managed by public authorities based on consumption needs, and the specific requirements of each beneficiary region [6].
In watersheds extensively occupied by human populations, a commonly adopted engineering alternative was the construction of small dams. The small size of these dams was envisioned as permitting water reservation in previously unexplored tributaries, sometimes in strategic locations close to end users—such as in and around urban settlements—while being cost-effective in both construction and operation. However, concerns quickly emerged that small dams could have many of the same environmental impacts as large dams. Worse, the construction of small dams could lead to an even finer segmentation of drainage networks by penetrating low-order streams. Recent studies indicate that even small reservoirs can significantly alter hydrological and ecological processes, with impacts on connectivity and water quality [7,8].
Alarmingly, it has been reported that there are currently 847,000 dams affecting at least 60% of the world’s watersheds [9]. Overall, the construction of dams disrupts natural river flows, causing significant and often irreversible changes in hydrology. Such changes extend beyond hydrology to biogeochemical cycles, as dams regulate the transport and transformation of carbon, nitrogen and phosphorus at the global scale [10]. Increased water retention times tend to raise water temperature, pH and the concentrations of ions and nutrients necessary for primary production. Consequently, dam construction frequently leads to harmful algal blooms, among other environmental impacts [11]. In tropical reservoirs, the intensity of these effects may depend strongly on morphology and depth, with shallow systems showing more limited but still detectable vertical differentiation [12,13]. Moreover, reservoirs have also been recognized as important sources of greenhouse gases, particularly methane, adding a global climate dimension to their impacts [14].
This study aimed at analyzing the consequences, for water quality, of the construction of a small dam in response to the severe 2014–2015 water crisis in southeastern Brazil. Integrating this local case into the broader literature, our work highlights how the responses of small tropical reservoirs may both align with and diverge from global patterns, depending on depth, hydrology and land use context [13]. This research, therefore, contributes to furthering our understanding regarding the impacts of small dams by focusing on a geographic, socioeconomic and environmental context that is considerably distinct from those reported in the prevailing literature, based on the Global North. Specifically, this study tests the following hypotheses: (H1) The construction of the dam will lead to significant changes in water quality in the reservoir as compared to upstream lotic reaches. Specifically, the decrease in water velocity will promote the sedimentation of suspended particles, reducing turbidity in surface layers. The increased water residence time will facilitate the accumulation of thermal energy and matter, leading to an increase in temperature, electrical conductivity and concentrations of dissolved carbon, nitrogen and dissolved ions. Additionally, greater incidence of solar radiation will favor phytoplankton photosynthesis, reducing inorganic carbon, increasing dissolved oxygen and elevating pH. (H2) The interruption of water flow will increase the height of the water column, creating distinct characteristics between the surface and bottom. Specifically, higher incident solar radiation and primary production are expected to lead to higher temperatures, pH and dissolved oxygen concentrations in surface layers, while sedimentation is expected to lead to higher concentrations of dissolved ions, turbidity, carbon and nitrogen in deeper layers. However, seasonal thermal stratification is not expected due to the reservoir’s shallow depth (~5 m). (H3) Over time, a clear trend of environmental water quality stabilization in the reservoir is expected, as evidenced by reduced temporal variability in water quality parameters.

2. Materials and Methods

Study area. Louveira is a municipality in the Metropolitan Region of Jundiai in Southeastern Brazil with 51,847 inhabitants [15]. The Fetá stream sub-basin, entirely located within Louveira, was selected for the construction of the reservoir. It belongs to the Piracicaba–Capivari–Jundiaí river basins, draining into the Capivari river, a left-bank tributary of the Tietê River [16]. Its geographic location and the distribution of upstream, reservoir, and downstream monitoring stations are shown in the study area overview (Figure 1). Altitude varies between 665 and 950 m, and the climate is classified as a humid subtropical oceanic climate (Cfa) according to Köppen–Geiger [17]. It has an average annual temperature of 21 °C and annual rainfall of 1462 mm. Rainfall is higher in summer months (October to March) and lower in winter months (April to September) [18]. Land cover is dominated by pastures and manmade fields (57.1%), followed by agricultural crops (28.2%), natural vegetation (5.6%), urban and industrial areas (4.9%) and silviculture (3.2%) [16].
The reservoir. The scarcity of water resources between 2013 and 2015 motivated the construction of a water reservoir to supply the municipality. The Fetá stream, a third-order stream and tributary of the Capivari river, in turn a tributary of the left bank of the Tietê river, was selected to build this reservoir. The Fetá stream is approximately 2000 m long, with an average width of 1 m and a maximum depth of 0.5 m (Figure 1). The Fetá stream sub-basin exhibits hilly terrain with slopes ranging from 0% to 20% and low-lying river plains (25–100 m) in width. The 100 m riparian buffer zone along the stream is predominantly flat to gently undulating (0–15%), while steeper slopes (above 15%) are less frequent [19]. According to a GIS analysis based on the classification of land-cover characteristics for each identified class, agricultural crops and pastures represented the largest portion of the Fetá stream sub-basin (43%), followed by forest fragments (31%), urban areas (21%), and riparian vegetation (5%). Within a 100 m buffer along the stream upstream of the reservoir, land cover was dominated by riparian vegetation (54%), followed by forest fragments (23%), agricultural crops (13%), and urban areas (10%).
The Fetá dam and reservoir were built between 2019 and 2021. The floodgates were closed on 28 December 2021, and the reservoir began filling and operating in January and February 2022. The dam, built with a mixed earth and concrete structure, is 160 m long, 30 m wide, and has an average height of 10 m. This dam was built to impound water in a reservoir occupying 103,875 m2 and with a water retention capacity of 465,217 m3. The project predicted a water level for the operating regime at 4.50–5.00 m, a captured water flow rate of 0.15 m3 s−1, and a regulated water flow rate downstream of the spillway of 0.052 m3 s−1. The projected water management had the premise of a standard daily capture of approximately 6912 m3 s−1; this fixed capture volume considered exclusively the annual water flow availability of the Fetá stream.

2.1. Sampling Design

Monitoring stations. Eight points were selected along the length of the stream to monitor the physical and chemical conditions of the water quality throughout the reservoir’s filling and stabilization phases (Figure 1, Table 1). Points MS-1 and MS-2 were positioned upstream of the projected reservoir. Points MS-3, MS-4, MS-5 and MS-6 were positioned within the structure of the projected reservoir. Points MS-7 and MS-8 were positioned downstream of the dam. This spatial distribution of the monitoring stations sought to capture both points clearly located in the riverine zone (MS-1, MS-2, MS-7 and MS-8) and points clearly located in the future lacustrine zone (MS-3, MS-4, MS-5 and MS-6); point MS-3 was intended to represent the transition zone, although the exact location of the transition zone could only be defined after the sampling was conducted. At all points, samples were taken from the subsurface of the water (i.e., at a depth of 10 cm). At points MS-3, MS-4, MS-5 and MS-6, and after the rising water levels, additional profiling was carried out with samples taken at every 50 cm of depth.
Sampling period and frequency. Sampling began on 4 January 2022, seven days after the gates were closed. During the filling period (i.e., until the operating level of 4.5–5 m was reached; January and February 2022), sampling was weekly; thereafter, in what we refer to as the stabilization period (March to June 2022), sampling occurred monthly. There were 21 field campaigns in total.
Monitored parameters. To quantify the basic physicochemical parameters, a HANNA® HI 98194 multi-parameter meter coupled to a 5 m cable with pH, temperature (°C), oxidation-reduction potential (mV), conductivity (µS cm−1), and dissolved oxygen (mg L−1) electrode probes was used. For turbidity and nutrient analysis, water samples were collected using a Van Dorn bottle. Turbidity was analyzed in the field with a HANNA® HI 98703-02 turbidimeter. In each sampling date, all the equipment used in the field was calibrated with reference standards meeting the quality criteria of ABNT NBR ISO/IEC 17025:2017 (Certificate E10583B/22).
Water samples for nutrient analysis were stored in 50 mL Falcon tubes and frozen until analysis. In the laboratory, samples were thawed, filtered through a 0.45 μm Filtrilo ester cellulose membrane and analyzed for total dissolved carbon (TDC) and its fractions, dissolved inorganic carbon (DIC) and dissolved organic carbon (DOC), as well as total dissolved nitrogen (TDN) using a TOC-L Shimadzu analyzer coupled with a TNM-L Shimadzu measuring unit (Shimadzu, Kyoto, Japan).

2.2. Statistical Analyses

Spatial patterns. Spatial patterns in water quality were analyzed using Principal Component Analysis (PCA), a multivariate technique widely recognized as appropriate for reducing dimensionality and revealing major environmental gradients in ecological datasets with correlated variables [20,21]. This approach provides a robust representation of spatial structure in limnological variables.
Depth comparisons. To test for differences between subsurface and bottom samples, we applied either Student’s t tests or Mann–Whitney tests, depending on whether the assumptions of normality and homogeneity of variances were satisfied. This procedure ensures that depth comparisons are statistically valid and adjusted to the data distribution, thereby strengthening the reliability of inferences [22].
Temporal patterns. To assess temporal trends in water quality, we performed simple linear regressions of each response variable against Julian date in each station. This method, widely used in limnological studies, is sufficient to detect directional changes in short-term environmental time series [23].
Stabilization. To evaluate potential stabilization trends, we conducted F-tests for equality of variances, contrasting, for each station and response variable, the seven initial sampling dates (04, 06, 10, 13, 17, 20, and 24 January 2022) with the seven final ones (28 March, 4 and 14 April, 13 and 30 May, 10 and 27 June 2022). Significant reductions in variance were interpreted as indicative of stabilization in water quality variables, providing an objective assessment of system behavior over time. All statistical analyses were performed with the aid of the PAST software (version 4.15) [24], which is widely adopted in ecological and limnological research. Graphics were produced using RStudio software version 4.5.1, with the aid of the ggplot2 package. The procedures applied here are considered appropriate and sufficient to address the objectives of the study, offering a robust evaluation of both spatial patterns and temporal variation.

3. Results

3.1. The Reservoir Filling Period

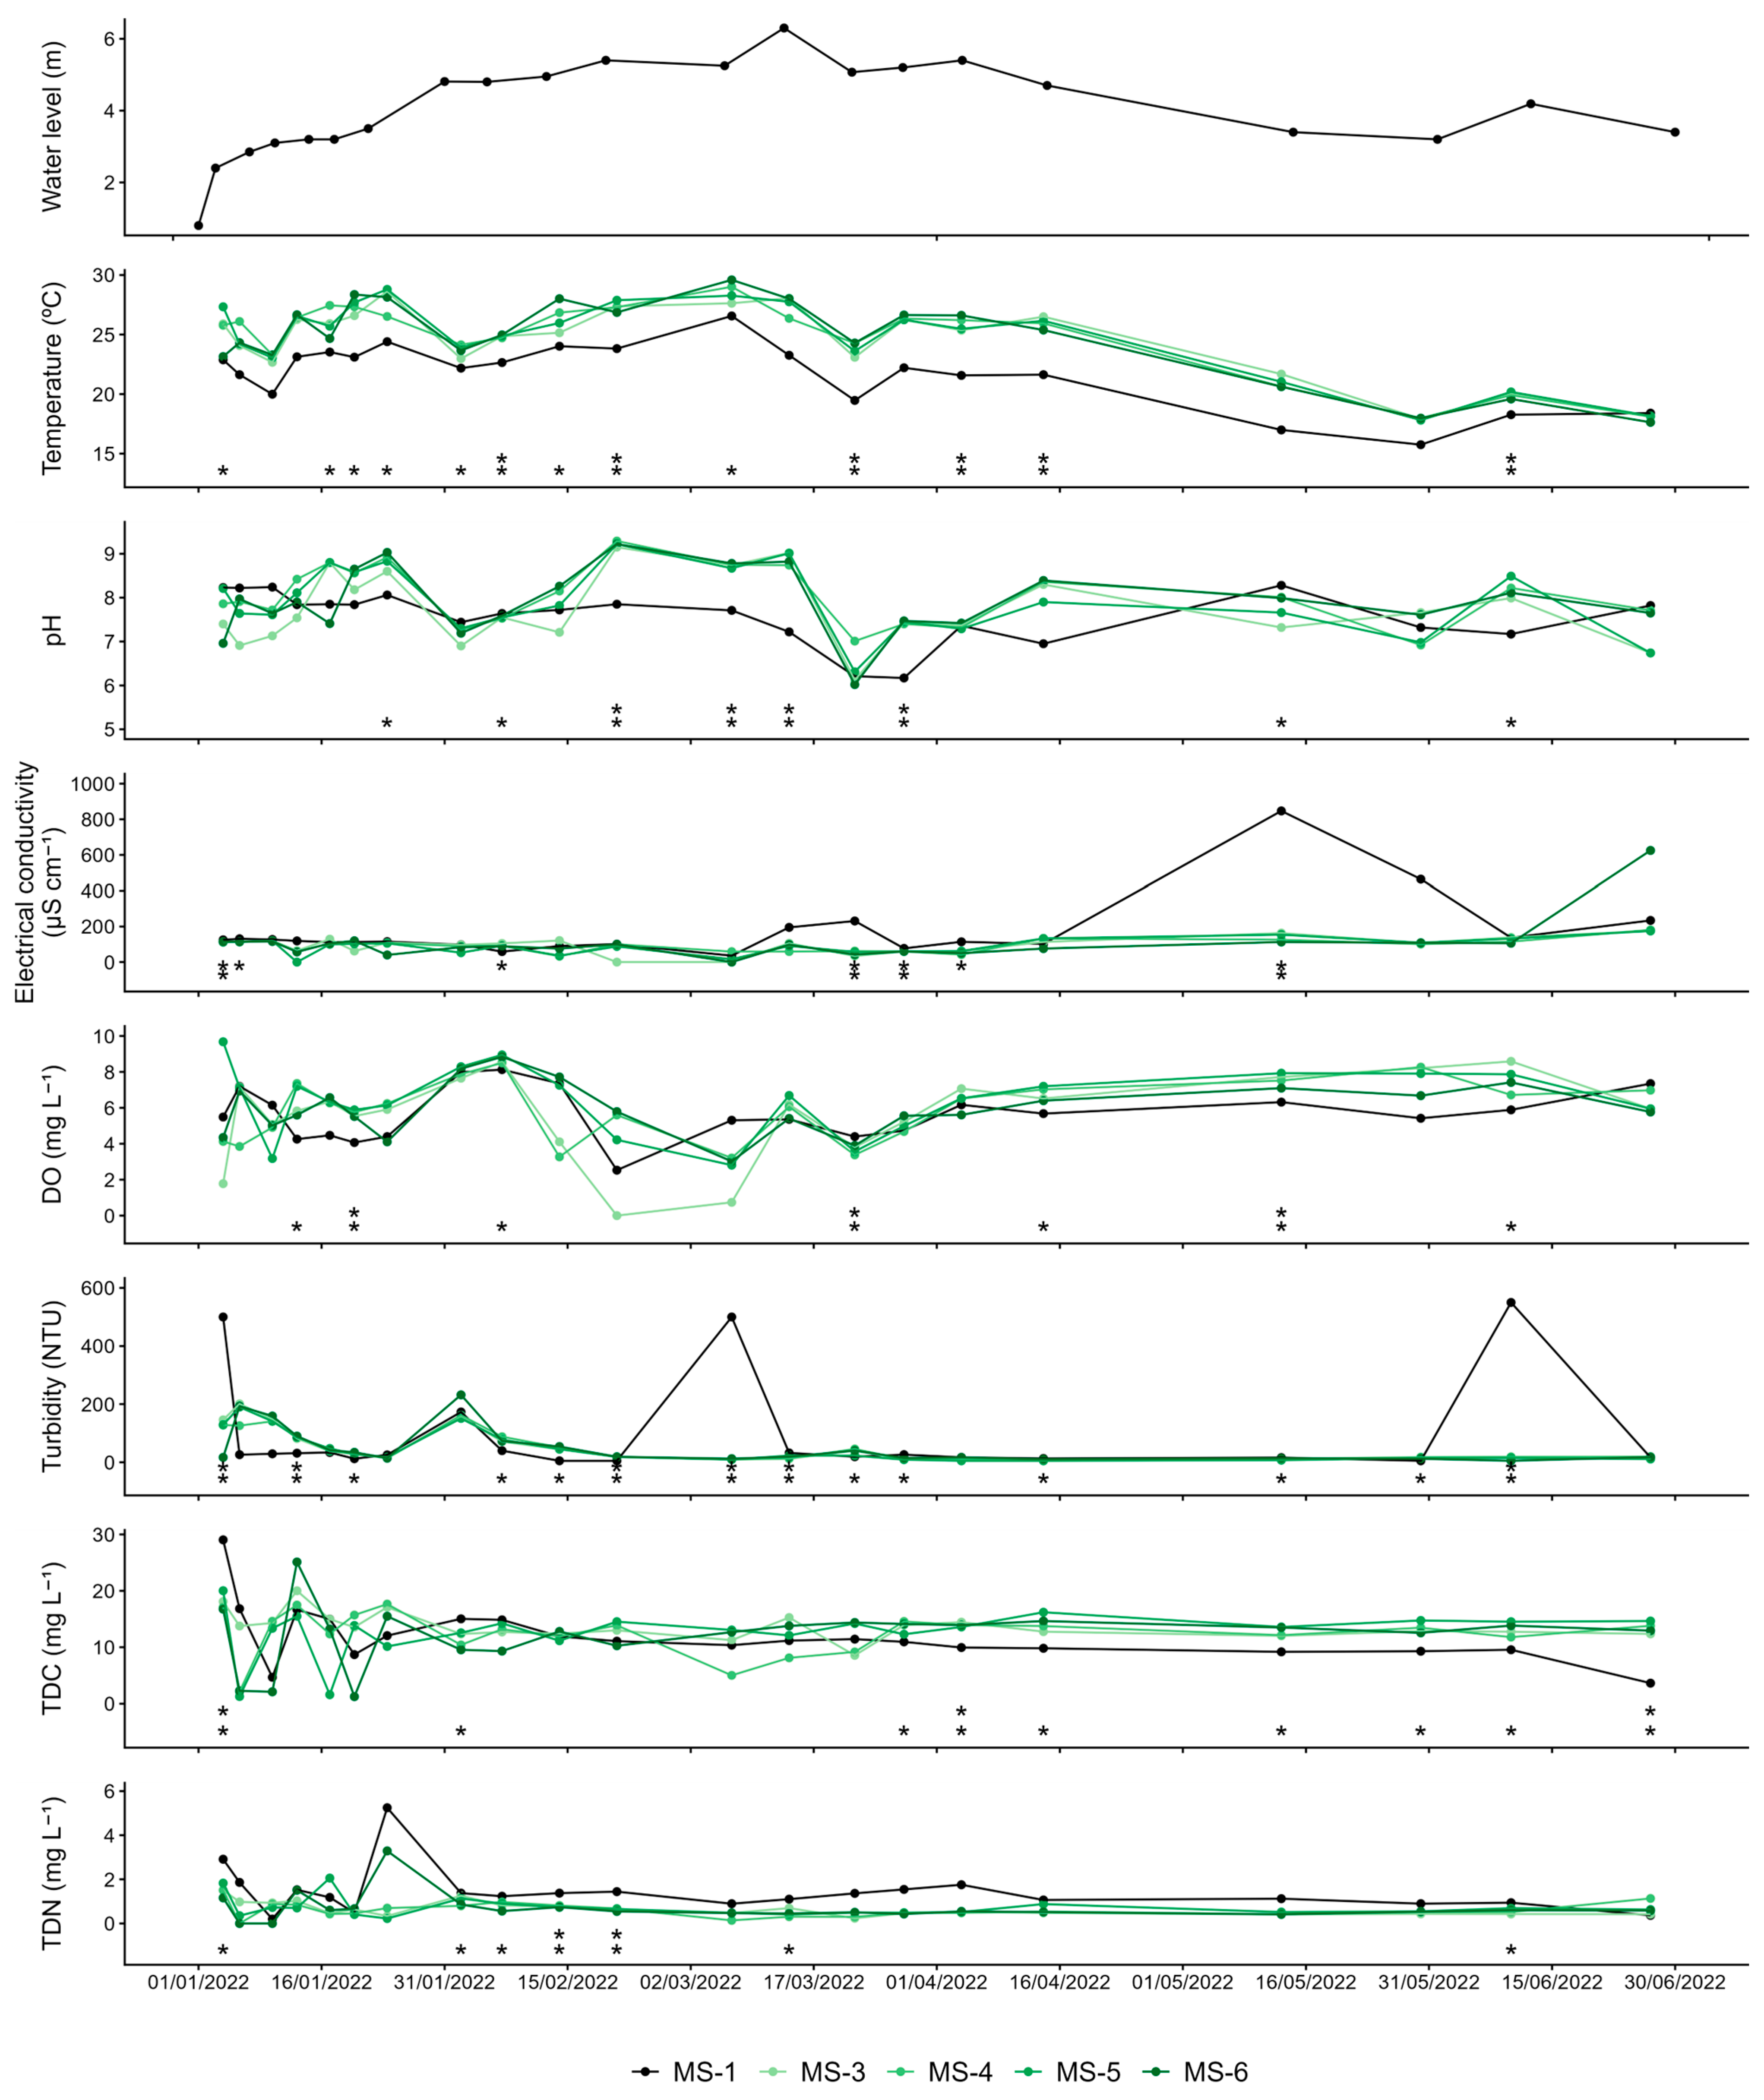
Water level rose continuously in the weeks following the closure of the dam’s gate (28 December 2021). In the first week, it reached approximately 2.5 m (6 January 2022) and, by the fourth week, 3.5 m (24 January 2022). The projected operational water column level of 4.5–5 m was achieved after five weeks (2 February 2022). The highest operational water column level (5 m) was recorded in the seventh week (14 February 2022), therefore completing the reservoir’s filling process in less than two months. A marked increase was also registered in mid-March, when the maximum level of 6 m was observed (14 March 2022). From this point forward, the water column fluctuated within the operational range, with the lowest level being 3.2 m (30 May 2022). Overall, the observed variations in water level reflected local hydrological conditions (Figure 2; Figure S2—Supplementary Material) as well as water withdrawals during the study period.

3.2. Spatial and Temporal Water Quality Patterns in the Stream and Reservoir

Temperature varied markedly over time and between monitoring stations (Figure 2). A drop in temperature over time was detected at all monitoring stations (significant for six of the eight monitoring stations), as observed by the negative slope for the regressions between temperature and Julian date (Table S1—Supplementary Material). Comparing the variance of temperatures between the first seven and last seven sampling dates, a trend of increasing variance in temperature over time was observed at six of the eight monitoring stations, although significant at only one of them (Table S2—Supplementary Material). Comparing within each sampling date, monitoring stations in the reservoir (MS-3, MS-4, MS-5 and MS-6) possessed surface temperatures very similar to each other, and in most cases (13 of the 21 dates), significantly higher than surface temperatures of the lotic upstream monitoring station (MS-1) (Figure 2).
pH also varied over time and between monitoring stations, although less clearly than did temperature. There was a slight reduction in pH over time, although in only two sampling stations this reduction was significant (Table S1—Supplementary Material). Four monitoring stations showed a decrease in variance over time, none of them significant; another four stations had an increase in variance over time, two of which were significant and both at lotic stations (Table S2—Supplementary Material). Significant differences in pH among sampling stations were observed in eight of the 21 sampling dates; on five of these dates, pH values at the lotic upstream station were lower than the pH values at the reservoir sampling stations.
Electrical conductivity was marked by an extreme value (847 µS cm−1) at the lotic upstream point on 13 May 2022. Otherwise, electrical conductivity values varied between 464 and 33 µS cm−1, without a clear temporal trend of change. An increase in electrical conductivity over time was observed in seven of the eight monitoring stations throughout the monitoring period (significant for one of these seven monitoring stations), as demonstrated by the positive slope in the regressions (Table S1—Supplementary Material). At all monitoring stations variance in conductivity tended to increase over time. This increase in variance was significant in four of eight monitoring stations; these stations included both lotic and lentic sampling stations (Table S2—Supplementary Material). Significant differences in conductivity among sampling stations were observed on seven of the 21 dates; on six of them, all in monitoring stations inside the reservoir, electrical conductivity values were lower than those observed in the lotic upstream station.
Dissolved oxygen too varied over time and between monitoring stations. The concentrations of dissolved oxygen were lower (reaching 2.5 mg L−1) at the upstream monitoring station and higher in the reservoir (reaching 8.50 mg L−1). Dissolved oxygen increased over time at six of the eight monitoring stations, as observed by the positive slope of the regressions; however, no trend was significant (Table S1—Supplementary Material). Variance in dissolved oxygen concentrations decreased over time at eight monitoring stations, but only in one of them was this decrease significant (Table S2—Supplementary Material). Monitoring stations in the reservoir generally had very similar concentrations of surface dissolved oxygen. On seven of the 21 sampling dates, significant differences were observed in the monitoring stations, and on six dates, the monitoring stations in the reservoir had higher concentrations of dissolved oxygen than the lotic upstream monitoring station.
In the case of turbidity, the monitoring station upstream of the reservoir suffered a very large variation in observed values (between 500 and 550 NTU), one much higher than that observed at the monitoring stations located inside the reservoir (between 6.14 and 162 NTU). Turbidity declined over time at all monitoring stations (significantly so for six of them) (Table S1—Supplementary Material). Comparing the variance of turbidity between the first seven and last seven sampling dates, the reduction trend is clear, being significant for seven of the eight monitoring stations (Table S2—Supplementary Material). No clear spatial pattern was observed, since on half of the 14 monitoring dates, higher turbidity values were observed at the monitoring station upstream of the reservoir, while on the other half, the opposite was observed.
Total dissolved carbon concentrations fluctuated greatly during the filling period but became relatively constant from February onwards. On nine of the 21 sampling dates, TDC values differed significantly between monitoring stations upstream and within the reservoir; on seven of them, concentrations were higher in the reservoir than in the lotic upstream stretch. TDC decreased over time at five of the eight monitoring stations (significant for two of these five stations; Table S1—Supplementary Material). Variance in TDC declined over time in all sampling stations, significantly so for seven of them (Table S2—Supplementary Material). Most of the TDC was in the form of dissolved inorganic carbon.
Dissolved nitrogen concentrations were lower in the reservoir than in the lotic station upstream, in most sampling dates (significantly so in 7 dates). There was a temporal trend for decreasing concentrations in all sampling stations, significantly so for three of the four lotic upstream monitoring stations (Table S1—Supplementary Material). As observed for total dissolved carbon, total dissolved nitrogen concentrations fluctuated greatly during the filling period but became relatively constant from February onwards. Indeed, variance in TDN declined between the first seven and last seven sampling dates at all monitoring stations. For seven of eight sampling stations, this decline in variance over time was significant (Table S2—Supplementary Material).

3.3. Multivariate Analysis of Water Quality Patterns in the Stream and Reservoir

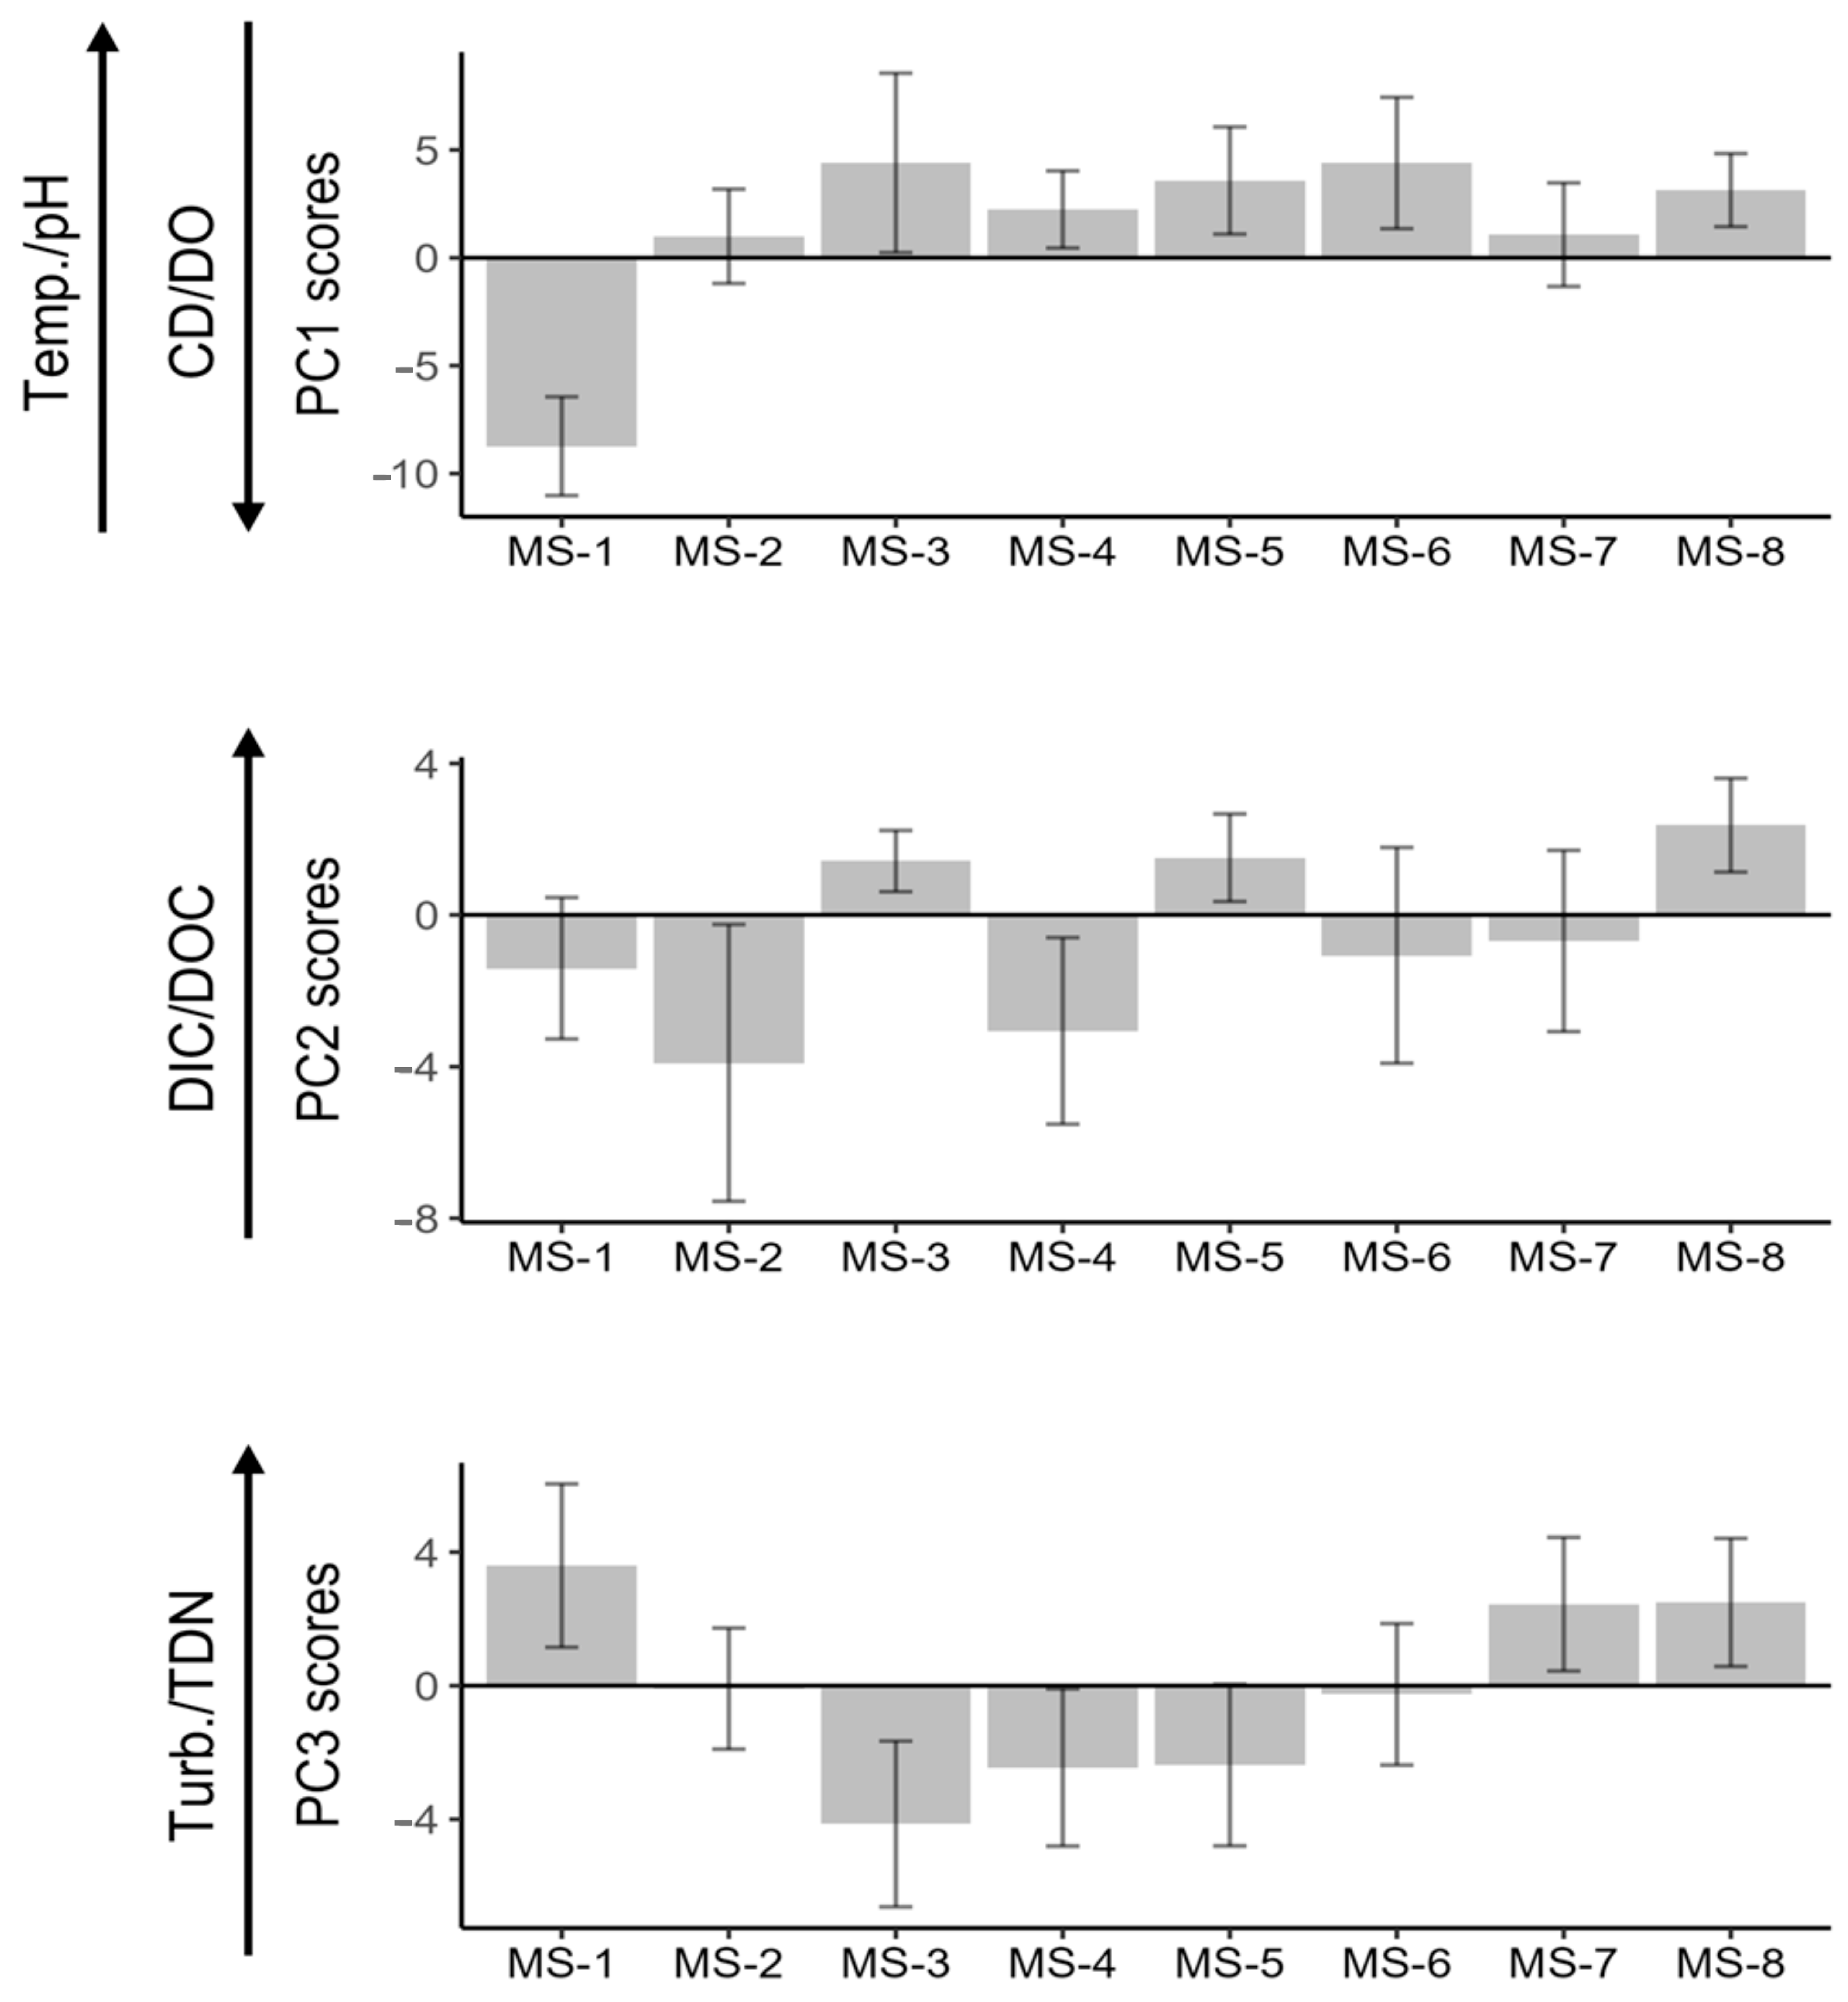
The three first principal components explained 60.26% of the total variation (PC1: 22.77%; PC2: 20.31%; PC3 17.18%). As can be observed in Figure 3, PC1 was positively influenced by temperature and pH, and negatively influenced by conductivity and dissolved oxygen concentrations. In turn, PC2 was positively influenced by dissolved inorganic carbon and dissolved organic carbon concentrations, and negatively influenced by pH and temperature. Finally, PC3 (not shown in Figure 3) was positively influenced by turbidity and dissolved nitrogen, and negatively influenced by dissolved inorganic carbon concentrations. PC1 clearly separates the monitoring station upstream of the reservoir (MS-1), with high conductivity and dissolved oxygen values, and low temperature and pH values, from all other points (Figure 4) with opposite characteristics. PC3 clearly separates the monitoring stations in lotic stretches of the stream (MS-1, MS-7 and MS-8), with high turbidity and total dissolved nitrogen values, from the monitoring stations in the reservoir (MS-3, MS-4, MS-5 and MS-6; recall that MS-2 behaved as lentic in part of the samplings), with the opposite characteristics. The association patterns of monitoring stations with PC2 are less clear.

3.4. Comparison Between Surface and Bottom Regarding Basic Physicochemical Variables and Nutrients in the Reservoir

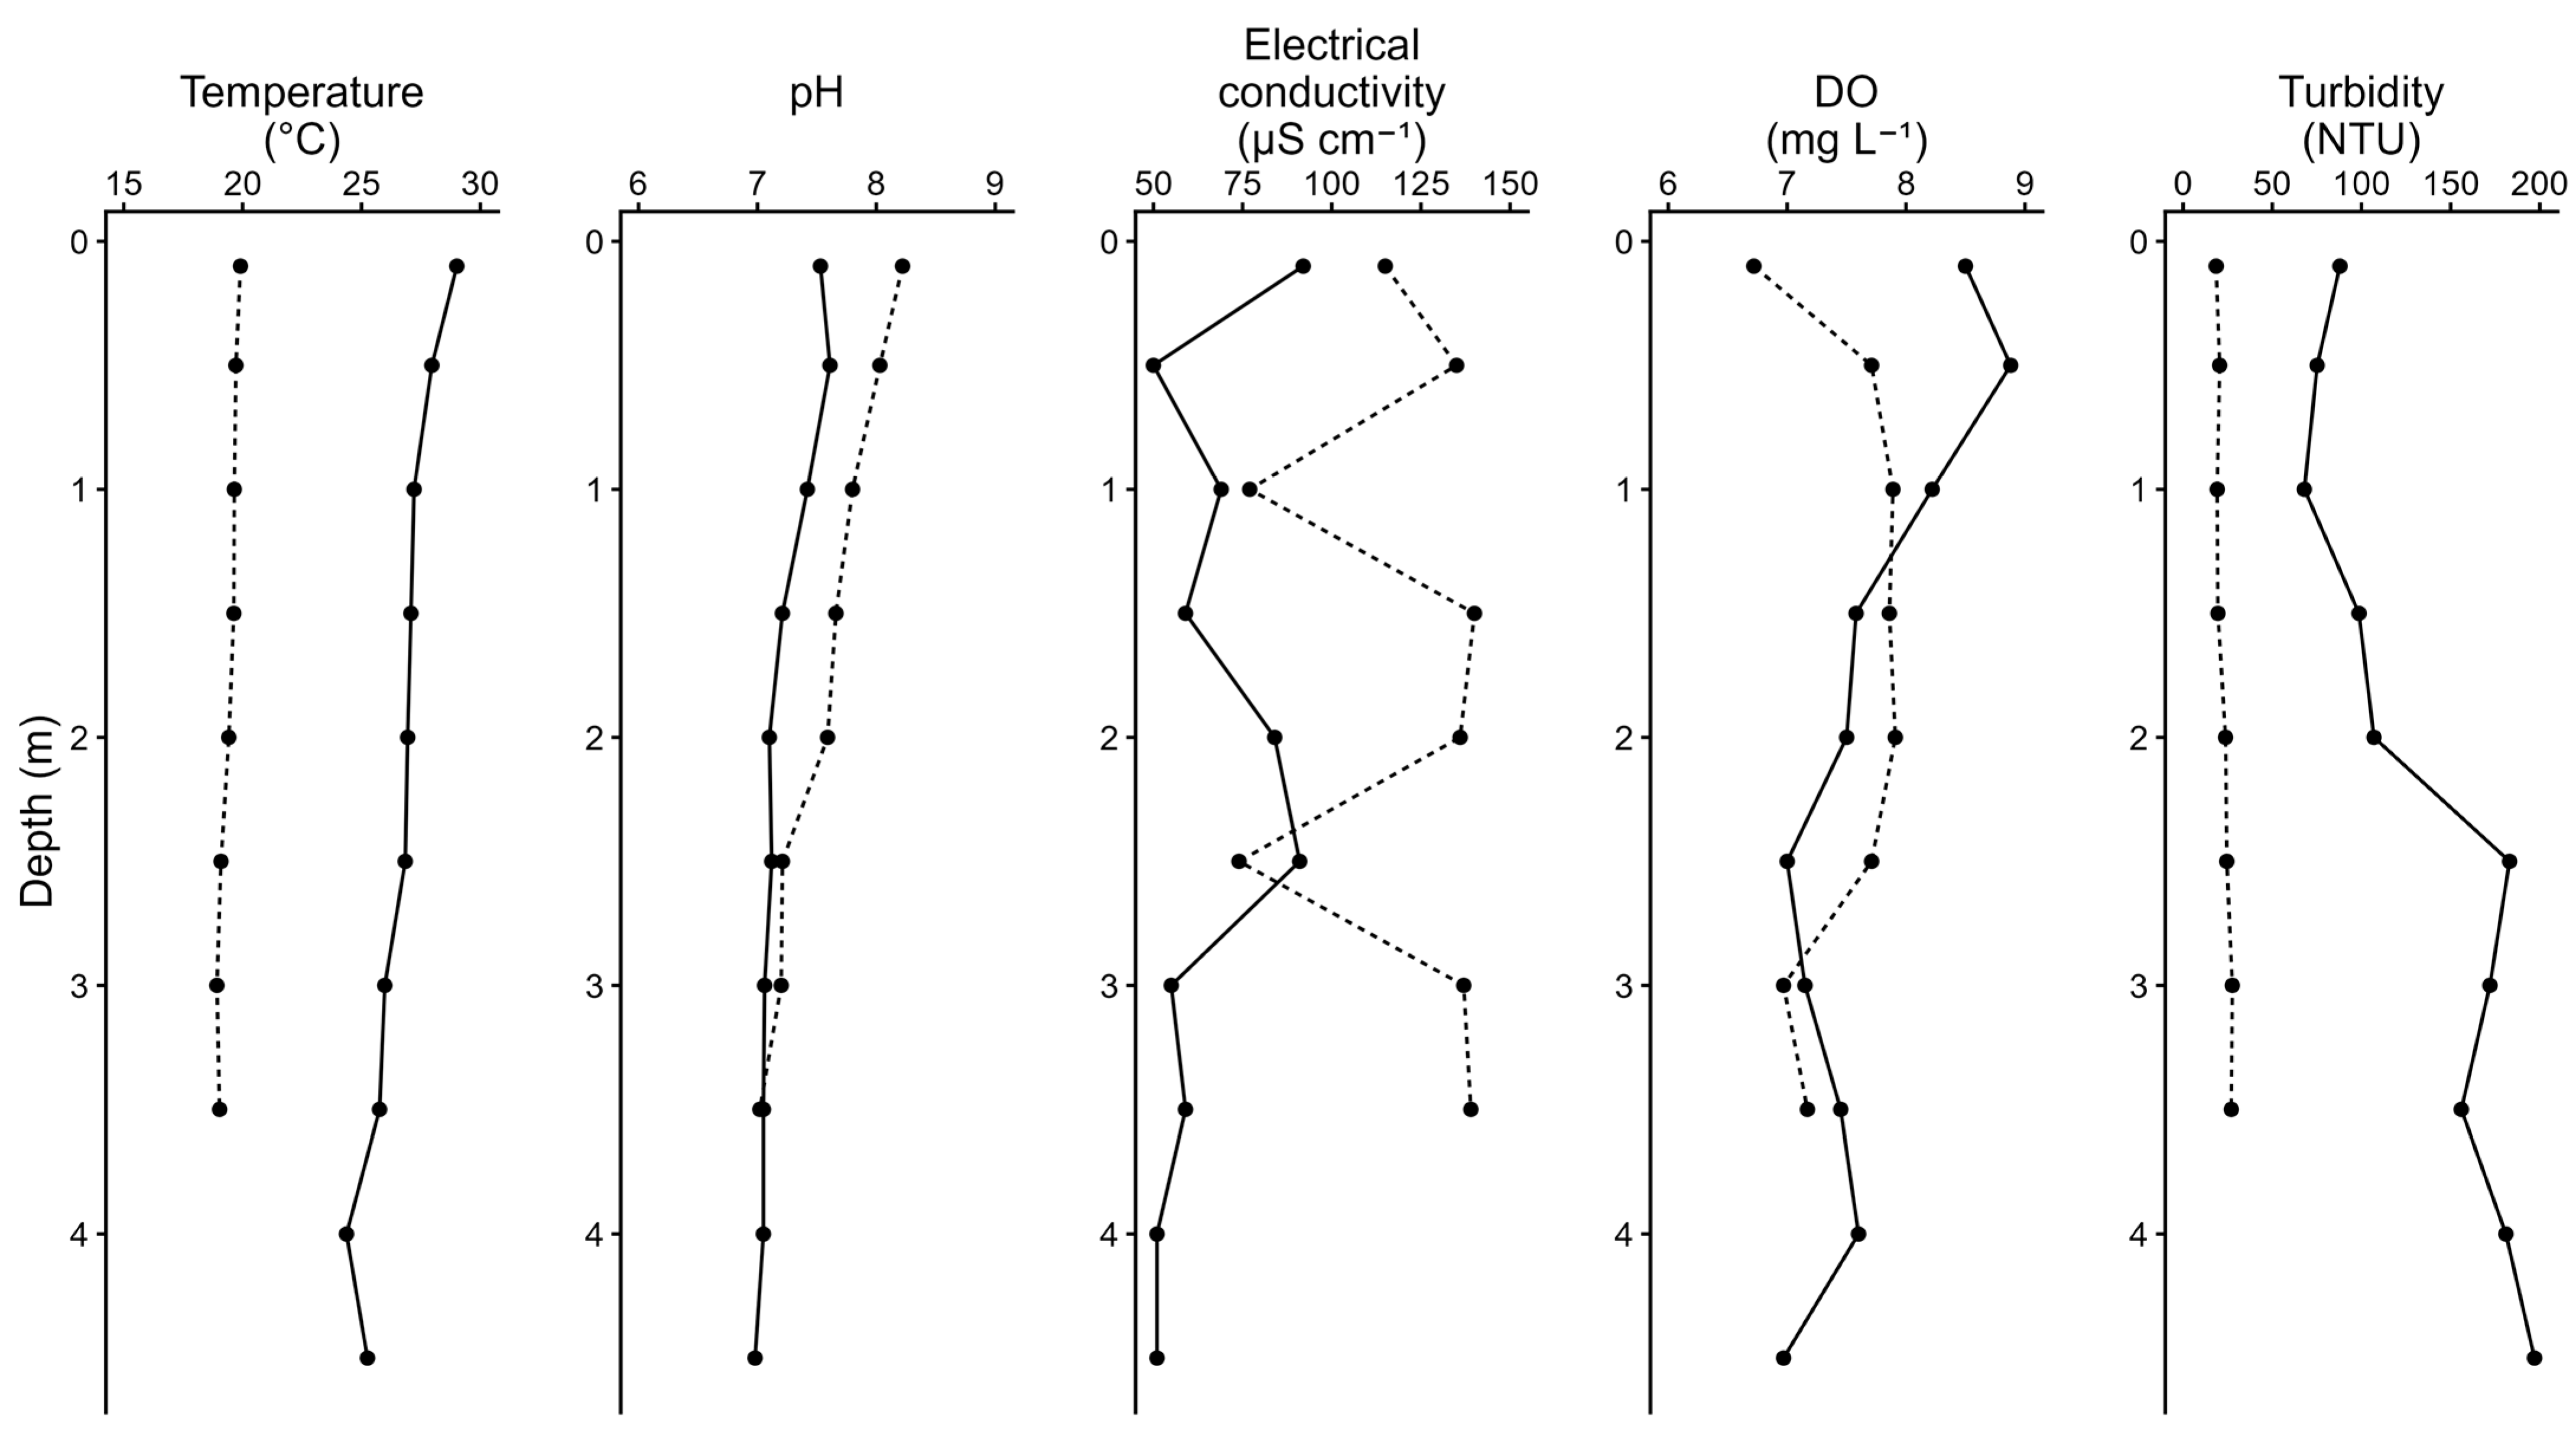
Water quality varied consistently with water depth (Figure 5). Temperature, pH, conductivity and dissolved oxygen were highest at the surface, whereas turbidity was highest at the bottom. No significant effects of water depth were observed for dissolved organic carbon, dissolved inorganic carbon, total dissolved carbon and total dissolved nitrogen concentrations. Despite this wide range of significant effects of depth on water quality, vertical profiles in temperature and other water quality parameters indicate no sign of stratification (Figure 6).

4. Discussion

The construction of small dams and reservoirs became a frequent intervention in low-order watercourses to reduce implementation costs and decentralize water production and storage [25]. However, important gaps remain about the consequences of small reservoir construction for water quality, particularly those built in urban landscapes [7]. Similar gaps have also been highlighted in tropical and subtropical regions, where small reservoirs are widespread and play a key role in hydrological regulation and aquatic ecosystem processes [26,27].
The first hypothesis proposed that the construction of the small dam and the formation of the reservoir in the Fetá stream would cause significant changes in the basic physicochemical properties of the water. Comparing surface water quality in reservoir monitoring stations with that of the upstream lotic site, the construction of the dam in the Fetá stream led to an increase of ~14% in temperature, ~4% in pH, ~6% in dissolved oxygen concentrations and ~7% in total dissolved carbon (with dissolved inorganic carbon consistently higher than dissolved organic carbon), as well as a ~53% reduction in turbidity. These patterns are widely reported in river systems modified by the construction of dams for water storage [10,28], and are consistent with observations in other small tropical reservoirs, where increased retention time typically enhances oxygen and carbon concentrations and reduces turbidity [26,29].
However, contrary to our first hypothesis, the increase in electrical conductivity at reservoir monitoring stations compared to the upstream lotic station was not confirmed, perhaps due to uptake of ions, especially nutrients, by phytoplankton in surface layers. Indeed, contrary to expectations and differing from other established reservoirs [30], total dissolved nitrogen concentrations were lower in the reservoir than in the upstream lotic station. This finding is consistent with global evidence that small reservoirs often act as nitrogen sinks through denitrification and sedimentation, particularly under warm tropical conditions [13,31]. By contrast, dissolved organic carbon appeared to accumulate in the reservoir, probably explained by increased water retention time, greater solar exposure and increased temperature, favoring CO2 solubilization in the reservoir. Globally, the environmental impacts of the small dam and reservoir construction in the Fetá stream are like those observed in large dams worldwide [27,32].
The second hypothesis proposed that the interruption of water flow, combined with the increase in water column depth, would promote specific differences in water quality between surface and bottom layers. As expected, temperature was higher in surface layers and showed a clear depth-related differentiation, as is typical of lakes and reservoirs [28]. However, there was no clear stratification pattern throughout the water column, even in the warmest months of the year (January–March 2022). Therefore, the temperature fluctuation in this study corroborates other cases of shallow tropical reservoirs that typically do not exhibit a clear pattern of stable thermal stratification, but rather daily or short-term temperature differences driven by wind action, water inflows, or outflows [12,33]. Likewise, electrical conductivity, pH and dissolved oxygen concentrations were higher, and turbidity lower, in the surface water layer, while neither carbon nor nitrogen concentrations responded to water depth. Yet, there was no evidence of chemical stratification either. These observed patterns suggest that shallow tropical reservoirs rarely maintain stable chemical or thermal stratification, with vertical water column dynamics primarily governed by transient environmental and operational factors [12]. Overall, these patterns are not unexpected considering the shallow depth of the Fetá Reservoir (~5 m); while latitude, altitude, lake or reservoir area and water column depth all interact to determine the likelihood and pattern of stratification, it is relatively uncommon for reservoirs ≤ 8 m deep to stratify [28,34]. Comparable findings have been reported in small tropical reservoirs, where shallow depth and short retention times generally prevent the development of stable thermal and chemical gradients [26,35].
The third hypothesis proposed that, over time, a trend toward stabilization in the reservoir’s water quality would occur—as indicated by decreased variability of each measured parameter. Our results partially corroborated this expectation. Turbidity, total dissolved carbon and total dissolved nitrogen showed a clear trend toward stabilization, as the variance measured during the last seven sampling dates was significantly lower than that measured during the first seven sampling dates. This decreasing trend is, however, at least partly attributable to seasonality (i.e., the arrival of the dry season), considering that a decrease in variance was, in certain cases, observed not only in lentic sampling stations but also in lotic sampling stations. By contrast, for temperature and electrical conductivity, an opposite trend was observed—i.e., a trend for destabilization, with a significant increase in variance over time at all lentic monitoring stations. Several artificial reservoirs in tropical regions have similarly shown variable trends in the temporal variation in basic physical-chemical properties due to structural characteristics and continuous fluctuations in the level of the water column [35]. Especially in small and shallow reservoirs [29,36]. Note that the Fetá Reservoir is small (~100,000 m2) and shallow (<5 m operational depth), and during the dry season in May and June 2022, the water level was lowered to ~70% of its full capacity (Figure 2). At a global scale, small reservoirs are increasingly recognized as critical points of biogeochemical variability, where their shallow depth and high connectivity with catchment processes hinder both thermal and chemical stabilization of water [12,14]. In summary, water quality in the Fetá Reservoir is inherently unstable, reflecting its shallow depth, small size, and the influence of both seasonal and anthropogenic factors. The contribution of this study lies in demonstrating how these structural and environmental factors interact to produce destabilization trends across different variables, highlighting the need for high-frequency monitoring and careful management in small tropical reservoirs.

5. Conclusions

This study indicates that small artificial reservoirs cause changes in water quality analogous to those found in large reservoirs (as also suggested by [37]), with a possible exception of stratification. This study highlights the need for temporal monitoring of environmental variations before, during and after reservoir construction, and for as long as seasonal effects can be evaluated. Further research on small artificial reservoirs is essential to effectively contribute to water resource management and the sustainable design of future reservoirs for water storage.

Supplementary Materials

The following supporting information can be downloaded at: https://www.mdpi.com/article/10.3390/limnolrev25040048/s1, Table S1: Slopes and p-values of simple linear regressions of surface water physicochemical properties and nutrient concentrations over time, in each monitoring station. In all cases, significant slopes are indicated with * (p < 0.05) or ** (p < 0.01); Table S2: Results of an F-test for comparison of variances of surface water physicochemical properties and nutrient concentrations in the beginning (Vi, first seven sampling dates) and end (Vf, last seven sampling dates) of the sampling period. Significant F-values are indicated with * (p < 0.05) or ** (p < 0.01); Figure S1: Temporal variation in Fetá Reservoir’s surface water dissolved organic and dissolved inorganic carbon. MS-1 (black) corresponds to the monitoring station in the lotic stretch upstream of the reservoir’s zone of influence. Other monitoring stations (MS-3 to MS-6, green) are inside the reservoir. Significant differences between MS-1 and the other stations, according to Student’s t-test on each sampling date, are indicated with * (p < 0.05) or ** (p < 0.01); Figure S2: Panel (A) shows the daily mean air temperature (°C) (solid line), with error bars indicating the daily minimum and maximum values. Panel (B) shows the 7-day accumulated precipitation (mm) for the same period.

Author Contributions

Conceptualization, Methodology, Investigation, Resources, Writing—original draft, L.G.d.R.; Investigation, Writing—review and editing, R.H.T.; Conceptualization, Methodology, Supervision, Writing—Reviewing and Editing, L.C.S. All authors have read and agreed to the published version of the manuscript.

Funding

This research received no external funding.

Data Availability Statement

All data are available from the corresponding author upon reasonable request.

Acknowledgments

We express our gratitude to the technical professionals and public agents involved in the planning, execution and management of the dam and reservoir at Riacho Fetá, whose collaboration was essential for the completion of this work. L.S. is a recipient of a Productivity Fellowship by CNPq (310333/2022-9).

Conflicts of Interest

The authors declare no conflicts of interest.

References

  1. Javier, A.; Alonso, J.A. Promoting global access to water and sanitation: A supply and demand perspective. Water Resour. Econ. 2022, 39, 100194. [Google Scholar] [CrossRef]
  2. Green, P.A.; Vörösmarty, C.J.; Harrison, I.; Farrell, T.; Sáenz, L.; Fekete, B.M. Freshwater ecosystem services supporting humans: Pivoting from water crisis to water solutions. Glob. Environ. Change 2015, 34, 108–118. [Google Scholar] [CrossRef]
  3. Salehi, M. Global water shortage and potable water safety; Today’s concern and tomorrow’s crisis. Environ. Int. 2022, 158, 106936. [Google Scholar] [CrossRef]
  4. Marengo, J.A.; Alves, L.M. Crise hídrica em São Paulo em 2014: Seca e desmatamento. GEOUSP Espaço Tempo (Online) 2015, 19, 485–494. [Google Scholar] [CrossRef]
  5. Buurman, J.; Mens, M.J.; Dahm, R.J. Strategies for urban drought risk management: A comparison of 10 large cities. Int. J. Water Resour. Dev. 2017, 33, 31–50. [Google Scholar] [CrossRef]
  6. Guzmán, D.A.; Mohor, G.S.; Mendiondo, E.M. Multi-driver ensemble to evaluate the water utility business interruption cost induced by hydrological drought risk scenarios in Brazil. Urban Water J. 2023, 20, 1517–1531. [Google Scholar] [CrossRef]
  7. Morden, R.; Horne, A.; Bond, N.R.; Nathan, R.; Olden, J.D. Small artificial impoundments have big implications for hydrology and freshwater biodiversity. Front. Ecol. Environ. 2022, 20, 141–146. [Google Scholar] [CrossRef]
  8. Abbott, K.M.; Zaidel, P.A.; Roy, A.H.; Houle, K.M.; Nislow, K.H. Investigating impacts of small dams and dam removal on dissolved oxygen in streams. PLoS ONE 2022, 17, e0277647. [Google Scholar] [CrossRef]
  9. Cui, T.; Tian, F.; Yang, T.; Wen, J.; Khan, M.Y.A. Development of a comprehensive framework for assessing the impacts of climate change and dam construction on flow regimes. J. Hydrol. 2020, 590, 125358. [Google Scholar] [CrossRef]
  10. Maavara, T.; Chen, Q.; Van Meter, K.; Brown, L.E.; Zhang, J.; Ni, J.; Zarfl, C. River dam impacts on biogeochemical cycling. Nat. Rev. Earth Environ. 2020, 1, 103–116. [Google Scholar] [CrossRef]
  11. Rosenberg, D.M.; Bodaly, R.A.; Usher, P.J. Environmental and social impacts of large-scale hydroelectric development: Who is listening? Glob. Environ. Change 1995, 5, 127–148. [Google Scholar] [CrossRef]
  12. Winton, R.S.; Calamita, E.; Wehrli, B. Reviews and syntheses: Dams, water quality and tropical reservoir stratification. Biogeosciences 2019, 16, 1657–1671. [Google Scholar] [CrossRef]
  13. Silveira, N.; Tibúrcio, I.; Soares, G.; Galvíncio, J.; Santos, D.; Montenegro, S. Temporal analysis of water quality for the Nilo Coelho Reservoir, Terra Nova, Pernambuco, Brazil. Water 2023, 15, 2899. [Google Scholar] [CrossRef]
  14. Deemer, B.R.; Harrison, J.A.; Li, S.; Beaulieu, J.J.; DelSontro, T.; Barros, N.; Bezerra-Neto, J.F.; Powers, S.M.; Dos Santos, M.A.; Vonk, J.A. Greenhouse gas emissions from reservoir water surfaces: A new global synthesis. BioScience 2016, 66, 949–964. [Google Scholar] [CrossRef] [PubMed]
  15. Instituto Brasileiro de Geografia e Estatística (IBGE). Louveira (SP). 2023. Available online: https://www.ibge.gov.br/cidades-e-estados/sp/louveira.html (accessed on 11 September 2025).
  16. Comitê da Bacia Hidrográfica dos Rios Piracicaba, Capivari e Jundiaí (CBH-PCJ). Relatório de Situação dos Recursos Hídricos das Bacias PCJ 2022—Ano Base 2022. Available online: https://www.comitespcj.org.br (accessed on 11 September 2025).
  17. Alvares, C.A.; Stape, J.L.; Sentelhas, P.C.; Gonçalves, J.D.M.; Sparovek, G. Köppen’s climate classification map for Brazil. Meteorol. Z. 2013, 22, 711–728. [Google Scholar] [CrossRef]
  18. Departamento de Águas e Energia Elétrica (DAEE). Sistema Integrado de Bacias Hidrográficas—Dados Pluviométricos de Louveira/SP para 2022. Available online: https://sibh.daee.sp.gov.br (accessed on 11 September 2025).
  19. Instituto de Pesquisas Tecnológicas (IPT). Elaboração de Diagnóstico e Proposição de Diretrizes Quanto ao Uso e Ocupação do Solo, Cobertura Vegetal e Recursos Hídricos na Bacia do Córrego Santo Antônio, Louveira, SP; Instituto de Pesquisas Tecnológicas (IPT): São Paulo, Brazil, 2020. [Google Scholar]
  20. Legendre, P.; Legendre, L. Numerical Ecology, 3rd ed.; Elsevier: Amsterdam, The Netherlands, 2012. [Google Scholar]
  21. Jolliffe, I.T.; Cadima, J. Principal component analysis: A review and recent developments. Philos. Trans. R. Soc. A 2016, 374, 20150202. [Google Scholar] [CrossRef]
  22. Zar, J.H. Biostatistical Analysis, 5th ed.; Pearson Prentice Hall: Upper Saddle River, NJ, USA, 2010. [Google Scholar]
  23. Salmaso, N.; Padisák, J. Morpho-functional groups and phytoplankton development in two deep lakes (Lake Garda, Italy and Lake Stechlin, Germany). Hydrobiologia 2007, 578, 97–112. [Google Scholar] [CrossRef]
  24. Hammer, Ø.; Harper, D.A.T.; Ryan, P.D. PAST: Paleontological statistics software package for education and data analysis. Palaeontol. Electron. 2001, 4, 9. [Google Scholar]
  25. Premalatha, M.; Abbasi, T.; Abbasi, S.A. A critical view on the eco-friendliness of small hydroelectric installations. Sci. Total Environ. 2014, 481, 638–643. [Google Scholar] [CrossRef]
  26. Soares, M.C.S.; Marinho, M.M.; Huszar, V.L.M.; Branco, C.W.C.; Azevedo, S.M. The effects of water retention time and watershed features on the limnology of tropical reservoirs. Hydrobiologia 2008, 603, 241–254. [Google Scholar] [CrossRef]
  27. Habets, F.; Molénat, J.; Carluer, N.; Douez, O.; Leenhardt, D. The cumulative impacts of small reservoirs on hydrology: A review. Sci. Total Environ. 2018, 643, 850–867. [Google Scholar] [CrossRef]
  28. Wetzel, R.G. Limnology: Lake and River Ecosystems, 3rd ed.; Academic Press: San Diego, CA, USA, 2001. [Google Scholar]
  29. Jurik, L.; Húska, D.; Halászová, K.; Bandlerová, A. Small water reservoirs–sources of water or problems? J. Ecol. Eng. 2015, 16, 22–28. [Google Scholar] [CrossRef]
  30. Whitney, C.T.; Wollheim, W.M.; Gold, A.J.; Buonpane, J.M. Small reservoirs as nitrogen transformers: Accounting for seasonal variability in inorganic and organic nitrogen processing. J. Geophys. Res. Biogeosci. 2023, 128, e2023JG007635. [Google Scholar] [CrossRef]
  31. Harrison, J.A.; Maranger, R.; Alexander, R.B.; Boyer, E.W.; Jordan, T.E.; Mayer, P.M. The regional and global significance of nitrogen removal in lakes and reservoirs. Biogeochemistry 2009, 93, 143–157. [Google Scholar] [CrossRef]
  32. Połomski, M.; Wiatkowski, M. Impounding reservoirs, benefits and risks: A review of environmental and technical aspects of construction and operation. Sustainability 2023, 15, 16020. [Google Scholar] [CrossRef]
  33. Belico, J.C.B. Impacts of Rainfall Events on the Physical-Chemical and Biological Dynamics in Urban Reservoirs: Case Study Lagoa da Pampulha. Master’s Thesis, Federal University of Minas Gerais, Belo Horizonte, Brazil, 2017. [Google Scholar]
  34. Soomro, S.E.H.; Shi, X.; Guo, J.; Ke, S.; Hu, C.; Asad, M.; Boota, M.W. Are global influences of cascade dams affecting river water temperature and fish ecology? Appl. Water Sci. 2023, 13, 106. [Google Scholar] [CrossRef]
  35. Ellis, E.A.; Allen, G.H.; Riggs, R.M.; Gao, H.; Li, Y.; Carey, C.C. Bridging the divide between inland water quantity and quality with satellite remote sensing: An interdisciplinary review. WIREs Water 2024, 11, e1725. [Google Scholar] [CrossRef]
  36. Mioduszewski, W. Small water reservoirs–their function and construction. J. Water Land Dev. 2012, 17, 45–52. [Google Scholar] [CrossRef]
  37. Chong, X.Y.; Vericat, D.; Batalla, R.J.; Teo, F.Y.; Lee, K.S.P.; Gibbins, C.N. A review of the impacts of dams on the hydromorphology of tropical rivers. Sci. Total Environ. 2021, 794, 148686. [Google Scholar] [CrossRef]
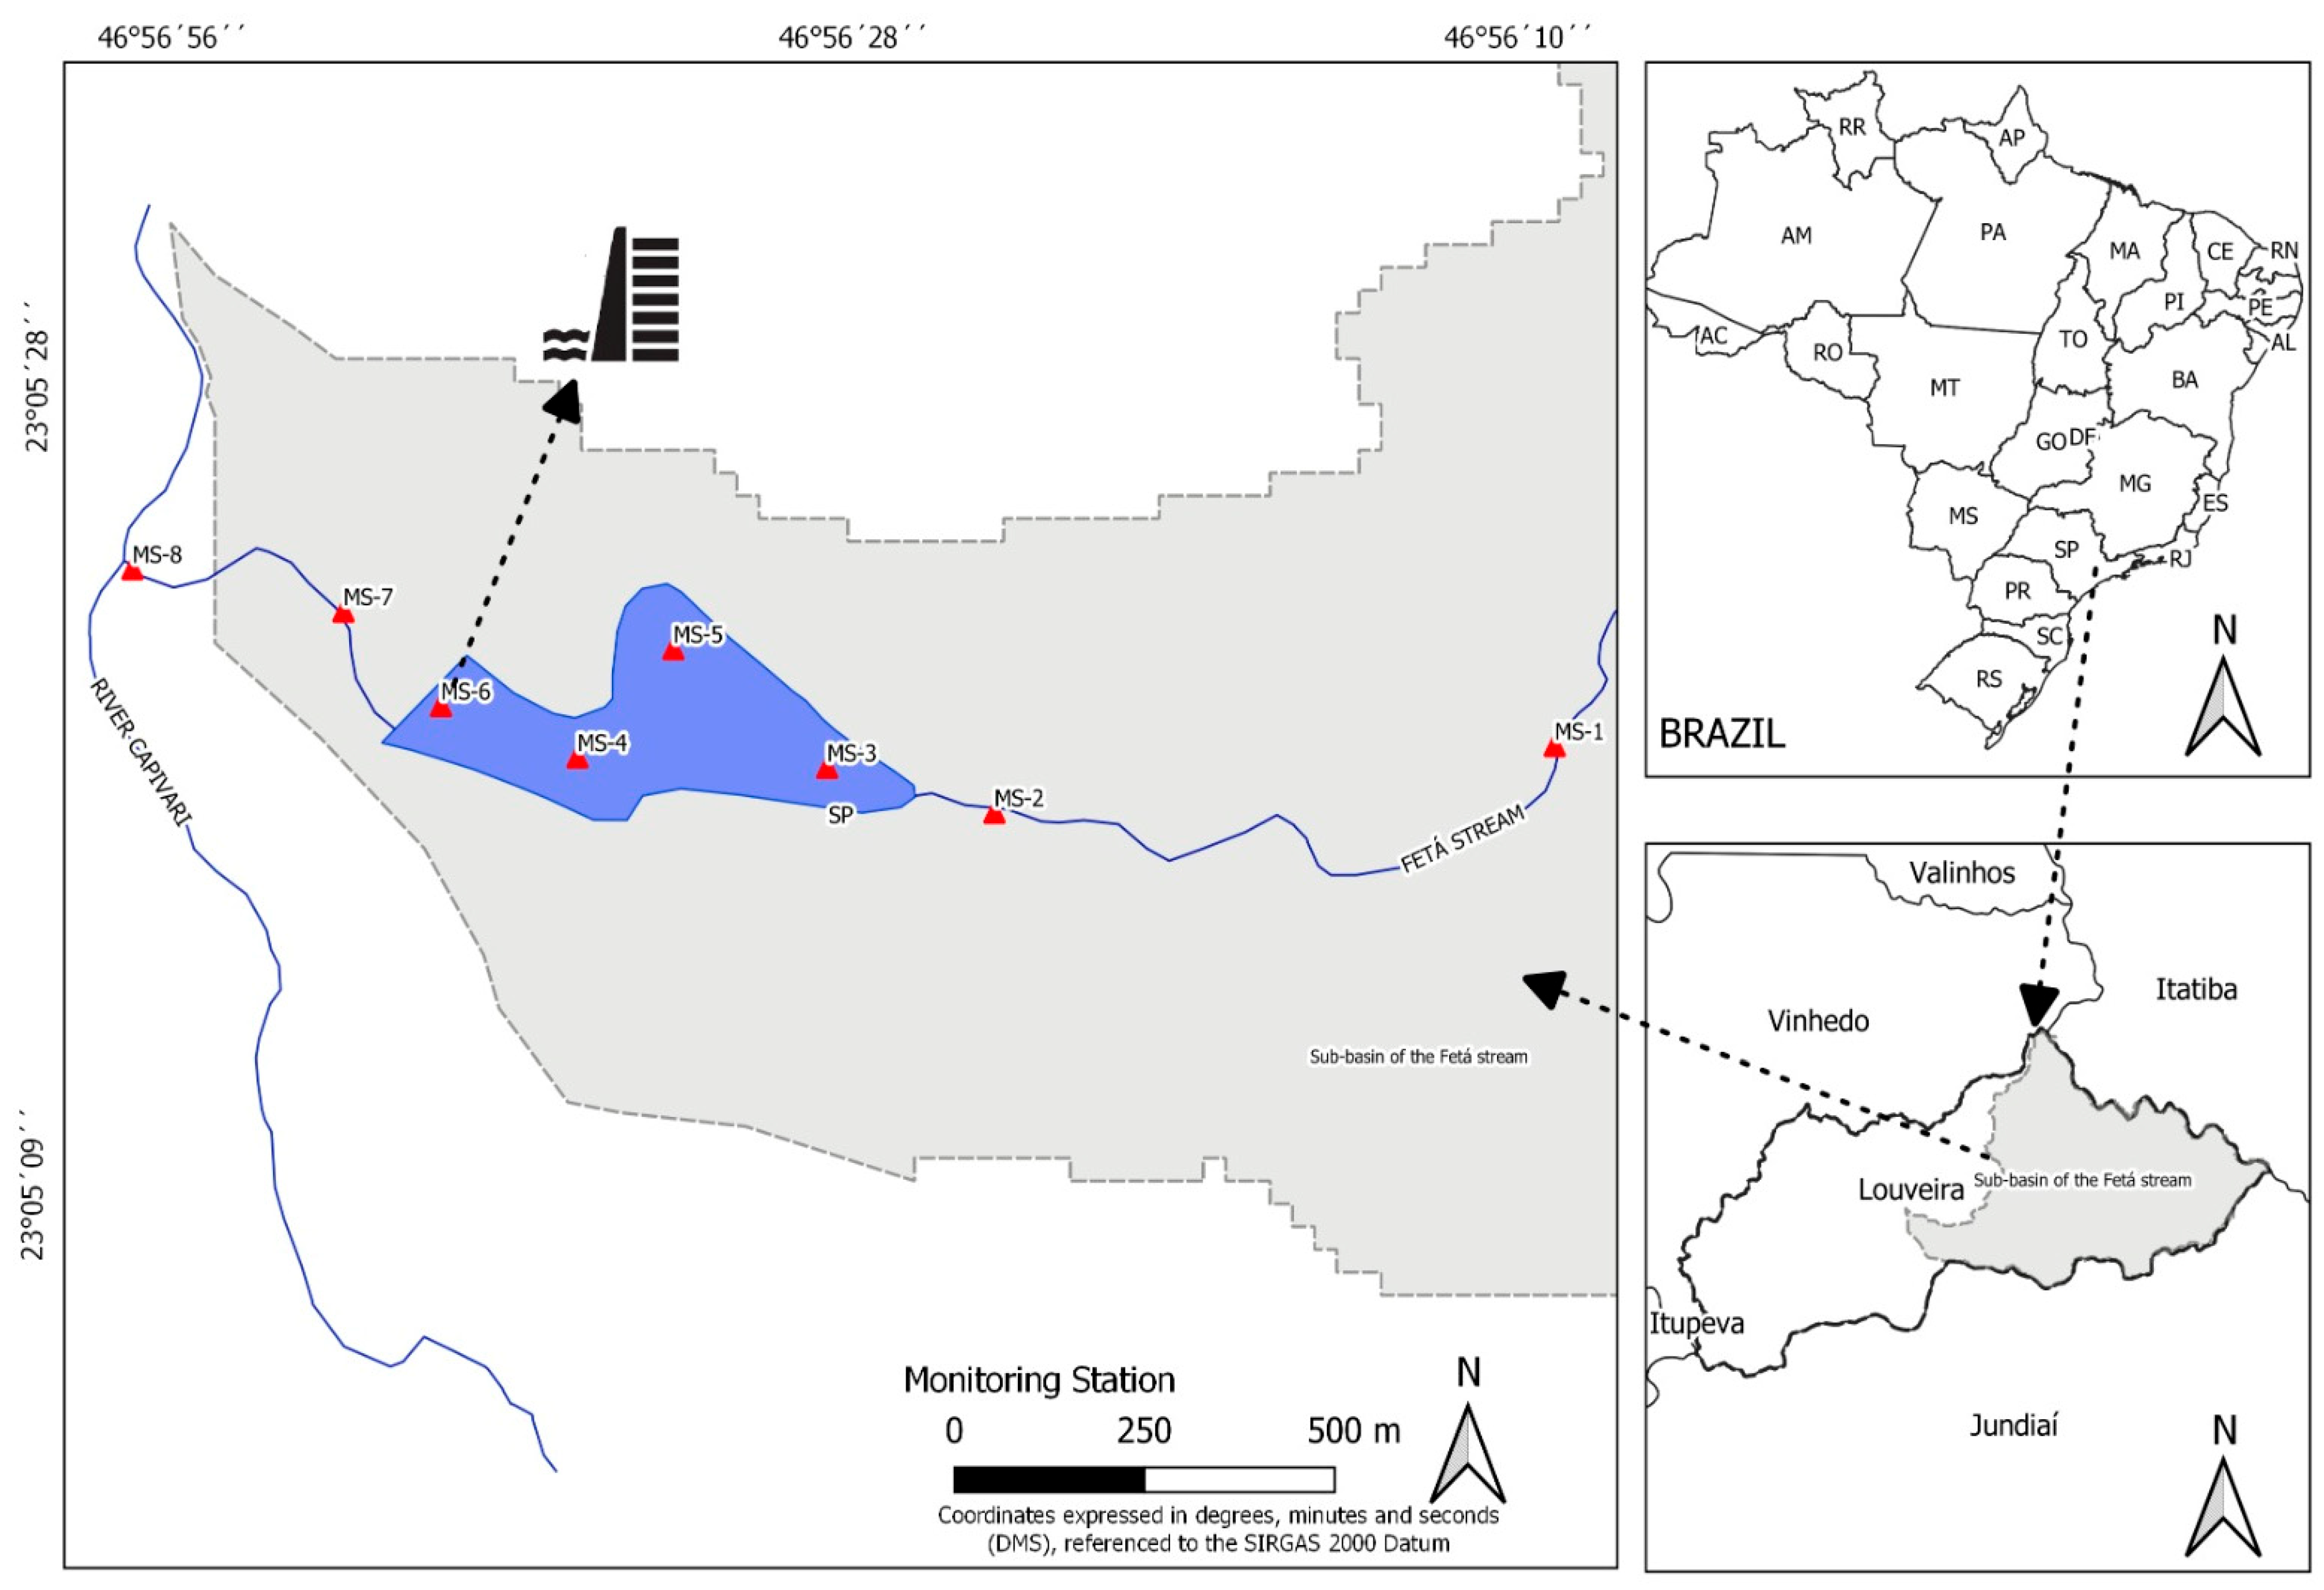
Figure 1. Location of the Fetá stream and distribution of monitoring stations upstream, downstream and in the artificial reservoir.
Limnolrev 25 00048 g001
Figure 2. Temporal variation in Fetá Reservoir’s surface water physicochemical properties and nutrient concentrations after closing the floodgates. MS-1 (in black) corresponds to the monitoring station in the lotic stretch upstream of the reservoir’s zone of influence. The other monitoring stations (MS-3 to MS-6, in green) are inside the reservoir. In all cases, significant differences between MS-1 and the other stations in a Student’s t-test on each sampling date are represented by * (p < 0.5) and ** (p < 0.01).
Limnolrev 25 00048 g002
Figure 3. Principal Component Analysis for surface water quality variables upstream (MS-1, MS-2), downstream (MS-7, MS-8) and within (MS-3,4,5 and 6) the Fetá Reservoir throughout the sampling period.
Limnolrev 25 00048 g003
Figure 4. Scores of Principal Components 1, 2 and 3 at monitoring stations upstream (MS-1, EM2), downstream (MS-7, MS-8) and within (MS-3, MS-4, MS-5 and MS-6) the Fetá stream reservoir throughout the sampling period. Arrows to the left of the y-axis represent variables with highest loadings in each principal component, and their direction of change.
Limnolrev 25 00048 g004
Figure 5. Comparison of physicochemical variables and nutrient concentrations in the water at the surface and bottom of the Fetá Reservoir. Bars represent the mean ± 1 standard error of the monitoring stations inside the reservoir (MS-3, MS-4, MS-5 and MS-6), on the 21 sampling dates that comprise the environmental monitoring. Only significant differences are represented.
Limnolrev 25 00048 g005
Figure 6. Depth profiles of water physicochemical properties at the center of the Fetá Reservoir (MS-4) on two representative dates (7 March 2022, summer, solid line; 10 June 2022, winter, dashed line). Note that water depth was lower in winter than in summer.
Limnolrev 25 00048 g006
Table 1. Summary of the sampling design.
MONITORING STATIONLATITUDELONGITUDEFLUVIAL CHARACTERISTICSPHYSICOCHEMICAL PARAMETERSNUTRIENTS
RiverineTransition ZoneLacustrineSubsurfaceProfilingSubsurfaceBottom
MS-123°5′25.27″ S46°55′48.23″ WX------X---X---
MS-223°5′29.68″ S46°56′15.28″ WX------X---X---
MS-323°5′27.25″ S46°56′25.12″ W---X---XXXX
MS-423°5′27.87″ S46°56′33.38″ W------XXXXX
MS-523°5′24.53″ S46°56′29.54″ W------XXXXX
MS-623°5′24.88″ S46°56′40.86″ W------XXXXX
MS-723°5′20.63″ S46°56′45.37″ WX------X---X---
MS-823°5′18.13″ S46°56′48.00″ WX------X---X---
Note: “X” indicates measurement or sampling at the monitoring station.
Disclaimer/Publisher’s Note: The statements, opinions and data contained in all publications are solely those of the individual author(s) and contributor(s) and not of MDPI and/or the editor(s). MDPI and/or the editor(s) disclaim responsibility for any injury to people or property resulting from any ideas, methods, instructions or products referred to in the content.