1. Introduction
Mined materials are rarely in a useful form in their native state and need to be processed first. A common method of ore particle size reduction involves first crushing and then grinding it as a charge in mills. Mills achieve grinding through particle compression and collisions. Collisions involve particle-to-particle and particle-to-wall impacts. These fracture mechanisms can be accelerated by adding hard, high-density objects into the charge: balls for collisions and rods for compression [
1]. Mills that rotate about a horizontal axis have a limit on their throughput due to dependence on the perpendicular gravitational acceleration vector to facilitate the desired charge motion. Above a certain rotational speed, for a specific mill-drum geometry, charge material and fill ratio, the centrifugal forces start to dominate, and the charge becomes static relative to the drum, halting effective grinding [
2].
The Hicom nutating mill, a high-intensity compact mill, overcomes this gravitational limitation by altering the chamber motion from rotation to nutation.
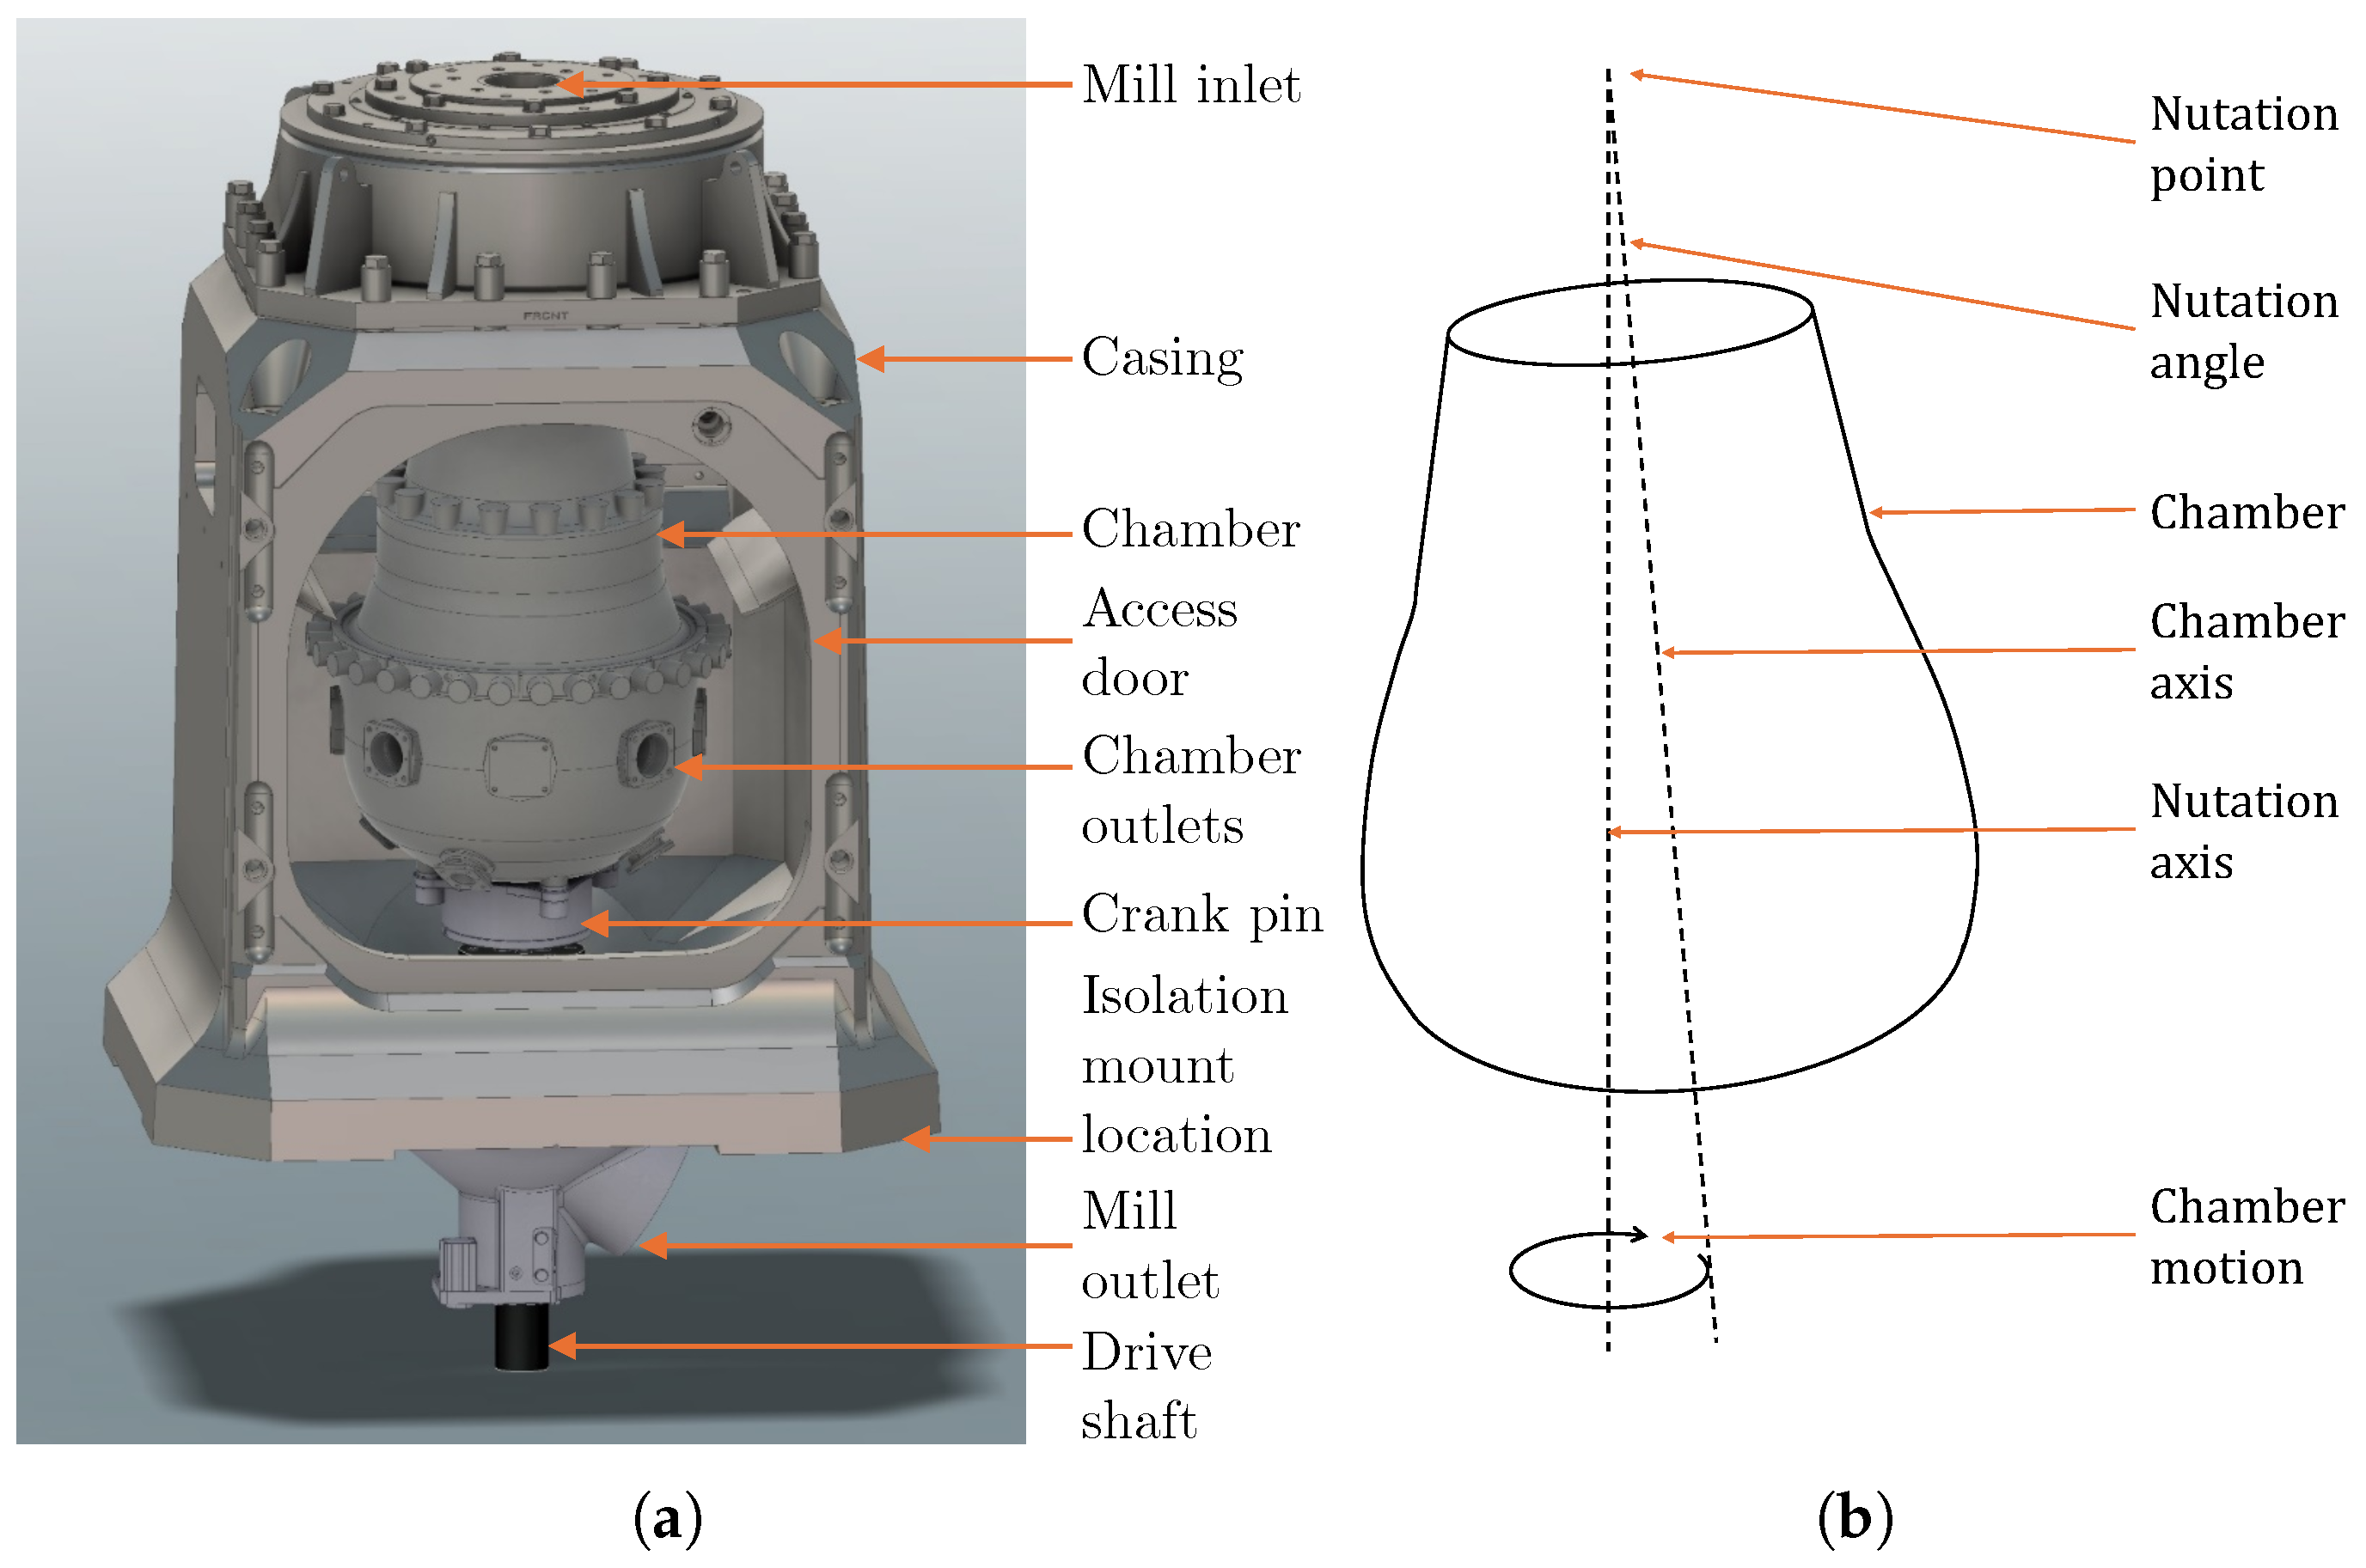
Figure 1 shows an illustration of the Hicom mill along with a diagram of the chamber motion. A nutating chamber has its axis of symmetry in a slanted, near-vertical orientation. At the top end of the axis, its translation and rotation about the axis are constrained, and the bottom end is gyrated in a horizontal plane [
3].
Stakeholders seeking to make informed design and operational decisions about nutating mills require a thorough understanding of the structural dynamics of these machines. The interface forces between the components of a nutating mill are not well characterized due to limited understanding of its structural dynamics. This uncertainty constrains the reliable identification of operational envelopes and has contributed to mechanical reliability issues in certain specialist operations that utilize the Hicom. A more accurate characterization of these dynamics is therefore required to support the design process and inform standard operating procedures in industrial applications. Such understanding enables improved mechanical reliability and greater predictability of component lifetime.
Previous work characterized a nutating mill through a combination of dynamic simulation and experimental testing [
5,
6]. The conditions considered were for a generalized nutating mill without vibration isolation mounts and with a smooth cylindrical chamber. The experimental testing was performed on a laboratory-scale nutating test mill (NuMill) that was instrumented for experimental investigations. This dynamic simulation of a nutating mill was a one-way superimposed multi-body dynamic (MBD) and discrete element method (DEM) simulation without vibration isolation mounts that also allows global structural motion. It was found that simplified modeling of the chamber charge as a solid rigid mass provides an inadequate representation of operational loads.
The present study expands on this by developing a more comprehensive analysis methodology for nutating mills, incorporating additional aspects of the industrial Hicom mill. Specifically, the work extends the experimental capabilities of the NuMill and integrates coupled dynamic structural and particle simulation with physical testing to better characterize machine behavior under different operating conditions.
Analytical determination of structural loads in nutating mills is challenging because of the complex behavior of the granular charge and its interaction with the chamber surface. The present study focuses specifically on advancing the understanding of the structural dynamics and charge–structure interaction of the machine, while material breakage and grinding performance are excluded from its scope. As the machine’s geometry, operating principles, and purpose are well-defined, the research is centered on dynamic structural analysis and the development of representative experimental and simulation models. These models facilitate a thorough investigation of the critical load path and dynamic interactions within the kinematic joints.
Accordingly, the aim of this investigation is to characterize the structural dynamics and charge–structure interaction of a nutating mill using experiments and a two-way coupled MBD–DEM simulation. This characterization is intended to support design and operational decision-making and improve the mechanical reliability of nutating mills. The following objectives were defined to achieve this aim:
The scope included an experimental investigation to quantify changes in the NuMill’s global dynamic response and material motion due to vibration isolation mounts under various configurations. A two-way coupled MBD–DEM simulation model, including transient startup, was developed. Rigid and granular charge modeling with vibration isolation mounts were quantitatively compared. The influence of ribbed chamber geometry on structural loads and torque demand was also evaluated.
2. Materials and Methods
2.1. Experimental Investigation
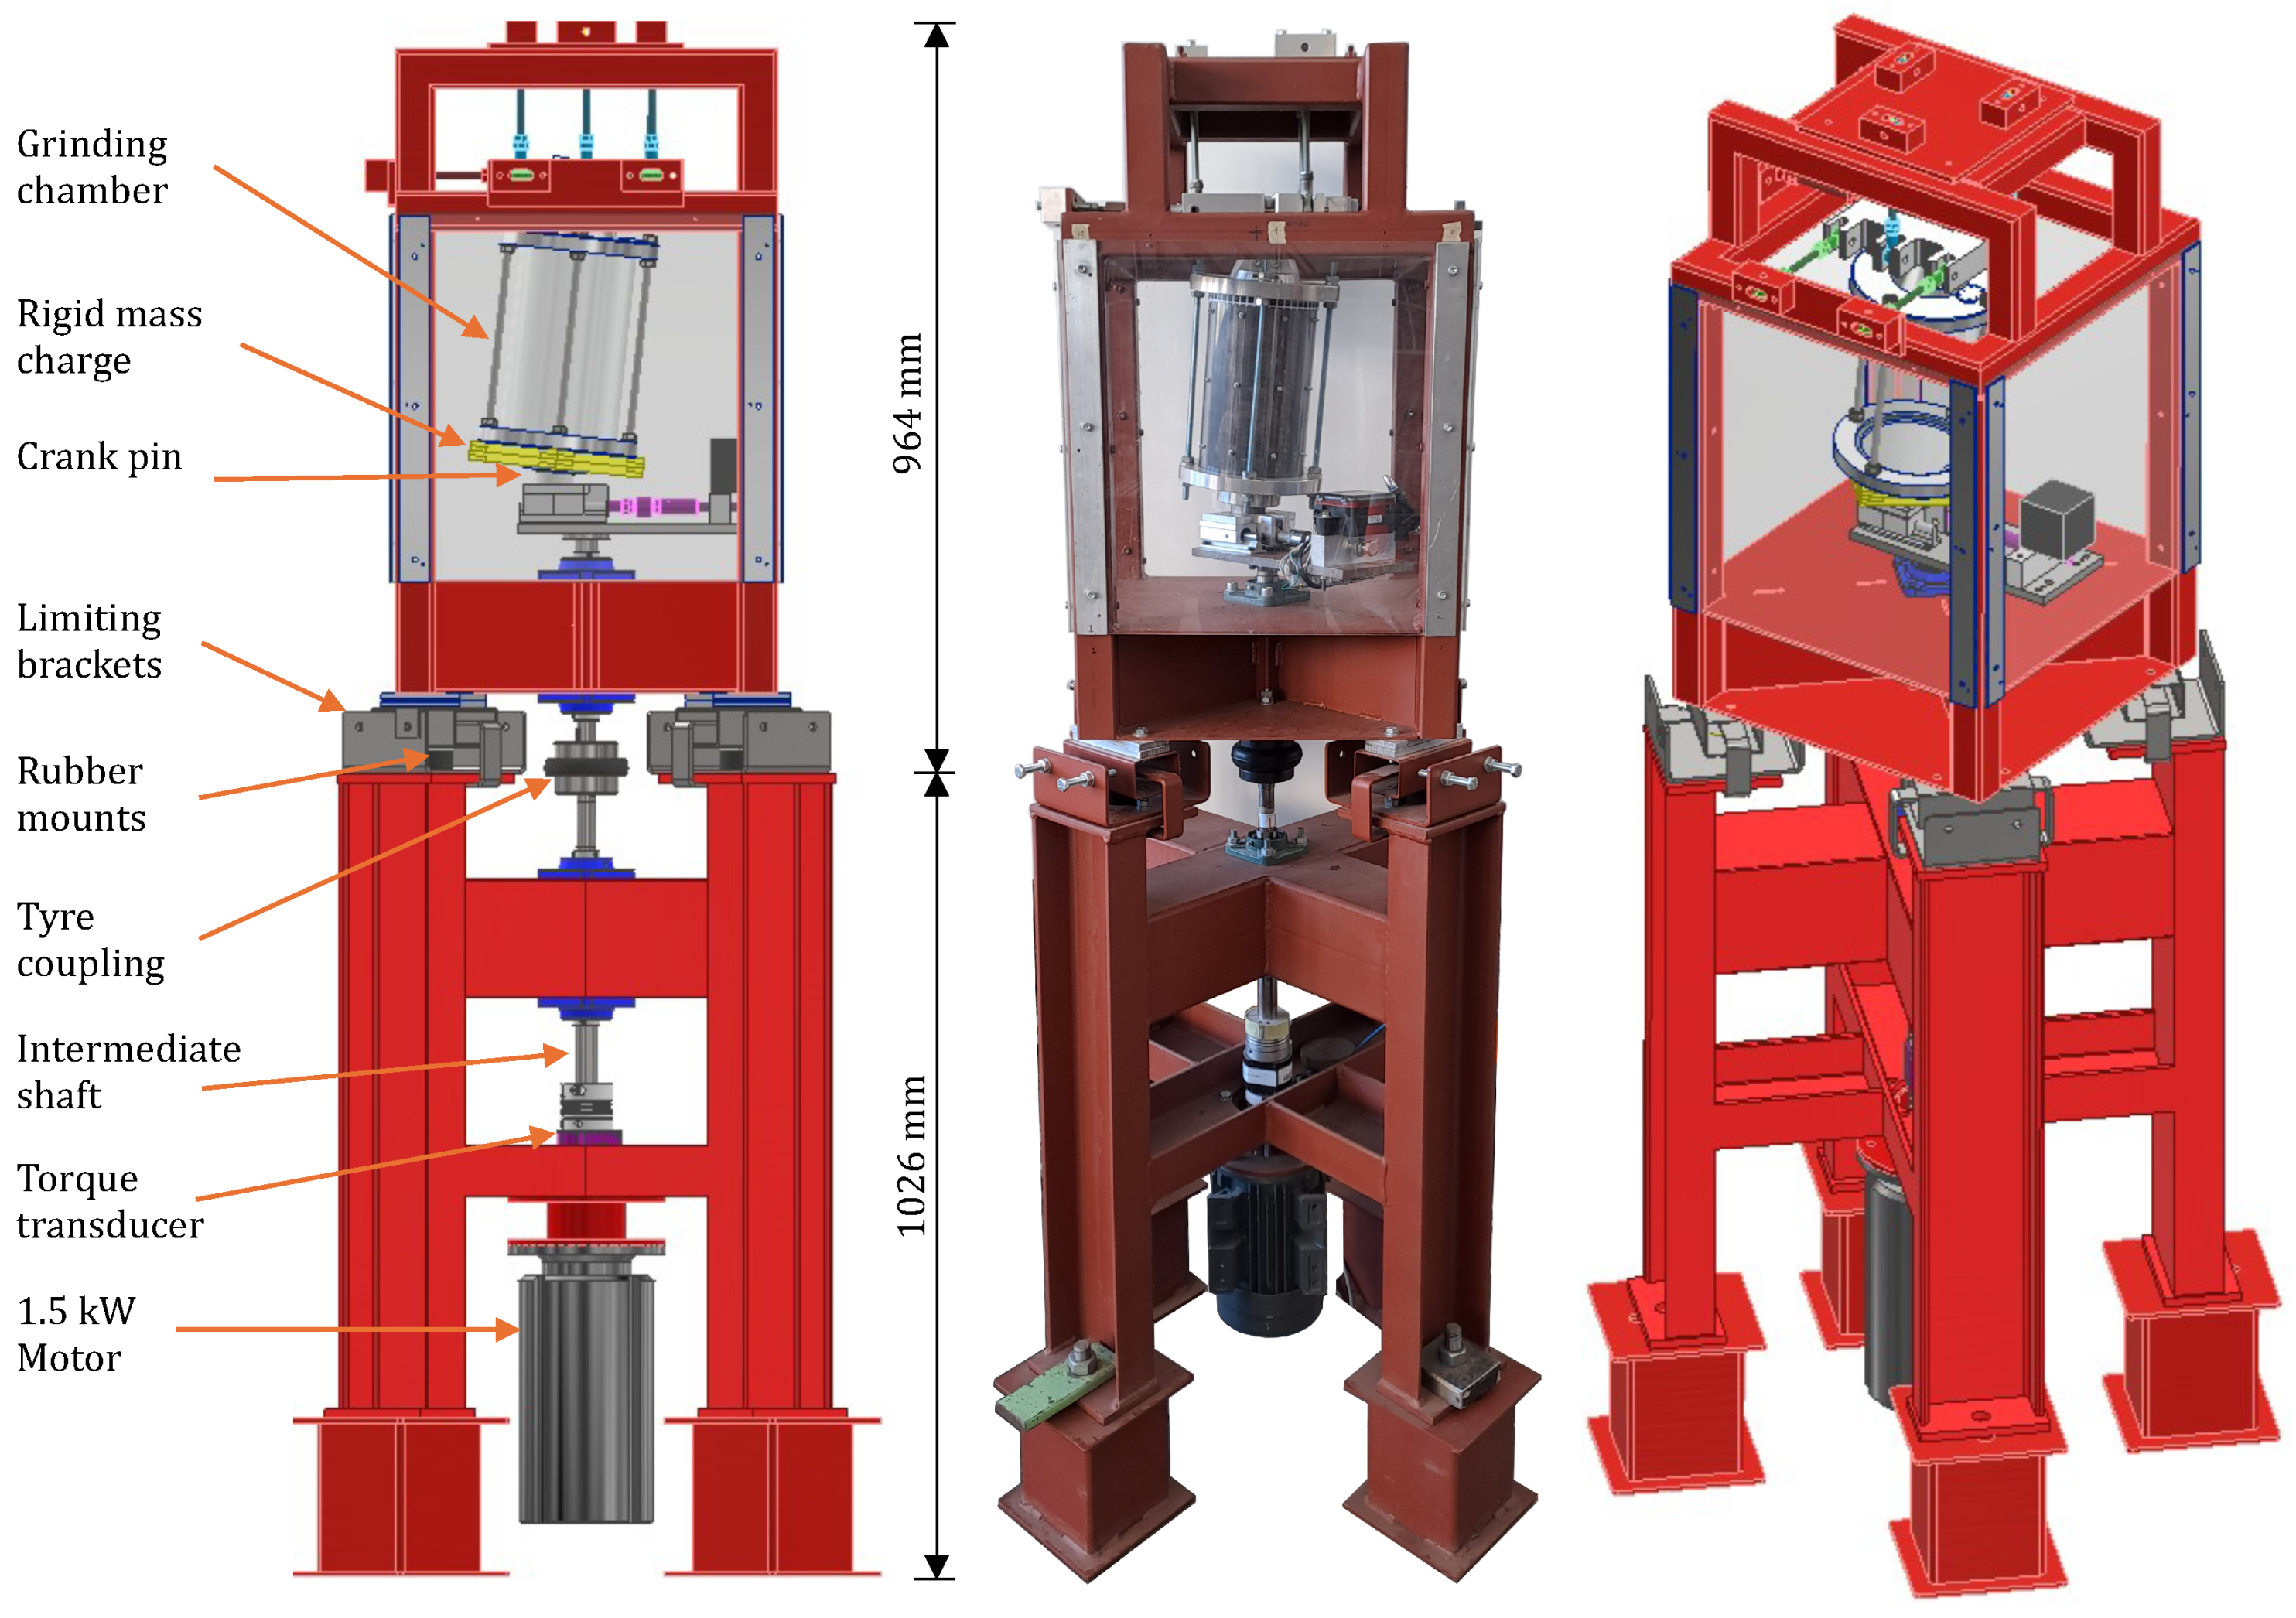
The modified NuMill is displayed in
Figure 2. The rigid mass charge is indicated as the removable mild steel bars fastened at the base of the chamber. The NuMill dynamics and mechanisms are discussed in more detail below.
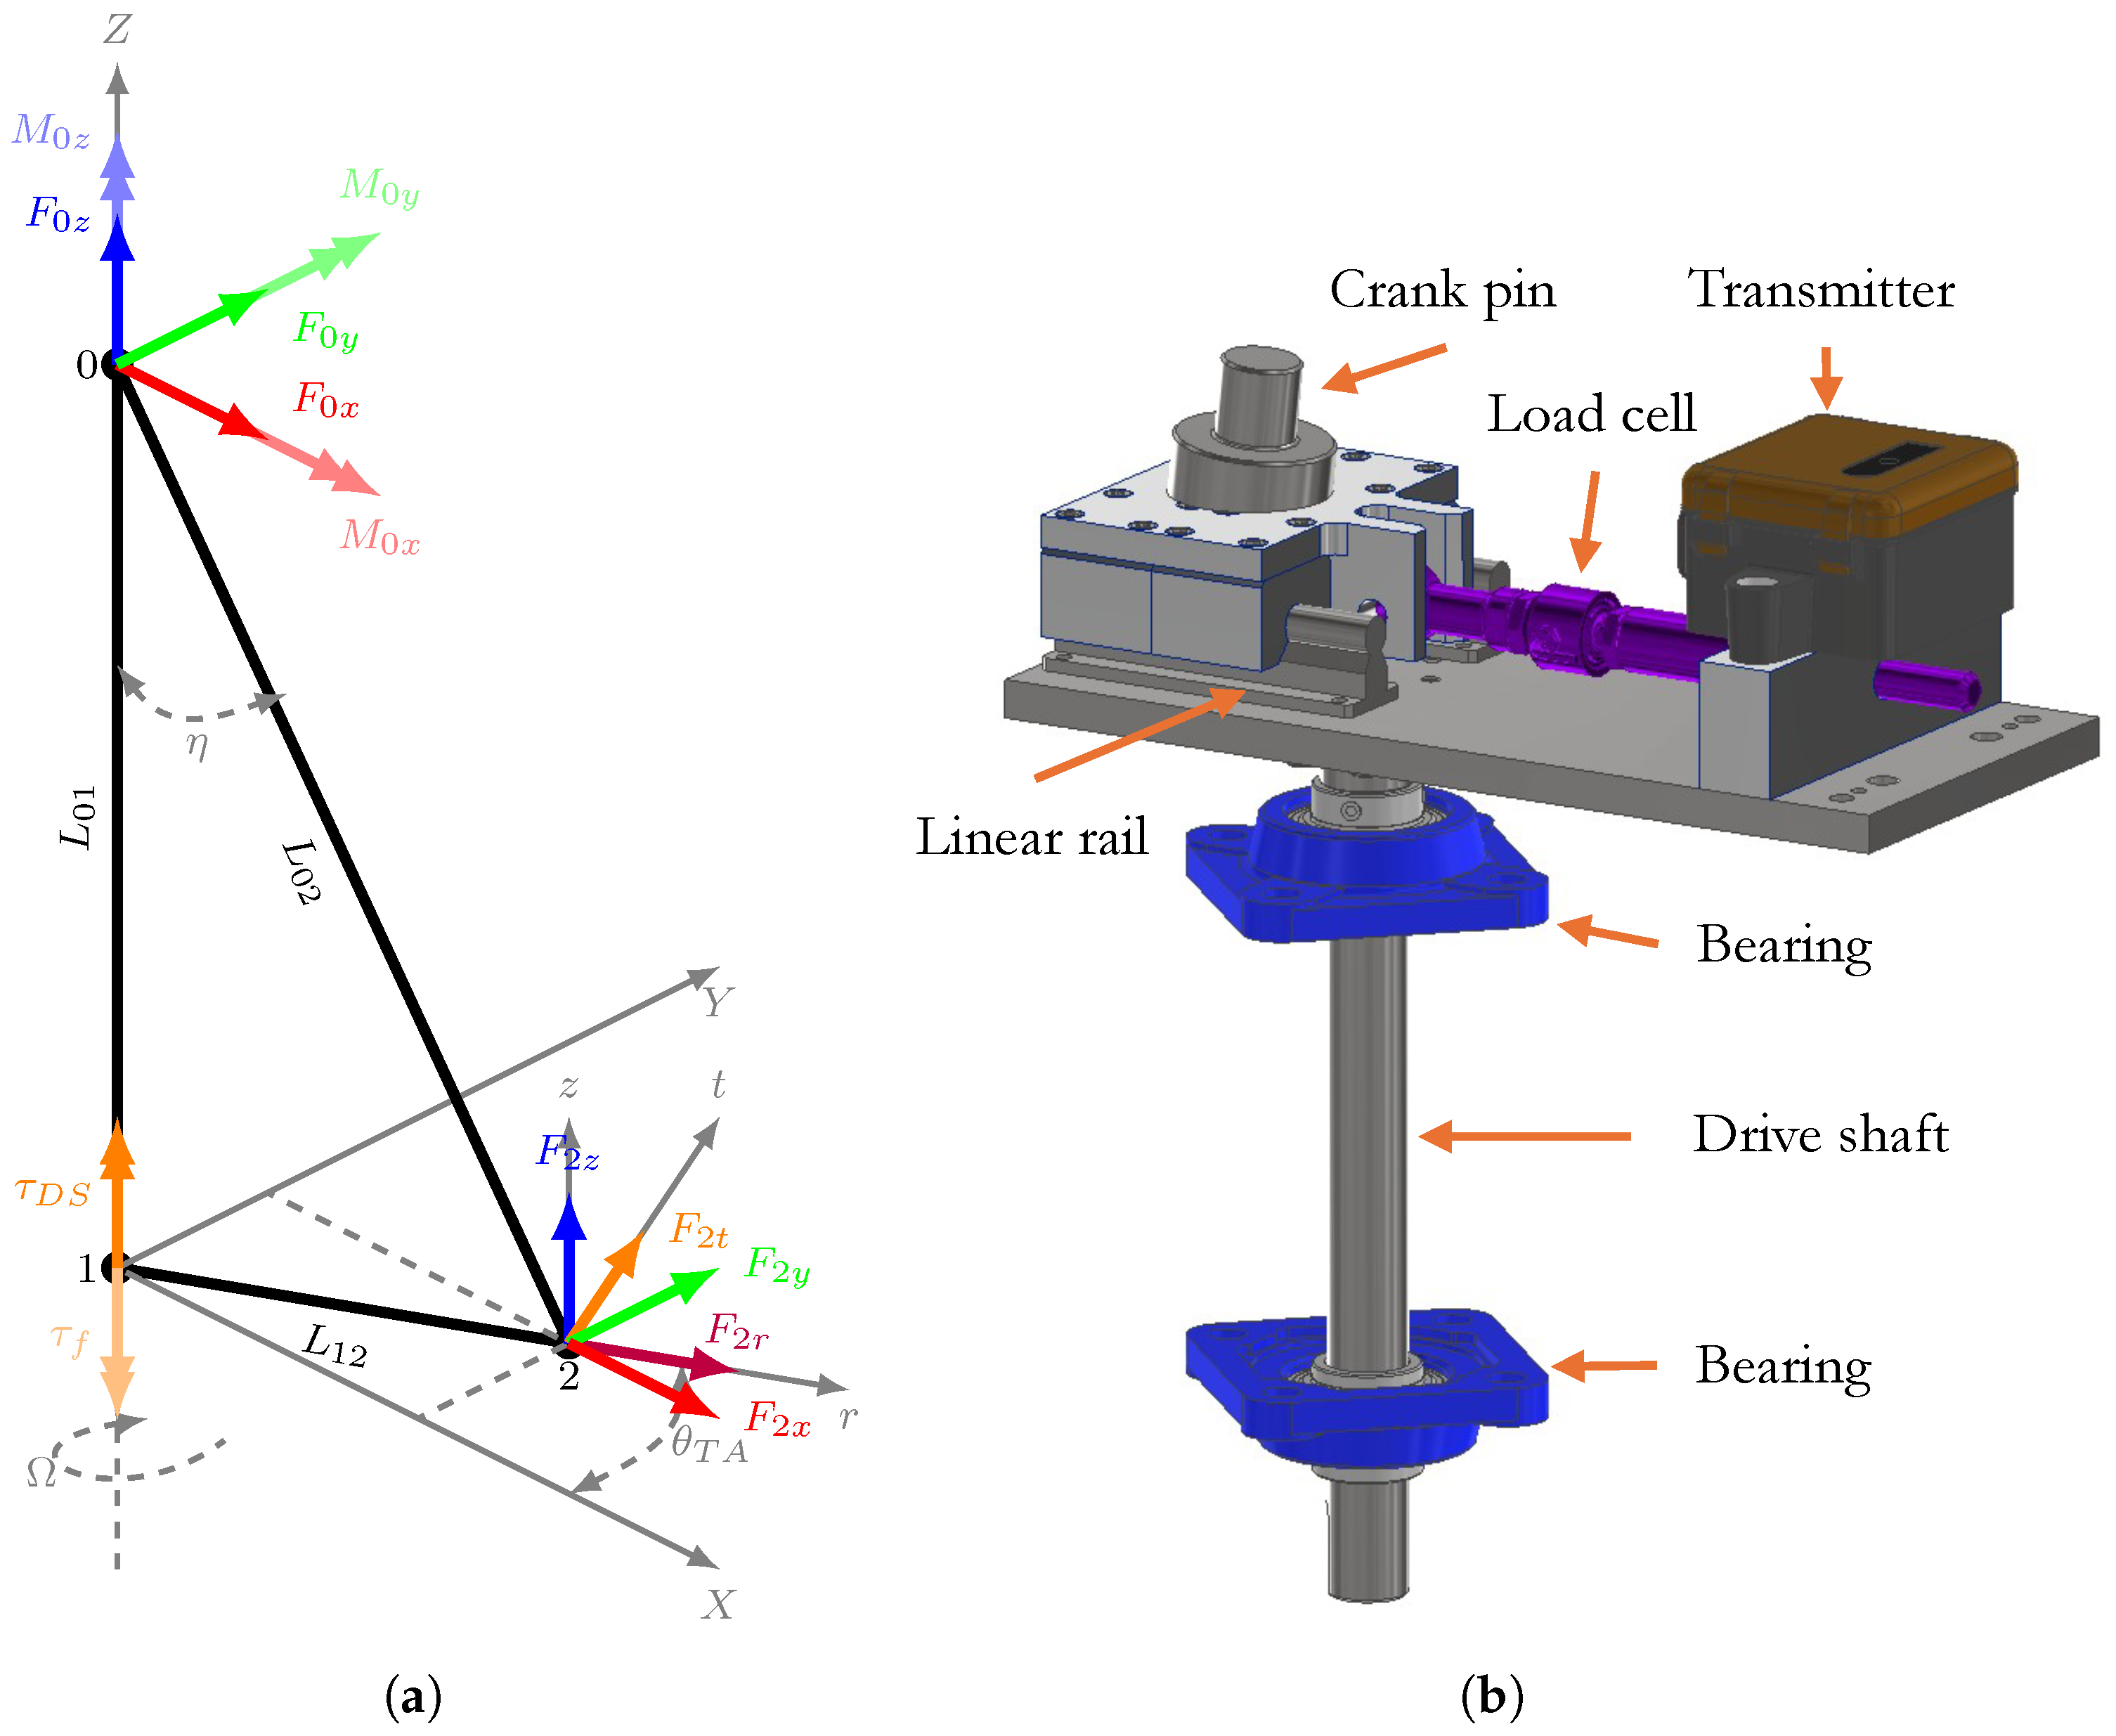
The NuMill’s free body diagram (FBD) is depicted in
Figure 3a. An FBD was derived for both the experimental setup and simulation setup. Forces are represented by
F, moments by
M, torques by
, rotational speed by
and angles by
. Using the vector diagrams and dimensions of implemented components, trigonometric relations can be utilized to determine the unknown reaction forces.
The torque crank arm assembly depicted in
Figure 3b is the component that connects the motor shaft to the crank pin as
does in
Figure 3 an FBD. It has an incorporated load cell to measure the radial force exerted on the crank pin that transfers the driving motor’s rotation to the grinding chamber. This measurement capability is achieved by mounting the crank pin on a carriage that can slide along a linear rail assembly, where the radial load cell provides the only resistance in the radial direction. Since this load cell is situated on a rotating component, its measurements are communicated wirelessly. Where the crank pin inserts into the chamber base, a spherical roller bearing is used to allow for the required degrees of freedom.
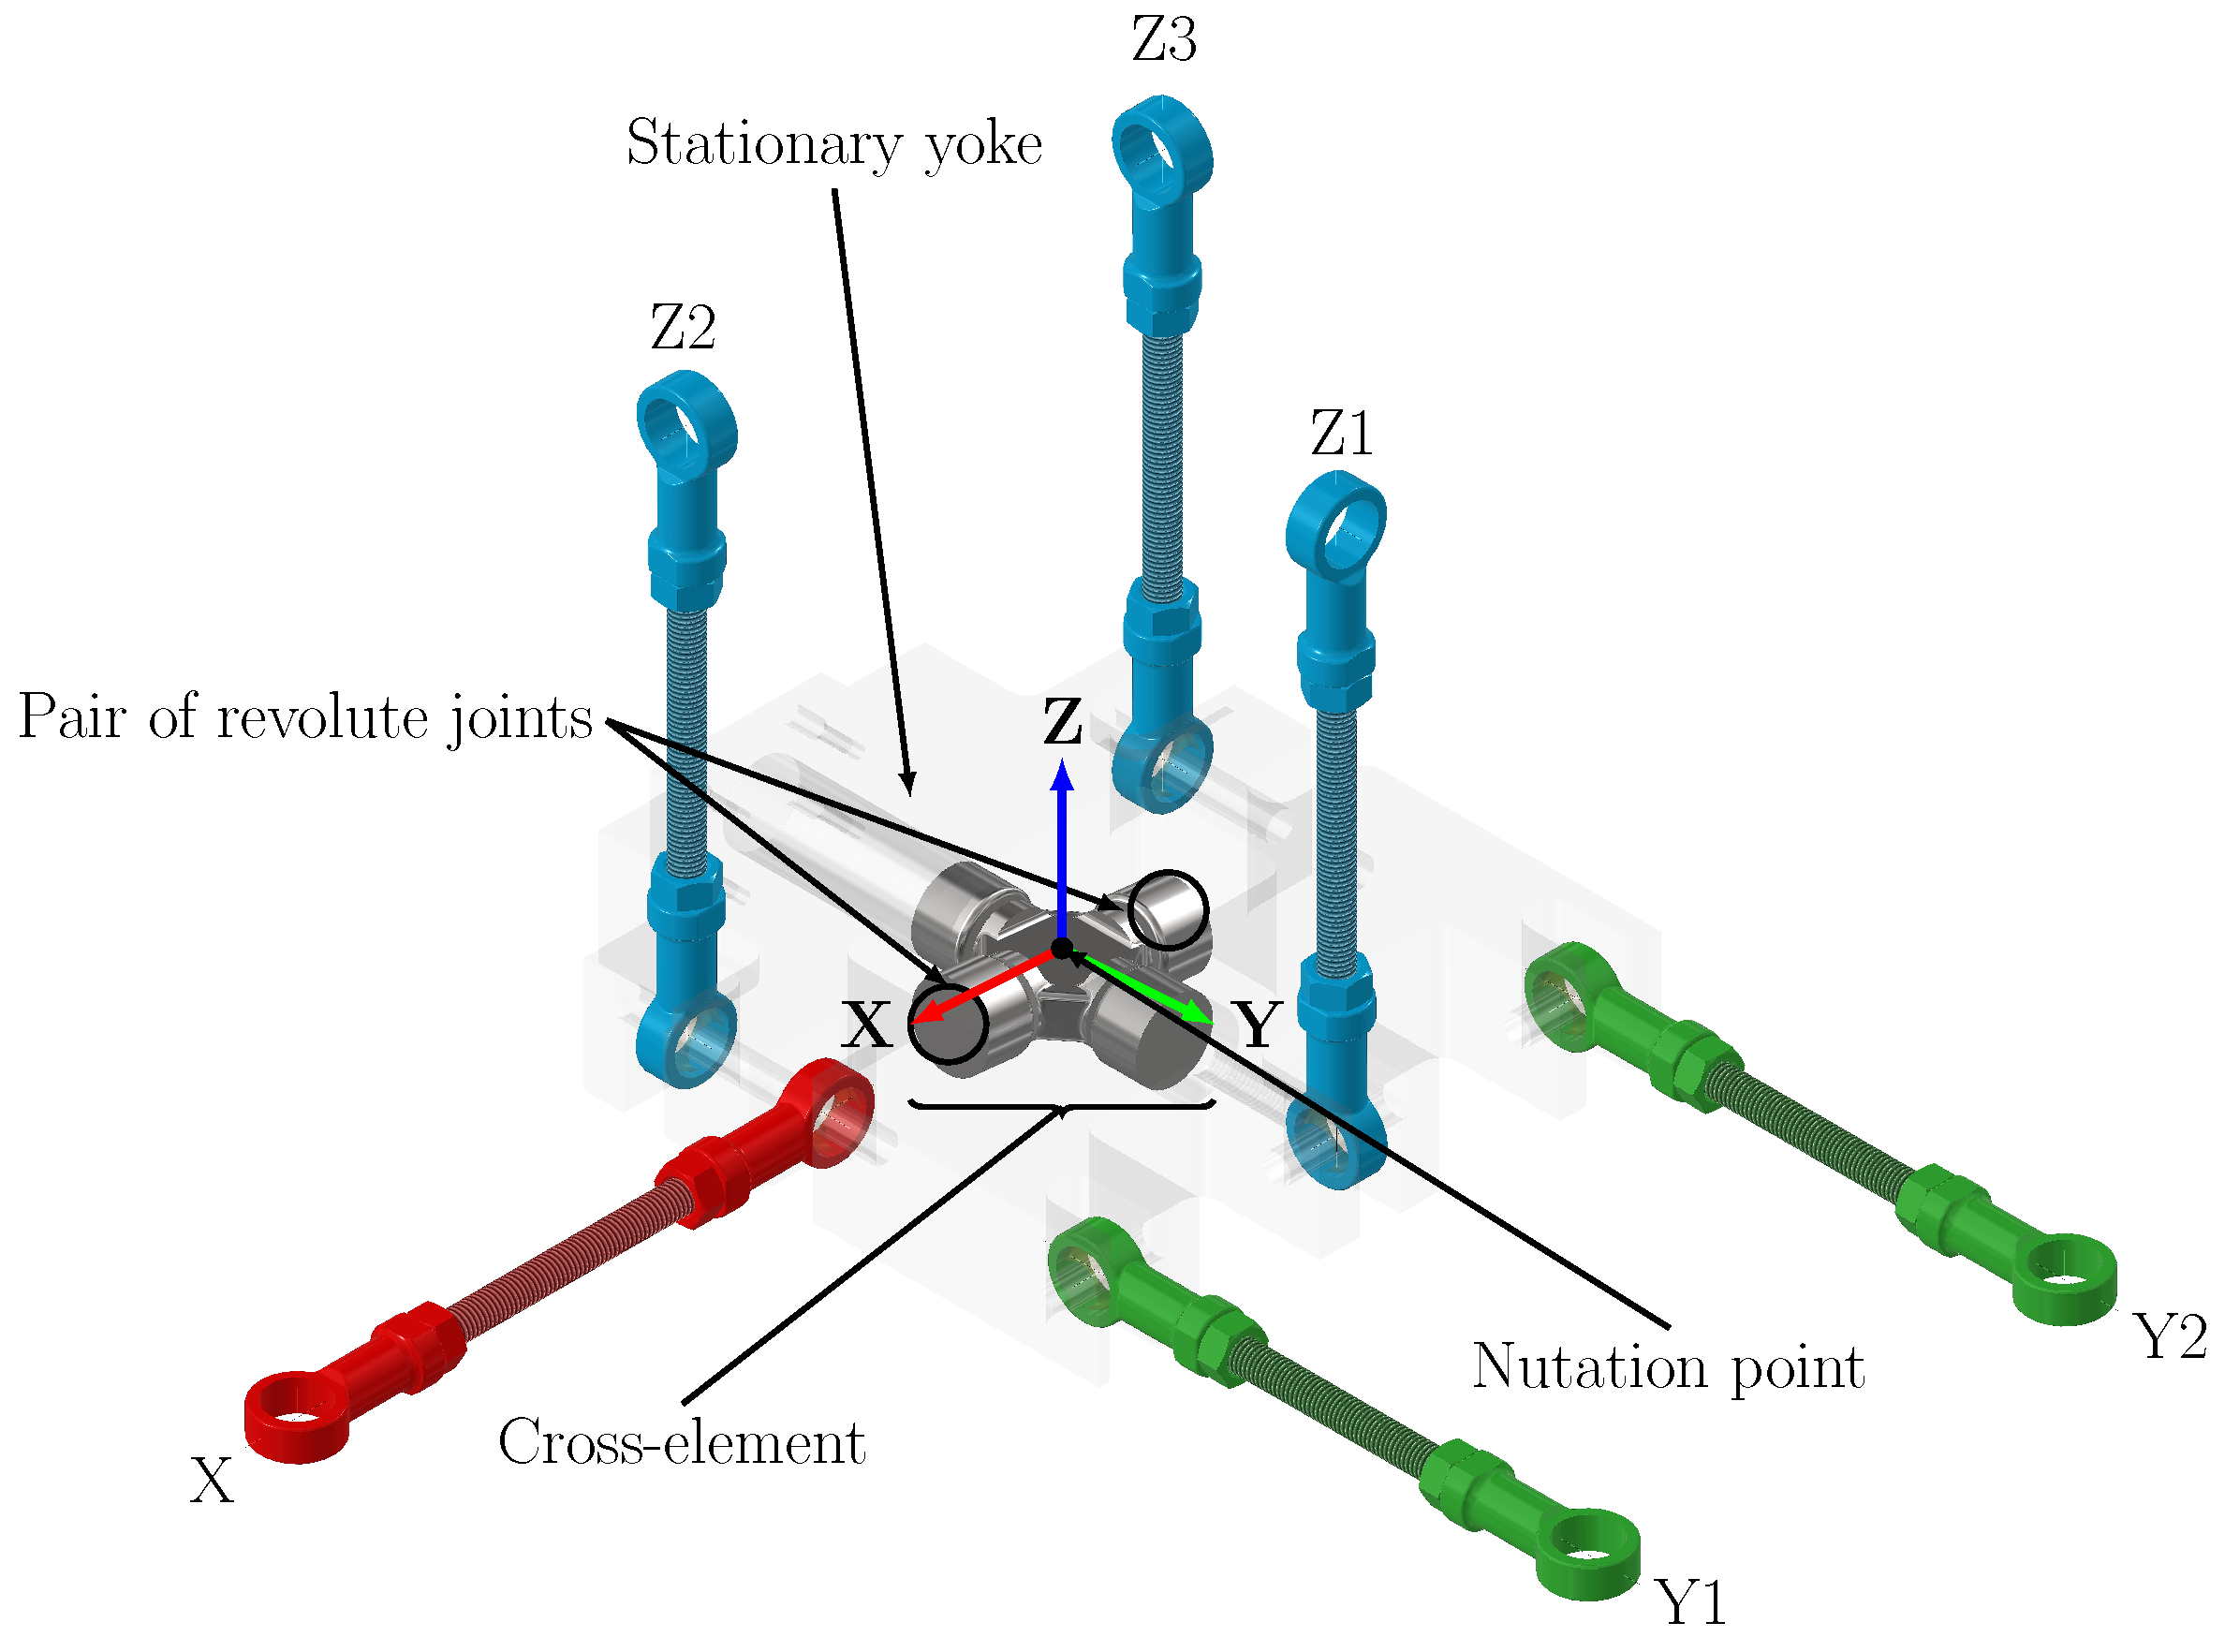
The universal cross joint shown in
Figure 4, is situated at the nutation point at the top of the chamber. The pair of revolute joints in the Y-direction is connected to the stationary yoke and the pair in the X-direction is connected to the top end of the chamber.
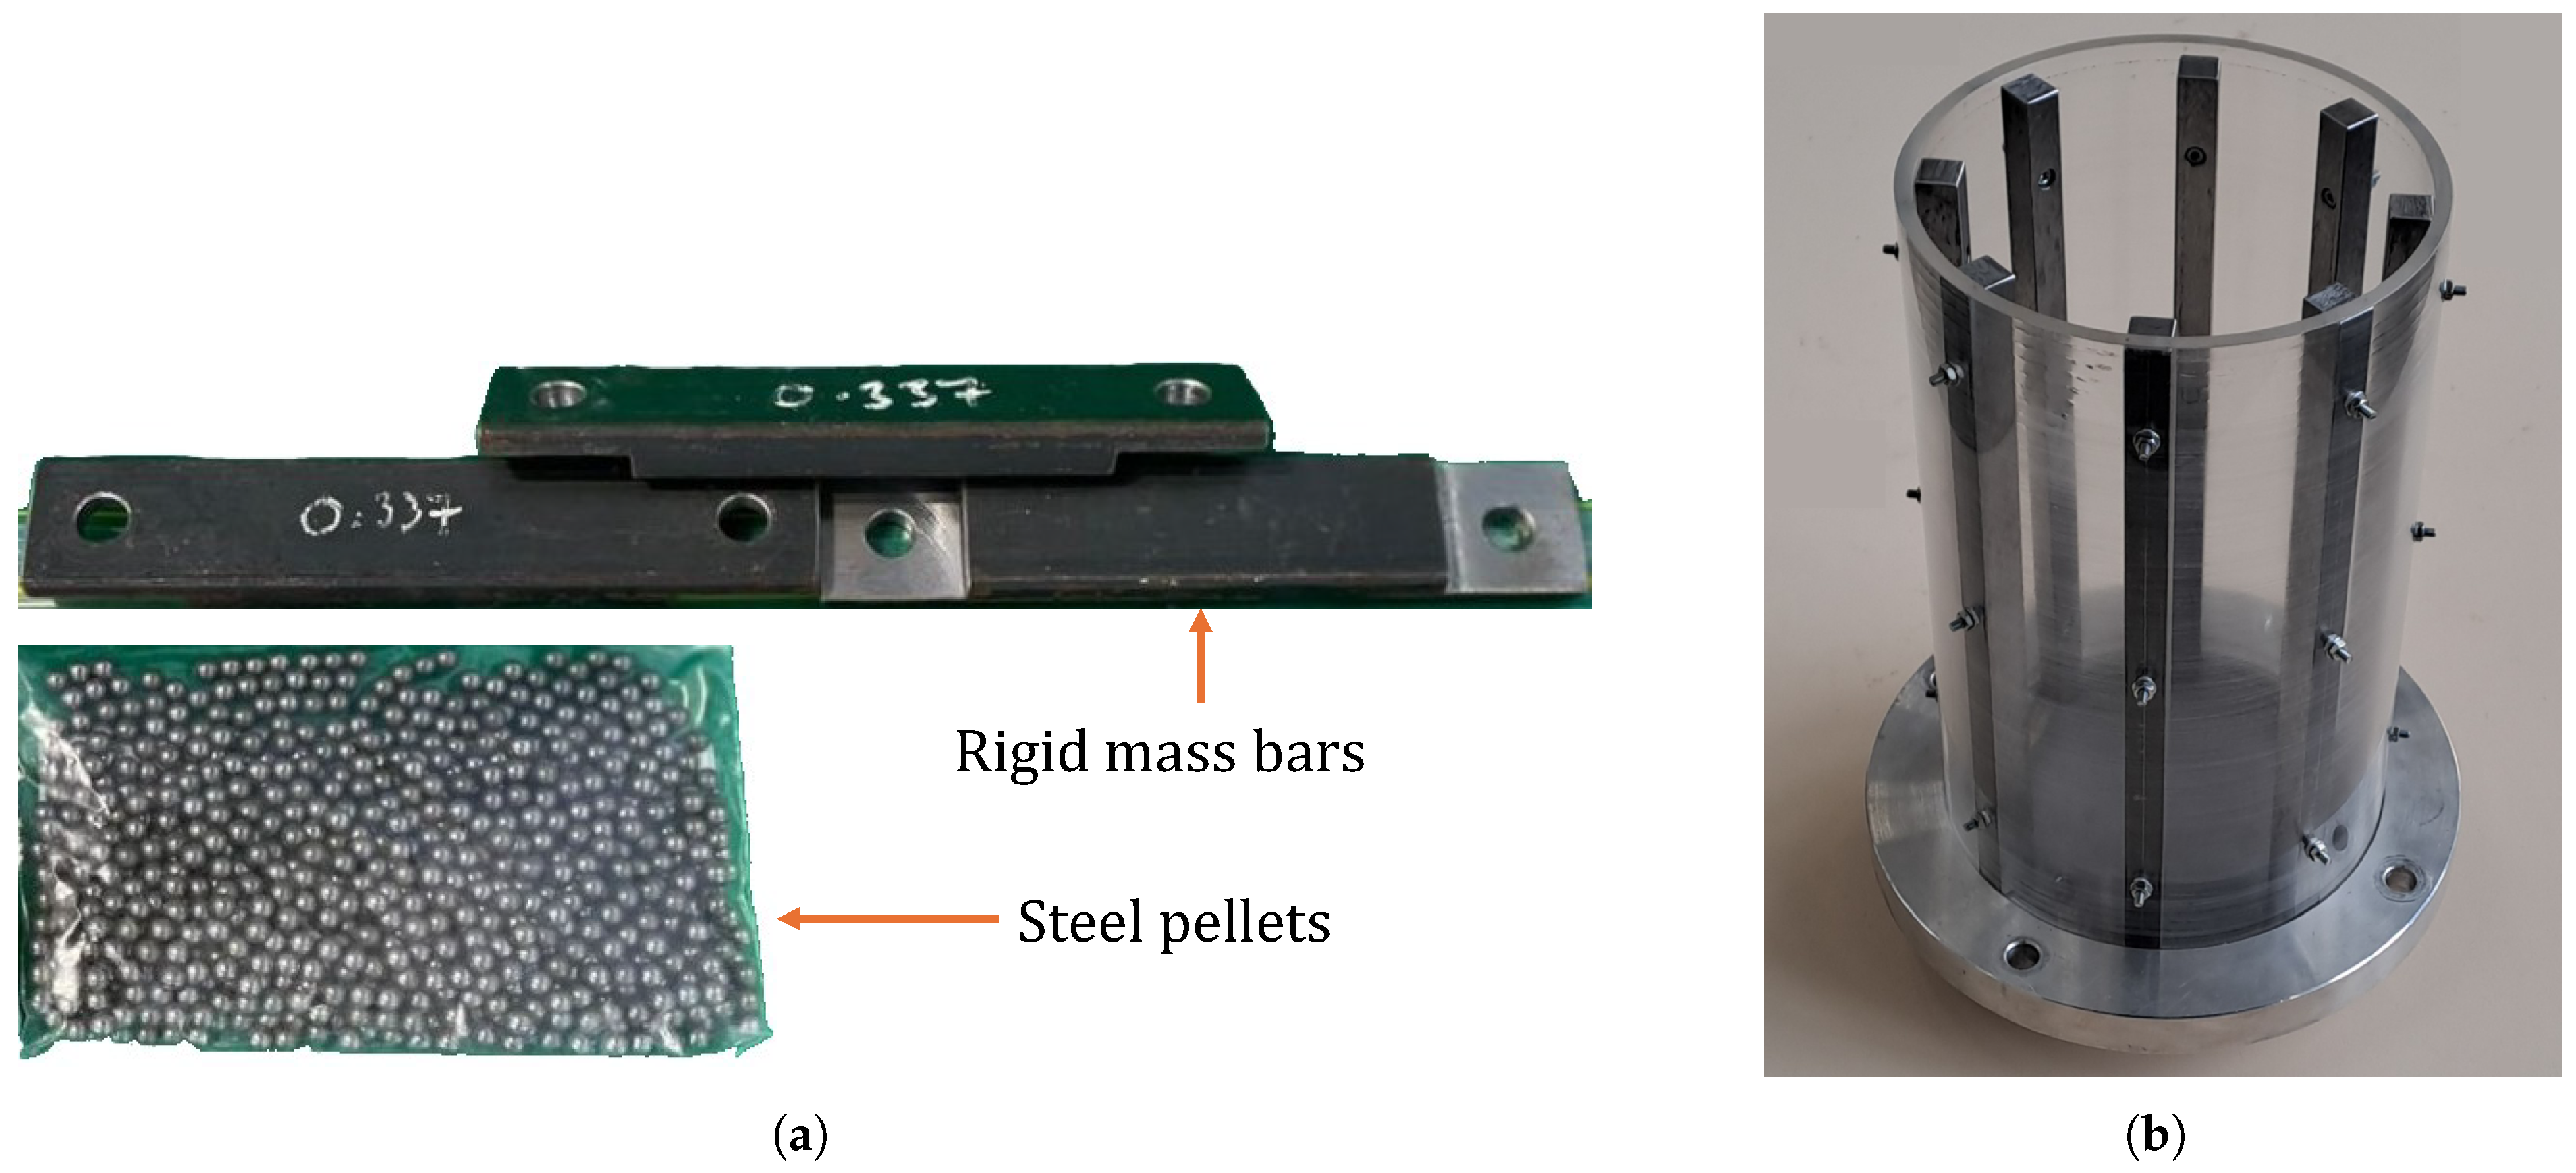
Two different charge materials were considered during experiments. These include a rigid mass consisting of steel bars simulating the rigid load charge simplification and 5
steel ball bearings referred to as steel pellets. The steel bars were mounted along the perimeter of the base of the chamber. The materials are shown in
Figure 5a. The alternative chamber geometry that was investigated was the ribbed chamber. The ribbed chamber configuration consisted of 12 vertical mild steel bars bolted equidistantly to the inner surface of the chamber with counterbored cap screws. A photograph of the ribbed chamber, with the top cover removed, can be seen in
Figure 5b. The unribbed chamber configuration was the same as that of the ribbed chamber, but without the vertical bars and holes for the bolts. The total mass of the ribs and bolts was
.
The experimental variables were adapted from [
5] to suit the modified NuMill, as listed in
Table 1. The independent variables were selected and varied to investigate their influence on the system dynamics. The dependent variables were chosen to capture the system’s response to changes in the independent variables. The controlled variables were kept constant to ensure that the results were not influenced by external factors. The extraneous variables were monitored but not controlled, as they were not expected to have a significant impact on the results.
The full-scale NuMill was instrumented with sensors to capture both global structural response and local internal forces. The overall experimental setup is shown in
Figure 2, with the measured parameters, sensor types, and locations listed in
Table 1. The motor speed served as the independent system input variable, while motor torque and crank-pin radial force were measured as dependent local internal forces of subassemblies. Frame accelerations were recorded as global response variables, capturing the kinematic vibration behavior of the entire structure.
The varied experimental parameters, whose effects are presented herein, are listed in
Table 2, showing 4 configurations. A clear NuMill configuration hierarchy emerges from the factorial variation of test parameters. For each experimental run, the full startup, steady-state, and shutdown phases were captured. The motor speed was ramped up from 0 RPM to the target steady-state speed at a constant acceleration rate, held at the target speed for at least 10
, and then allowed to ramp back down to 0 RPM by cutting the motor power supply from the variable speed drive. The constant rotational acceleration rate of 70 RPM/s was chosen based on Hicom operational data and resulted in a 10
ramp time to 700 RPM. The ranges of final speeds shown in
Table 2 correspond to the final steady-state speeds tested for each configuration. The speed steps were selected with higher resolution around the estimated resonant frequencies of the system, which were obtained from the MBD simulation. At least three runs were conducted for each final steady-state speed to ensure repeatability. Measurements were taken at a sampling frequency of 4800
, about 400 times the fastest shaft rotation frequency. The charge types were chosen to represent a range of material behaviors: from no charge (empty chamber) as a base case, to rigid steel bars (rigid bars) as a simplified analogue of granular charge, to 5
diameter steel ball bearings (steel pellets).
2.2. Simulation Investigation
2.2.1. MBD Simulation Setup
The inclusion of a flexible coupling and mounts in the rigid MBD simulation required experimental confirmation and identification of their dynamic properties. The resulting values used in the MBD simulations are summarized in
Table 3. The experimental procedure for determining these properties was reported in [
7,
8]. The flexible components consist of rubber materials that exhibit nonlinear stiffness and damping characteristics [
9,
10]. Based on experimental characterization results, the stiffness was assumed to be linear and the damping to be viscous for relevant cases, to simplify the simulation process.
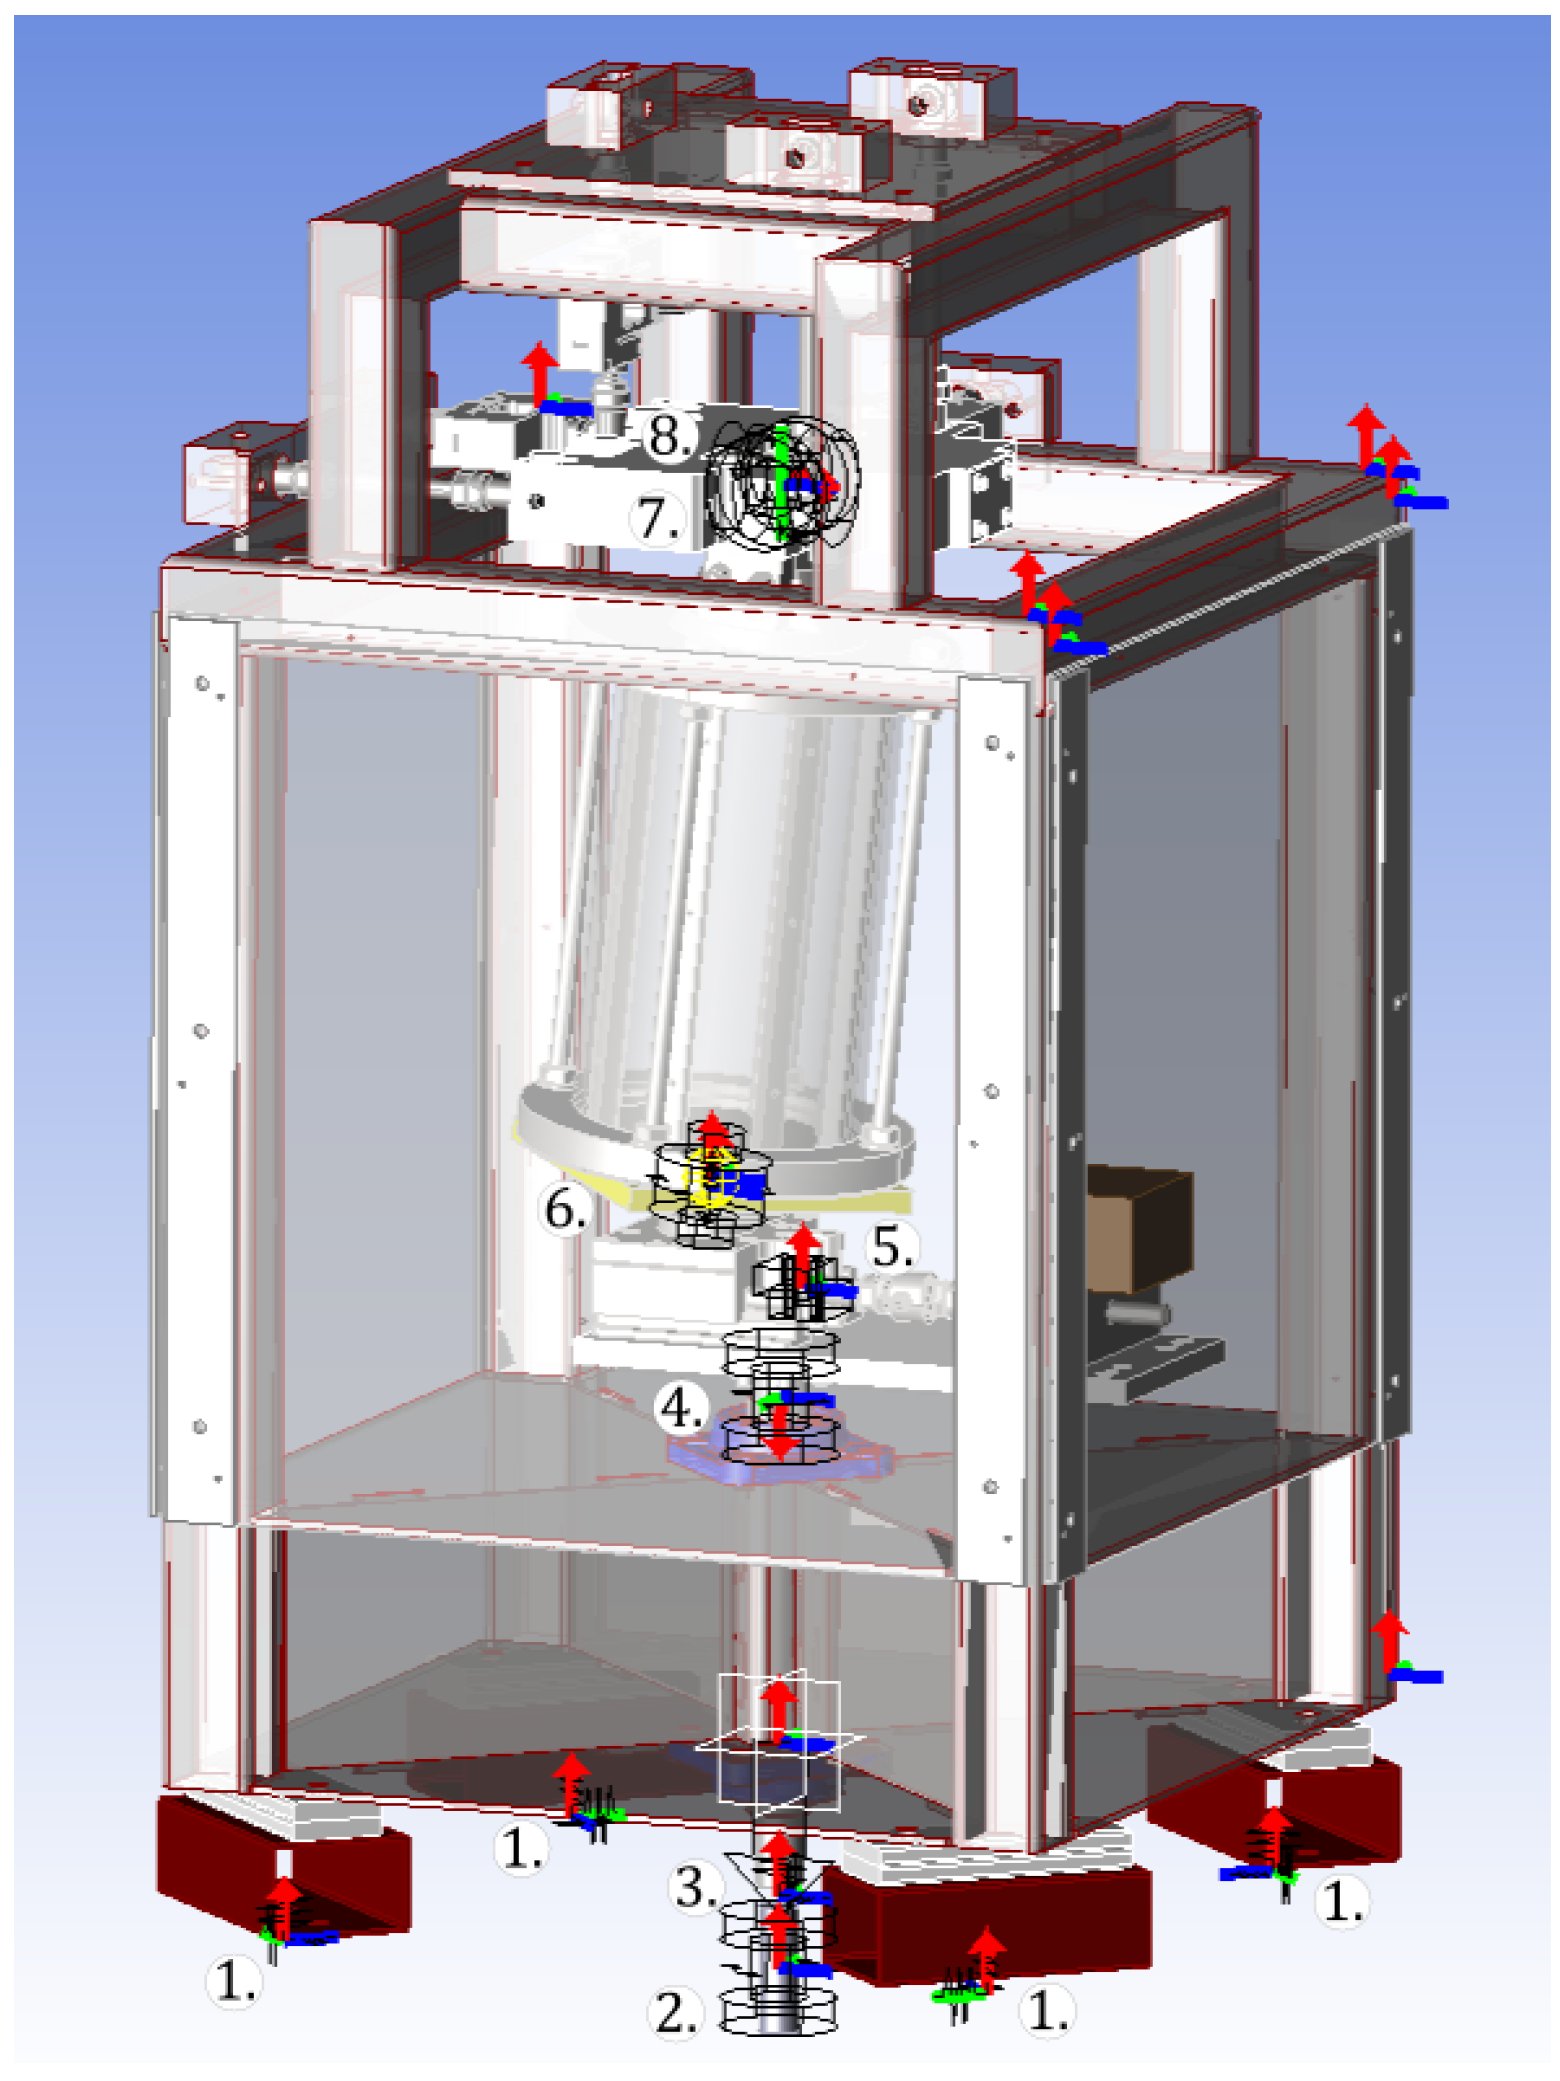
The simulation software used for MBD simulations was Ansys Motion 2024 R2. All physical geometry of the NuMill top frame, except fasteners, was depicted in the MBD model, as depicted in
Figure 6 along with relevant constraints. The geometric data were based on the computer-aided design (CAD) model of the NuMill. All geometry was modeled as rigid bodies, while flexible components such as the isolation mounts and tyre coupling were modeled as six degrees of freedom (DOF) bushings from the forces category in Ansys Motion. The stiffness and damping properties of these bushings are listed in
Table 3. The geometry was assumed to be rigid since the natural frequencies of the flexible modes were significantly higher than the rigid-body modes of interest [
5]. Contact detection between components was not modeled. Geometric components with no relative motion were combined using fixed joints. All numbered joints in
Figure 6 are described in the accompanying
Table 4.
Table 4 summarizes the joint types and DOF for each component connection in the MBD model. The global constraints to ground were provided by the four isolation mounts, which were modeled as bushings with six DOF. The intermediate shaft was constrained to ground using a revolute joint, allowing rotation about the global Z-axis only. The driveshaft was connected to the intermediate shaft using a bushing joint representing the tyre coupling, allowing for misalignment between the two shafts. The driveshaft was also connected to the frame using a revolute joint, allowing rotation about the frame Z-axis only.
A fixed joint between the radial load cell and the crank-pin carriage was declared at the connecting point location between the two bodies for force probing. The crank pin was connected to the chamber using a sphere and cylinder joint, allowing three rotational DOF and one translational DOF along the crank-pin axis. As mentioned previously, the crank pin inserts into a spherical roller bearing located in the bottom of the chamber. The chamber was connected to the universal joint bearing cross using a revolute joint, allowing rotation about the frame X-axis only. Finally, the bearing cross was connected to the frame using a revolute joint, allowing rotation about the frame Y-axis only. The remaining unmarked local coordinate systems (LCS), referred to as markers in Ansys Motion, in
Figure 6 were used for frame acceleration probing.
Material properties were applied to each geometric component. Density was the only relevant material property since no surface contacts were simulated. Only three material types were assigned: steel, aluminum, and acrylic polymethyl methacrylate. Each had a respective density of 7450 kg/m3, 2700 kg/m3 and 1200 kg/m3. The density of complex components such as the SG-Link was set to a value that resulted in the component’s actual mass. The total mass of the unribbed model with an empty chamber was and for the ribbed empty chamber, while the total mass of the physical NuMill with an unribbed empty chamber was found to be .
Acceleration due to gravity was specified as / in the global Z-direction. The data export frequency was at 3000 . This is about 250 times the highest shaft rotation frequency. The default dynamic simulation numeric settings were deemed to be sufficient and left as is. The initial simulation time step size was , the minimum step size was , and the maximum step size was .
One of the key inputs to the MBD simulation was the angular velocity of the driveshaft, which was prescribed as a function of time based on experimental data. The angular velocity profile was applied to the driveshaft revolute joint using a custom Python (Version 3.12.2) function imported into Ansys Motion. The script defining the function contained a downsampled version of experimental angular velocity data, which is linearly interpolated when simulation time is between two points, to provide a lookup table input profile. The function was defined so that when the experimental profile speed exceeded the prescribed simulation final steady-state speed, the input speed would remain constant until the experimental profile speed dropped below the final steady-state speed again. Typically, the simulation final steady-state speed was set to an exact number, while the experiments only approximated the desired speed. The full coast shutdown phase of the experimental profile was thus not included in the simulation, since the experimental results showed that the system dynamics during coast down were negligible compared to the steady-state operation.
All the same measurements taken during the physical experiments were replicated in the MBD simulation through digital probing. Two types of data were captured, namely kinetic (forces and moments) and kinematic (movement), and their probing methods differ in Ansys Motion. For the kinetic probing, the LCS of two bodies connected by a joint is used to define the measurement, and the location of the joint is where the forces and moments are calculated. Kinematic probing is carried out using an LCS relative to the global coordinate system (GCS); thus, if an LCS does not exist at the desired measurement location, a new one must be created.
A simulation run was performed for each experimental configuration described in
Table 2, with fewer runs required for the uncoupled MBD simulation, since no granular charge was included. Fewer final steady-state speed time-steps were simulated since a lower resolution was sufficient to capture the system dynamics without the granular charge. Two of the four experimental configurations could be simulated by the uncoupled MBD simulation. Eleven final steady-state speeds were simulated for each of these two configurations, only one run per final steady-state speed, resulting in a total of 22 uncoupled MBD simulation runs.
2.2.2. Coupled MBD–DEM Simulation Setup
For simulations that included the granular charge, a two-way coupled MBD–DEM simulation was performed. The simulation software used for DEM simulations was Ansys Rocky 2024 R2. To set up the coupled simulation, a functional mock-up unit (FMU) file needed to be exported from the uncoupled MBD simulation. The FMU file contained the geometry, component masses, motion, and flexible component dynamics of the mechanical system, which was imported into Ansys Rocky for the coupled simulation. When generating the FMU file, it needs to be specified which geometric components will interact with the DEM particles. In this case, only the grinding chamber was selected to interact with the particles, while all other components were set to be non-interactive. The imported MBD geometry in Ansys Rocky is the same as was depicted in
Figure 6.
The DEM simulation was set up without geometry surface wear or particle breakage models since the steel ball bearing pellets were highly durable. The steel pellets were modeled as rigid spheres with a diameter of 5
. The entire chamber’s surfaces were prescribed acrylic facet properties, including the aluminum chamber top and bottom. When ribbed chamber geometry was included, steel properties were applied to the rib facets. The DEM numeric model and material properties used in the simulation are summarized in
Table 5. For the coupled simulations, one simulation run was performed for each of the 11 final steady-state speeds for the experimental configuration described in
Table 2 with granular charge.
3. Results and Discussion
The experiments were designed with two objectives in mind: (1) to validate the simulation and quantify the error, and (2) to identify the sensitivity of the system behavior to various parameters. With the basic simulation model validated, the ability of the model to replicate the experimentally observed trends (sensitivities) when varying parameters could be investigated. The influence of each parameter on the system dynamics is discussed in the respective sections below. The results are divided into those (1) experimentally recorded and observed, including the sensitivity of the system response to parameter changes, and (2) simulation results where the model accuracy is reported.
Although transient startup behavior was recorded in the experiments and the simulations, it was found that it provided the same insights into the system dynamics as the steady-state behavior. Thus, for comparison purposes, mostly steady-state plots are shown for the simulation and experimental results. This does not imply that transient behavior is unimportant, but rather that the steady-state results sufficiently captured the influence of the parameters investigated. The steady-state mean values were calculated by averaging the data over the last three seconds of the simulation and the experiment’s respective steady states.
3.1. Experimental Results
3.1.1. Repeatability
The run-to-run variability of steady-state force and torque measurements was assessed by comparing statistical results obtained from three repeated tests of the same experimental configuration. For the empty chamber operating at the two extreme rotational speeds of 250 RPM and 750 RPM, the mean radial force (averaged over time) on the crank pin varied by less than 1 % between repeat runs. Similarly, the mean torque measured at 750 RPM exhibited a variation of less than 2 %. These results demonstrate very good repeatability and therefore, in the analyses that follow, a single value is reported per test case.
3.1.2. Parameter Sensitivity
The influence of the mount type is shown by comparing experimental results of the previously rigidly mounted NuMill setup [
5] to those of the current setup with flexible isolation mounts.
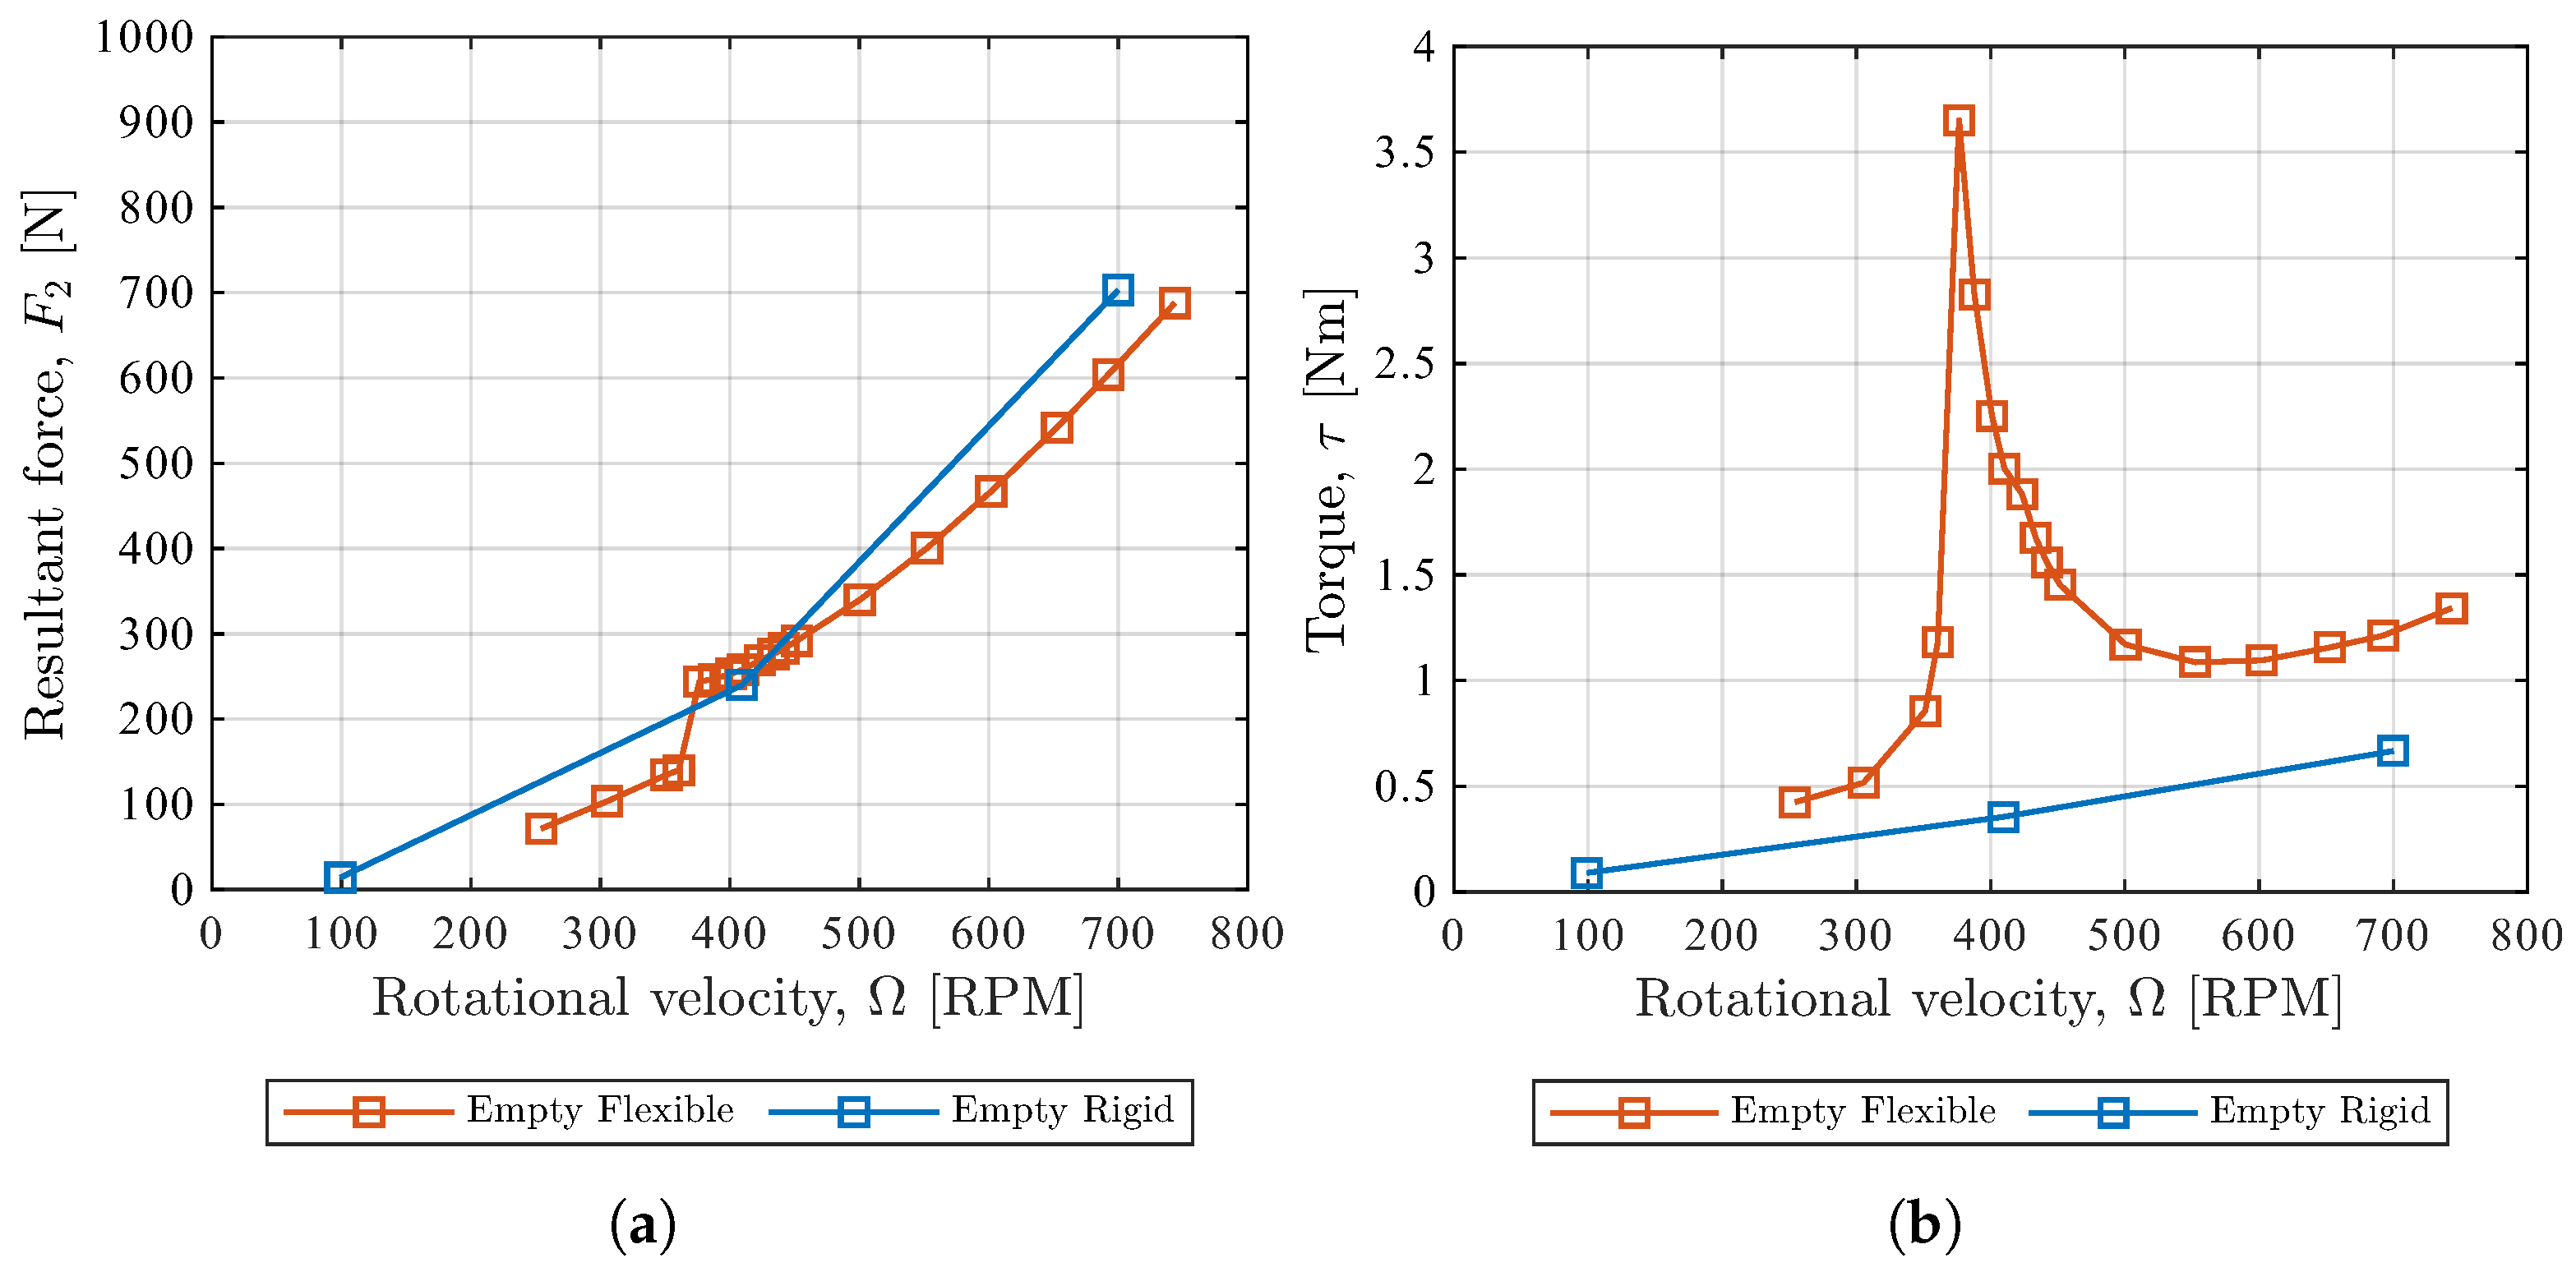
Figure 7 shows the resultant force at the crank pin and the driveshaft torque for the two setups. With a rigidly mounted setup, the force and torque steadily increased with an increase in rotation speed (100 RPM to 700 RPM), but with the flexible mounts, there was a peak in the force and a significant peak in the torque when passing through the resonant frequency. Comparing the steady-state crank-pin force at a speed of 700 RPM, it decreased from approximately 700
to 600
when the flexible mount was used,
Figure 7a. However, the torque increased when the flexible mounts were fitted,
Figure 7b. All further parameter sensitivity tests were conducted with isolation mounts.
To investigate the influence of charge mass with flexible mounts, the experimental results of the empty chamber with no additional mass are compared to those of the chamber with the
rigid mass bars.
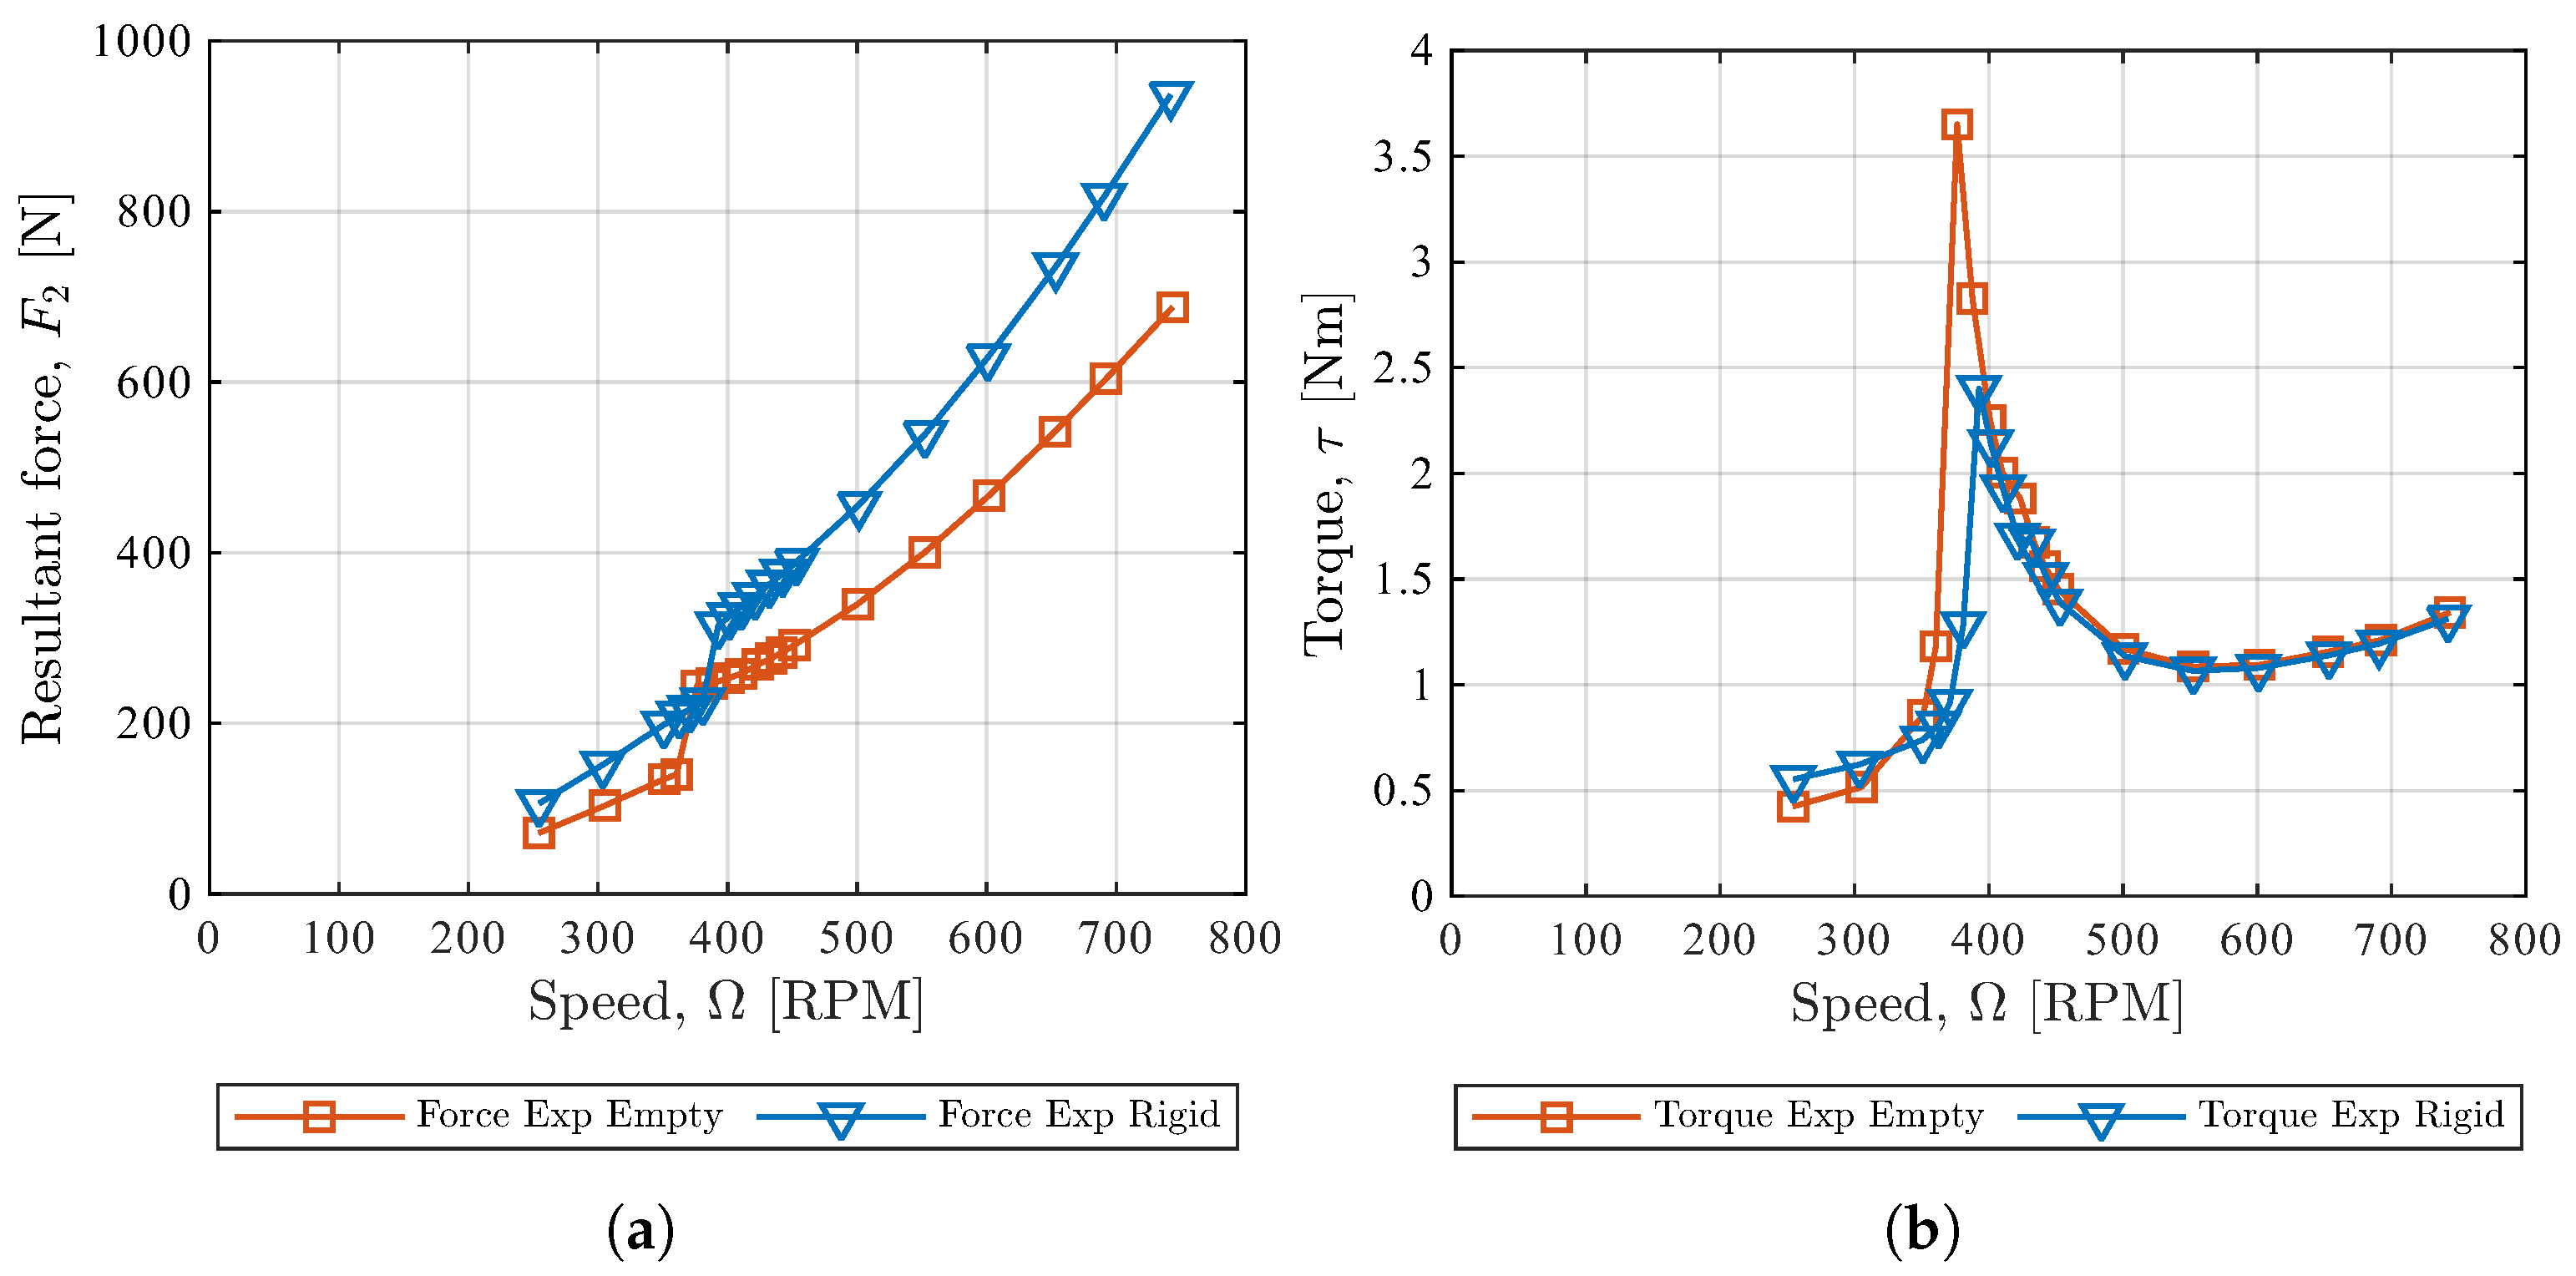
Figure 8a shows that increasing the rigid mass increased the resultant force across the entire speed range. This is expected since the centrifugal force generated at a specific speed is proportional to the mass. On the other hand, as shown in
Figure 8b, the torque was not significantly affected by the change in rigid mass, except close to the resonant frequency (speed) where it decreased. At a steady speed, it is expected that the mass would not influence the torque, which, with no acceleration, should just overcome frictional and other losses. However, with an increase in the rigid mass, and at the resonant speed, it was observed that the displacement of the frame decreased. This reduced the flex in all the mounts, and could be the reason for the decrease in torque (at the resonant speed) when increasing the rigid mass.
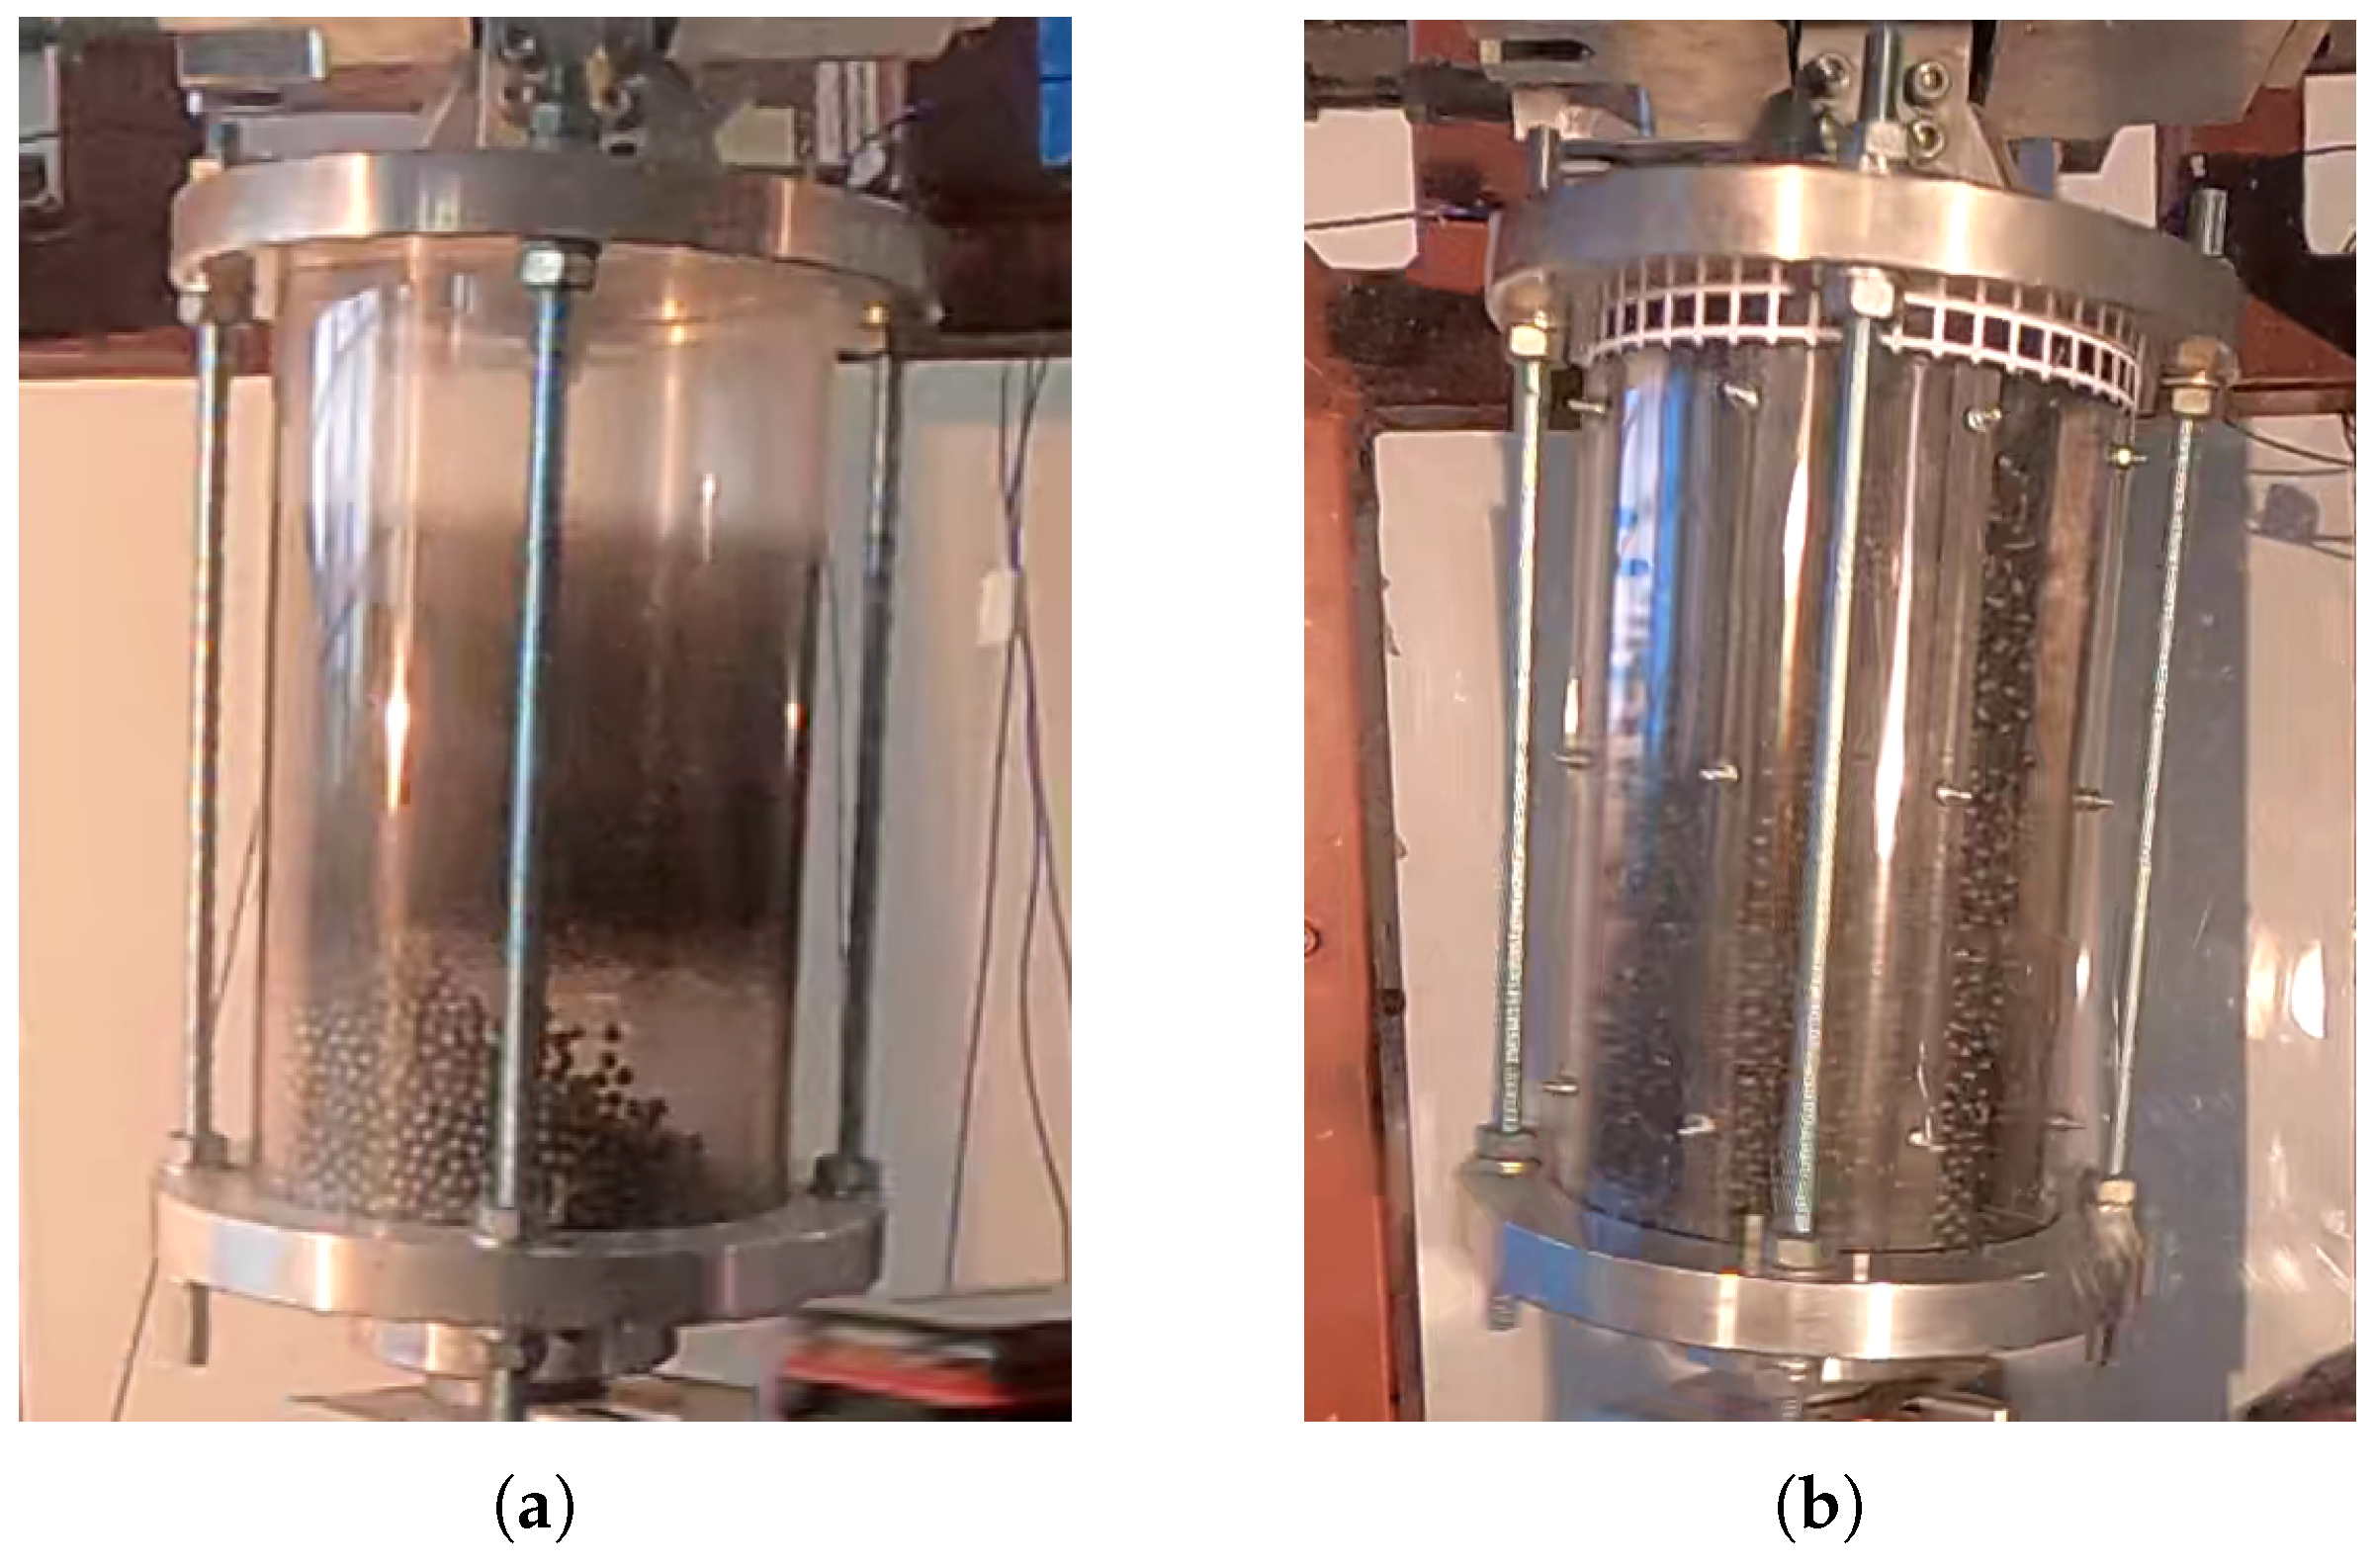
To investigate the influence of chamber geometry, the experimental results of unribbed and ribbed chamber geometries with a steel pellet charge were compared. By introducing ribs, the bulk behavior of the granular charge changed from a bulk mass rolling action along the surface of the chamber (
Figure 9a), to a more suspended or dispersed flowing action (
Figure 9b).
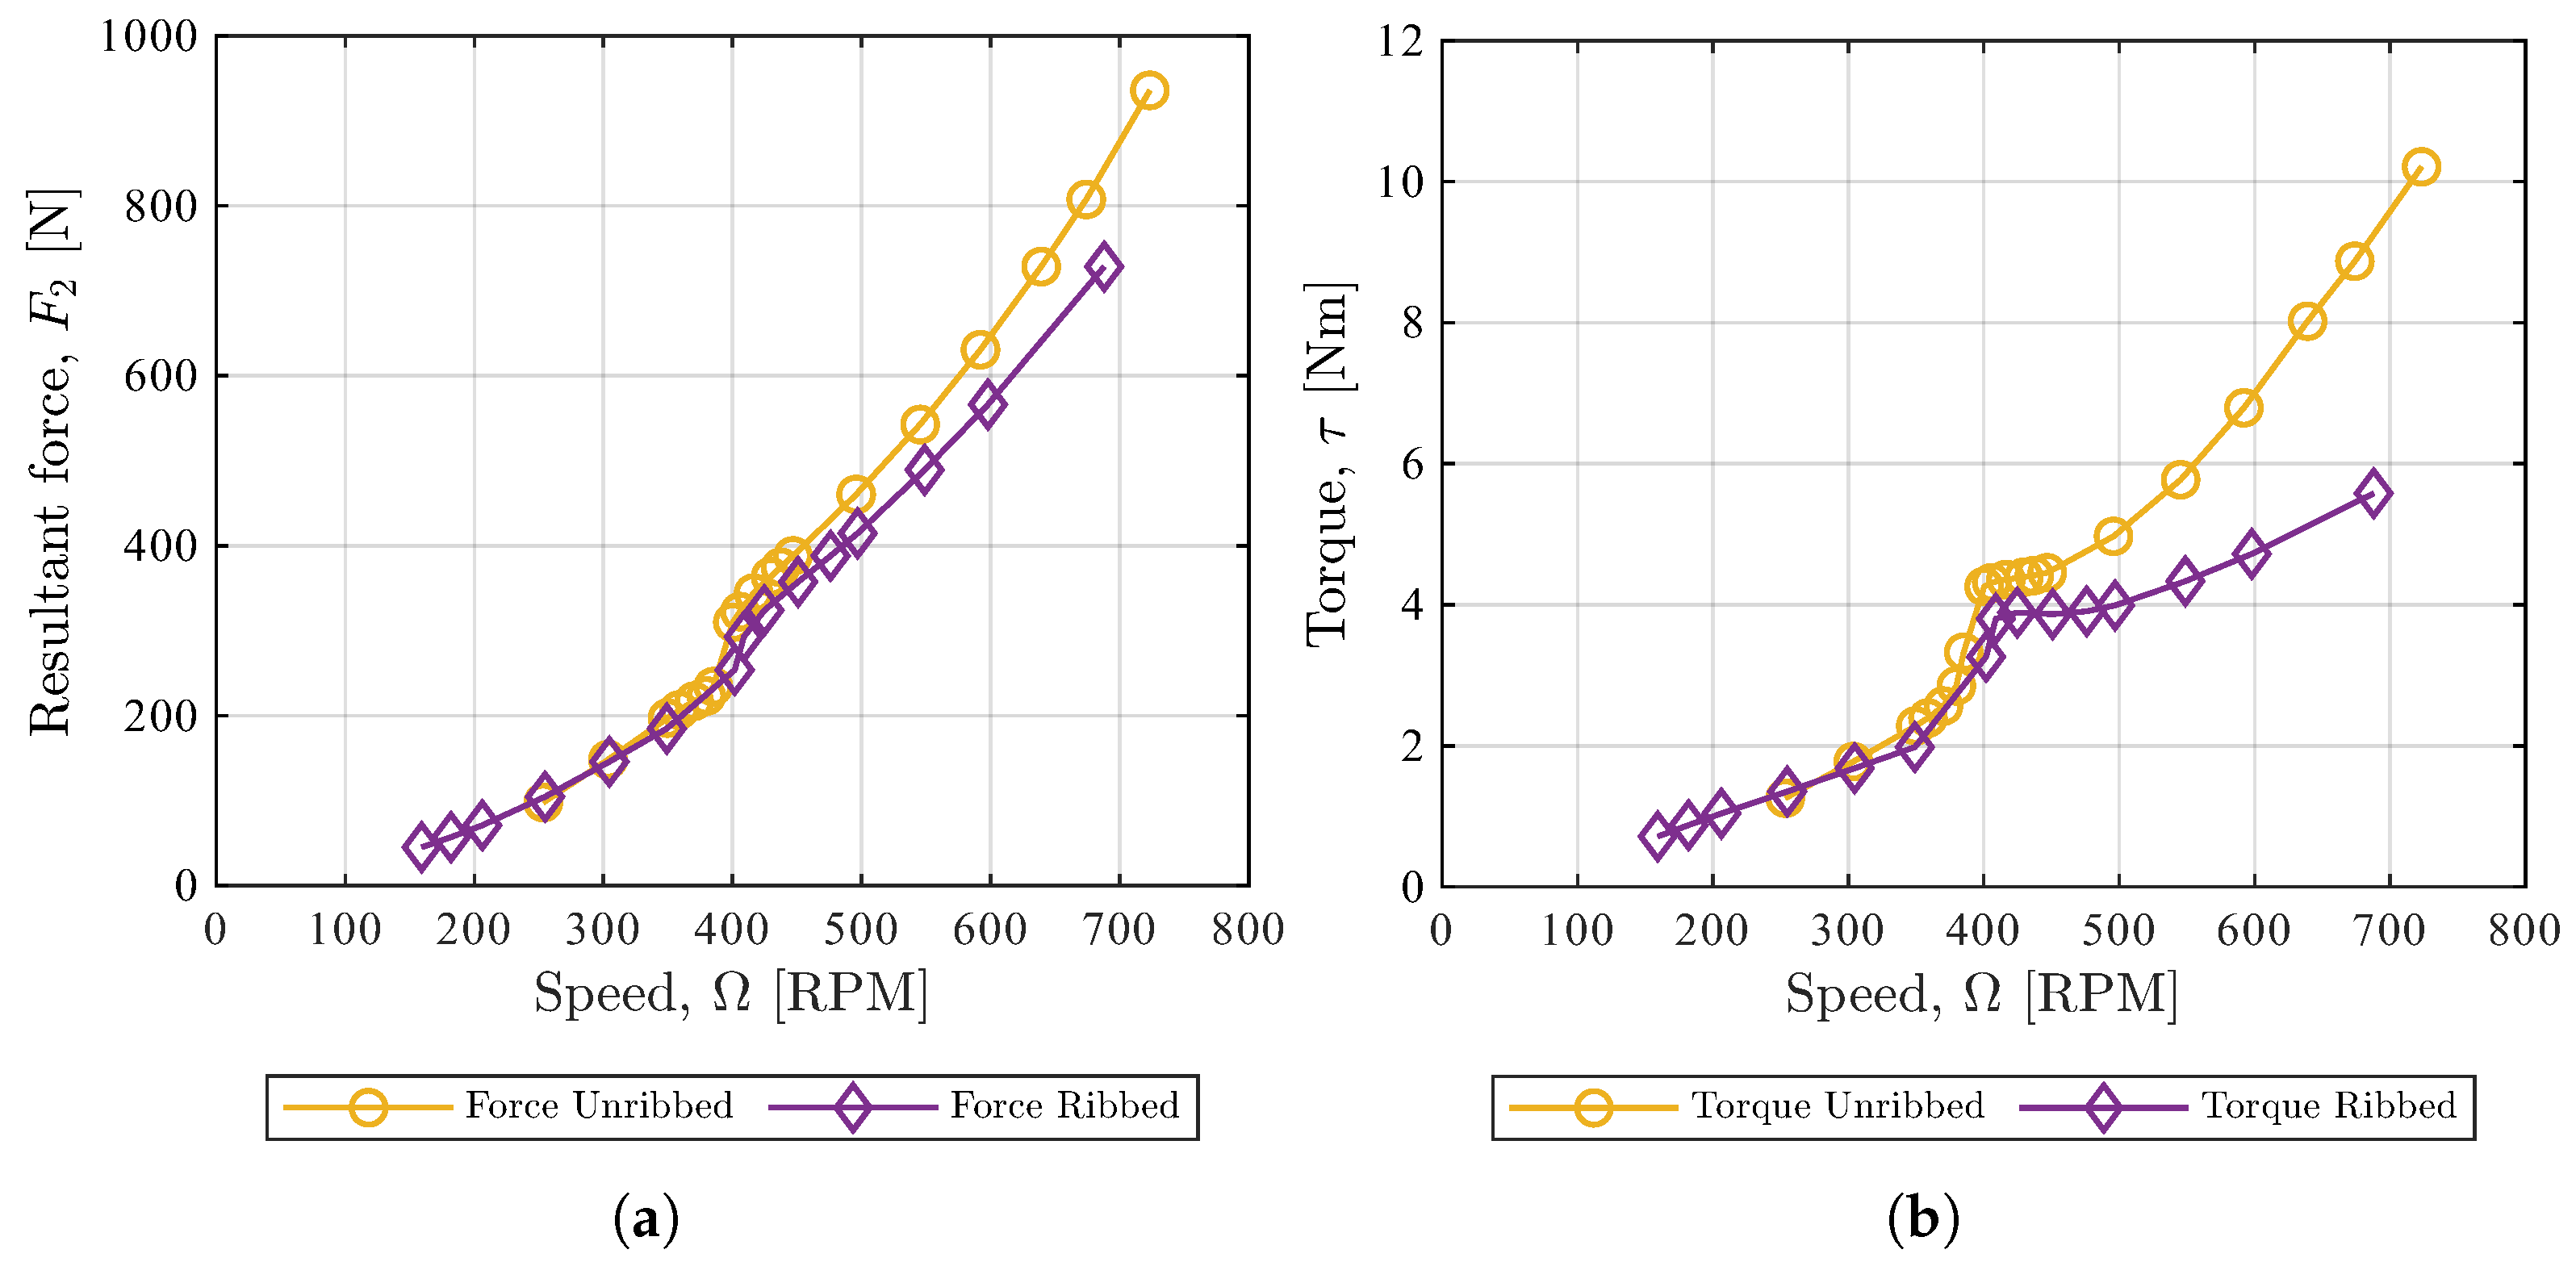
Figure 10 shows that changing the chamber geometry from unribbed to ribbed caused a noticeable decrease in the resultant crank-pin force and the driveshaft torque.
Figure 10 also shows that the difference made by introducing ribs was larger at higher speeds than at lower speeds, especially those above the resonant frequency. The reduction in the force and the torque is likely due to the reduced contact time between the granular charge and the chamber surface when ribs are introduced, thus reducing the effective mass of the cylinder. Also, in the unribbed chamber, the pellets rolled and/or slid along the chamber’s cylindrical surface, which resulted in significant frictional losses. However, in the ribbed chamber, the suspended or dispersed behavior of the pellets was likely due to the relatively high particle stiffness, along with the ribs obstructing the pellets from rolling and/or sliding and rather promoting elastic impact (bouncing). It can also be seen that with the presence of a granular charge in the unribbed chamber (
Figure 10b), the peak in torque around the resonant frequency was much less pronounced than when a rigid charge was used (
Figure 8b)).
The effects of each parameter are summarized in
Table 6 with the percentage change at 700 RPM given in brackets.
3.2. Simulation Results
The accuracy of the simulation relative to experimental measurements for each configuration is assessed in this section. The simulation qualitatively matched the effects of each parameter as reported in
Table 6.
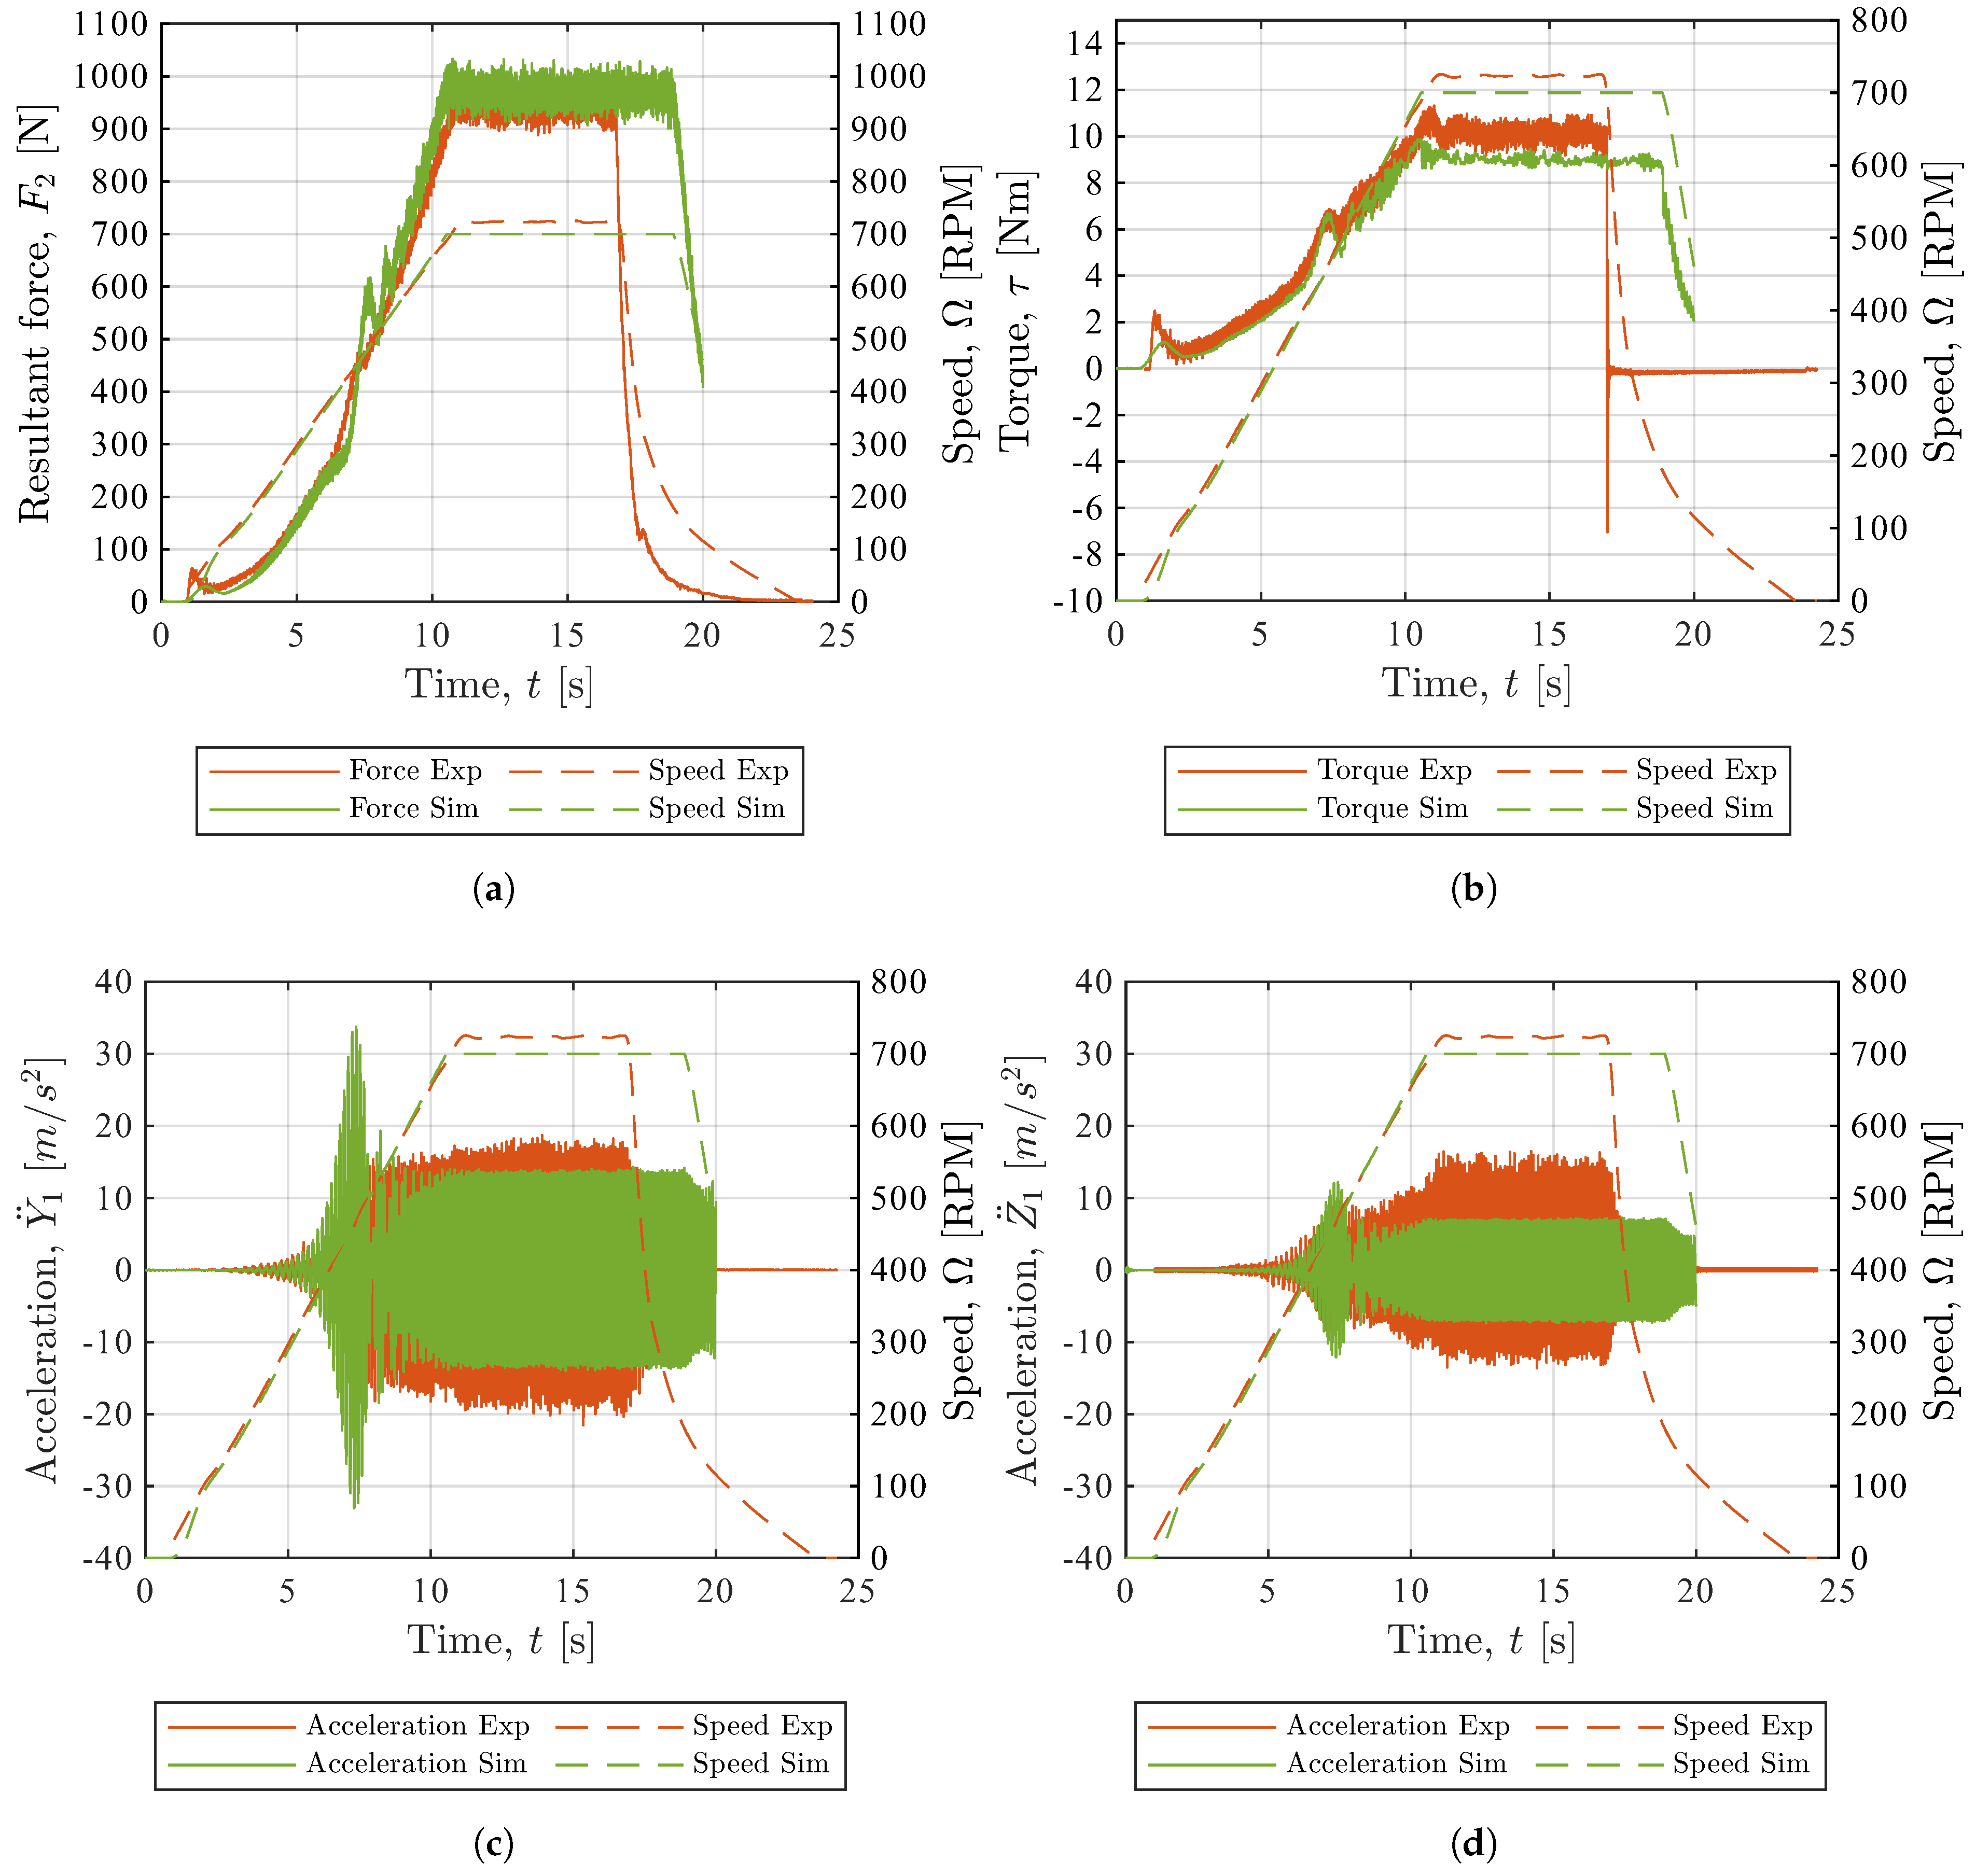
Transient comparisons are first presented to demonstrate that the coupled simulation captured both the steady-state system response and the dominant dynamic response observed during startup. For this purpose, the case with the unribbed chamber, a steel pellet charge, and a shaft acceleration of 70 RPM/s was used. In the experiment, the rotation speed was 723 RPM, and in the simulation it was 700 RPM, 3% less than in the experiment.
The transient force on the crank pin is shown in
Figure 11a. The dashed lines in this graph (and the others) show the ramp-up (acceleration), steady-state, and ramp-down (deceleration) of the driveshaft rotation speed. During acceleration, the force increased and showed a bit of a jump as the speed went through the resonant frequency at roughly the 7 second mark. With a constant speed, the force remained constant with some high-frequency content, and during the ramp-down phase, it decreased. Focusing on the steady-state region, the coupled simulation overpredicted the force on the crank pin by only 5%.
Figure 11b shows a similar response for the driveshaft torque. Again, the result from the simulation closely followed the measured behavior, and at steady-state, the simulation underpredicted the torque by 11%.
The horizontal and vertical acceleration of the frame are shown in
Figure 11c and
Figure 11d, respectively. The horizontal accelerations show a clear peak at the resonant frequency, and both acceleration components remained mostly symmetric around the zero value. The simulation overpredicted the horizontal acceleration amplitude by 5%, while the vertical acceleration amplitude was underpredicted by 14%. When comparing simulated and experimental resonance frequencies, the difference was 8% with the experiment at
(440 RPM) and the simulation predicting
(473 RPM).
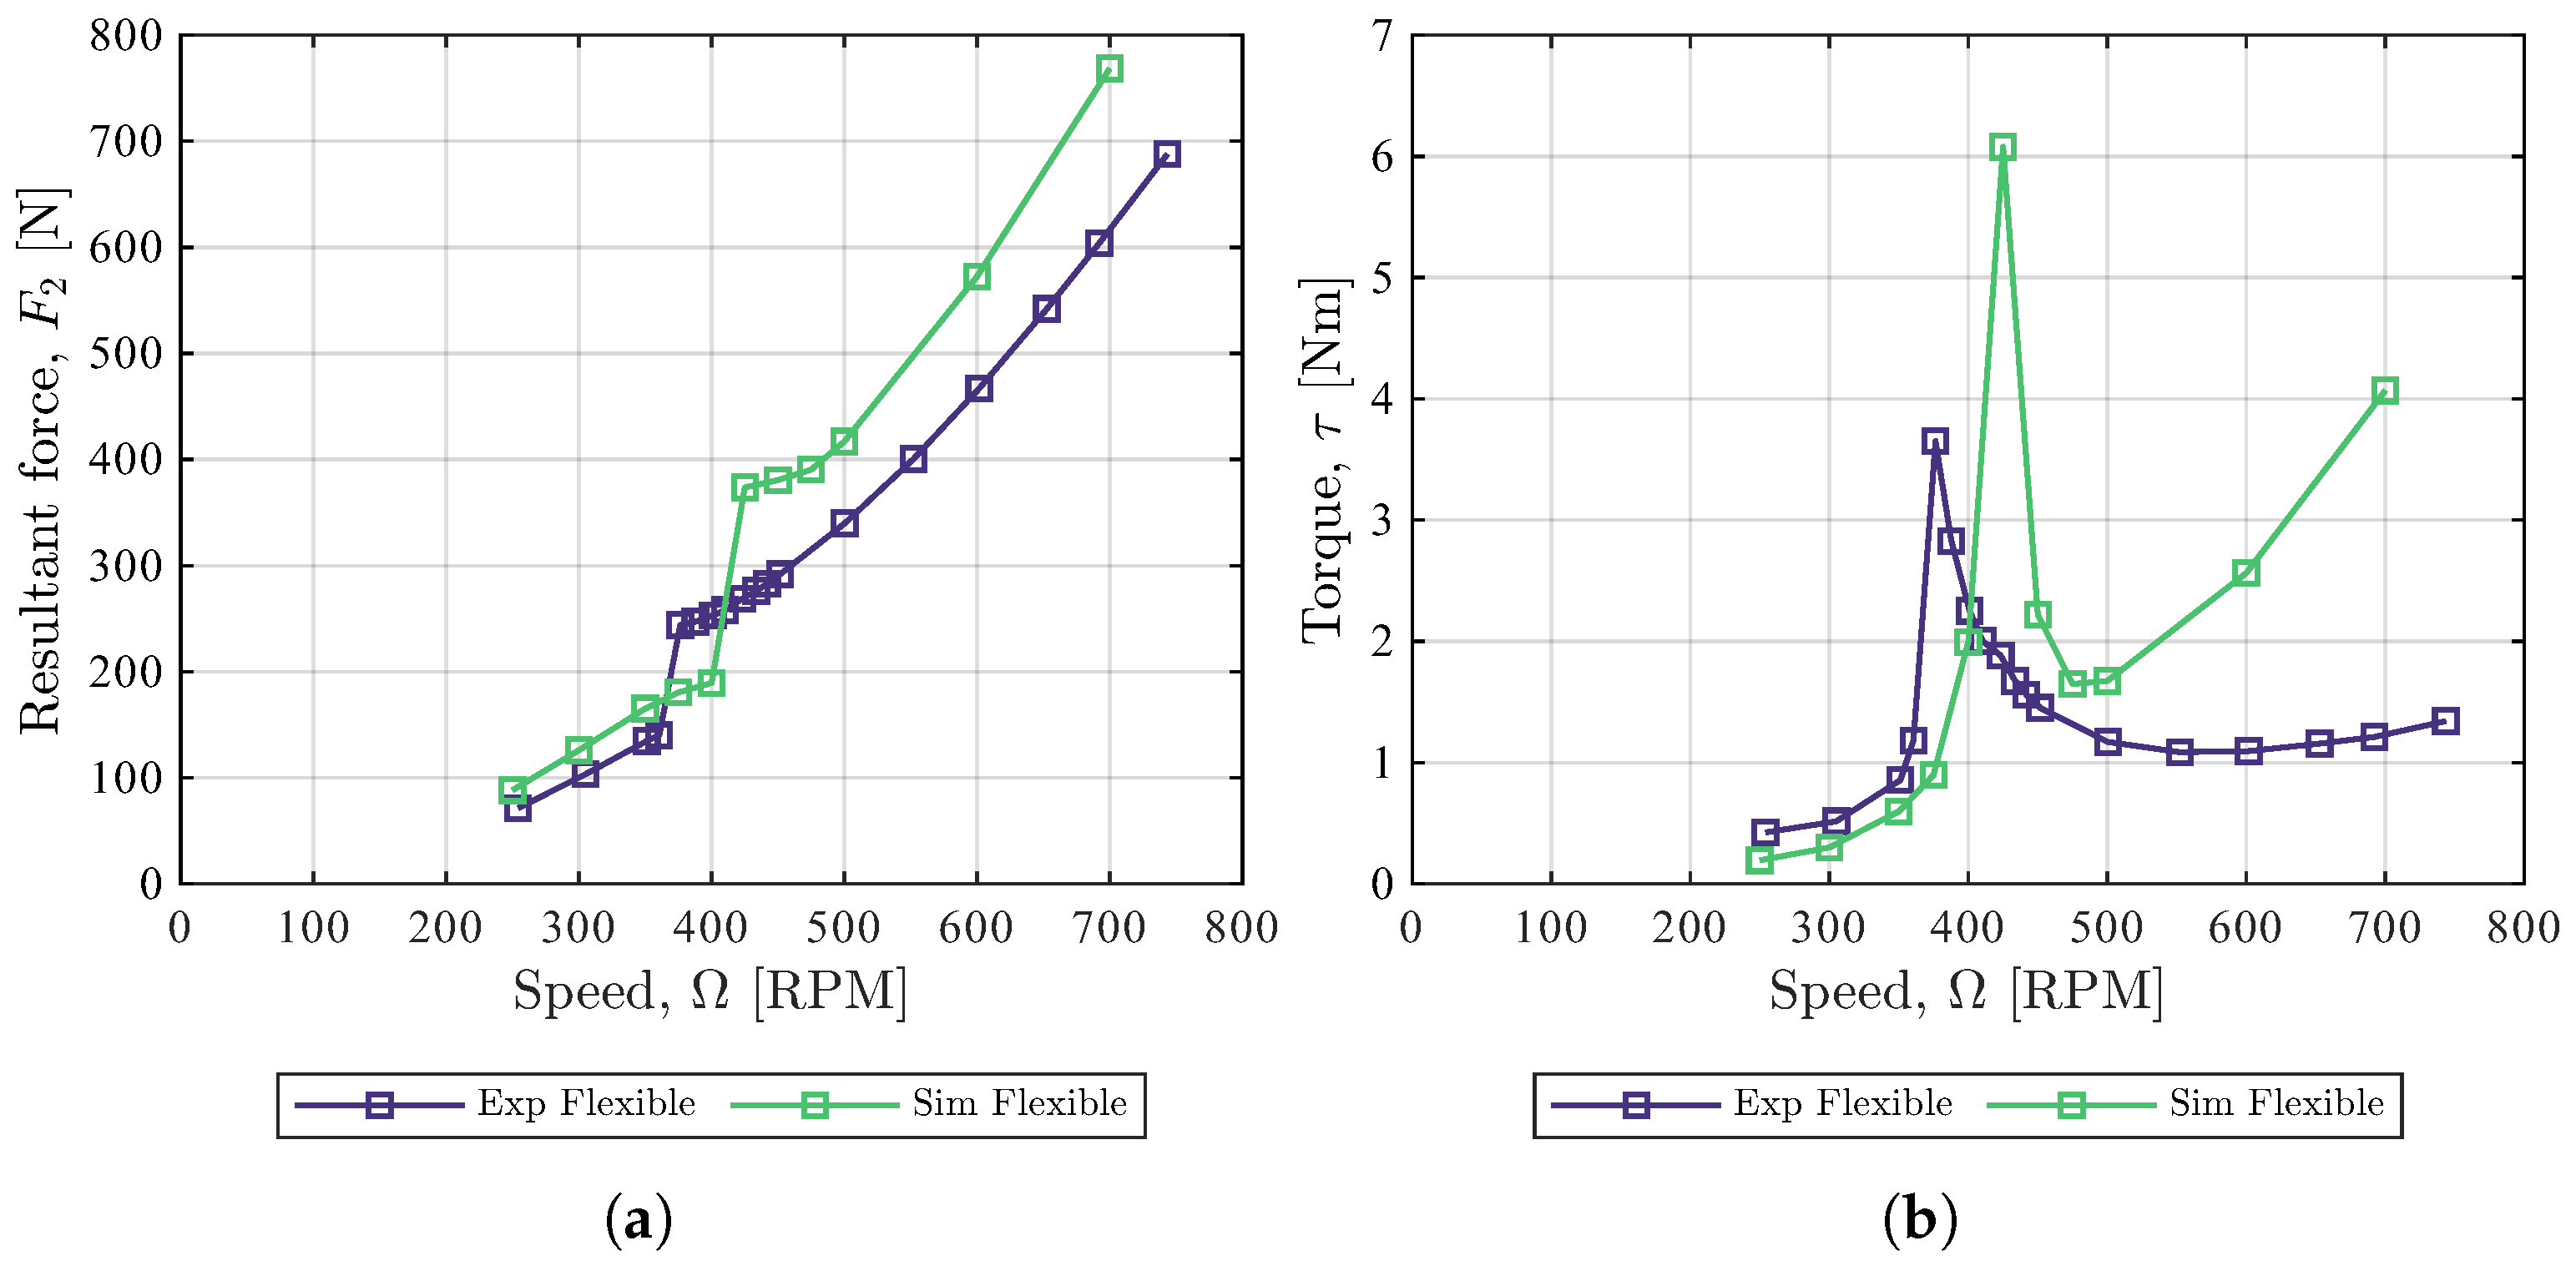
Figure 12 compares the steady-state crank-pin resultant force and the steady -state driveshaft torque for an unribbed, empty chamber with flexible isolation mounts. The simulation accurately predicted the general trend where the crank-pin force increased with an increase in rotation speed. However, the force magnitude was overpredicted over the whole speed range. For speeds at the resonance frequency and higher, the simulation overpredicted the torque, indicating a possible underestimation of energy dissipation. In addition, the simulation predicted a higher rigid-body resonant frequency, suggesting that the effective system stiffness is overpredicted. At 700 RPM, the simulation overpredicted the crank-pin force by 27% and overpredicted the driveshaft torque by a factor of 3.4.
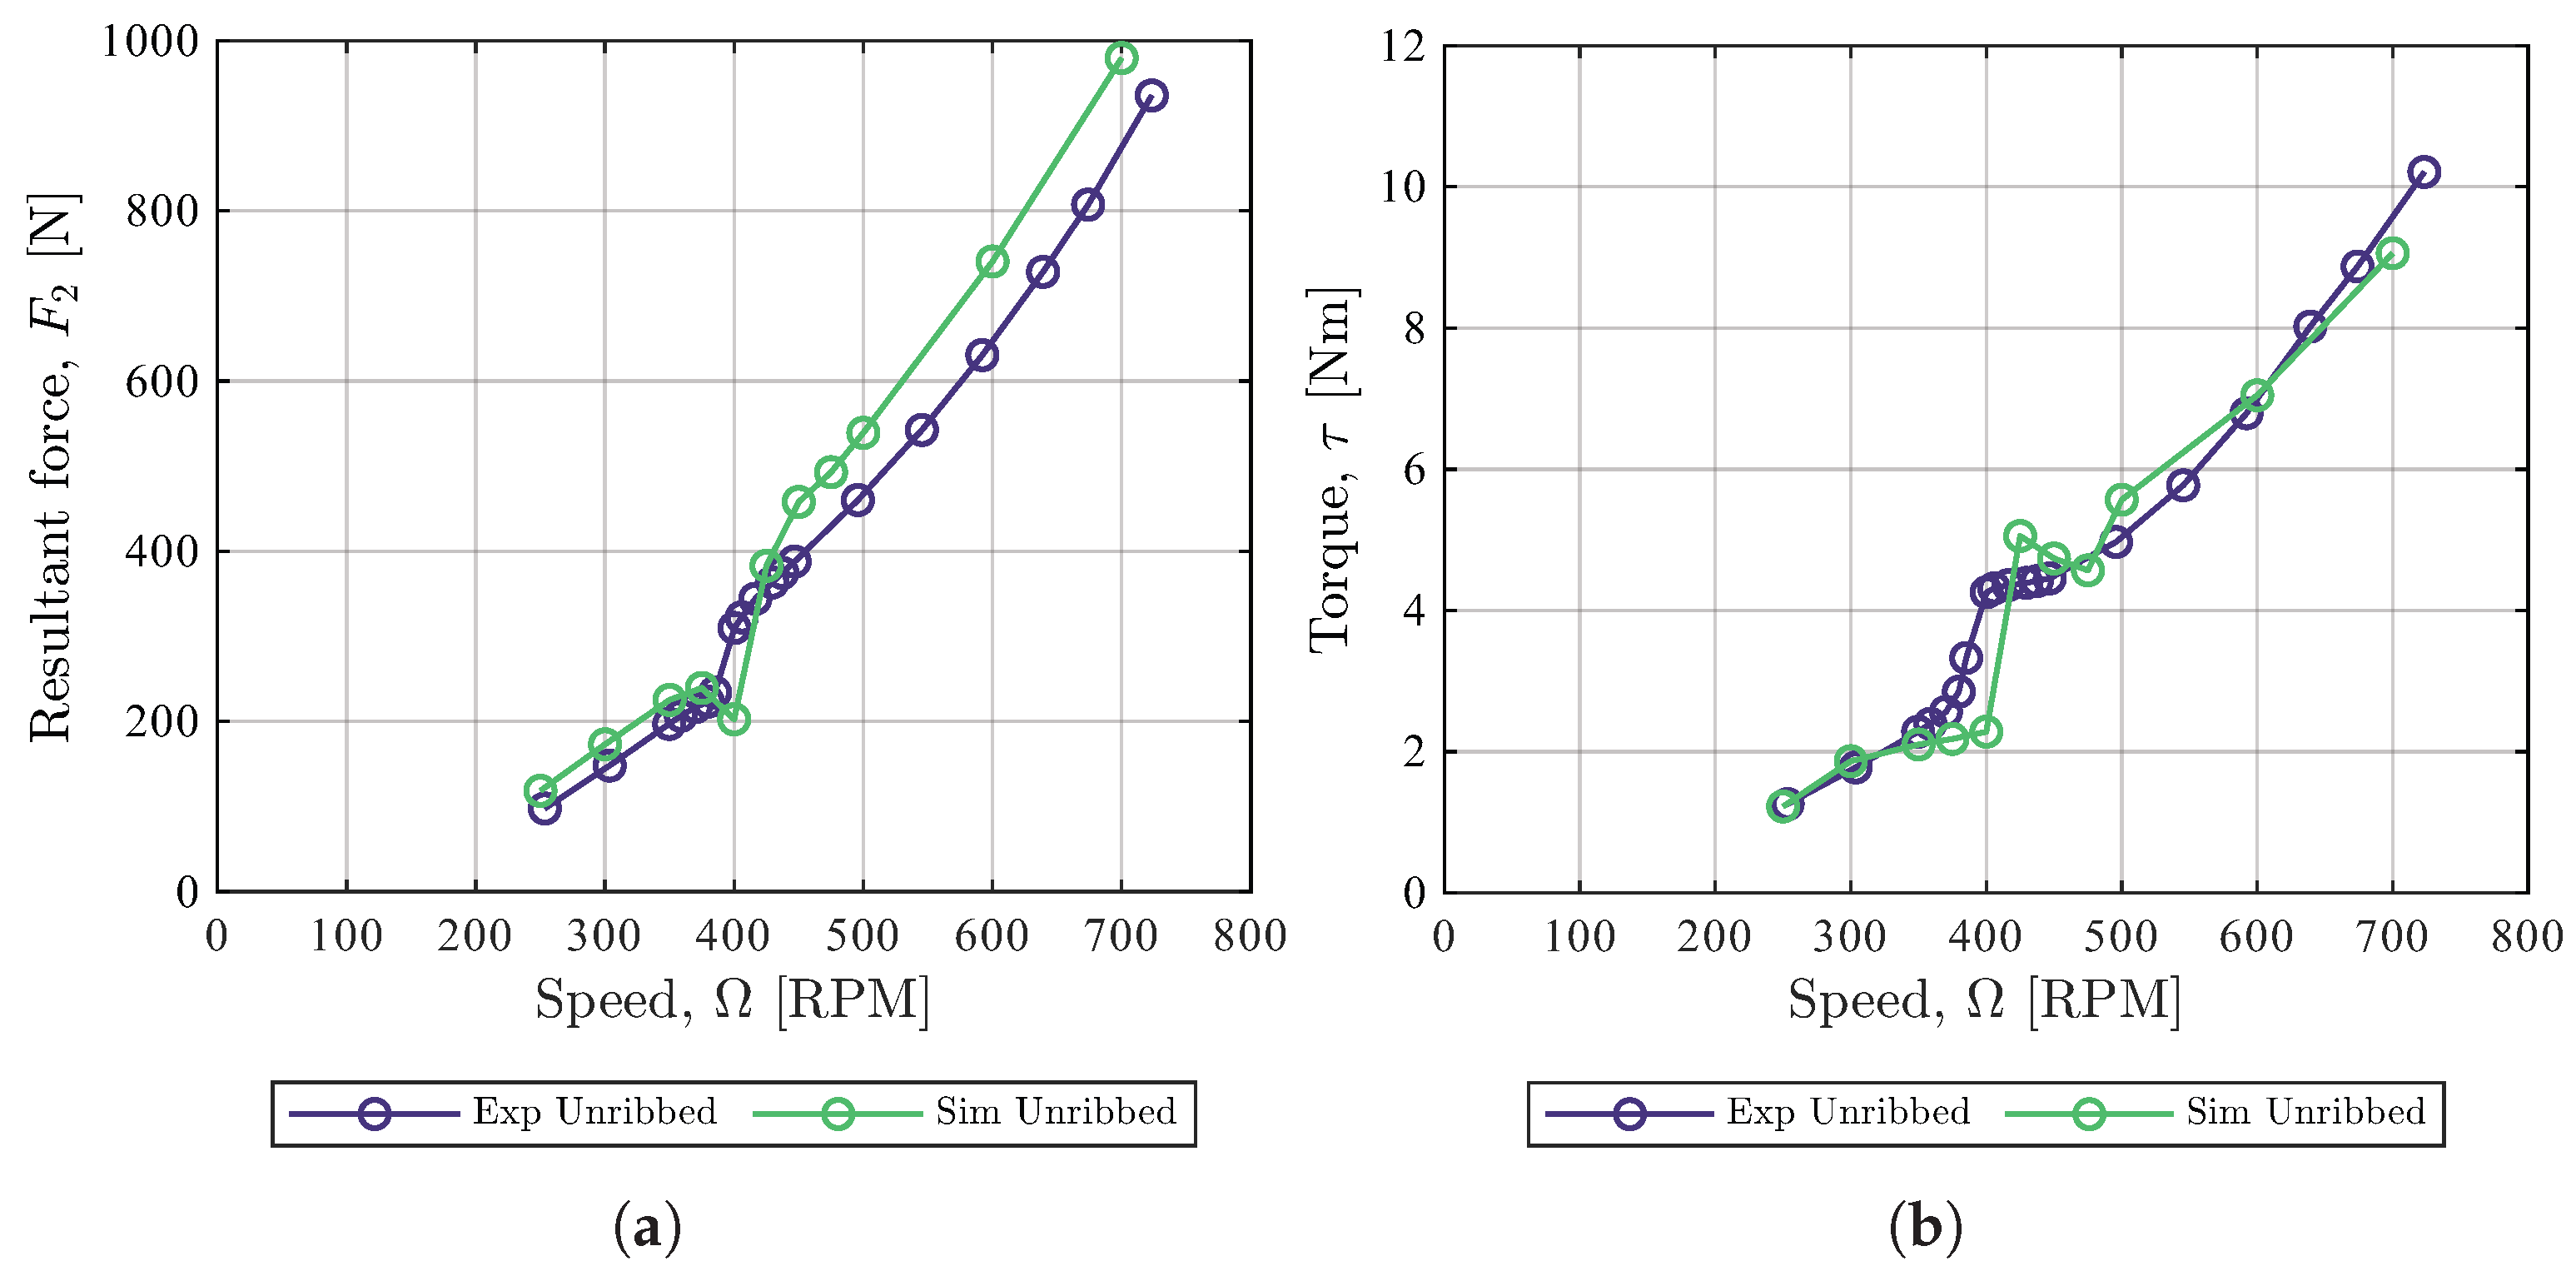
Figure 13 compares the steady-state crank-pin resultant force and the steady-state driveshaft torque for an unribbed chamber containing a granular steel pellet charge with flexible isolation mounts. The coupled MBD–DEM simulation accurately predicted the general trend where the crank-pin force and the driveshaft torque increased with an increase in speed. At 700 RPM, the simulation overpredicted the crank-pin force by 5% and underpredicted the driveshaft torque by 11%. Compared to the uncoupled MBD simulations shown in
Figure 12, the coupled MBD–DEM simulations exhibited substantially improved quantitative agreement with the force and torque measurements. This suggests that the coupled model accurately predicts the effects of the granular charge, including the general flow of the charge relative to the chamber, and the inter-pellet and pellet-chamber frictional losses.
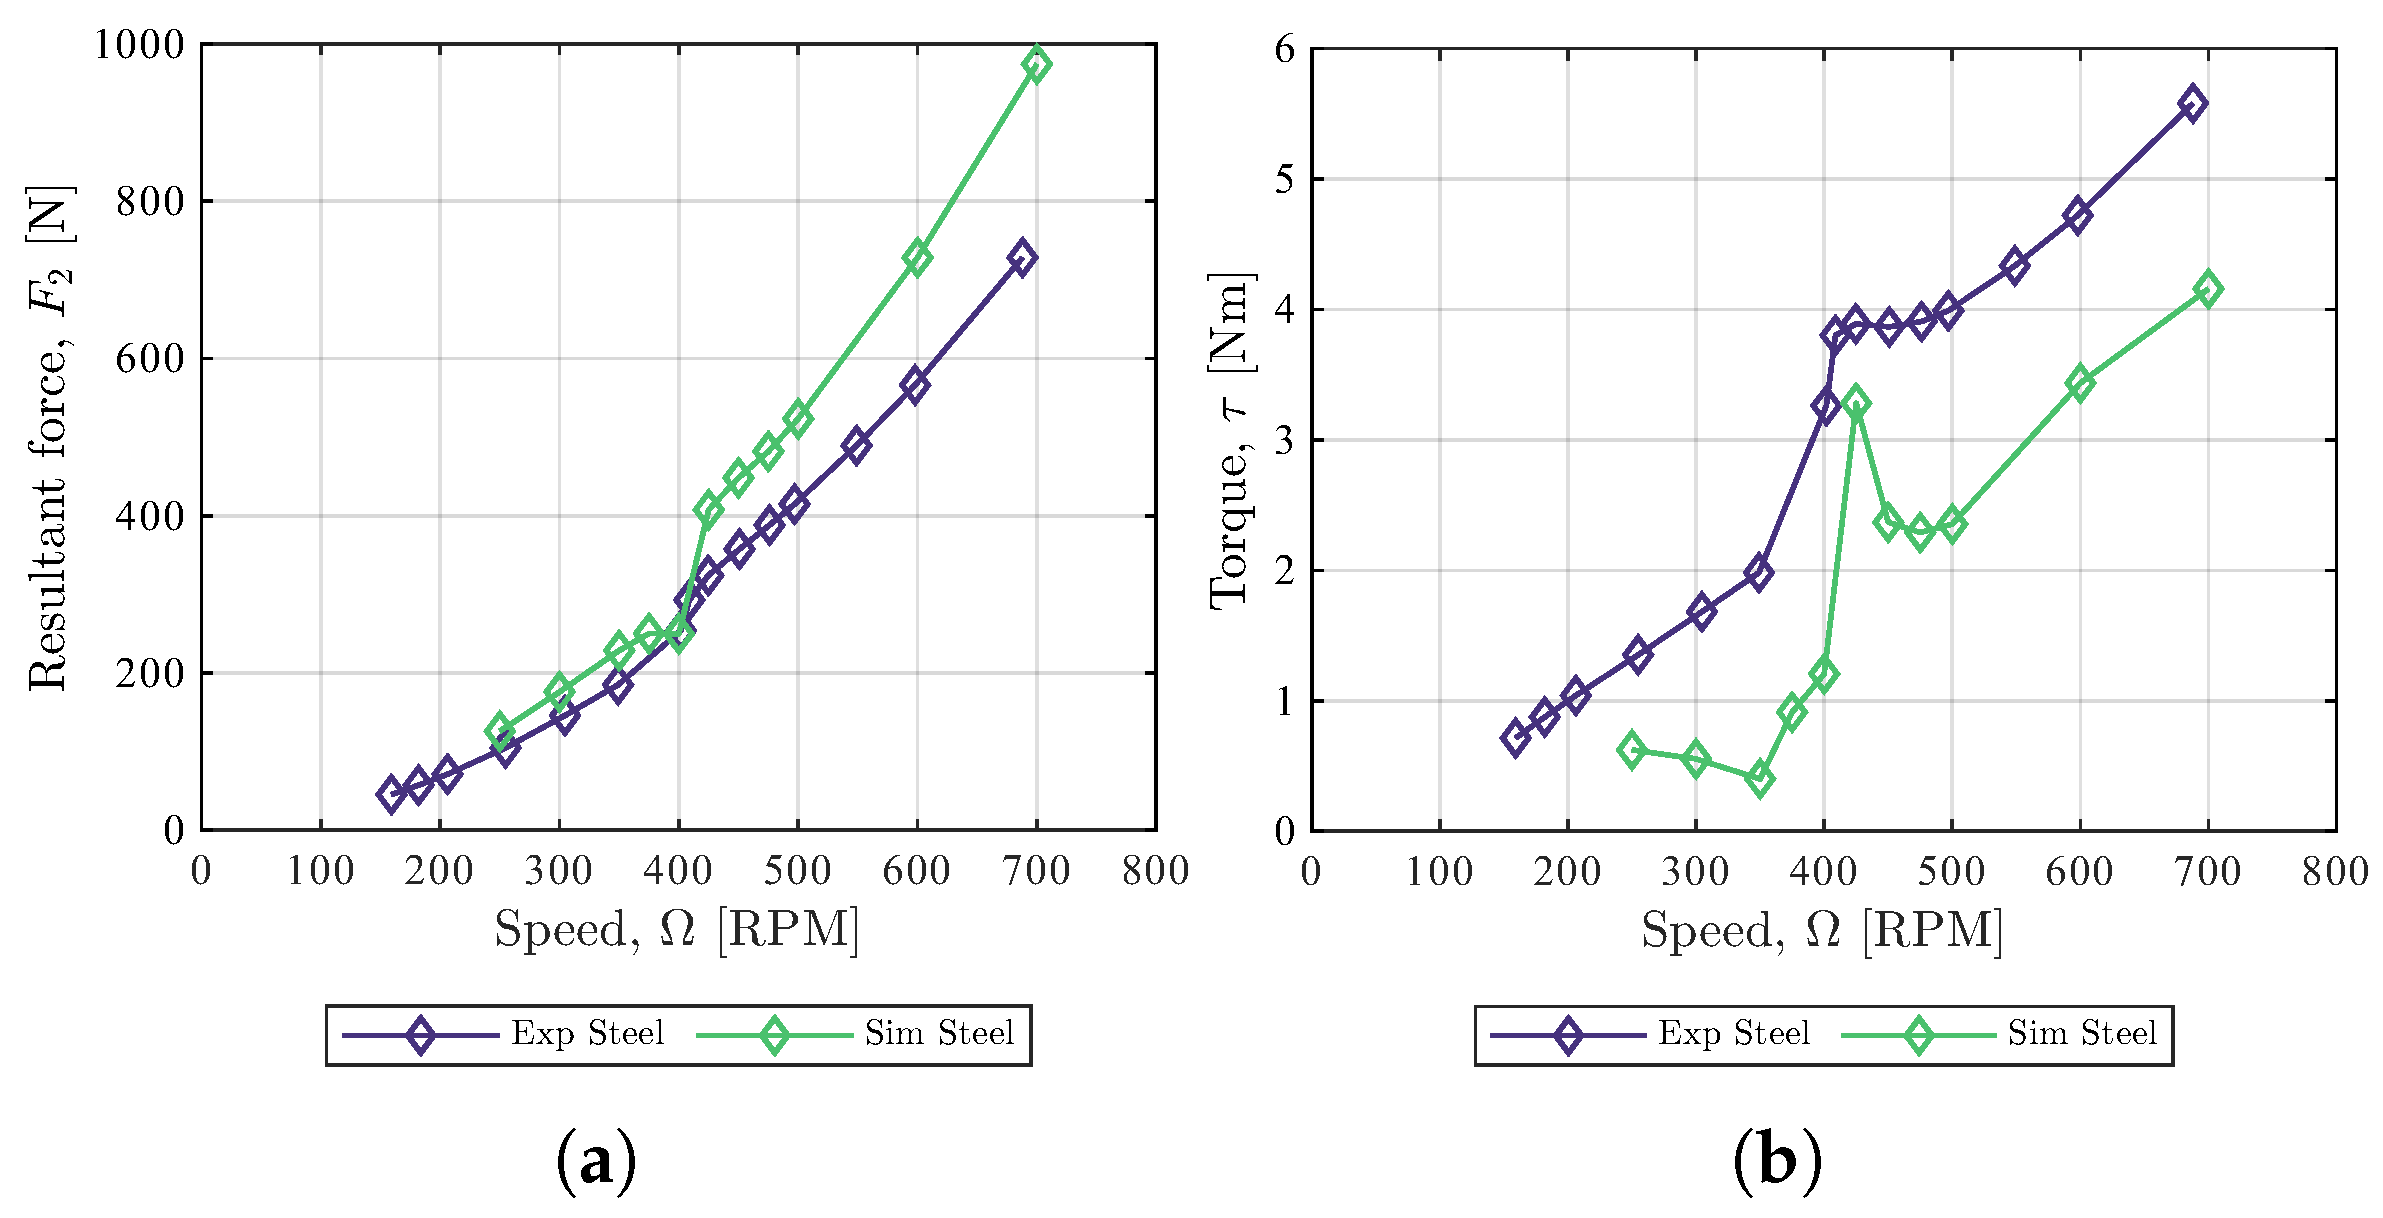
Having established the simulation accuracy for a granular charge in an unribbed chamber, the influence of a ribbed chamber on the simulation accuracy is shown in
Figure 14. The coupled simulation exhibited larger discrepancies than observed for the unribbed granular case shown in
Figure 13. It is also seen that around the rigid-body resonant frequency, the simulated torque response was more sensitive to the speed than the experimental result. At 700 RPM, the simulation overpredicted the crank-pin resultant force by 34% and underpredicted the driveshaft torque by 25%.
While the simulation captured the general form of the steady-state response, these results indicate that the combined effects of chamber ribbing and granular contact dynamics introduced additional modeling uncertainties. This could be due to the nature of the pellet-chamber contacts, which is more of an impact when ribs are present, compared to a more sliding action without the ribs. During sliding, energy is dissipated through friction, but during impact, material damping is the main mechanism for the dissipation of energy. The results suggest that the model might be more sensitive to changes in the impact contact dynamics and parameters such as the contact stiffness and damping, compared to sliding dynamics and the friction parameters.
To consolidate the case-by-case comparisons presented above, the simulation accuracy for each condition at 700 RPM is summarized in
Table 7. The percentage error is reported relative to the experimental steady-state mean values.
4. Conclusions
To inform the design and operation of nutating mills, this study combined experimental investigation and numerical simulation to extend previous work on the NuMill. Modifications to the NuMill, including the installation of vibration isolation mounts and chamber ribs, enabled closer representation of Hicom operating conditions. The dynamic response of the modified system was characterized experimentally over a range of operating conditions, and a two-way coupled MBD–DEM simulation was developed to capture charge–structure interaction effects introduced by the isolation mounts.
The experimental results showed that the simplifying assumption of replacing the granular charge with a rigid mass significantly changed the structural dynamics. For example, using a rigid charge (mass) at a rotation speed of 700 RPM, the resultant force at the crank pin was 21% larger compared to when a granular charge was used. On the other hand, the driveshaft torque was 82% lower. Although the overprediction of the crank pin force would lead to a conservative design, the underprediction of the torque would lead to an undersized driveshaft. Surprisingly, the inclusion of chamber ribs with granular charge decreased the crank-pin force and the driveshaft torque.
The coupled simulation demonstrated reasonable agreement with the experimental results across different configurations. The case most representative of Hicom operating conditions, namely the ribbed chamber with granular charge at 700 RPM, resulted in a 34% overprediction of the crank-pin force and a 25% underprediction of the driveshaft torque. Transient behavior was also captured with good fidelity, with predicted transient peak heights and natural frequencies correlating closely with experimental measurements, as close as 1%.
The results further suggest practical operational and design recommendations for Hicom systems. Starting the mill with charge present in the chamber is expected to dampen the startup resonance peak by increasing effective system mass and energy dissipation, thereby reducing transient dynamic loads during acceleration. In addition, the influence of rotating unbalance on the observed dynamic response indicates that incorporating an eccentric mass balance on the driveshaft may further reduce vibrational loads. Investigation of shaft balancing strategies is therefore recommended as a potential design modification to improve operational stability and reduce structural loading.
The findings and data presented can be used to inform nutating mill design and operation as well as future experimental and numerical studies of nutating mills. This could include structural fatigue analyses, replacing the dry charge with slurry, and the inclusion of particle breakage.
Author Contributions
Conceptualization, J.R.B., C.J.C. and H.C.J.v.V.; methodology, H.C.J.v.V.; software, H.C.J.v.V.; validation, H.C.J.v.V.; formal analysis, H.C.J.v.V.; investigation, H.C.J.v.V.; resources, H.C.J.v.V.; data curation, H.C.J.v.V.; writing—original draft preparation, H.C.J.v.V.; writing—review and editing, H.C.J.v.V., J.R.B. and C.J.C.; visualization, H.C.J.v.V.; supervision, J.R.B. and C.J.C.; project administration, H.C.J.v.V., J.R.B. and C.J.C. All authors have read and agreed to the published version of the manuscript.
Funding
This research received no external funding.
Data Availability Statement
Data will be made available upon reasonable request.
Acknowledgments
This article is based on research conducted as part of the author’s master’s thesis at Stellenbosch University [
8]. The thesis is not published in a peer-reviewed journal, and the present work represents a condensed and refocused version with modified scope, presentation, and analysis.
Conflicts of Interest
The authors declare no conflicts of interest. The funders had no role in the design of the study; in the collection, analyses, or interpretation of data; in the writing of the manuscript; or in the decision to publish the results.
Abbreviations
The following abbreviations are used in this manuscript:
| CAD | Computer-Aided Design |
| COG | Centre of Gravity |
| DOF | Degrees of Freedom |
| DEM | Discrete Element Method |
| FBD | Free Body Diagram |
| GCS | Global Coordinate System |
| LCS | Local Coordinate System |
| MBD | Multi-body Dynamics |
| RDOF | Rotational Degrees of Freedom |
| TDOF | Translational Degrees of Freedom |
References
- Gupta, A.; Yan, D.S. Mineral Processing Design and Operation: An Introduction, 1st ed.; Elsevier: Amsterdam, The Netherlands; Boston, MA, USA, 2006; ISBN 978-0-444-51636-7. [Google Scholar]
- Yulia; Mardiansyah, Y.; Khotimah, S.; Suprijadi; Viridi, S. Characterization of motion modes of pseudo-two dimensional granular materials in a vertical rotating drum. J. Phys. Conf. Ser. 2016, 739, 012148. [Google Scholar] [CrossRef] [Scilit]
- Boyes, J. High-intensity centrifugal milling—A practical solution. Int. J. Miner. Process. 1988, 22, 413–430. [Google Scholar] [CrossRef] [Scilit]
- Cleary, P.W.; Owen, P.J. Using DEM to understand scale-up for a HICOM® mill. Miner. Eng. 2016, 92, 86–109. [Google Scholar] [CrossRef] [Scilit]
- Van Tonder, J.J. Experimental and Numerical Investigation of a Nutating Mill System. Master’s Thesis, Stellenbosch University, Stellenbosch, South Africa, 2023. [Google Scholar]
- Van Tonder, J.J.; Bredell, J.R.; Coetzee, C.; Branehog, J. Simulation of kinetic joint forces in a nutating grinding mill. J. S. Afr. Inst. Min. Metall. 2025, 125, 99–106. [Google Scholar] [CrossRef] [Scilit]
- Janse van Vuuren, H.C.; Bredell, J.R.; Coetzee, C.J. Dynamics of a nutating mill with vibration isolation mounts. In Proceedings of the 14th South African Conference on Computational and Applied Mechanics SACAM, Johannesburg, South Africa, 21–23 January 2025; pp. 116–121. Available online: https://saam.africa/wp-content/uploads/2025/12/SACAM2025-proceedings.pdf (accessed on 4 August 2026).
- Janse van Vuuren, H.C. Dynamics of a Nutating Mill with Charge-Structure Interaction. Master’s Thesis, Stellenbosch University, Stellenbosch, South Africa, 2026. [Google Scholar]
- ASTM International. Guide for Dynamic Testing of Vulcanized Rubber and Rubber-Like Materials Using Vibratory Methods. 2011. Available online: http://www.astm.org/cgi-bin/resolver.cgi?D5992-96R11 (accessed on 4 August 2026).
- Inman, D.J. Engineering Vibration. Always Learning, 4th ed.; Pearson: Boston, MA, USA; München, Germany, 2014; ISBN 978-0-273-76844-9, 978-0-13-287169-3. [Google Scholar]
- Coetzee, C.; Katterfeld, A. Calibration of DEM Parameters. In Simulations in Bulk Solids Handling, 1st ed.; McGlinchey, D., Ed.; Wiley: Hoboken, NJ, USA, 2023; pp. 1–40. Available online: https://onlinelibrary.wiley.com/doi/10.1002/9783527835935.ch1 (accessed on 4 August 2026).
- Bian, X.; Wang, G.; Wang, H.; Wang, S.; Lv, W. Effect of lifters and mill speed on particle behaviour, torque, and power consumption of a tumbling ball mill: Experimental study and DEM simulation. Miner. Eng. 2017, 105, 22–35. [Google Scholar] [CrossRef] [Scilit]
Figure 1.
Hicom nutating mill: (
a) Hicom mill rendering, (
b) Chamber motion diagram, adapted from [
4].
Figure 1.
Hicom nutating mill: (
a) Hicom mill rendering, (
b) Chamber motion diagram, adapted from [
4].
Figure 2.
NuMill design with isolation mounts.
Figure 2.
NuMill design with isolation mounts.
Figure 3.
Forces and component: (
a) NuMill FBD [
5], (
b) Torque crank arm.
Figure 3.
Forces and component: (
a) NuMill FBD [
5], (
b) Torque crank arm.
Figure 4.
Universal cross joint [
5].
Figure 4.
Universal cross joint [
5].
Figure 5.
Chamber material and geometry: (a) Chamber charge materials, (b) Ribbed chamber geometry.
Figure 5.
Chamber material and geometry: (a) Chamber charge materials, (b) Ribbed chamber geometry.
Figure 6.
MBD simulation geometry with numbered joints.
Figure 6.
MBD simulation geometry with numbered joints.
Figure 7.
Experimental steady-state mount type comparison plots for unribbed empty chamber: (a) Crank-pin resultant force, (b) Driveshaft torque.
Figure 7.
Experimental steady-state mount type comparison plots for unribbed empty chamber: (a) Crank-pin resultant force, (b) Driveshaft torque.
Figure 8.
Experimental steady-state charge mass comparison plots for 0 vs. , unribbed chamber: (a) Crank-pin resultant force, (b) Driveshaft torque.
Figure 8.
Experimental steady-state charge mass comparison plots for 0 vs. , unribbed chamber: (a) Crank-pin resultant force, (b) Driveshaft torque.
Figure 9.
Granular steel pellet charge behavior, unribbed vs. ribbed: (a) Unribbed, (b) Ribbed.
Figure 9.
Granular steel pellet charge behavior, unribbed vs. ribbed: (a) Unribbed, (b) Ribbed.
Figure 10.
Experimental steady-state chamber geometry comparison plots, unribbed vs. ribbed, steel pellets: (a) Crank-pin resultant force, (b) Driveshaft torque.
Figure 10.
Experimental steady-state chamber geometry comparison plots, unribbed vs. ribbed, steel pellets: (a) Crank-pin resultant force, (b) Driveshaft torque.
Figure 11.
Transient comparison plots for coupled simulation vs. experiment at 700 RPM and 723 RPM, respectively, unribbed chamber, steel pellet charge, 70 RPM/s shaft acceleration: (a) Crank-pin resultant force, (b) Drive shaft torque, (c) Frame horizontal acceleration, (d) Frame vertical acceleration.
Figure 11.
Transient comparison plots for coupled simulation vs. experiment at 700 RPM and 723 RPM, respectively, unribbed chamber, steel pellet charge, 70 RPM/s shaft acceleration: (a) Crank-pin resultant force, (b) Drive shaft torque, (c) Frame horizontal acceleration, (d) Frame vertical acceleration.
Figure 12.
Simulation vs. experiment steady-state for an empty chamber with flexible mounts comparison plots: (a) Crank-pin resultant force, (b) Driveshaft torque.
Figure 12.
Simulation vs. experiment steady-state for an empty chamber with flexible mounts comparison plots: (a) Crank-pin resultant force, (b) Driveshaft torque.
Figure 13.
Simulation vs. experiment steady-state granular charge, unribbed chamber, comparison plots: (a) Crank-pin resultant force, (b) Driveshaft torque.
Figure 13.
Simulation vs. experiment steady-state granular charge, unribbed chamber, comparison plots: (a) Crank-pin resultant force, (b) Driveshaft torque.
Figure 14.
Simulation vs experiment steady-state granular charge, ribbed chamber, comparison plots: (a) Crank-pin resultant force, (b) Driveshaft torque.
Figure 14.
Simulation vs experiment steady-state granular charge, ribbed chamber, comparison plots: (a) Crank-pin resultant force, (b) Driveshaft torque.
Table 1.
Experimental variables for modified NuMill.
Table 1.
Experimental variables for modified NuMill.
| Type | Variable | Sensor | Location |
|---|
| Independent | Driveshaft rotational speed | Tachometer | Motor shaft |
| | Driveshaft rotational acceleration | Tachometer | Motor shaft |
| | Charge material type and mass | | |
| | Mount stiffness and damping | | |
| | Chamber geometry | | |
| Dependent | Kinematic joint forces (radial force) | Force transducer | Crank pin |
| | System torque | Torque transducer | Motor shaft |
| | Structural acceleration | Piezoelectric | Frame corners |
| | | accelerometers | |
| | Charge motion and COG | Video camera | Tripod |
| | Mount temperature | Infrared thermometer | Handheld |
| Controlled | Component misalignment | | |
| | Internal structural resonance | | |
| | Nutation angle [6°] | | |
| Extraneous | Ambient temperature | | |
| | Humidity | | |
Table 2.
NuMill test matrix showing configuration hierarchy.
Table 2.
NuMill test matrix showing configuration hierarchy.
| Geometry | Charge Type | Final Speeds, |
|---|
| Ω (RPM) |
|---|
| Unribbed | Empty chamber (0 kg) | 255–744 (18 steps) |
| Rigid bars (1.347 kg) | 254–742 (19 steps) |
| Steel pellets (1.347 kg) | 253–723 (19 steps) |
| Ribbed | Steel pellets (1.347 kg) | 159–688 (15 steps) |
Table 3.
Dynamic properties of flexible components as applied in simulations [
7,
8].
Table 3.
Dynamic properties of flexible components as applied in simulations [
7,
8].
| Stiffness |
| Component | Shear | Axial | Bending | Torsional |
| Units | / | / |
| Mount | 72.25 | 425 | 0 | 0 |
| Coupling | 234 | 374 | 300 | 287 |
| Damping |
| Component | Shear | Axial | Bending | Torsional |
| Units | / | / |
| Mount | 343 | 343 | 0 | 0 |
| Coupling | 0 | 0 | 0 | 0 |
Table 4.
Joint types and available degrees of freedom (DOF) for each component connection.
Table 4.
Joint types and available degrees of freedom (DOF) for each component connection.
| Components | Joint Type | DOF |
|---|
| 1. Ground–frame | Four bushings | 6 DOF |
| 2. Ground–inter. shaft | Revolute | 1 RDOF: Global Z-axis |
| 3. Inter. shaft–driveshaft | Bushing | 6 DOF |
| 4. Drive shaft–frame | Revolute | 1 RDOF: Frame Z-axis |
| 5. Load cell–pin carriage | Fixed | 0 DOF |
| 6. Crank pin–chamber | Sphere and cylinder | 3 RDOF, 1 TDOF: Crank-pin axis |
| 7. Chamber–bearing cross | Revolute | 1 RDOF: Frame X-axis |
| 8. Bearing cross–frame | Revolute | 1 RDOF: Frame Y-axis |
Table 5.
DEM model parameters.
Table 5.
DEM model parameters.
| DEM Simulation Parameter | Value of Parameter |
|---|
| Gravity in Z-direction | / |
| Normal force model | Linear spring dashpot [11] |
| Tangential force model | Linear spring coulomb limit |
| Adhesive force model | None |
| Impact energy model | Default |
| Rolling resistance model | Type C: Linear spring rolling limit |
| Numerical softening factor | 0.001 |
| Steel density b | / |
| Steel Young’s modulus b | 200 |
| Steel Poisson’s ratio a | 0.25 |
| Acrylic density a | 1200 / |
| Acrylic Young’s modulus b | |
| Acrylic Poisson’s ratio a | 0.3 |
| Friction coefficient (ball-ball) a | 0.5 |
| Friction coefficient (ball-facet) b | 0.2 |
| Tangential stiffness ratio (ball-ball) a | 1 |
| Tangential stiffness ratio (ball-facet) a | 1 |
| Restitution coefficient (ball-ball) a | 0.5 |
| Restitution coefficient (ball-facet) a | 0.4 |
| Steel ball diameter | 5 |
| Rolling friction coefficient (ball) a | 0.01 |
| Charge mass | |
| Steel ball number (prescribed by mass) | 2618 particles |
Table 6.
Experimental parameter sensitivity, with percentage change at 700 RPM in brackets.
Table 6.
Experimental parameter sensitivity, with percentage change at 700 RPM in brackets.
| Parameter | Change | Resultant
Force | Torque |
|---|
| Mount type | Rigid to flexible | Decrease (14%) | Increase (82%) |
| Charge mass | Increase mass | Increase (35%) | Decrease (1%) |
| Chamber geometry | Unribbed to ribbed | Decrease (10%) | Decrease (37%) |
| Charge type | Rigid to granular | Decrease (17%) | Increase (423%) |
Table 7.
Simulation accuracy at 700 RPM for each condition.
Table 7.
Simulation accuracy at 700 RPM for each condition.
| Configuration | Resultant Force (N) | Torque (Nm) |
|---|
| Exp | Sim | Error | Exp | Sim | Error |
|---|
| Flexible mount, empty chamber | 603 | 768 | 27% | 1.2 | 4.1 | >100% |
| Rigid mass | 817 | 1031 | 26% | 1.2 | 4.2 | >100% |
| Granular charge | 935 | 980 | 5% | 10.2 | 9.1 | −11% |
| Ribbed chamber granular charge | 728 | 974 | 34% | 5.6 | 4.2 | −25% |
| Disclaimer/Publisher’s Note: The statements, opinions and data contained in all publications are solely those of the individual author(s) and contributor(s) and not of MDPI and/or the editor(s). MDPI and/or the editor(s) disclaim responsibility for any injury to people or property resulting from any ideas, methods, instructions or products referred to in the content. |