Correction

Correction: Umegaki et al. Mathematical Structure of RelB Dynamics in the NF-κB Non-Canonical Pathway. Math. Comput. Appl. 2024, 29, 62


1
Center for Mathematical Modeling and Data Science, Osaka University, Osaka 565-0871, Japan
2
Consulting Division, Consulting and IT Business Department, Vision Consulting, Inc., Tokyo 106-6139, Japan
*
Author to whom correspondence should be addressed.
Math. Comput. Appl. 2026, 31(4), 153; https://doi.org/10.3390/mca31040153
Submission received: 20 July 2026 / Accepted: 23 July 2026 / Published: 3 August 2026
In the original publication [1], there were errors in Appendix B.2, related to the calculation and interpretation of the eigenvalues used in the bifurcation analysis. These errors affected the numerical values and explanatory text associated with Figures A3–A5 and Table A1. The authors wish to make the following corrections.
In Appendix B.2, the interpretation of the eigenvalues of the Jacobian matrix has been revised. The imaginary part of the eigenvalue is now interpreted as a local oscillatory time scale around the equilibrium point, rather than as the exact period of the nonlinear time evolution. Accordingly, the previous explanation attributing the differences between the periods estimated from nonlinear time evolution and those converted from the eigenvalues to errors in eigenvalue calculations has been replaced by a description based on the difference between nonlinear limit-cycle dynamics and local linearization around the equilibrium point.
Figure A3 has been replaced with recalculated bifurcation diagrams for t o t a l R e l B and t o t a l I κ B α in p100KO-M. In the revised analysis, the curves represent max [ ( λ ) ] , the maximum real part of the eigenvalues, and ( λ ) , the imaginary part of the eigenvalue corresponding to max [ ( λ ) ] . The recalculated results indicate local stability transitions near t o t a l R e l B 1.27 µM for t o t a l I κ B α = 2.5 µM and near t o t a l I κ B α 14.73 µM for t o t a l R e l B = 0.4 µM. The corrected Figure A3 is provided below.
Table A1 has been replaced with a recalculated table including max [ ( λ ) ] , ( λ ) , and the equivalent periods calculated from ( λ ) . The revised Table A1 is as follows:
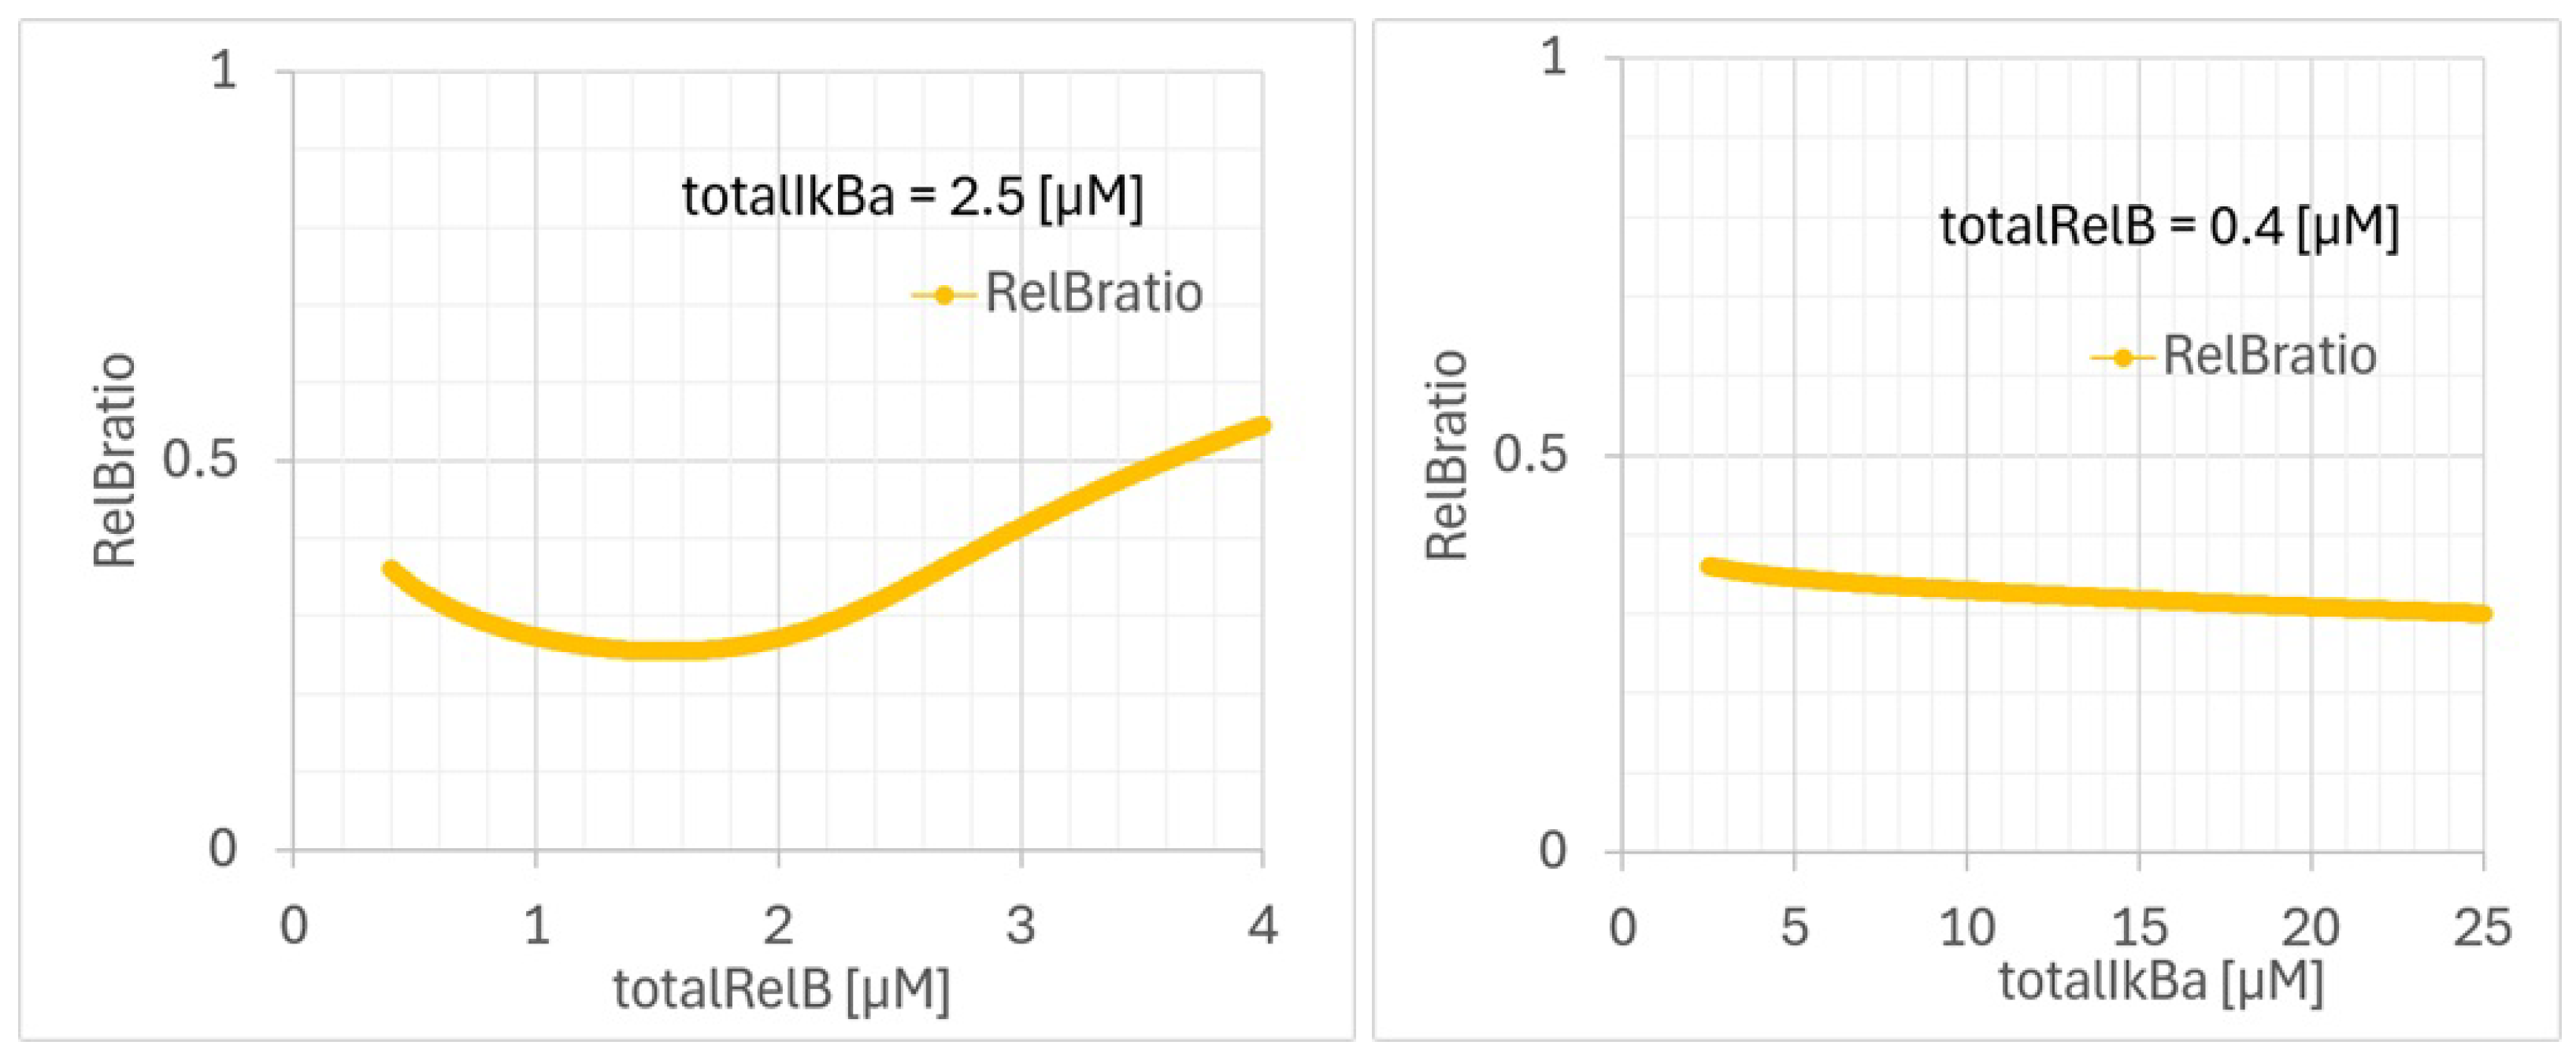
Figure A4 has been replaced with recalculated R e l B r a t i o dependencies on t o t a l R e l B and t o t a l I κ B α . The corresponding explanatory text has also been revised. The recalculated values of R e l B r a t i o are 0.546, 0.271, 0.291, 0.361, 0.345, 0.324, and 0.301 for ( t o t a l R e l B , t o t a l I κ B α ) = (4, 2.5), (2, 2.5), (0.8, 2.5), (0.4, 2.5), (0.4, 5.0), (0.4, 12.5), and (0.4, 25.0) µM, respectively. The corrected Figure A4 is provided below.
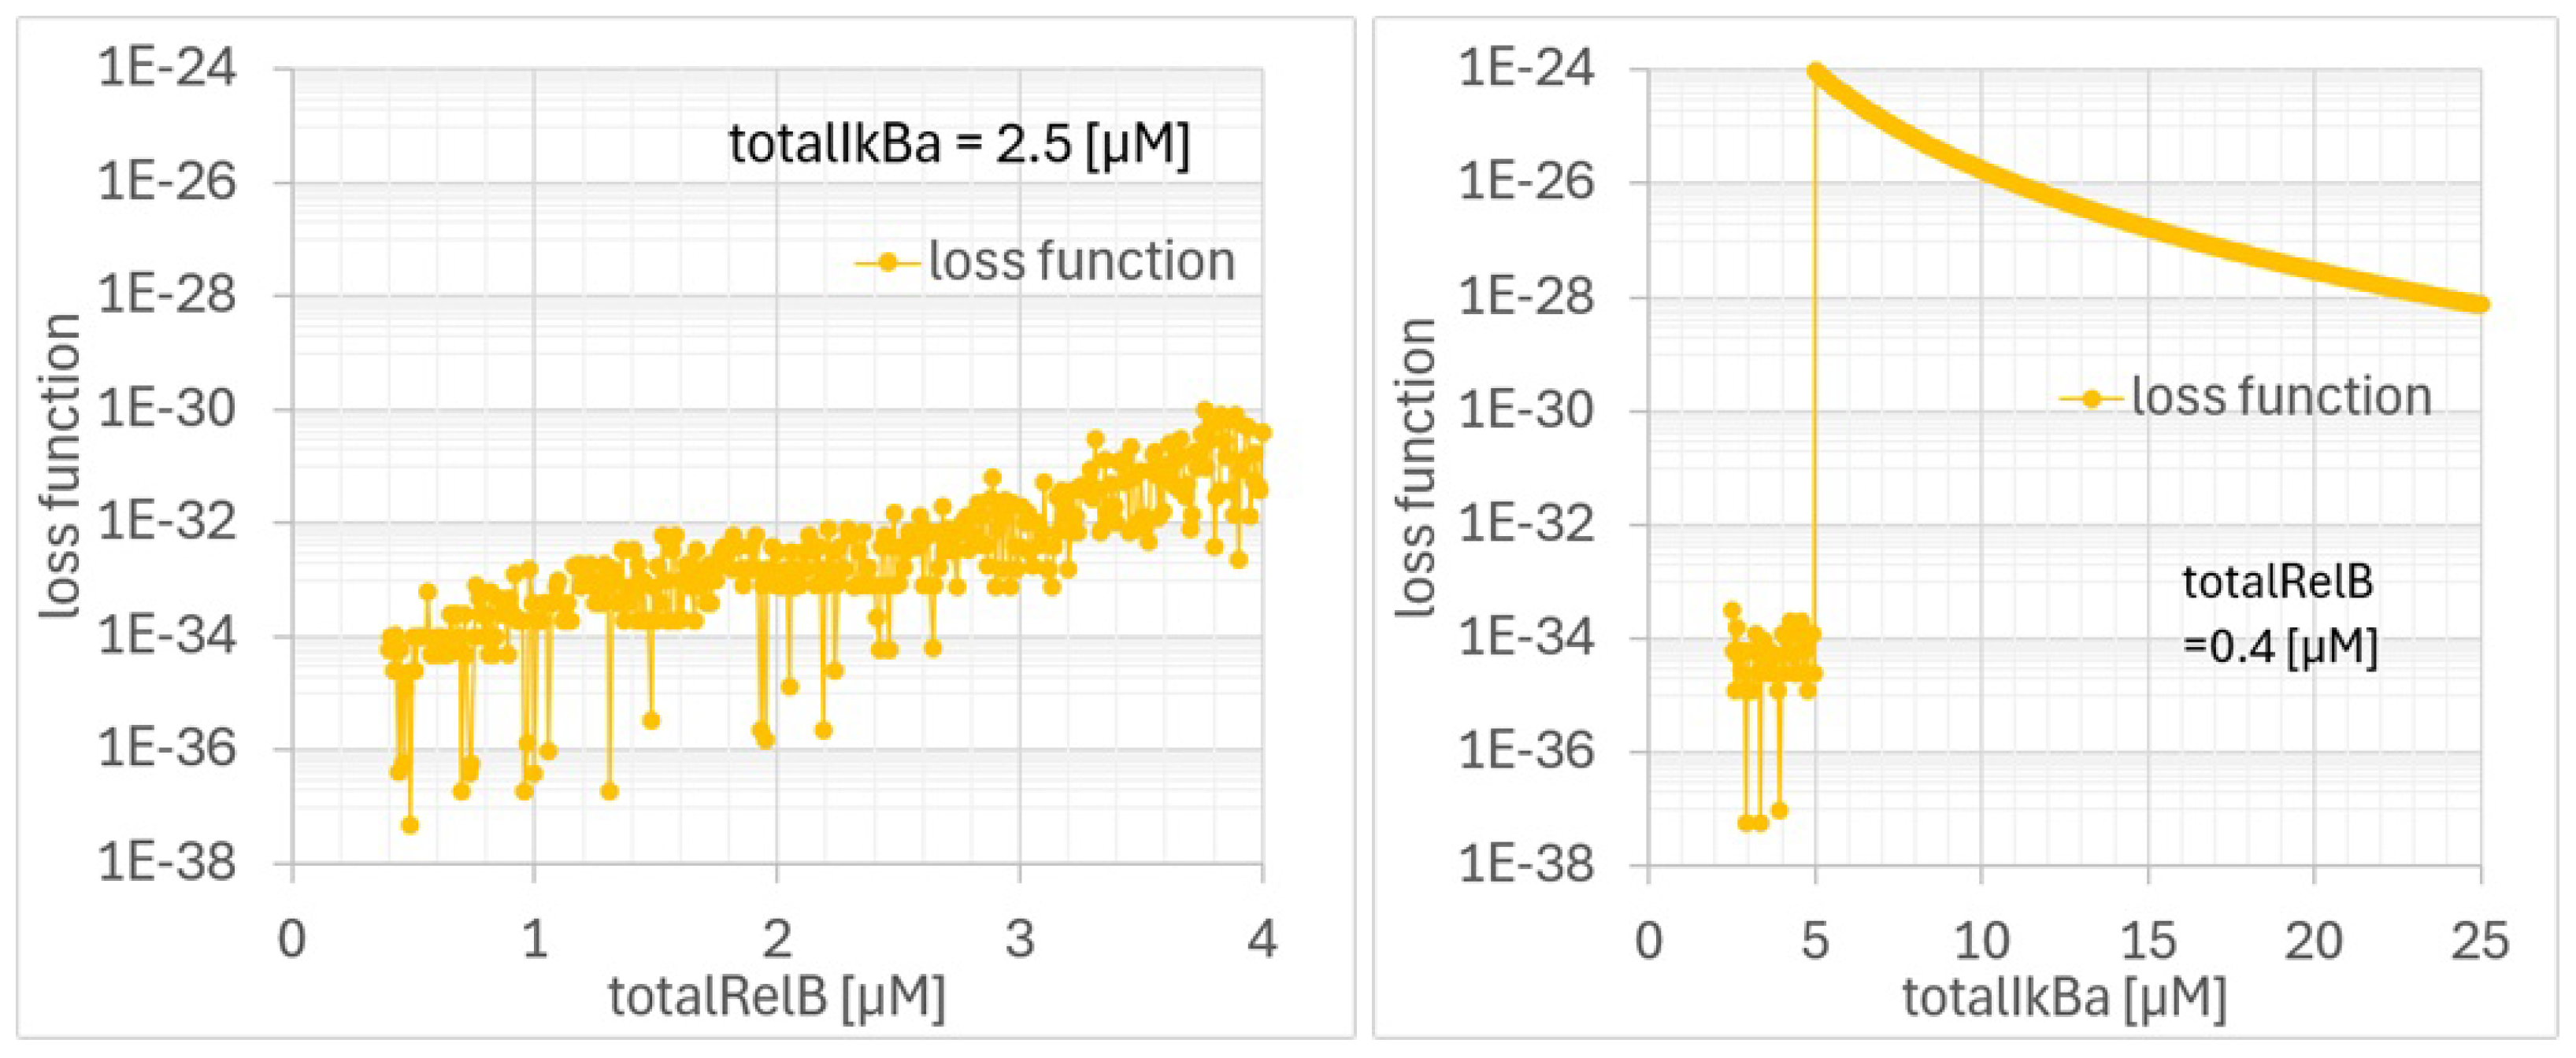
Figure A5 has been replaced with recalculated residual loss function plots. The revised explanation clarifies that the residual loss values remained sufficiently small throughout the parameter ranges, confirming the numerical convergence of the equilibrium-point calculations. Therefore, the transitions detected in the bifurcation diagrams are attributed to sign changes in max [ ( λ ) ] rather than to a loss of convergence of the steady-state solver. The corrected Figure A5 is provided below.
These corrections are limited to Figures A3–A5, Table A1, and the corresponding explanatory text in Appendix B.2. They do not affect the main results, discussion, or conclusions of the article.
This correction was approved by the Academic Editor. The original publication has also been updated.

Reference

  1. Umegaki, T.; Hatanaka, N.; Suzuki, T. Mathematical Structure of RelB Dynamics in the NF-κB Non-Canonical Pathway. Math. Comput. Appl. 2024, 29, 62. [Google Scholar] [CrossRef] [Scilit]
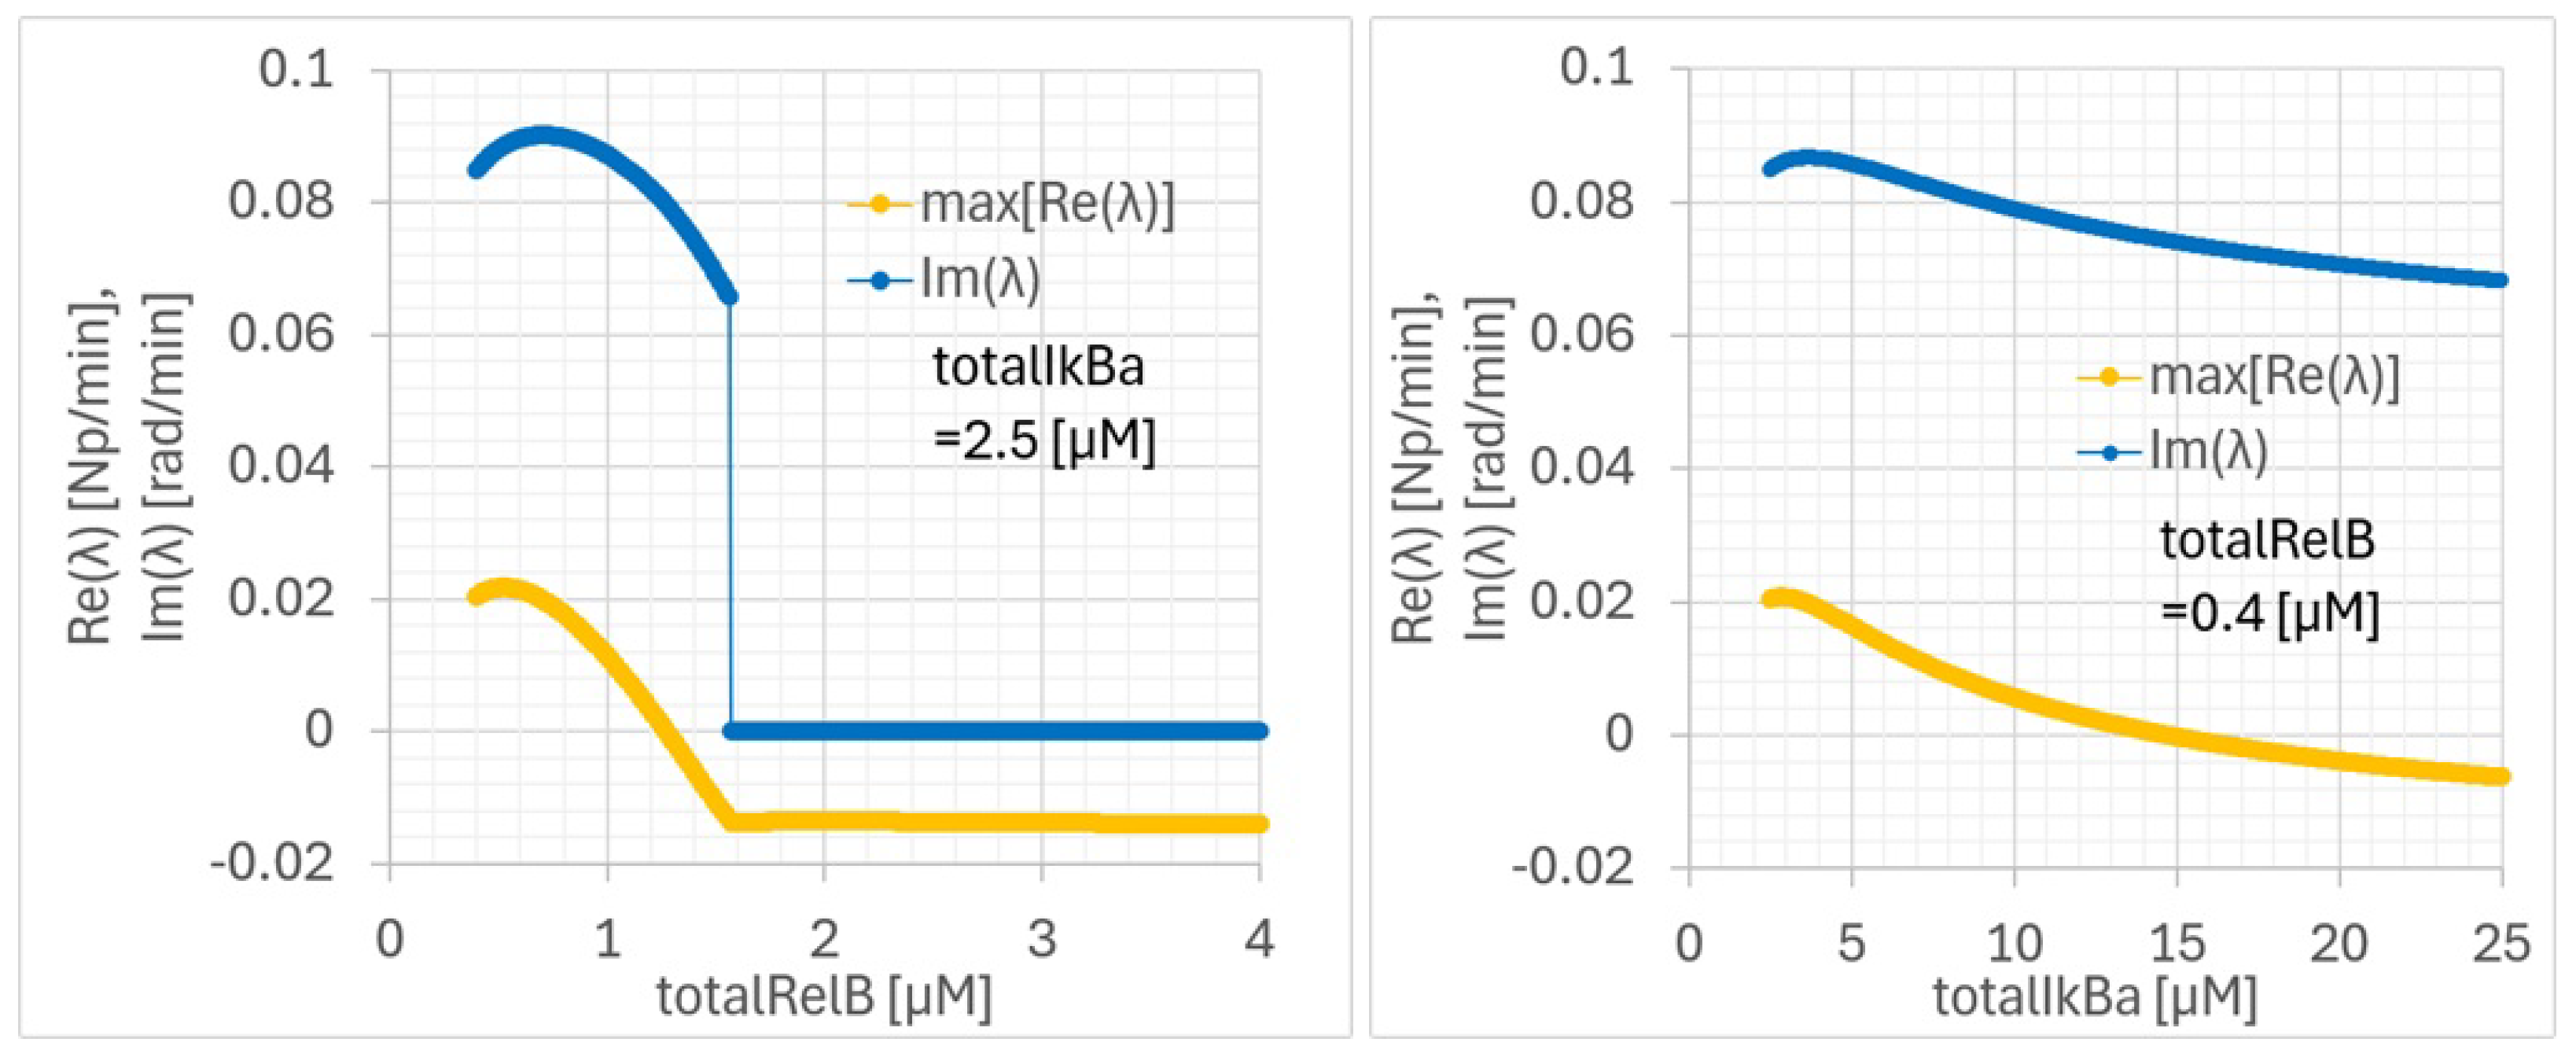
Figure A3. Bifurcation diagrams for t o t a l R e l B (left) and t o t a l I κ B α (right) in p100KO-M for the calibrated parameters. Dependencies on t o t a l R e l B (left) and t o t a l I κ B α (right) were calculated with t o t a l I κ B α = 2.5 µM and t o t a l R e l B = 0.4 µM fixed, respectively.
Mca 31 00153 g0a3
Figure A4. R e l B r a t i o –(left) t o t a l R e l B and (right) t o t a l I κ B α dependencies of p100KO-M for the calibrated parameters. The dependencies on t o t a l R e l B and t o t a l I κ B α were calculated with t o t a l I κ B α = 2.5 µM and t o t a l R e l B = 0.4 µM fixed, respectively.
Mca 31 00153 g0a4
Figure A5. Residual loss function L = f ( X * ) 2 for (left) t o t a l R e l B and (right) t o t a l I κ B α dependencies of p100KO-M for the calibrated parameters. The dependencies on t o t a l R e l B and t o t a l I κ B α were calculated with t o t a l I κ B α = 2.5 µM and t o t a l R e l B = 0.4 µM fixed, respectively.
Mca 31 00153 g0a5
Table A1. Eigenvalues and equivalent period 2 π / ( λ ) for each ( t o t a l R e l B , t o t a l I κ B α ).
totalRelB [µM]totalIκBα [µM] max [ ( λ ) ] [Np/min] ( λ ) [rad/min]Equivalent Period: 2 π / ( λ ) [h]
0.82.50.017690.089851.166
0.42.50.020440.084871.234
0.45.00.016410.085681.222
0.412.50.002310.076161.375
0.425.0 0.00627 0.068131.537
Disclaimer/Publisher’s Note: The statements, opinions and data contained in all publications are solely those of the individual author(s) and contributor(s) and not of MDPI and/or the editor(s). MDPI and/or the editor(s) disclaim responsibility for any injury to people or property resulting from any ideas, methods, instructions or products referred to in the content.