Article

Dynamical Analysis and Solitary Wave Solutions of the Zhanbota-IIA Equation with Computational Approach

1
Department of Mathematics, Quaid-I-Azam University, Islamabad 45320, Pakistan
2
Institute of Research and Development of Processes, Department of Electricity and Electronics, Faculty of Science and Technology, University of the Basque Country, 48940 Leioa, Bizkaia, Spain
*
Author to whom correspondence should be addressed.
Math. Comput. Appl. 2025, 30(5), 100; https://doi.org/10.3390/mca30050100
Submission received: 8 August 2025 / Revised: 9 September 2025 / Accepted: 11 September 2025 / Published: 15 September 2025
(This article belongs to the Section Natural Sciences)

Abstract

This study conducts an in-depth analysis of the dynamical characteristics and solitary wave solutions of the integrable Zhanbota-IIA equation through the lens of planar dynamic system theory. This research applies Lie symmetry to convert nonlinear partial differential equations into ordinary differential equations, enabling the investigation of bifurcation, phase portraits, and dynamic behaviors within the framework of chaos theory. A variety of analytical instruments, such as chaotic attractors, return maps, recurrence plots, Lyapunov exponents, Poincaré maps, three-dimensional phase portraits, time analysis, and two-dimensional phase portraits, are utilized to scrutinize both perturbed and unperturbed systems. Furthermore, the study examines the power frequency response and the system’s sensitivity to temporal delays. A novel classification framework, predicated on Lyapunov exponents, systematically categorizes the system’s behavior across a spectrum of parameters and initial conditions, thereby elucidating aspects of multistability and sensitivity. The perturbed system exhibits chaotic and quasi-periodic dynamics. The research employs the maximum Lyapunov exponent portrait as a tool for assessing system stability and derives solitary wave solutions accompanied by illustrative visualization diagrams. The methodology presented herein possesses significant implications for applications in optical fibers and various other engineering disciplines.

1. Introduction

Differential equations are vital for understanding physical phenomena, with nonlinear forms (NLDEs) modeling complex systems in fields like solid-state physics, plasma dynamics, and acoustics [1,2,3]. They provide deeper insights and improve prediction accuracy. Integrable systems and differential equations hold significant importance in contemporary physics and mathematics. This study focuses on a specific example of such integrable spin systems, namely the Zhanbota-IA equation, expressed in the following form [4]:
M τ M M α τ M M α 1 κ 0 M N = 0 , M α + M × ( M α M τ ) = 0 , N α κ 0 M N = 0 .
Let M = ( M 1 , M 2 , M 3 ) denote the unit spin vector, N = ( N 1 , N 2 , N 3 ) the vector potential, and κ 0 a constant. The temporal variable is represented by τ , and the spatial variable is represented by α . They are both independent variables. τ and α typically indicate partial derivatives with regard to the respective variables when they occur as subscripts. The Zhanbota-IA equation, an integrable generalization of the Zhaidary equation, plays a key role in nonlinear magnetization dynamics. Its gauge-equivalent counterpart is the Zhanbota-IIA equation [5]:
A τ + η 2 γ A α τ + γ P A 2 Q = 0 , B τ η 2 γ Ω α τ γ P Ω 2 R = 0 , P α + η 2 ( Ω A ) τ = 0 , Q α 2 γ κ 0 Q 2 μ A = 0 , R α + 2 γ κ 0 R 2 μ Ω = 0 , σ + Ω Q + R A = 0 .
Here, A , R , Q , and Ω denote complex functions, while σ and P are real-valued potential functions, and η is a constant. By applying the reduction B = Δ 1 A ¯ and R = Δ 2 Q ¯ with μ = 2 , where the overline denotes the complex conjugate, we obtain a more concise form of Equation (2):
γ A τ + A α τ A P 2 γ Q = 0 , P α + 2 Δ 1 ( | A | 2 ) τ = 0 , Q α 2 γ κ 0 Q 2 σ A = 0 , σ α + ( Δ 1 A ¯ Q + Δ 2 Q ¯ A ) = 0 .
Here, Δ j = ± 1 . Various integrable features of Equation (3), including multi-solitons, Darboux transformations, single and double breathers, the Lax pair, as well as first and higher-order rogue wave solutions, have been explored in [6]. Furthermore, by imposing the reduction η = 2 γ on Equation (2), we derive the modified Zhanbota-IIA equation as follows [5]:
A τ + A α τ + K A 2 Q = 0 , Ω τ Ω α τ K Ω 2 R = 0 , K α 2 ( Ω A ) τ = 0 , Q α 2 γ κ 0 Q 2 σ A = 0 , R α + 2 γ κ 0 R 2 σ Ω = 0 , σ α + ( Ω Q + R A ) = 0 .
The Zhanbota equations represent integrable spin systems within the contexts of (1 + 0) and (1 + 1) dimensions, encompassing the Zhanbota-I through Zhanbota-V equations [7]. These mathematical expressions elucidate the nonlinear dynamics governing ferromagnets and possess gauge-equivalent counterparts. They exhibit Lax representations, an infinite array of conservation laws, and Hamiltonian structures. Significantly, six of these equations, from Zhanbota-III to Zhanbota-VIII, are associated with the renowned Painlevé equations, wherein Zhanbota transcendents manifest as solutions within the complex plane [8]. The Zhanbota-IIA equation is crucial for the representation of nonlinear spin wave dynamics in ferromagnetic systems, wherein soliton-like localized waveforms arise as a consequence of nonlinear spin interactions and dispersion phenomena [9]. Its integrability guarantees the stability of these solutions, which has profound implications for the fields of spintronics and magnetic memory. This study delves into the Zhanbota-IIA equation, which finds extensive application across domains such as mathematical physics, field theory, condensed matter physics, and nonlinear optics [10]. Butt et al. [5] solved Equation (4) using Nucci’s reduction technique and the improved Cham technique. However, in the present study, bifurcation, chaos, sensitivity, and solutions for Equation (4) are explored, which have not been addressed in the literature [5].
Solitary waves are closely tied to nonlinear integrable equations, maintaining their shape while traveling or interacting. These equations, central to physics and mathematics, have diverse applications in plasma physics, hydrodynamics, nonlinear optics, and Bose–Einstein condensates. Identifying integrable NLDEs and their exact soliton solutions is a key challenge, addressed using techniques like Bäcklund transformations [11], the multivariate generalized exponential rational integral function method [12], the Generalized Arnous method [13], Painlevé analysis [14], and inverse scattering [15]. Gaining deeper insights into soliton waves can enhance our understanding of the systems they model and unlock new possibilities for applications. Recent research in this field includes the following: Fractional solitary waves occurring in the heavy tails of fractional Twin-Core couplers with Kerr law non-linearity were visualized by Li et al. [16]. Qualitative analysis and soliton solutions of the nonlinear extended quantum Zakharov–Kuznetsov equation were studied by Hussain et al. [17]. Soliton wave profiles and dynamical analysis of the fractional Ivancevic option pricing model were explored by Jhangeer et al. [18]. Additionally, a comprehensive classification of multistability and Lyapunov exponents, along with multiple dynamics of the nonlinear Schrödinger equation, was conducted by Ali et al. [19].
The paper is organized as follows: Section 1 and Section 2 present the governing model and its reduction to a second-order differential equation. In Section 3, we analyze the dynamic properties of the unperturbed system using bifurcation analysis. In Section 4, we analyze the Hamilton function analysis. Section 5 focuses on the dynamic properties of the perturbed system, applying chaos analysis to detect chaotic behavior. In Section 6, we explore the dynamic properties of the unperturbed system through sensitivity analysis. Section 7 presents the construction of solitary wave solutions, and Section 8 displays the graphical representation of the obtained solutions. A brief conclusion is provided in Section 9.

2. Model Reduction Process

To obtain the solitary wave solution for Equation (4), we utilize the following wave transformation:
A ( α , τ ) = Θ 1 ( Ξ ) e γ χ ( α , τ ) , Q ( α , τ ) = Θ 2 ( Ξ ) e γ χ ( α , τ ) , P ( α , τ ) = Θ 2 ( Ξ ) , σ ( α , τ ) = Γ ( Ξ ) , Ξ = m 0 ( α + ϱ τ ) , χ ( α , τ ) = r 1 α + r 2 τ ,
where r 2 and ϱ represent the wave velocity, r 1 denotes the wave number, and the remaining variables are real parameters. By substituting Equation (5) into Equation (4) and separating the real and imaginary components, we obtain [5]
r 2 Θ 1 ( Ξ ) 2 K r 2 Θ 1 ( Ξ ) Θ 1 ( Ξ ) Θ 2 ( Ξ ) + m 0 2 ϱ Θ 1 ( Ξ ) = 0 ,
2 σ ( Ξ ) + m 0 ( r 2 + P ( 1 + 2 ρ ) ) Θ 1 ( Ξ ) = 0 ,
4 ϱ Δ 1 Θ 1 ( Ξ ) Θ 1 ( Ξ ) + Θ 2 ( Ξ ) = 0 ,
2 Θ 1 ( Ξ ) Γ ( Ξ ) + m 0 σ ( Ξ ) = 0 ,
and
( Δ 1 + Δ 2 ) σ ( Ξ ) Θ 1 ( Ξ ) + m 0 Γ ( Ξ ) = 0 .
Given the parametric condition r 1 = 2 K , Equation (7) yields
σ ( Ξ ) = m 0 2 ( r 2 + ϱ ( 1 + 2 K ) ) Θ 1 ( Ξ ) ·
By substituting Equation (11) into Equation (10) and integrating once with respect to Ξ , we arrive at
Γ ( Ξ ) = 4 ρ 1 + m 0 ( r 2 + ϱ ( 1 + 2 K ) ) ( Δ 1 + Δ 2 ) Θ 1 2 ( Ξ ) 4 m 0 ,
where ρ 1 is a constant of integration, with the condition that ρ 1 0 . Substituting Equations (11) and (12) into Equation (9), we obtain
4 ρ 1 Θ 1 ( Ξ ) + m 0 ( r 2 + ϱ ( 1 + 2 K ) ) ( Δ 1 + Δ 2 ) Θ 1 3 ( Ξ ) + m 0 3 ( r 2 + ϱ ( 1 + 2 K ) ) Θ 1 ( Ξ ) = 0 ·
Next, by integrating Equation (8) with respect to Ξ , we obtain
Θ 2 ( Ξ ) = ( ρ 2 + 2 ϱ Δ 1 Θ 1 2 ( Ξ ) ) .
Here, ρ 2 is a constant of integration. Substituting Equation (14) into Equation (6), we obtain
m 0 2 ϱ Θ 1 ( Ξ ) + 2 ϱ Δ 1 Θ 1 3 ( Ξ ) + ( ρ 2 ( 1 + 2 K ) r 2 ) Θ 1 ( Ξ ) = 0 .
Given the constraint conditions, Equations (13) and (15) take on the same form:
4 ρ 1 ρ 2 ( 1 + 2 K ) r 2 = m 0 ( r 2 + ϱ ( 1 + 2 K ) ) ( Δ 1 + Δ 2 ) 2 ϱ Δ 1 = m 0 ( r 2 + ϱ ( 1 + 2 K ) ) ϱ .
Equation (16) gives the result
ρ 1 = m 0 ( r 2 + ϱ ( 1 + 2 K ) ) ) ( r 2 ( 1 + 2 K ) ρ 2 ) 4 ϱ ·
Assuming Δ 1 = Δ 2 = Δ , Equation (13) can be expressed as
( ρ 2 ( 1 + 2 K ) r 2 ) Θ 1 ( Ξ ) + 2 ϱ Δ Θ 1 3 ( Ξ ) + m 0 2 ϱ Θ 1 ( Ξ ) = 0 ·
Reformulating Equation (18) into a two-dimensional dynamical system [20],
d Θ 1 d Ξ = J , d J d Ξ = G 2 Θ 1 3 G 1 Θ 1 ,
where G 1 = ρ 2 ( 1 + 2 K ) r 2 m 0 2 ϱ , and G 2 = 2 Δ m 0 2 .

3. Bifurcation Analysis of Equation (19)

In this section, we delve into the analysis of the bifurcation and phase portrait of the hamiltonian system (19).

Equilibrium Points

First, we identify the equilibrium points of the dynamical system (19) to examine its phase portraits. Using the principles of dynamical systems theory, the equilibrium points of System (19) are determined by setting Θ 1 = 0 and J = 0 . This yields three equilibrium points [21]:
F 1 = ( 0 , 0 ) , F 2 = G 1 G 2 , 0 , F 3 = G 1 G 2 , 0 , G 2 0 .
Notably, all equilibrium points lie along the Θ 1 -axis. Consider the coefficient matrix V 1 ( E i , 0 ) of the linearized system (19) at the equilibrium point ( F i , 0 ) , where V 1 and V 2 denote its determinant and trace, respectively.
V 1 = 3 G 2 Θ 1 2 G 1 , & V 2 = 0 ·
Proposition 1.
Based on the principles of planar dynamical systems [22], the critical points ( Θ i , J i ) are characterized as follows:
  • 1 . If V 1 ( Θ i , J i ) < 0 , the critical point ( Θ i , J i ) is a saddle point.
  • 2 . If V 1 ( Θ i , J i ) > 0 and V 2 2 ( Θ i , J i ) 4 V 1 ( Θ i , J i ) 0 , then ( Θ i , J i ) is a node. It is stable if V 2 ( Θ i , J i ) < 0 and unstable if V 2 ( Θ i , J i ) > 0 .
  • 3 . If V 1 ( Θ i , J i ) > 0 and V 2 ( Θ i , J i ) = 0 , the critical point ( Θ i , J i ) is a center.
  • 4 . If V 1 ( Θ i , J i ) > 0 , V 2 2 ( Θ i , J i ) 4 V 1 ( Θ i , J i ) < 0 , and V 2 ( Θ i , J i ) 0 , then ( F i , 0 ) is a focus. It is stable if V 2 ( F i , 0 ) < 0 and unstable if V 2 ( Θ i , J i ) > 0 .
  • 5 . If V 1 ( Θ i , J i ) = 0 and the Poincaré index of ( Θ i , J i ) is zero, the critical point is referred to as a zero point.
  • Family 1: When G 1 > 0 and G 2 > 0 , the dynamical system has three equilibrium points: F 1 is the origin, F 2 = ( 1.1725 , 0 ) , and F 3 = ( 1.1725 , 0 ) . The values of V 1 at these points are V 1 ( F 1 ) < 0 , V 1 ( F 2 ) > 0 , and V 1 ( F 3 ) > 0 . Hence, by Proposition (i), F 1 is a saddle point and by Proposition 1, F 2 and F 3 are center points as shown in Figure 1a.
  • Family 2:  When G 1 < 0 and G 2 < 0 , the dynamical system has three equilibrium points: F 1 is the origin, F 2 = ( 0.7905 , 0 ) , and F 3 = ( 0.7905 , 0 ) . The values of V 1 at these points are V 1 ( F 1 ) > 0 , V 1 ( F 2 ) < 0 , and V 1 ( F 3 ) < 0 . Hence, by Proposition 1, F 1 is a center point and by Proposition 1, F 2 and F 3 are saddle points as shown in Figure 1b.
  • Family 3:  When G 1 > 0 and G 2 < 0 , the dynamical system has three equilibrium points: F 1 is the origin, and the other points are complex. The value of V 1 at F 1 is V 1 ( F 1 ) < 0 . Hence, by Proposition 1, F 1 is a saddle point as shown in Figure 1c.
  • Family 4:  When G 1 < 0 and G 2 > 0 , the dynamical system has three equilibrium points: F 1 is the origin, and the other points are complex. The value of V 1 at F 1 is V 1 ( F 1 ) > 0 . Hence, by Proposition 1, F 1 is a center point as shown in Figure 1d. Figure 1 displays all possible phase portraits for various values of the parameters W 1 and W 2 .
D 1 ( Θ 1 , J ) = J 2 2 + G 1 Θ 1 2 2 G 2 Θ 1 4 4 ·
We will now compute the energy parameter E at these equilibrium points:
E 1 = D 1 ( F 1 ) = 0 , E 2 = D 1 ( F 2 ) = D 1 ( F 3 ) = G 1 2 4 G 2 ·
We define the energy level curve as follows:
{ G E = ( J , Θ 1 ) R ¯ 2 : D 1 ( J , Θ 1 ) = E } ,
where each trajectory in the phase portrait corresponds to an energy-level curve associated with specific values of E .
Remark 1.
Homoscedastic orbitals relate to separate wave solutions, heteroscedastic orbitals to twisting or anti-twisting wave solutions, and periodic orbitals to repeating waves.

4. Hamiltonian Analysis

The Hamiltonian function corresponding to the dynamical system (19) is given by [23]
D 1 ( Θ 1 , J ) = J 2 2 + G 1 Θ 1 2 2 G 2 Θ 1 4 4 ·
The Hamiltonian function D 1 represents the motion of a particle in one dimension, influenced by a one-parameter potential, expressed in the following form:
D 2 ( Θ 1 , J ) = G 1 Θ 1 2 2 G 2 Θ 1 4 4 ·
As the total energy of the system remains conserved, the Hamiltonian function D 1 serves as a conserved quantity, leading to
J 2 2 + G 1 Θ 1 2 2 G 2 Θ 1 4 4 = E ·
From Equation (26), it can be determined that
d Θ 1 d Ξ = D 1 J , d J d Ξ = D 1 Θ 1 .
Notably, the phase trajectories defined by the vector fields of Equation (19) encompass all possible traveling wave solutions of Equation (4). By substituting J from Equation (26) into the first equation of Equation (19), separating the variables, and integrating both sides, one obtains
d Θ 1 H ( Θ 1 ) = 2 d Ξ ,
with
H ( Θ 1 ) = E + G 1 Θ 1 2 2 G 2 Θ 1 4 4 ·
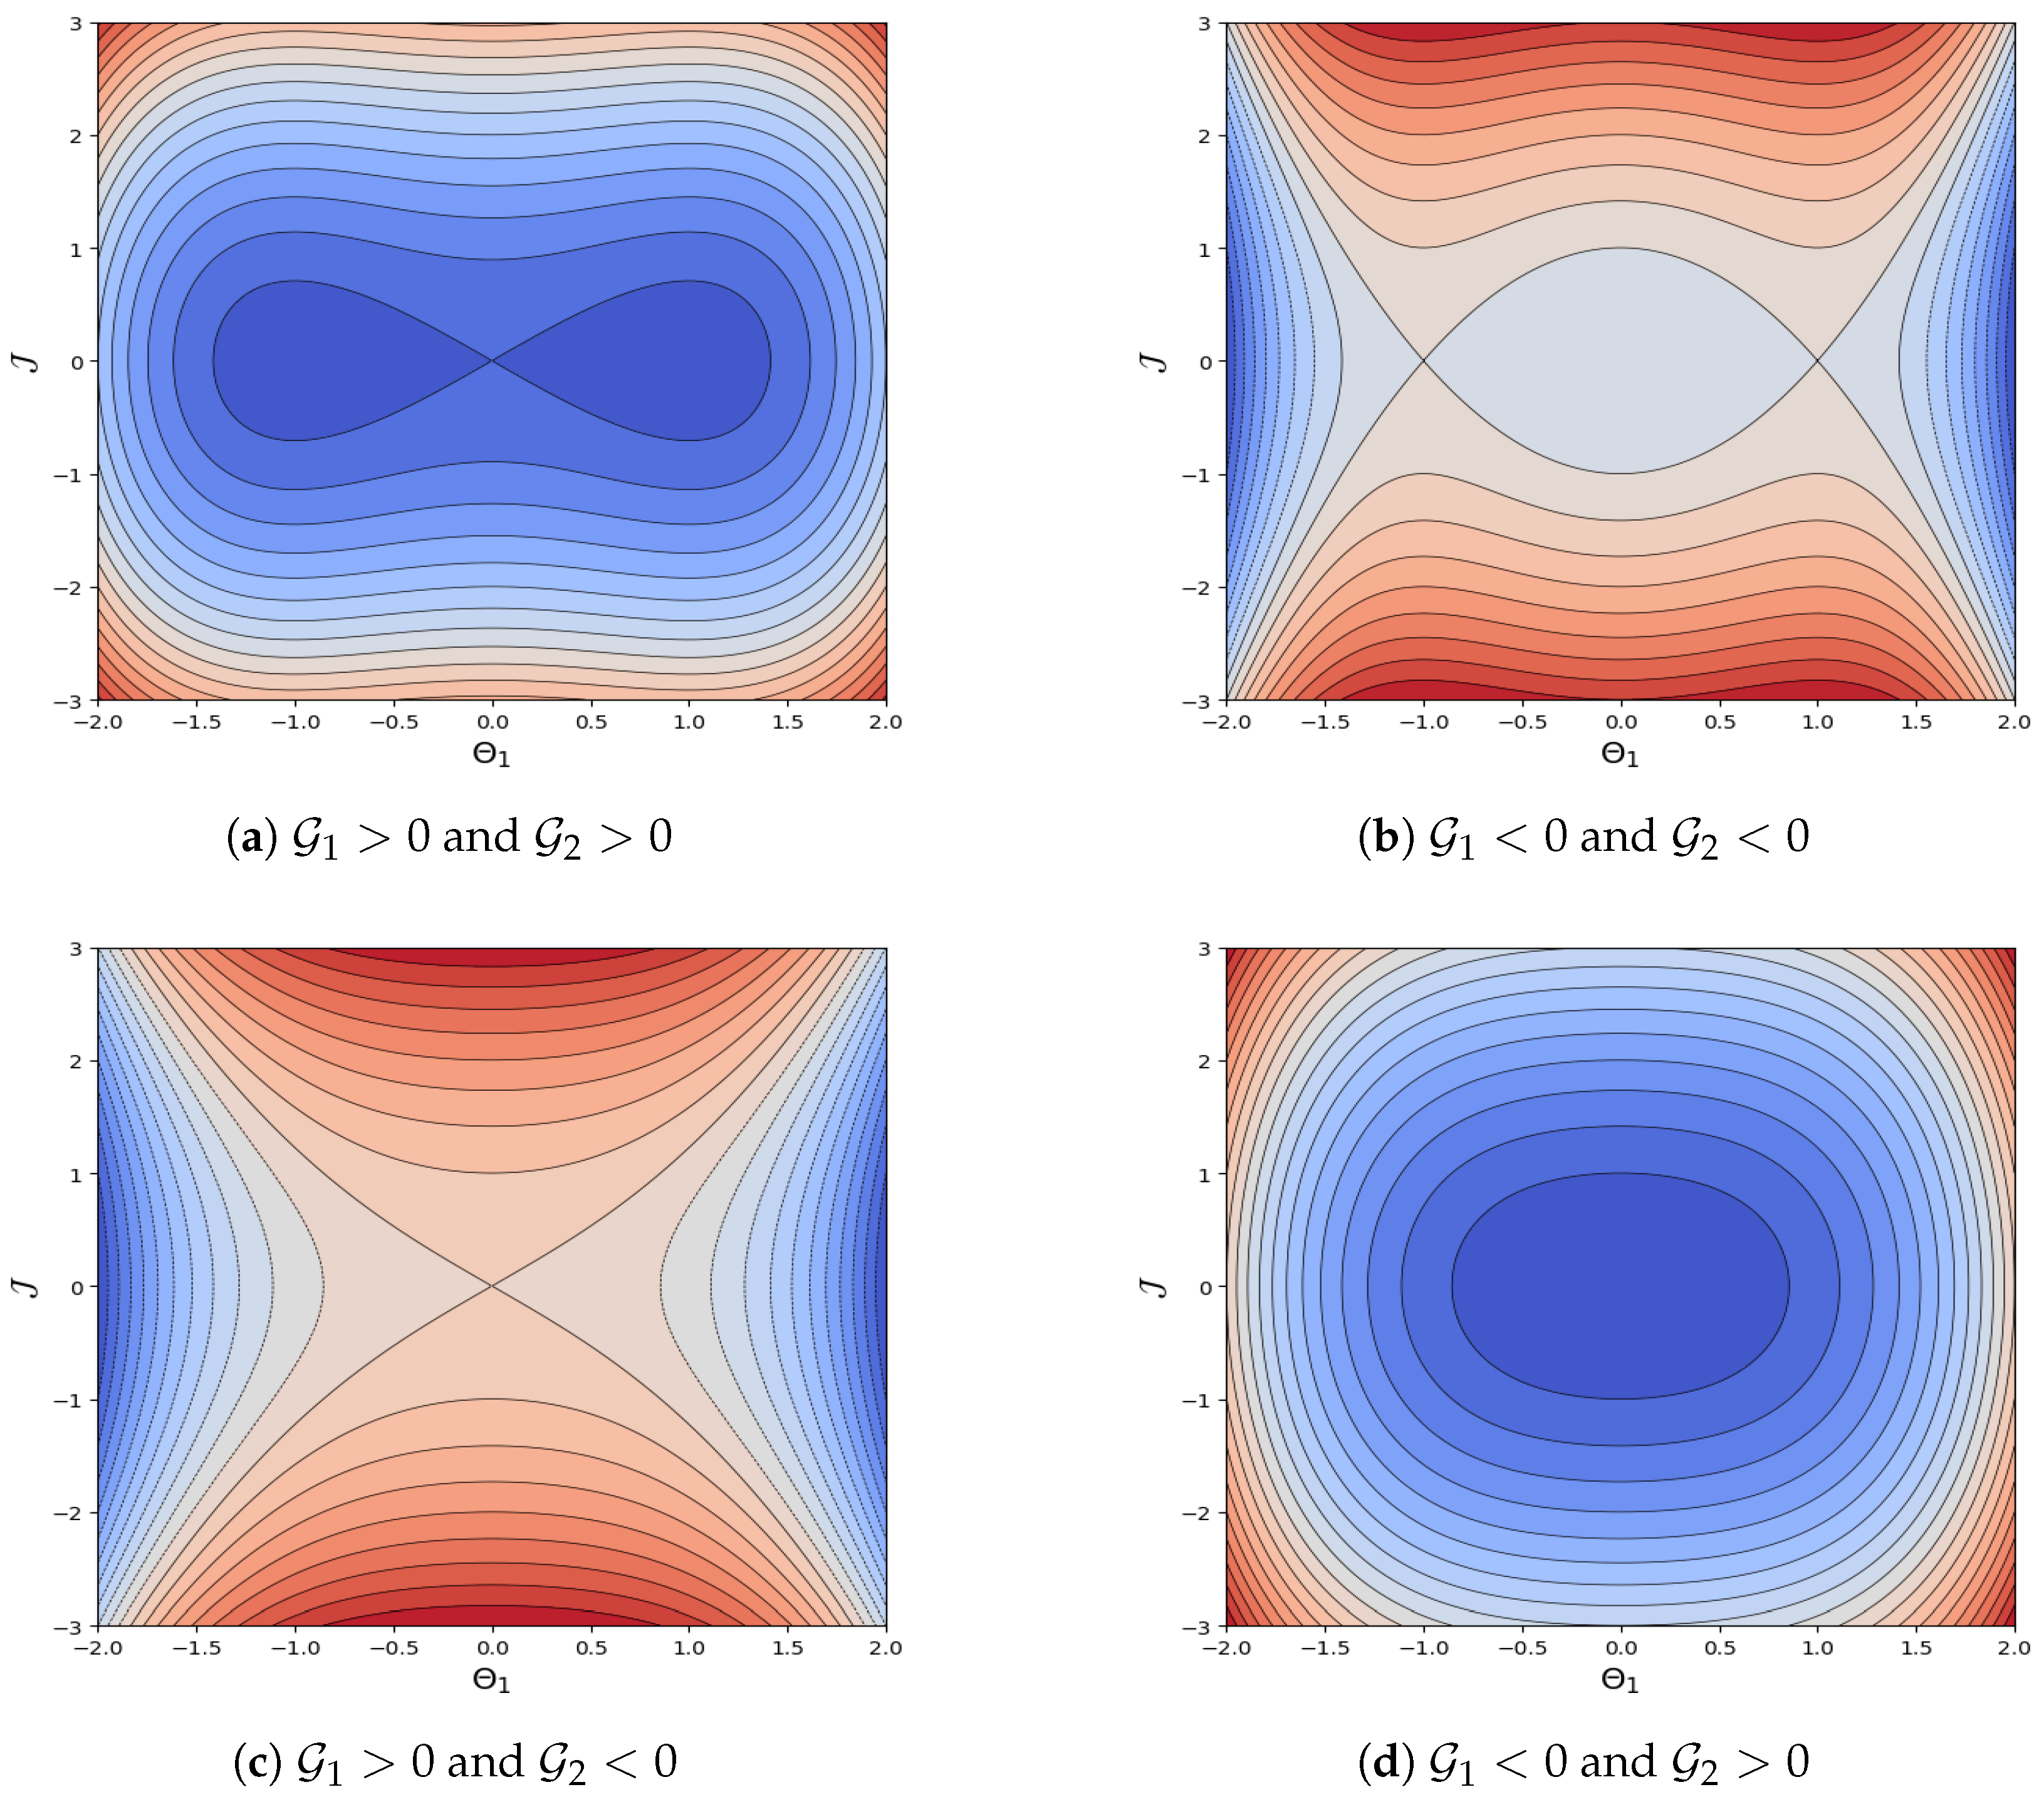
Hence, evaluating the integral in Equation (29) yields the traveling wave solutions of Equation (4). Identifying the presence of homoclinic orbits, periodic orbits, and smooth heteroclinic orbits within the PDE framework also implies the existence of periodic waves, solitary waves, smooth kink-shaped solutions, and oscillatory traveling wave solutions as shown in Figure 2.

5. Characterizing Chaotic Behavior in Equation (4)

In the previous sections, we analyzed the unperturbed form of the integrable Kuralay equations. Our findings, both qualitative and quantitative, suggest that chaotic phenomena are absent within the traveling wave structure. In this section, we introduce an additional perturbed term ϵ 0 c o s ( ζ Ξ ) , where ϵ 0 and ζ represent the amplitude and frequency, respectively, to the system in order to derive the perturbed form (4) as described below [24]:
d Θ 1 d Ξ = J , d J d Ξ = G 2 Θ 1 3 G 1 Θ 1 + ϵ 0 c o s ( ζ Ξ ) .
By modifying the perturbed term, we create phase diagrams that highlight the occurrence of both chaotic behaviors. This study has revealed the presence of quasiperiodic and chaotic behavior in the perturbed dynamical system using chaos detection methods documented in the existing literature [25,26]. The tools employed in this analysis include the following:
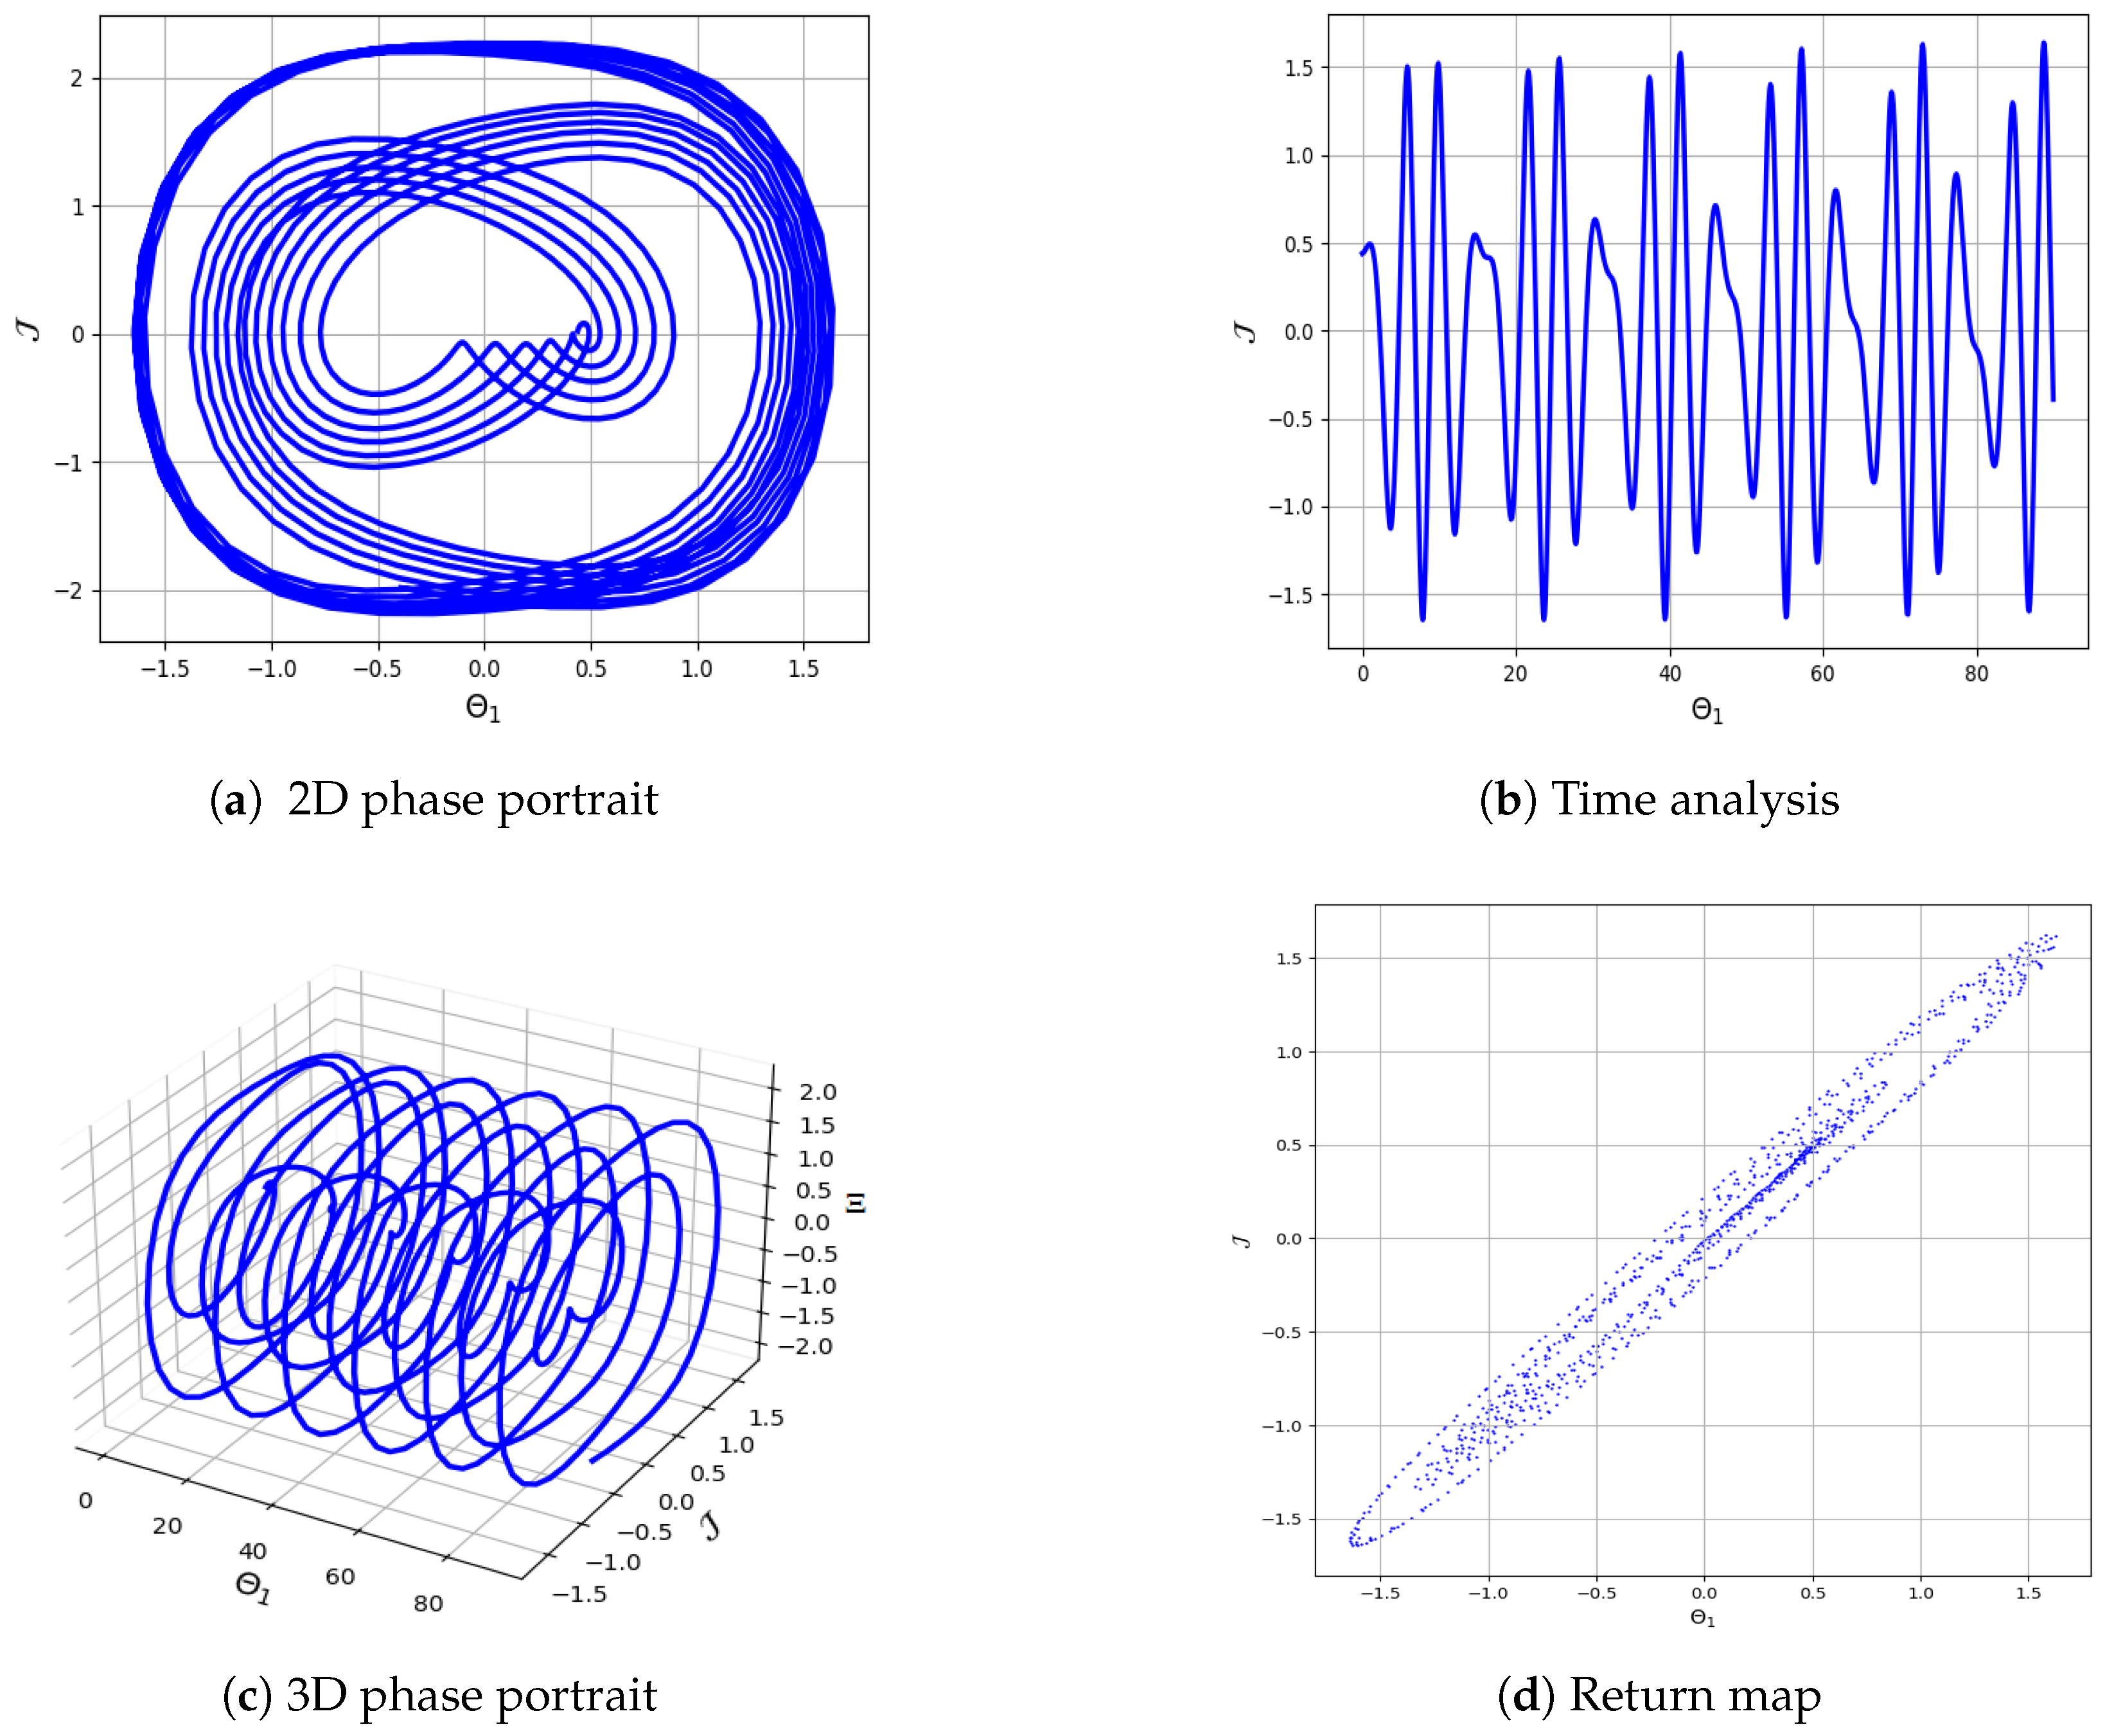
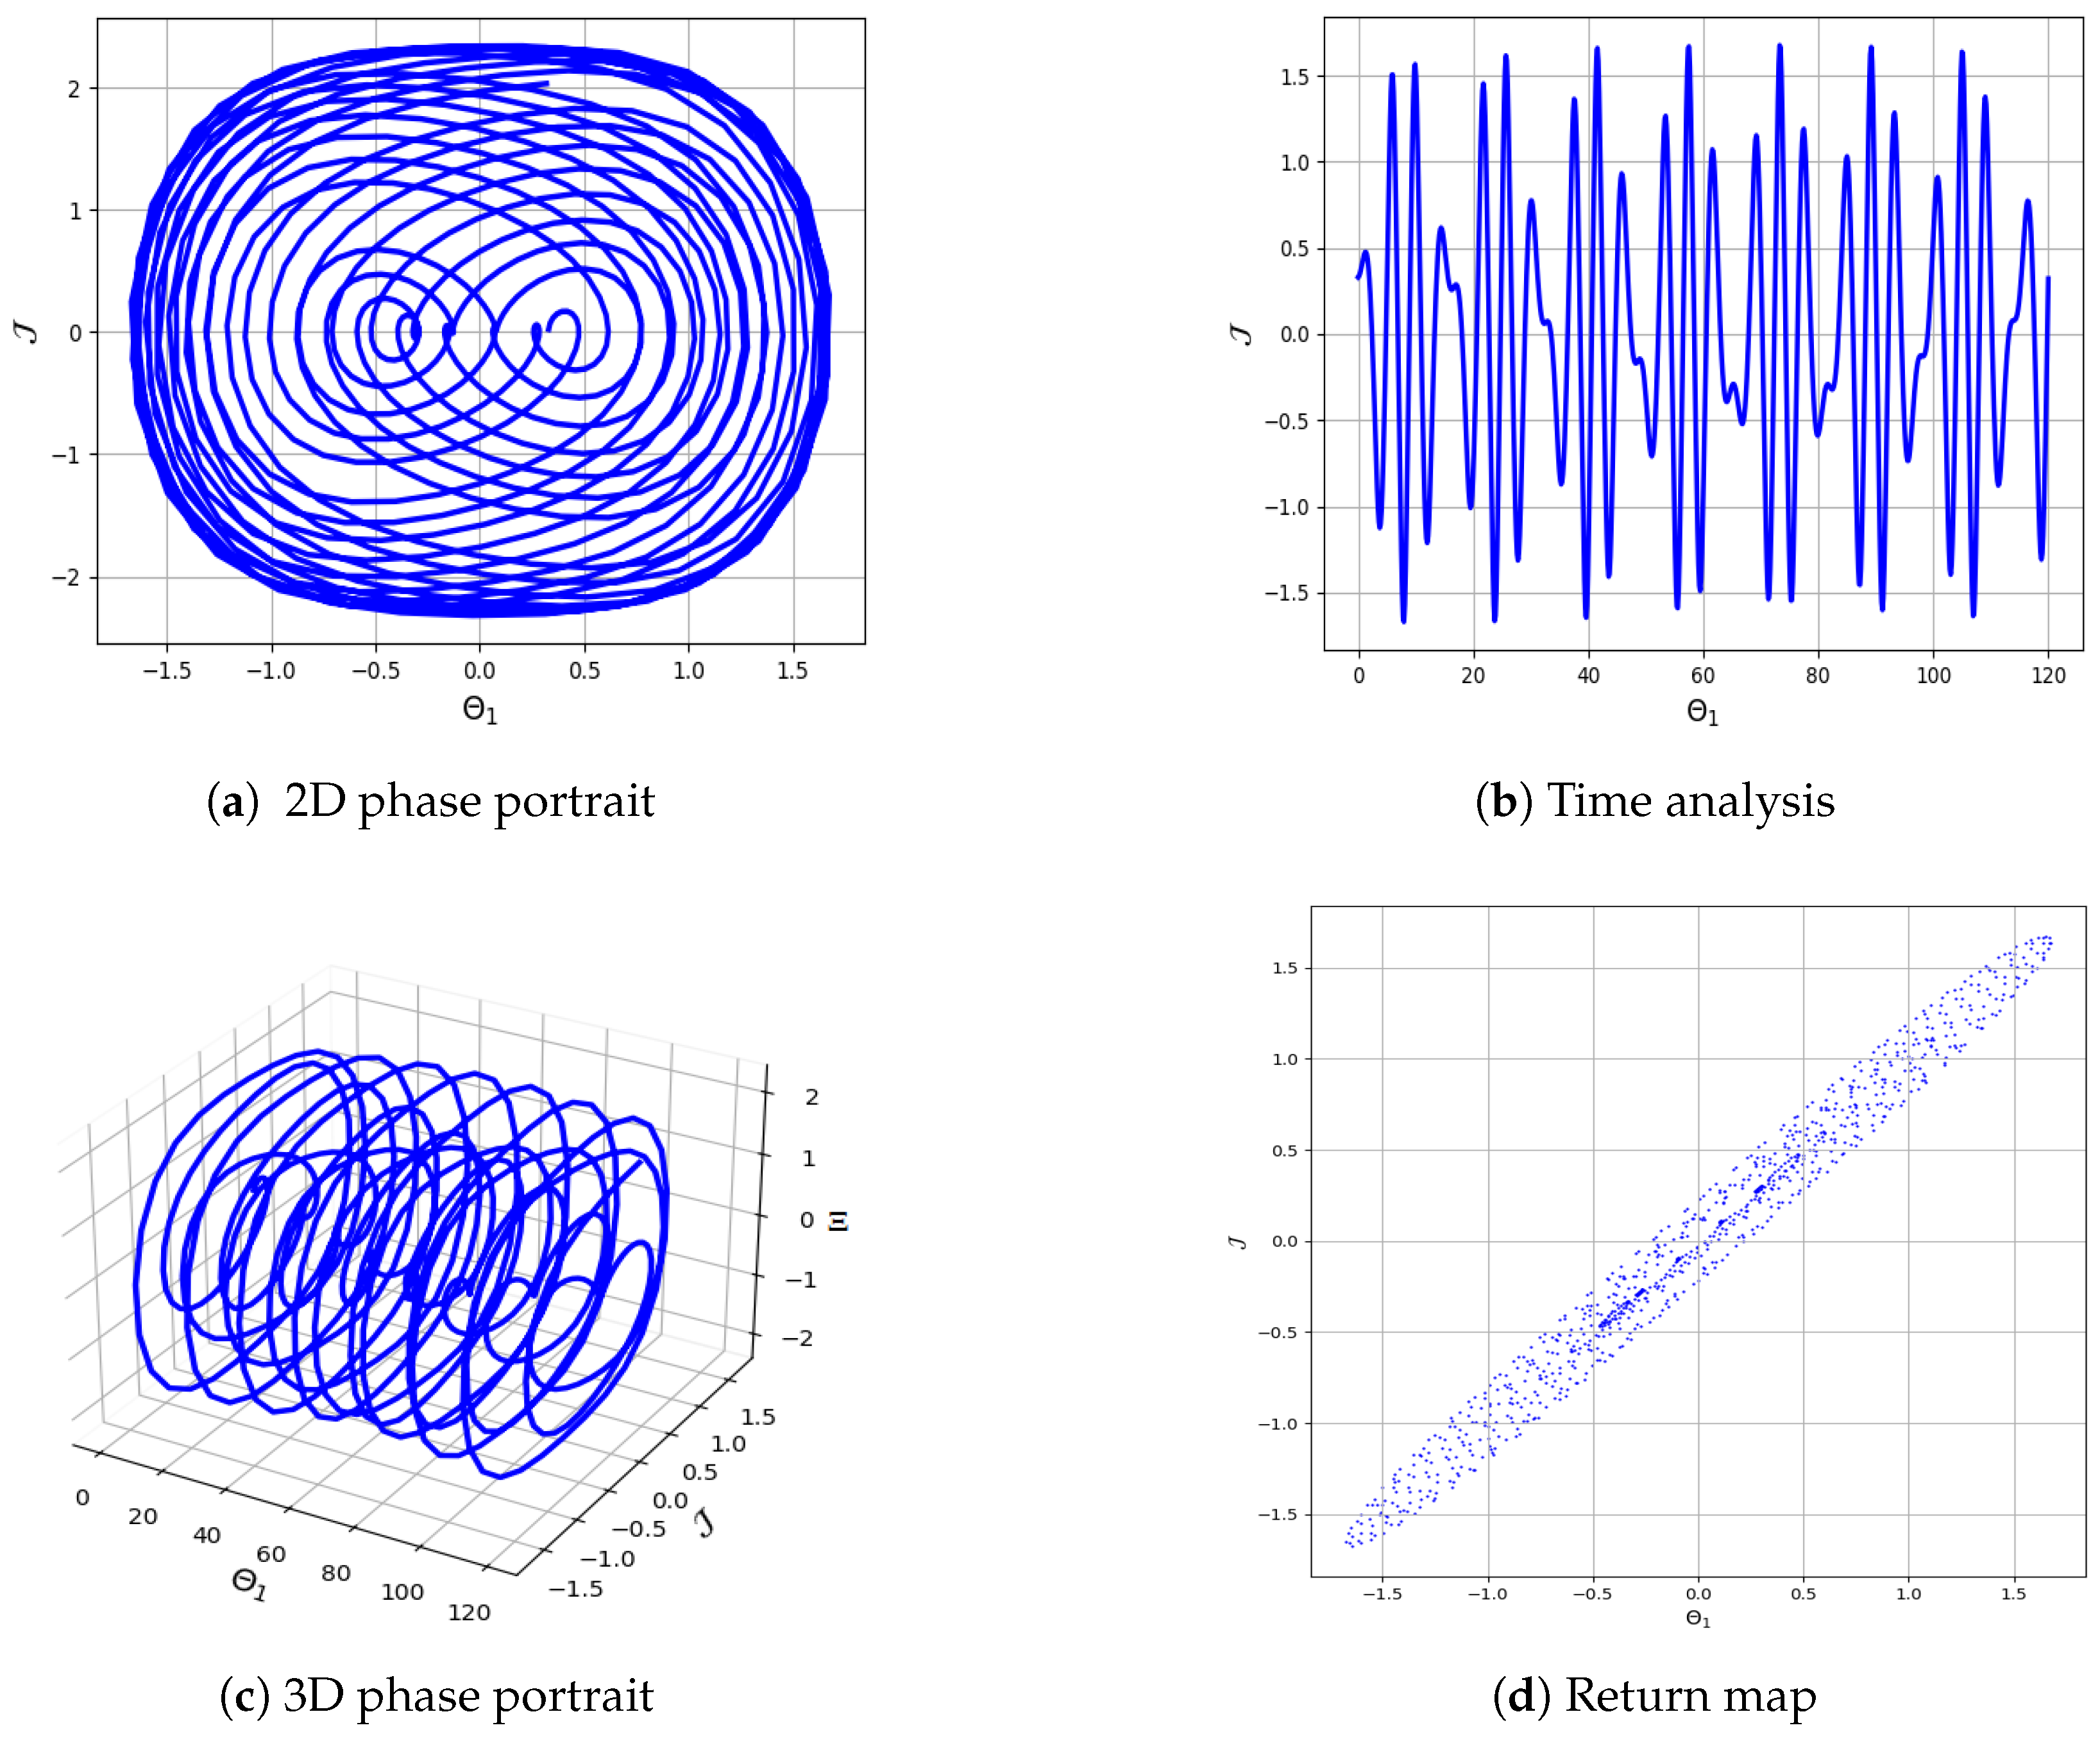
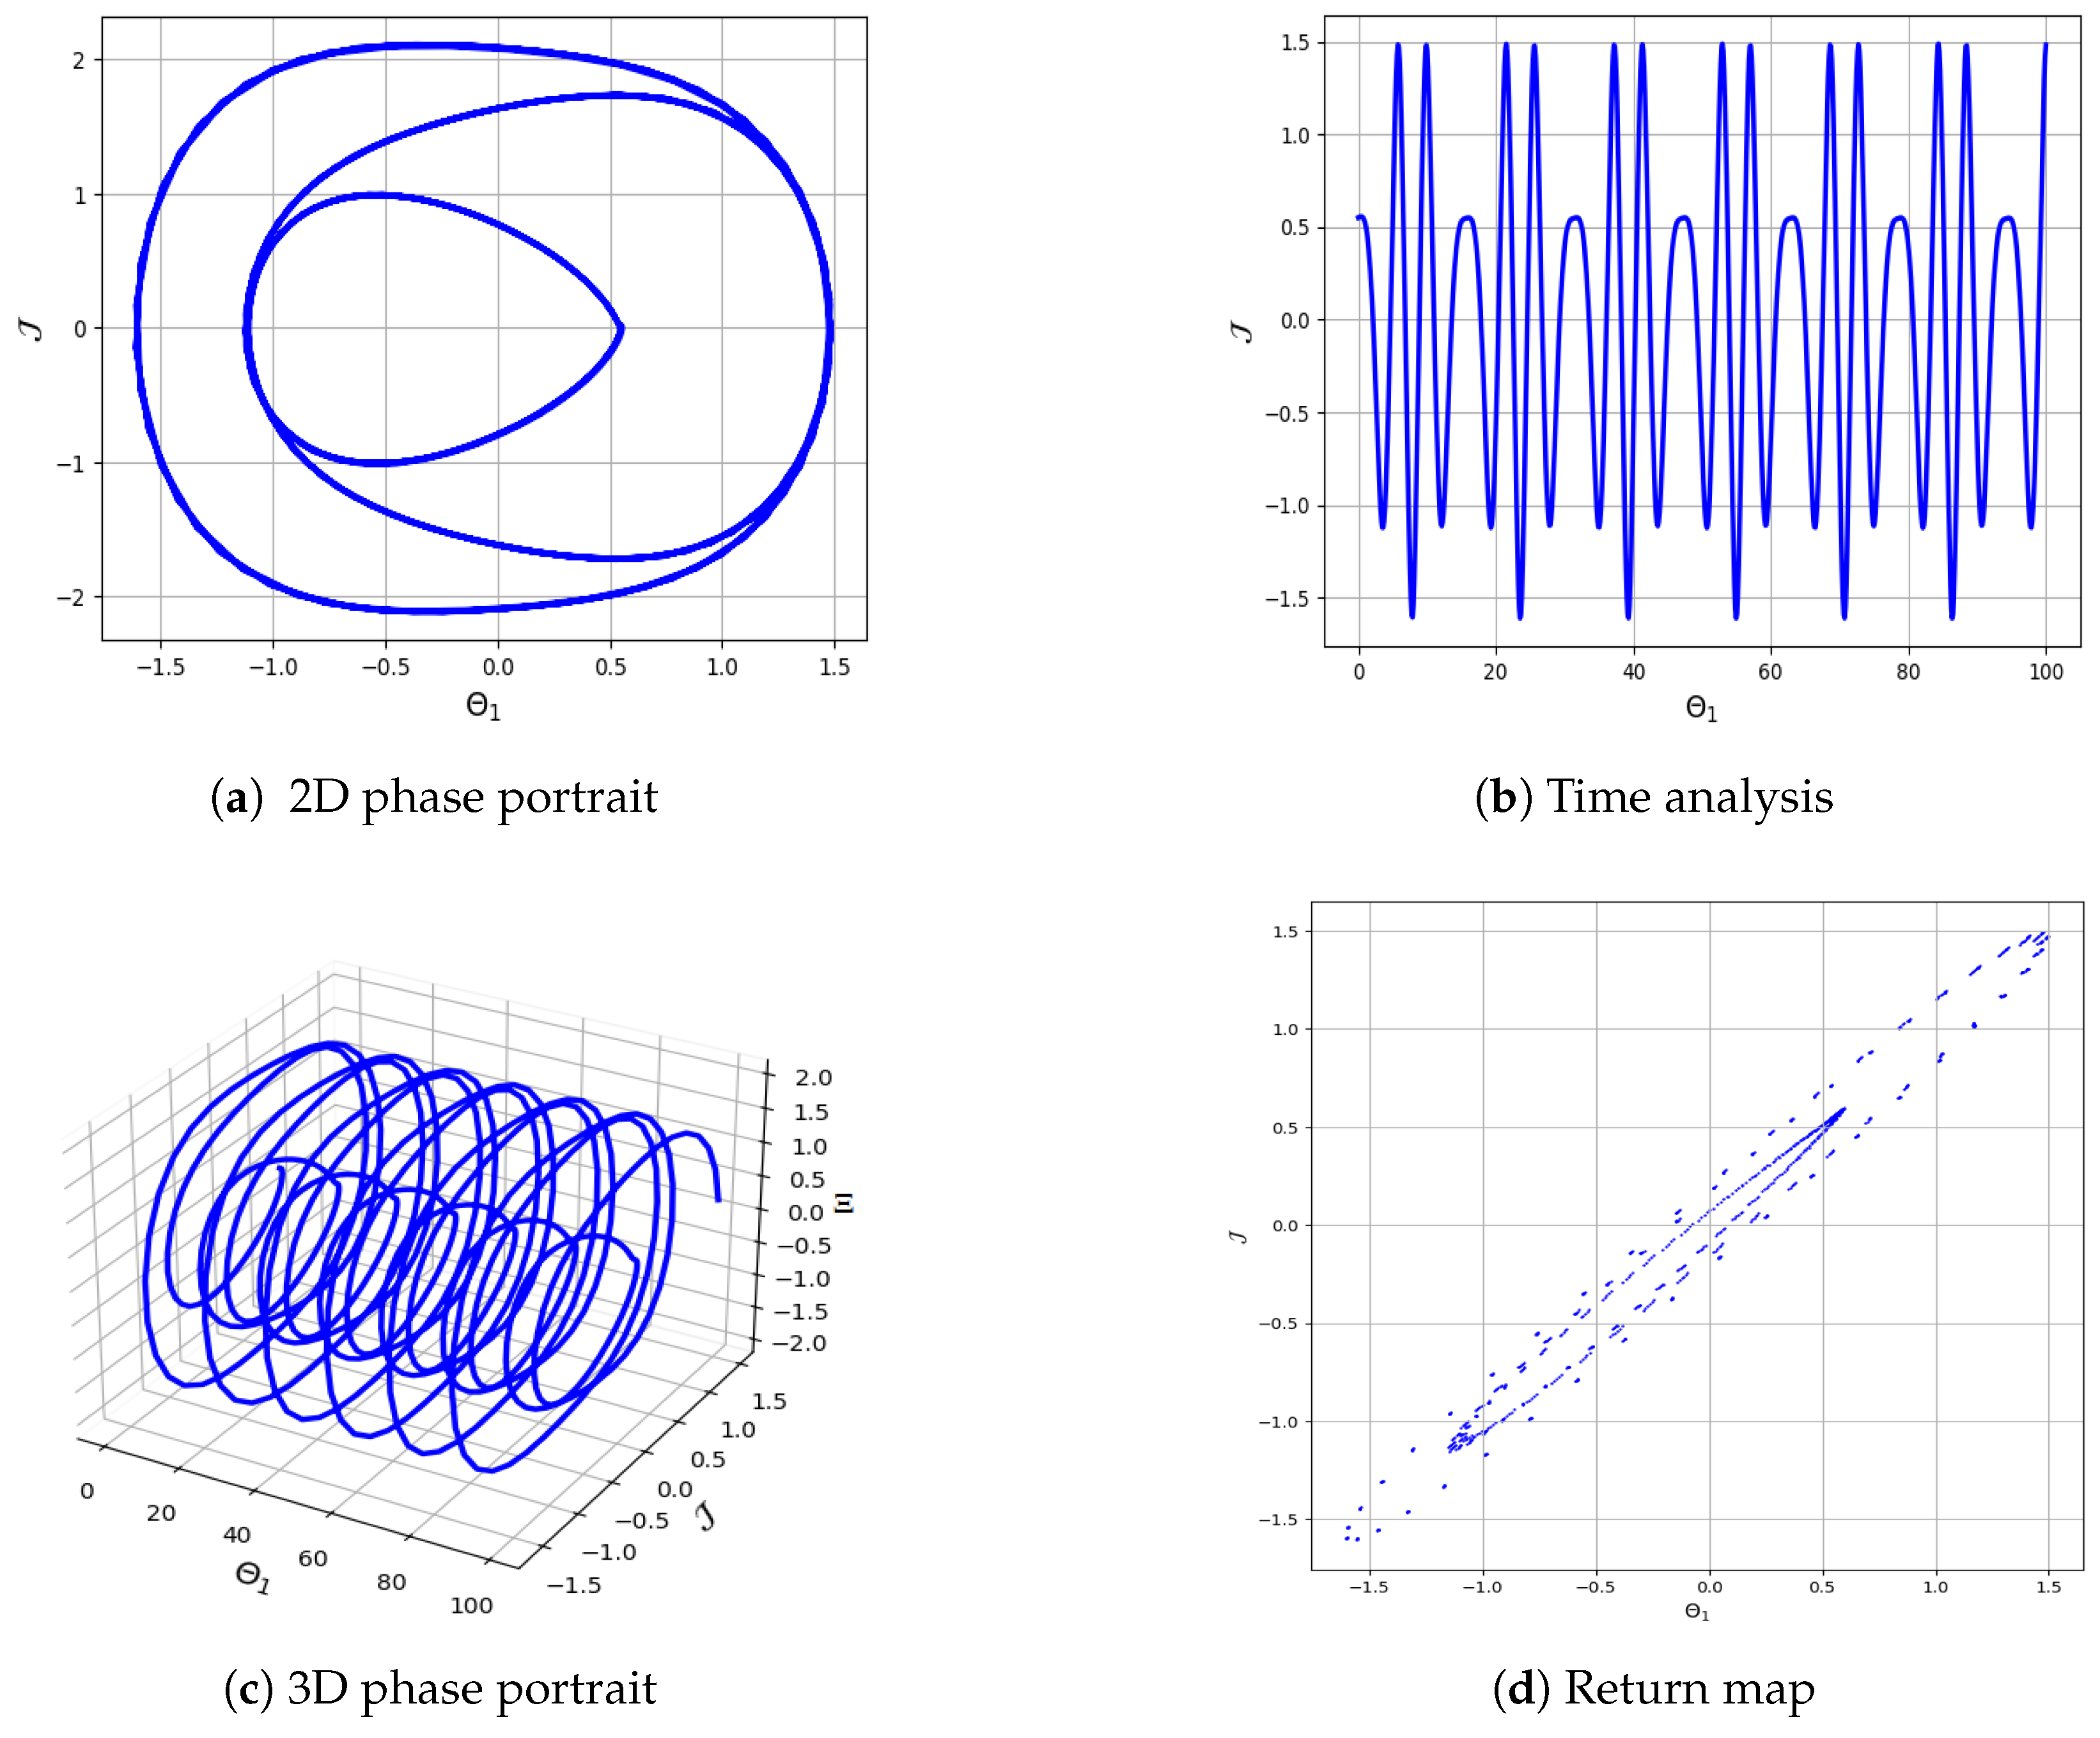
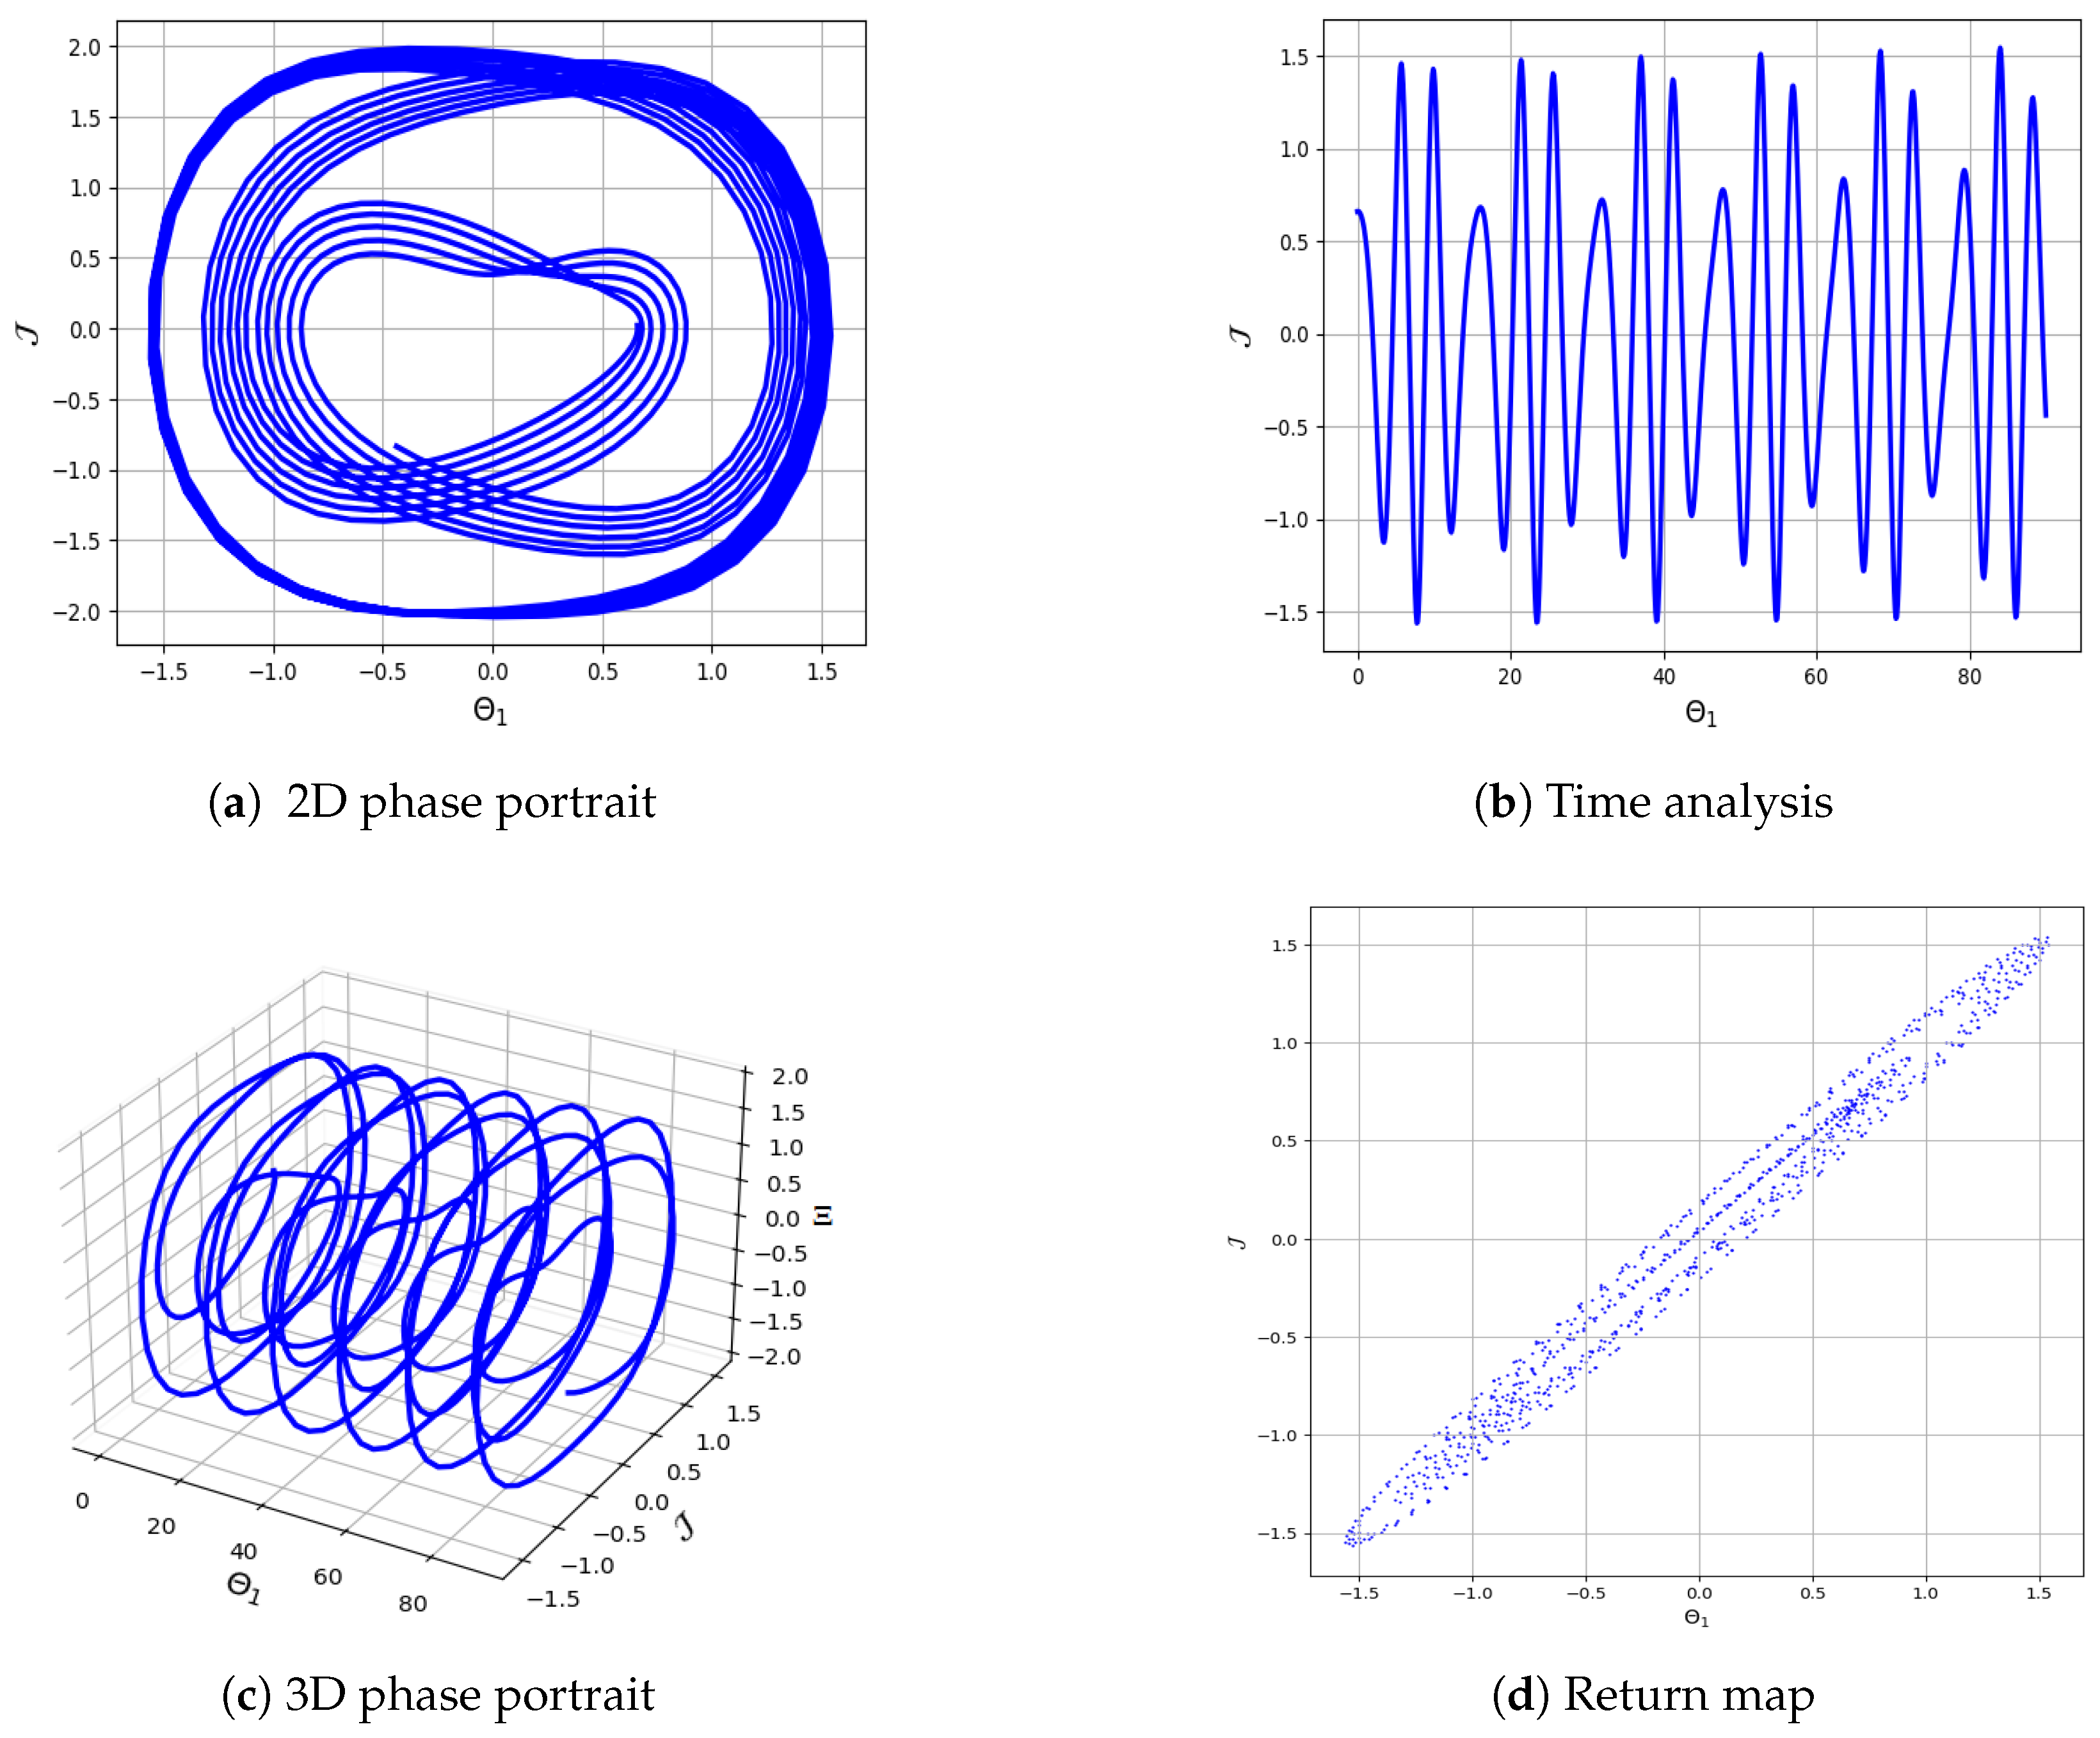
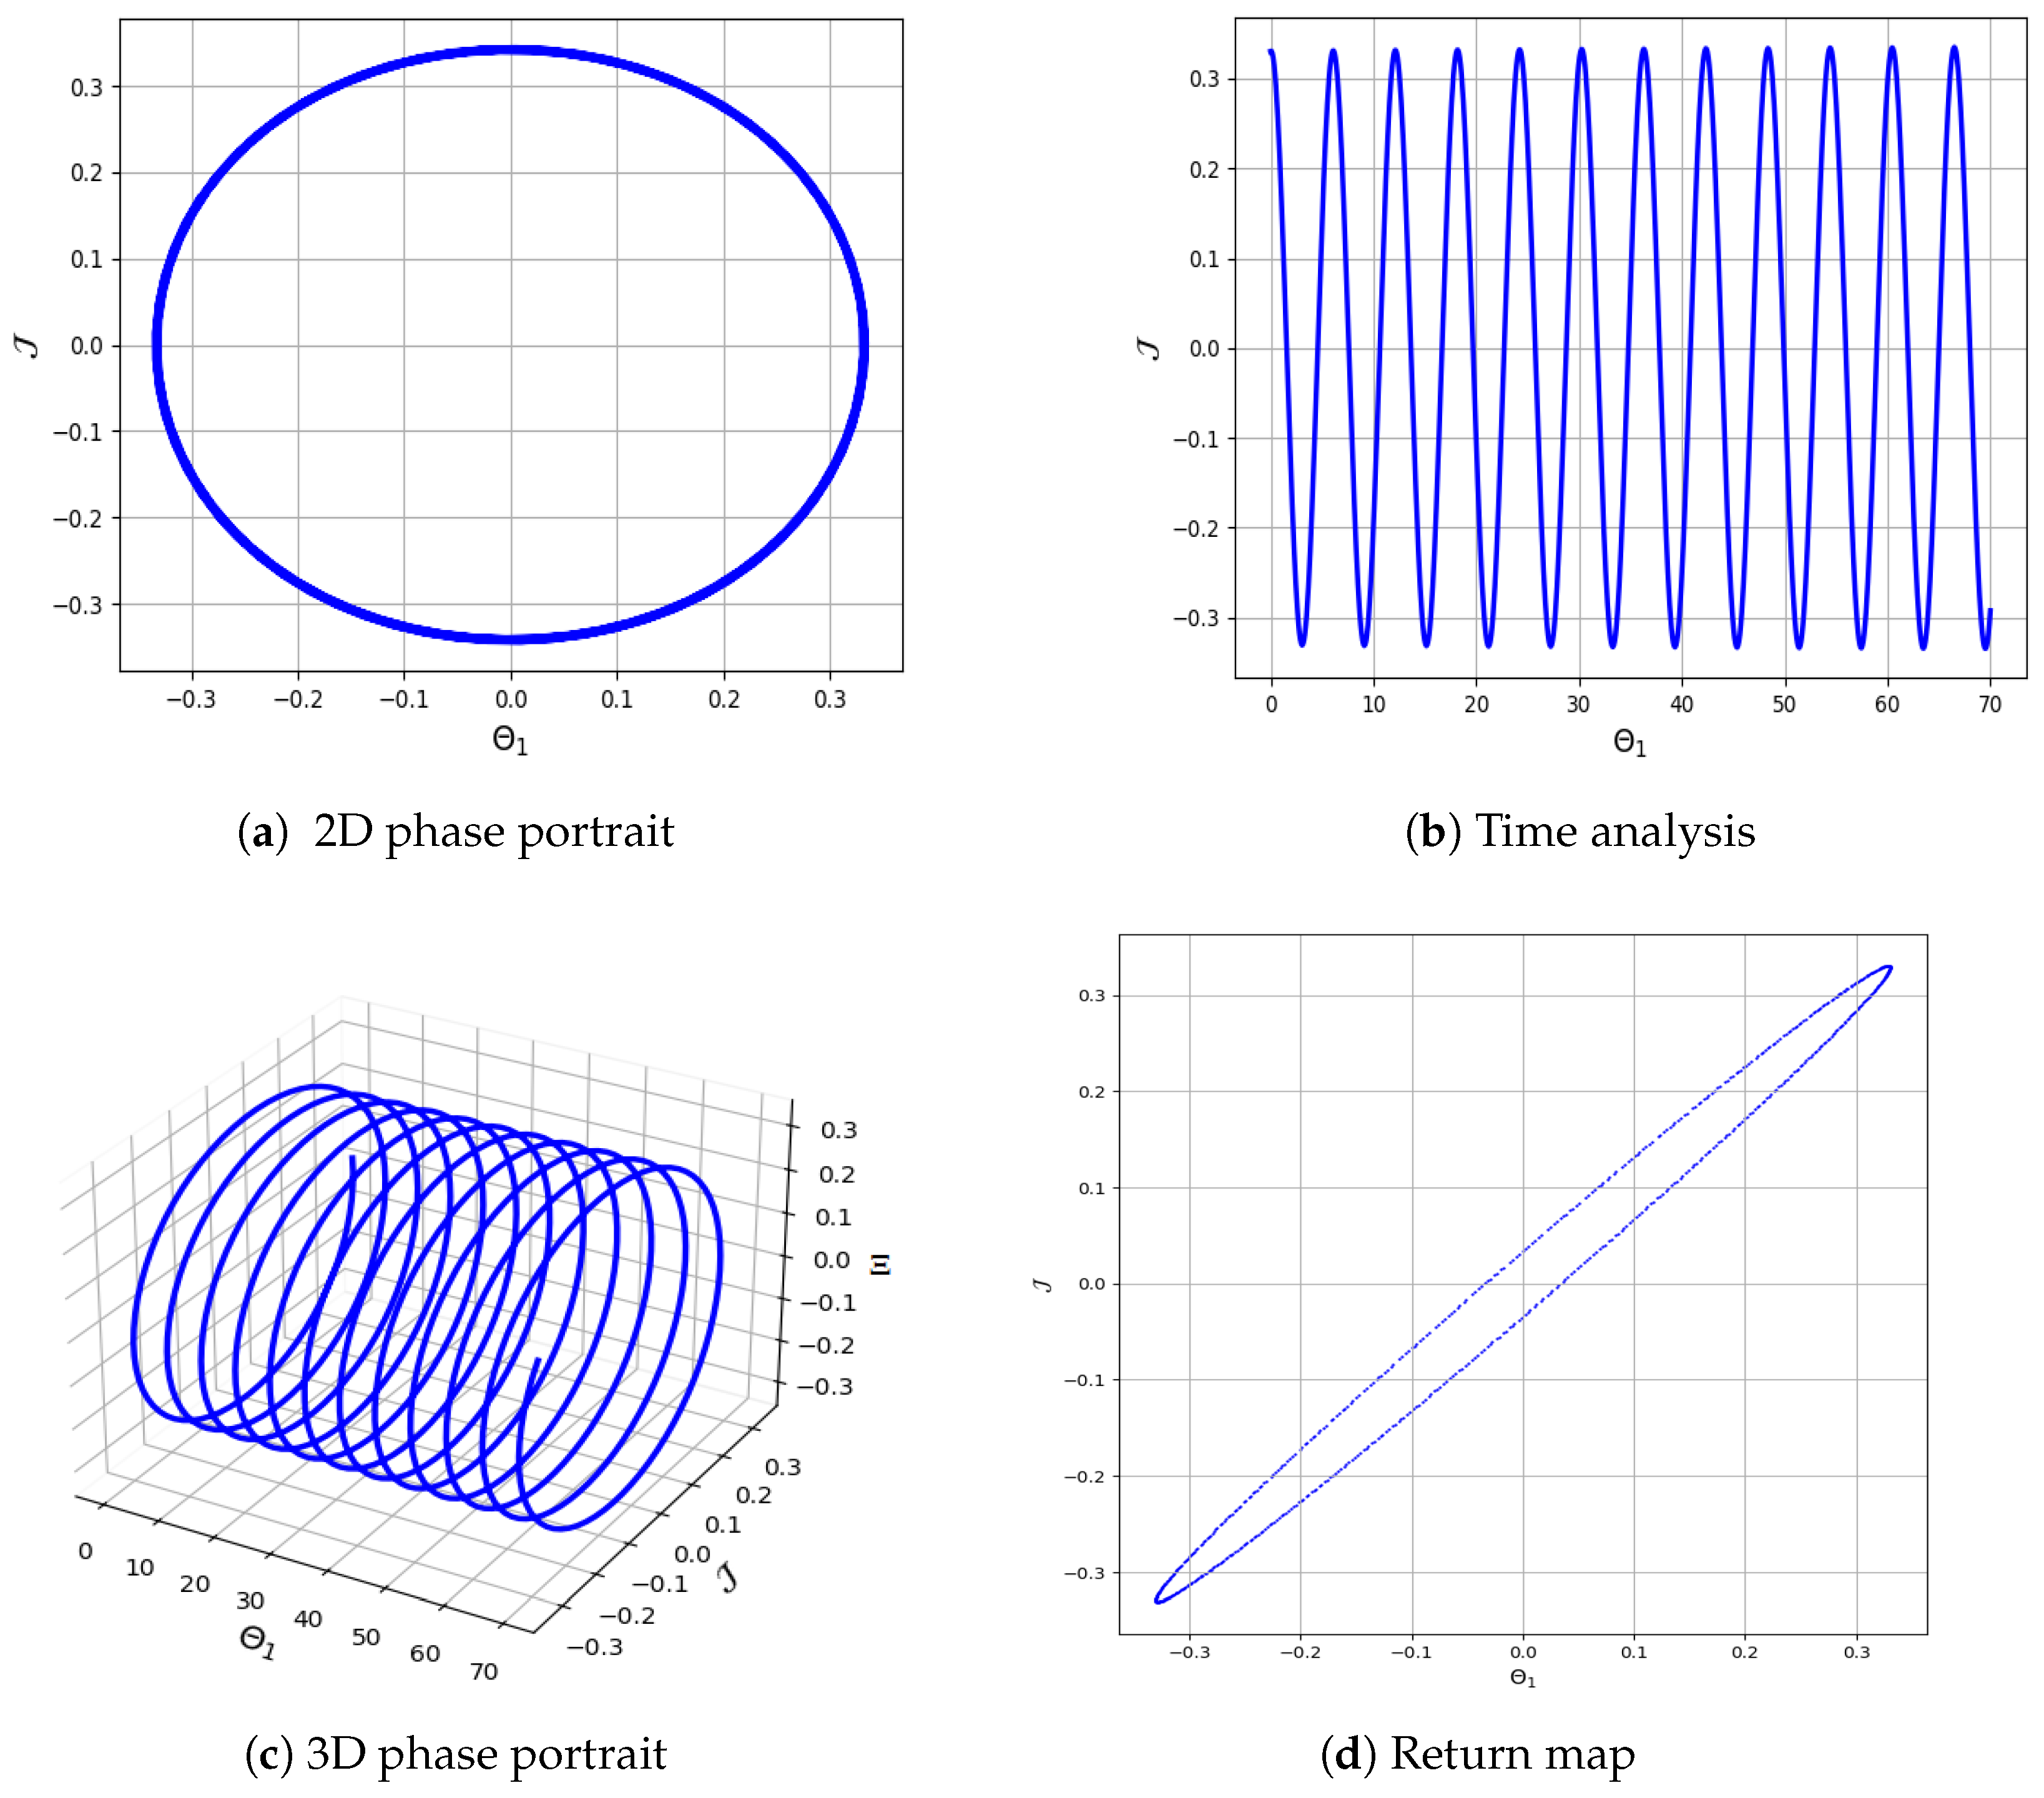
A phase portrait represents a bi-dimensional projection of the phase space, illustrating the instantaneous relationships among the state variables. A fixed-point solution corresponds to a specific point within the phase portrait, while a periodic solution appears as a closed curve. Chaotic solutions, in contrast, are characterized by unique, irregular curves visible within the phase portrait. Figure 3a–d illustrates the system (30) with parameters G 1 = 0.87 , G 2 = 0.67 , ϵ 0 = 0.7 , and ζ = 0.2 revealing chaotic dynamics. In Figure 4a–d, similar analyses are performed for the system (30) with G 1 = 0.87 , G 2 = 4.67 , ϵ 0 = 1.2 , and ζ = 0.2 showcasing chaotic behavior. Figure 5a–d presents the results for G 1 = 0.87 , G 2 = 0.17 , ϵ 0 = 1.5 , and ζ = 0.2 further confirming chaotic dynamics in the system. In Figure 6a–d, the system (30) is analyzed with G 1 = 0.87 , G 2 = 0.67 , ϵ 0 = 1.9 , and ζ = 0.2 with the initial condition (0.55, 0.1), continuing to demonstrate chaotic behavior. Figure 7a–d explores the system with G 1 = 0.87 , G 2 = 0.27 , ϵ 0 = 1.9 , and ζ = 2.2 revealing the chaotic nature of the system. In Figure 8a–d, we investigate the behavior of the system without the perturbed term, using G 1 = 0.37 , and G 2 = 0.67 , which exhibits periodic dynamics.
Figure 3, Figure 4, Figure 5, Figure 6, Figure 7 and Figure 8 further examine the chaotic behavior of System (30) using phase portraits, a return map, and time series analysis. Over time, the system displays erratic motion, deviating from regular patterns, which indicates chaotic dynamics. When a dynamical system undergoes perturbation, it may display multi-stability, where multiple distinct dynamic behaviors arise from the same set of parameters but different initial conditions. These manifestations may encompass chaotic dynamics, quasi-periodicity, periodic behavior, and multi-periodicity, each emergent under distinct conditions. In Figure 9a,b, we investigate the phenomenon of multi-stability within the perturbed system (30) across a spectrum of initial conditions. The multi-stability of the dynamical system (30) was calculated using the initial condition (0.59, 0.04, 0.27) and the parameter values G 1 = 0.87 , G 2 = 0.67 , ϵ 0 = 1.9 and ζ = 0.2 . Multistability-analysis reveals that System (30) is highly sensitive to initial conditions, leading to chaotic dynamics. This multi-stability is a crucial feature of complex dynamical systems, and understanding it is key to explaining and predicting their behavior across various scenarios.
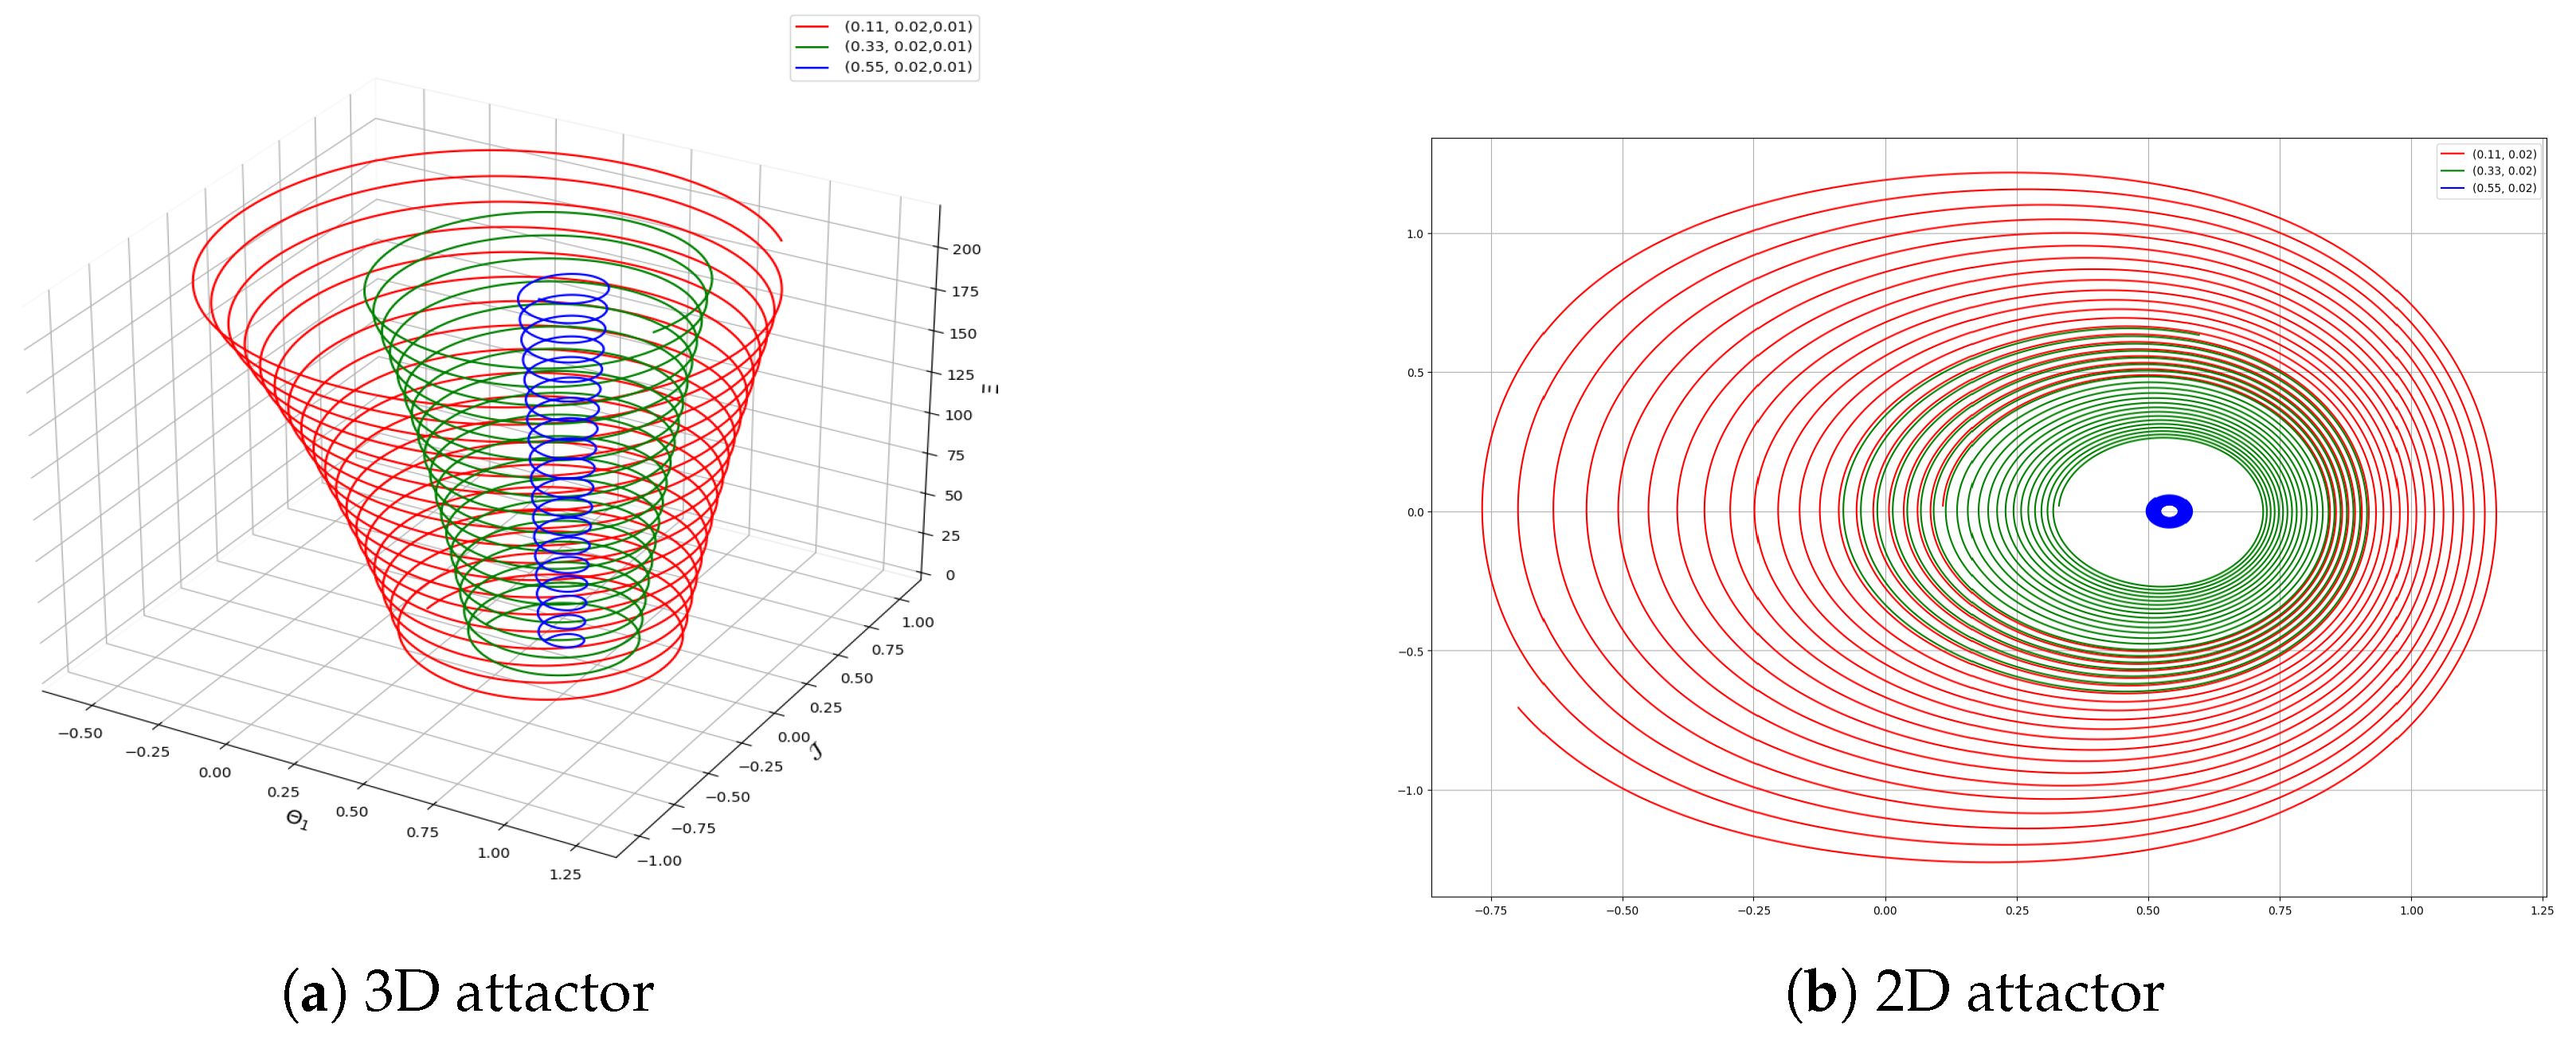
A chaotic attractor demonstrates sensitive dependence on initial conditions, where minor differences in starting points lead to substantial divergence in trajectories over time. Specifically, nearby points on the attractor eventually separate as the system evolves. Chaotic behavior in the dynamical system (30) is shown by the parameter values G 1 = 0.87 , G 2 = 0.67 , ϵ 0 = 0.09 and ζ = 0.24 , as depicted in Figure 10. Recurrence plots (RPs), which elucidate the temporal recurrence of system states, facilitate the identification of chaotic behavior. While periodic systems exhibit structured diagonal alignments, chaotic dynamics are characterized by unpredictable and scattered configurations. These plots underscore the demarcation between order and chaos and provide quantifiable metrics to analyze the dynamical properties of a system through parameters such as determinism and recurrence rate. Chaotic behavior in the dynamical system (30) is illustrated using the parameter values G 1 = 0.867 , G 2 = 0.67 , ϵ 0 = 0.02 and ζ = 0.24 , as depicted in Figure 10.
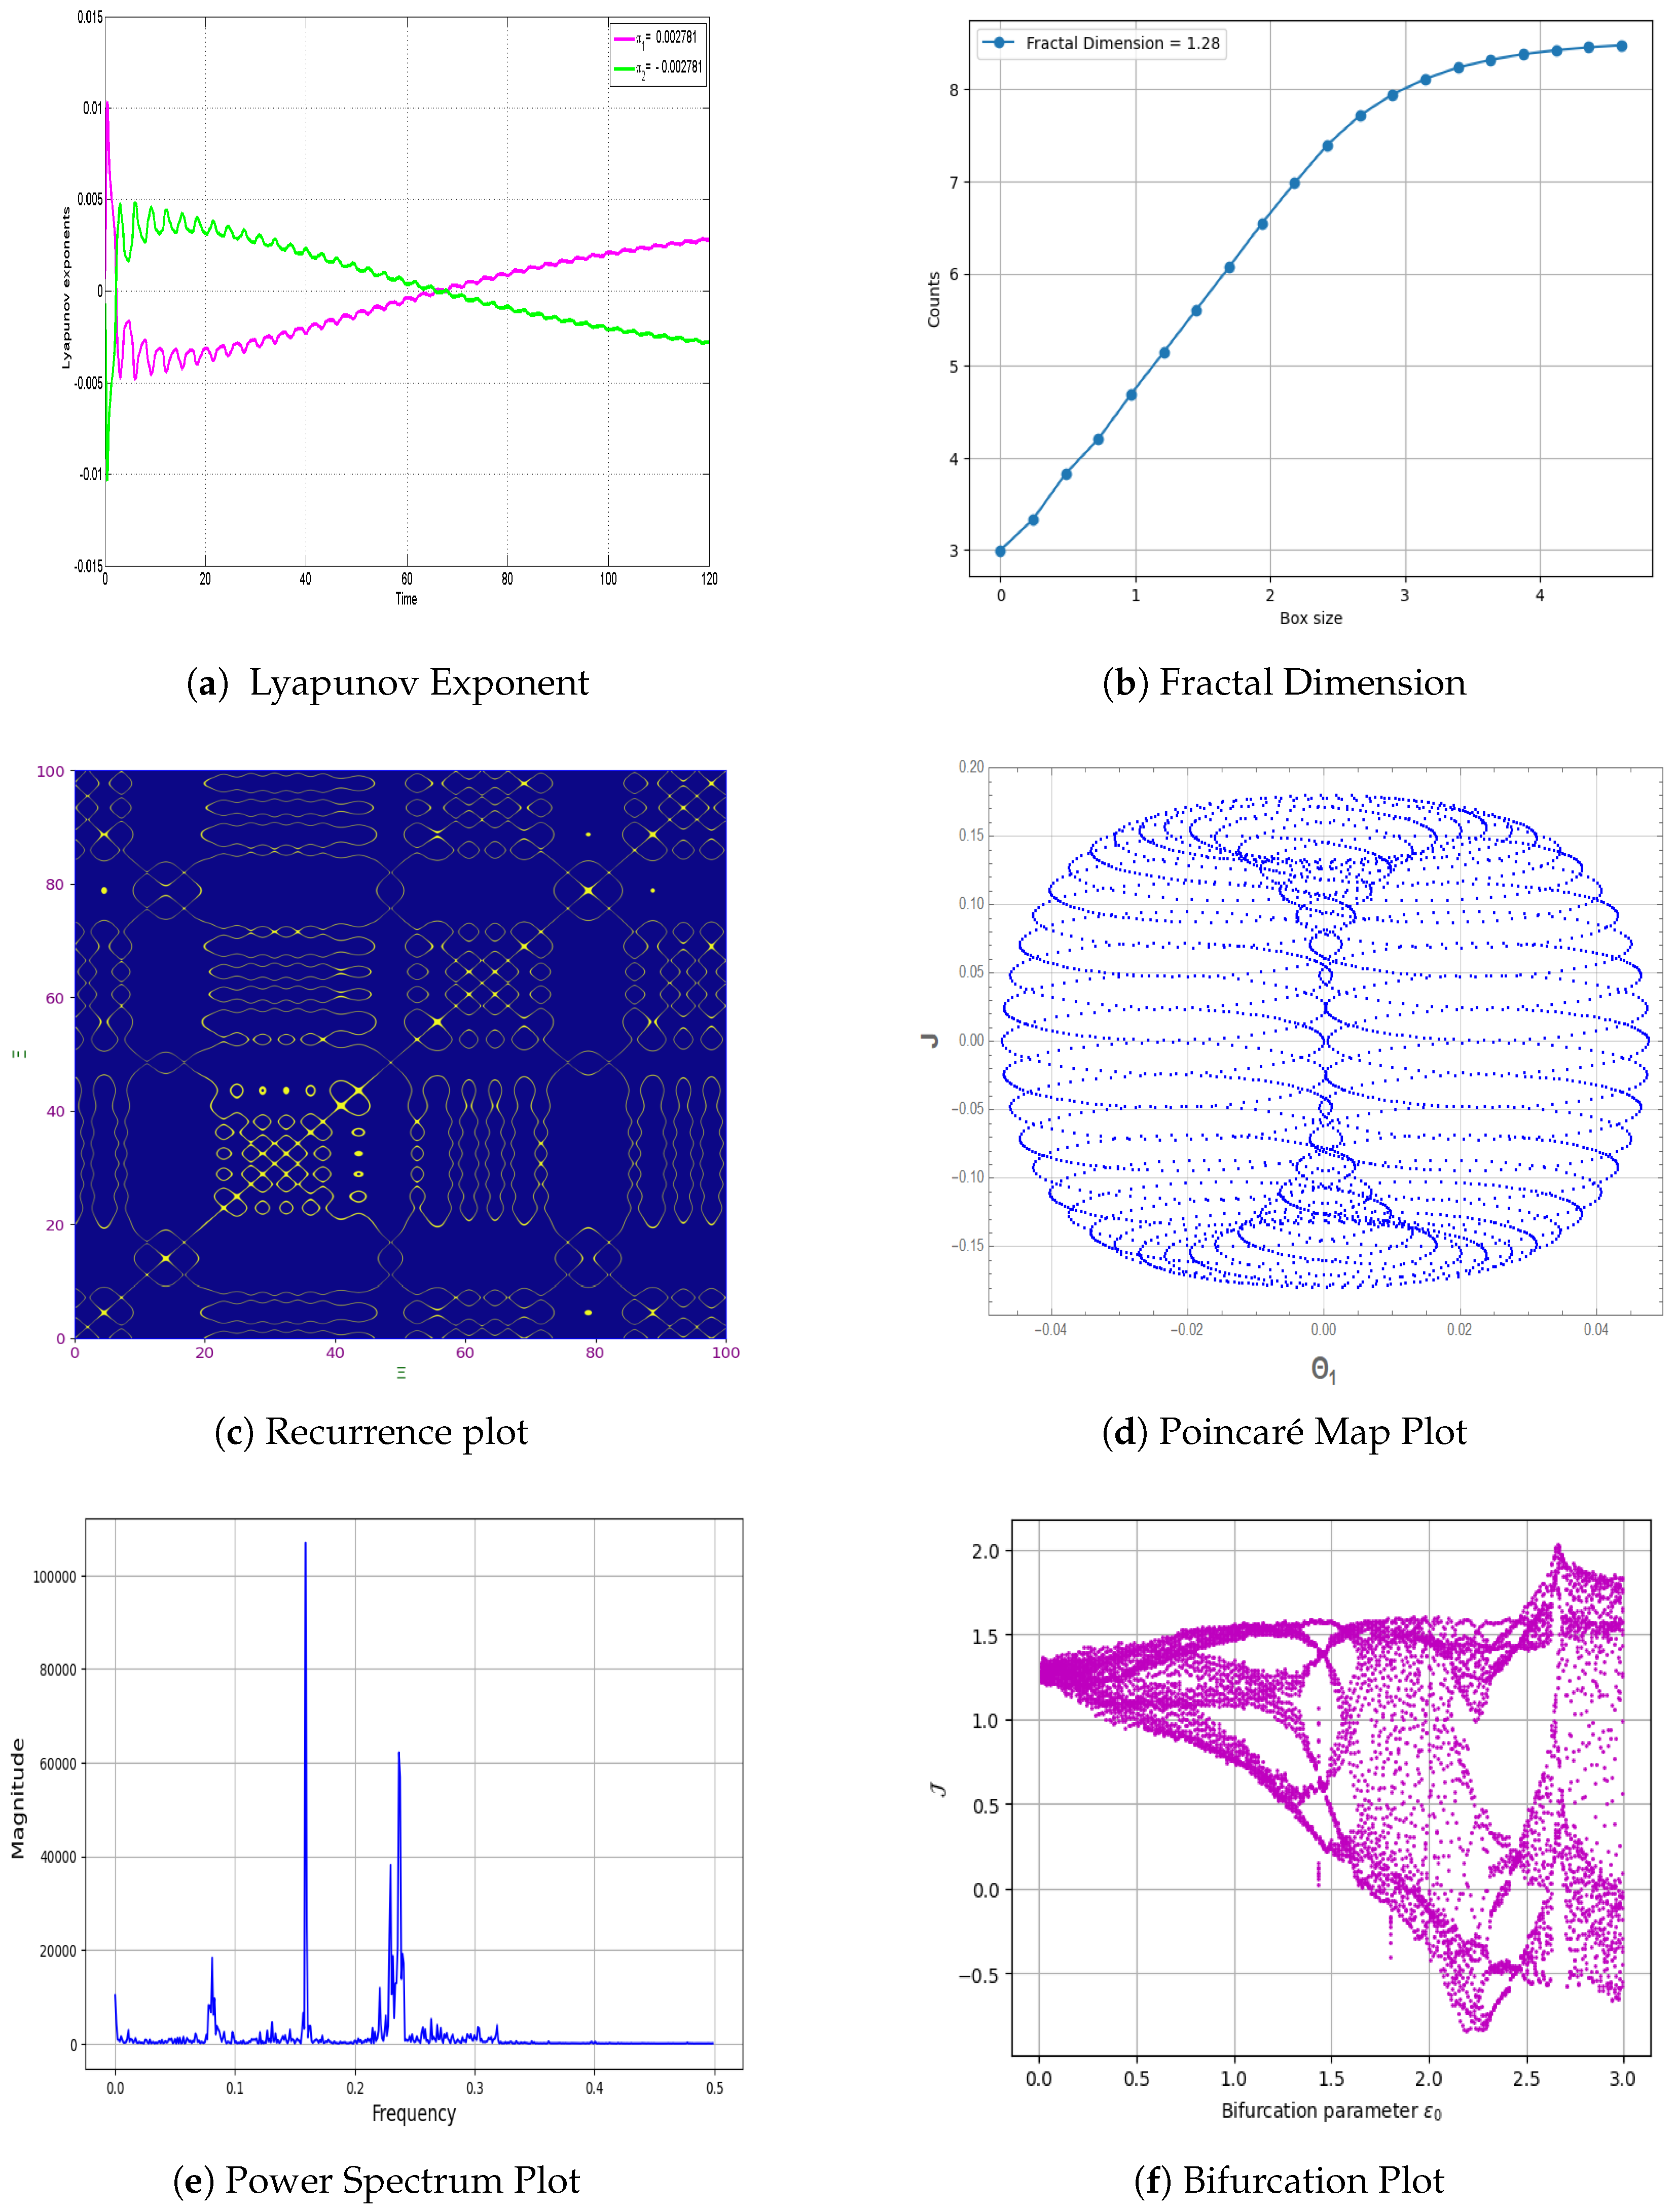
Lyapunov exponents serve as a fundamental instrument for the identification of chaotic behavior and the quantification of a system’s sensitivity to its initial conditions. These exponents yield vital insights into the dynamics and characteristics of chaotic systems, thereby augmenting comprehension of their attributes and potential applications [27]. Lyapunov exponents ( j = 1 , 2 , , m ) represent numerical indices that measure the exponential divergence or convergence of two proximate orbits in phase space sharing analogous initial conditions over time. In a system characterized by n dimensions, m Lyapunov exponents are present. In non-autonomous systems, such as a forced pendulum, one of the Lyapunov exponents remains at zero. The presence of at least one positive Lyapunov exponent signals chaotic behavior. The chaotic dynamics of the system are demonstrated using G 1 = 0.87 , G 2 = 0.67 , ϵ 0 = 1.9 , and ζ = 3.2 , using the initial condition ( 0.59 , 0.14 , 0.27 ) , as shown in Figure 11. The fractal dimension plot, recurrence plot, bifurcation diagram, and Poincaré plot are also delineated in Figure 11. The presence of chaotic behavior is substantiated by the positive Lyapunov exponent illustrated in Figure 11a, the fractal dimension exceeding 1, as depicted in Figure 11b, the irregular recurrence patterns evident in Figure 11c, the dense clustering of points in the Poincaré plot as shown in Figure 11d, and the complex power spectrum represented in Figure 11e. Furthermore, the bifurcation diagram presented in Figure 11f elucidates the transition from stable to chaotic states.

6. Sensitivity Analysis

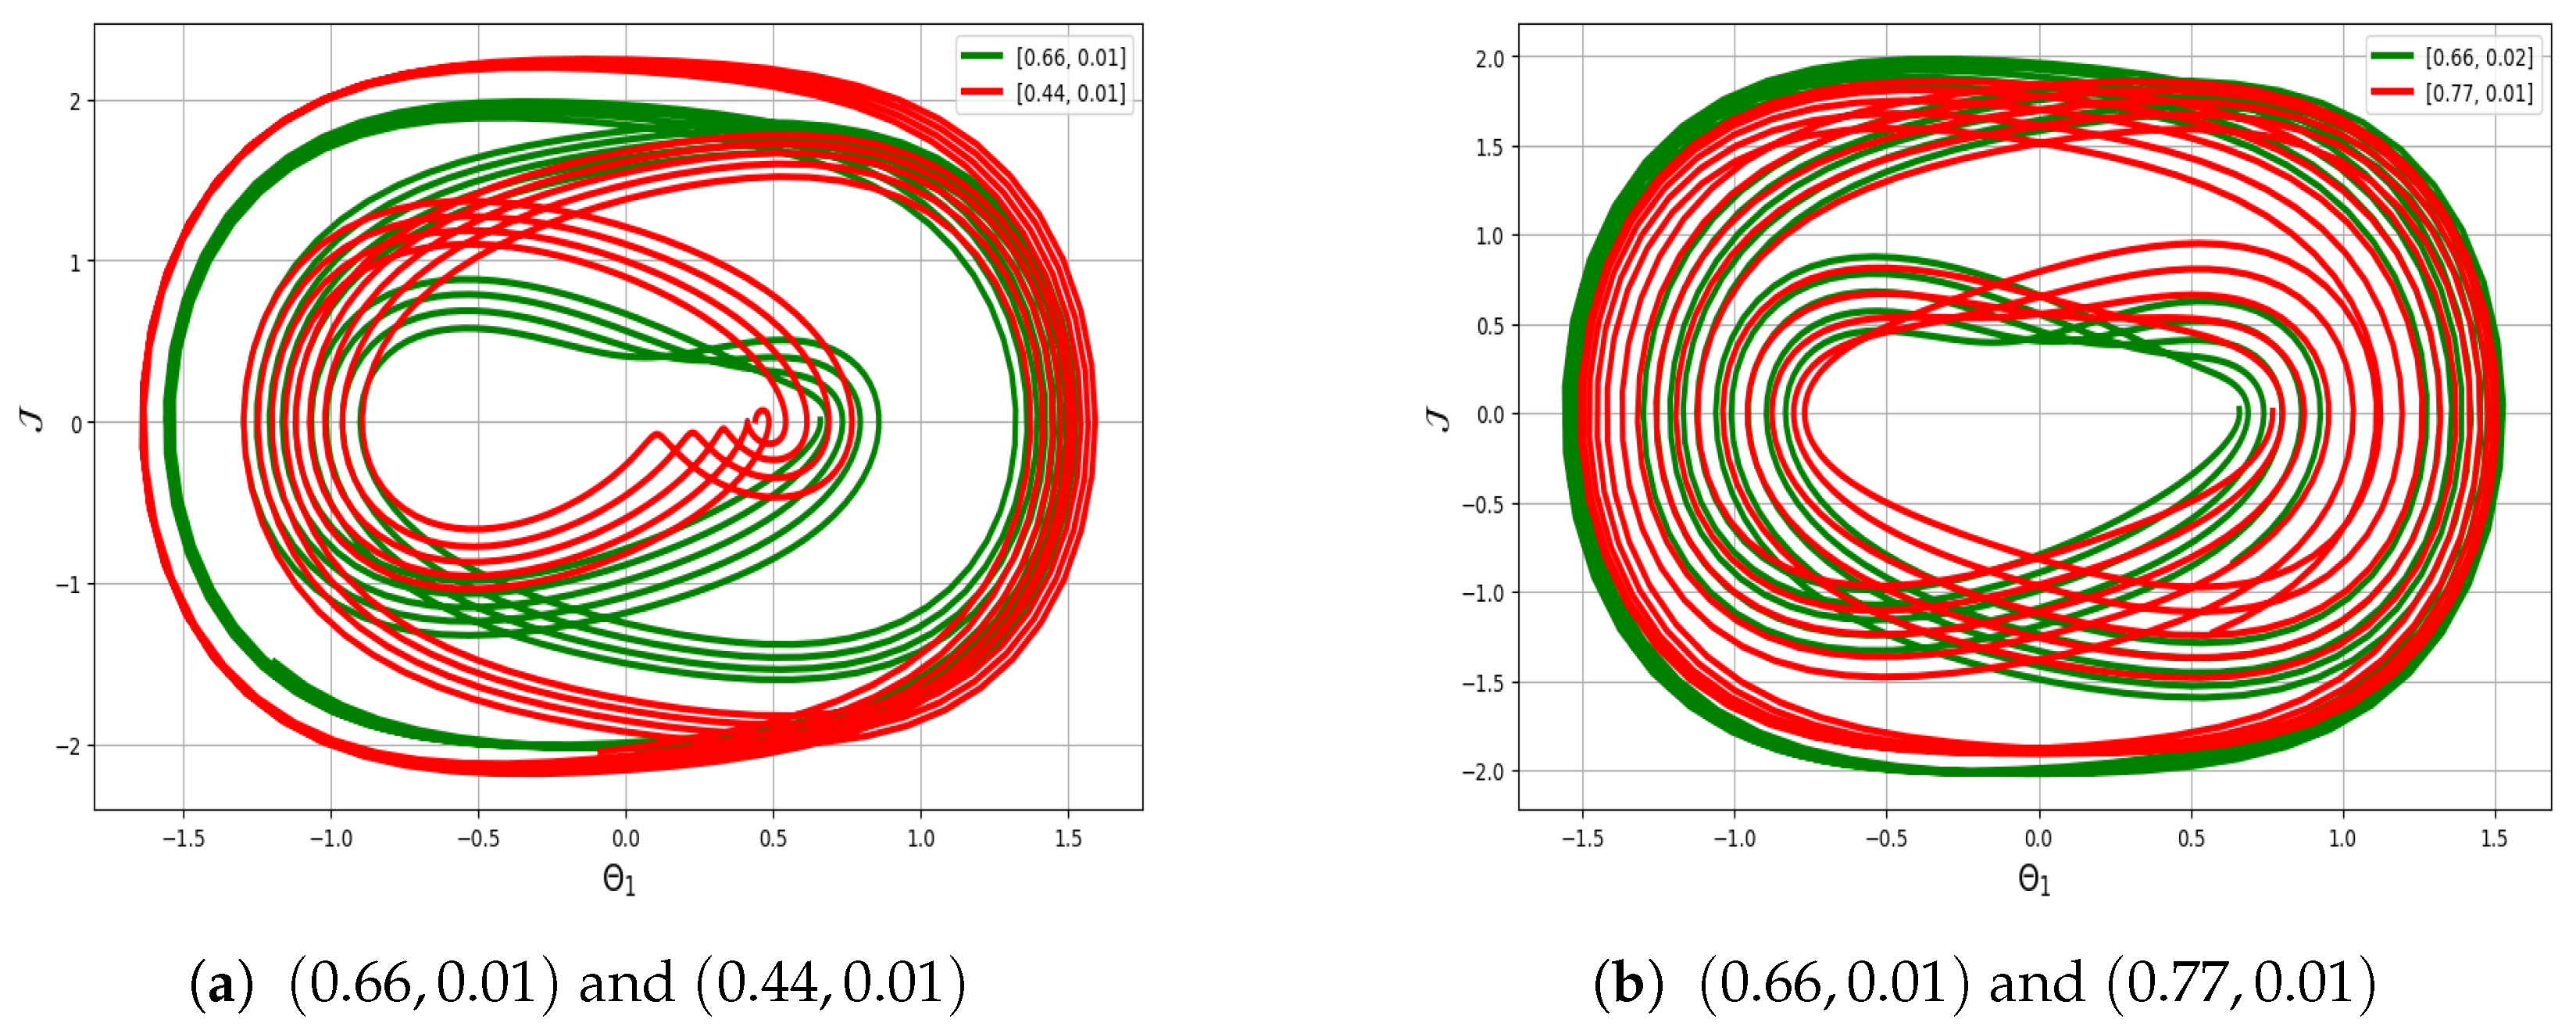
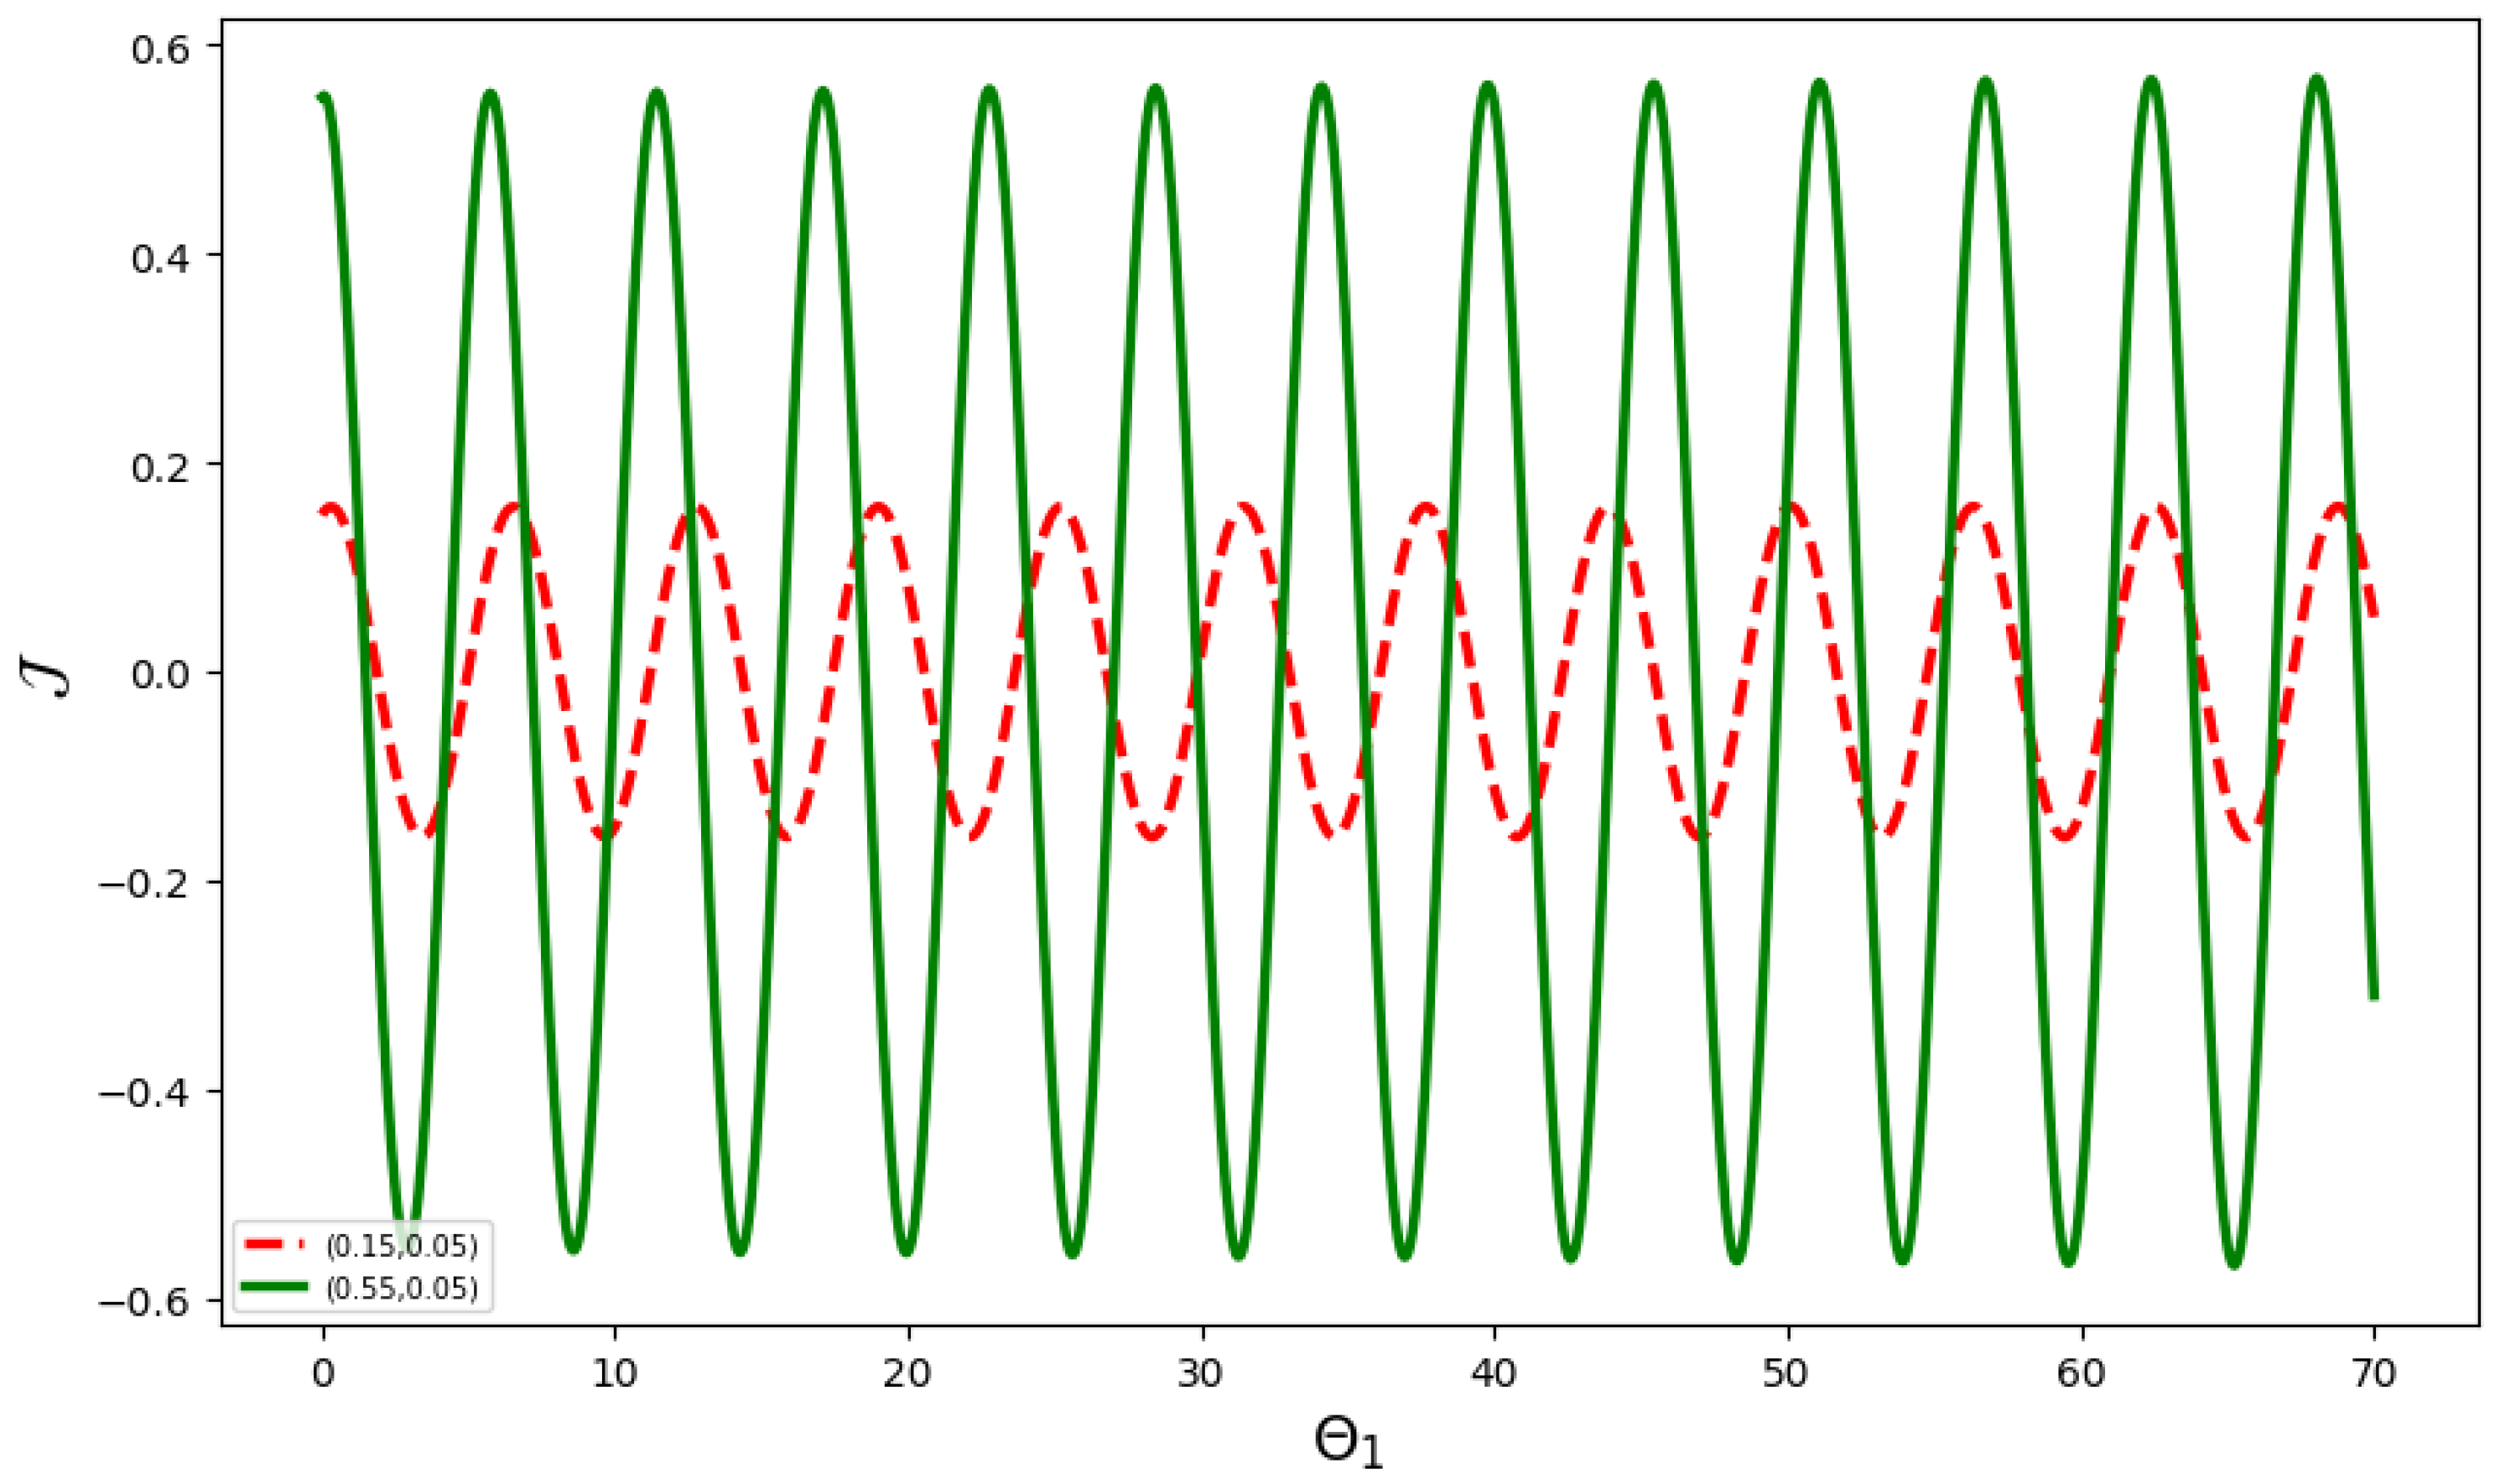
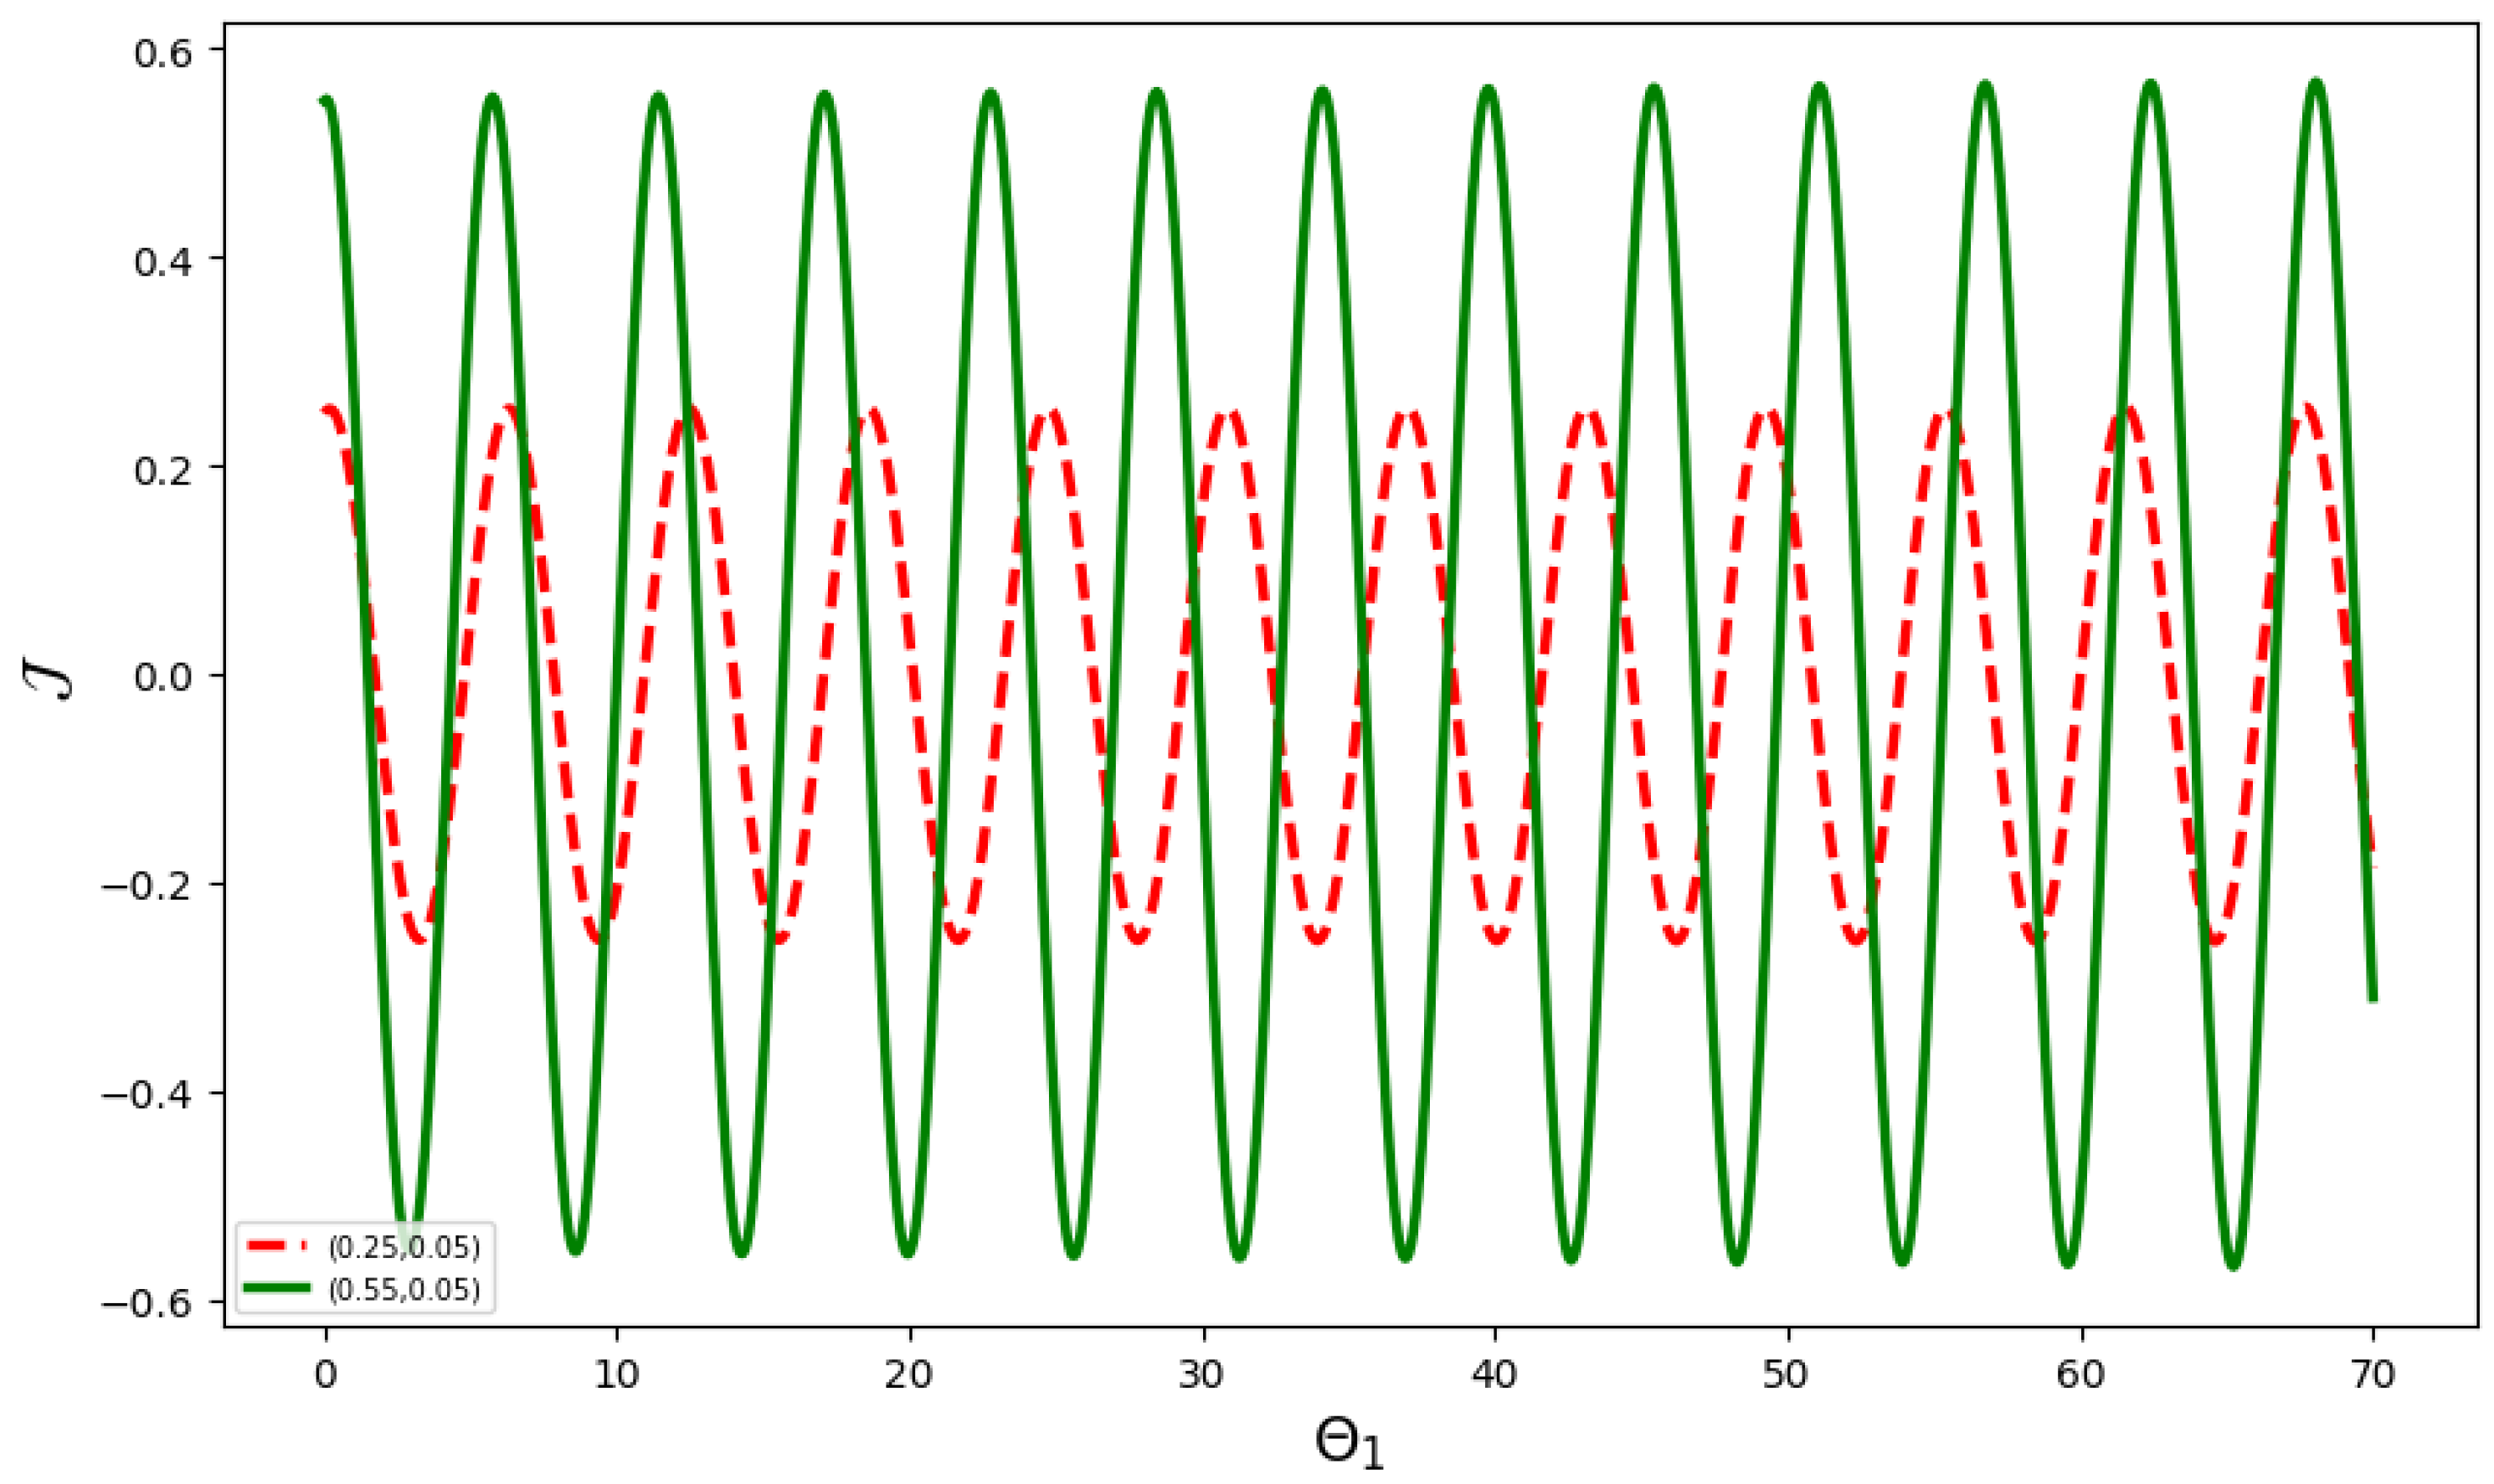
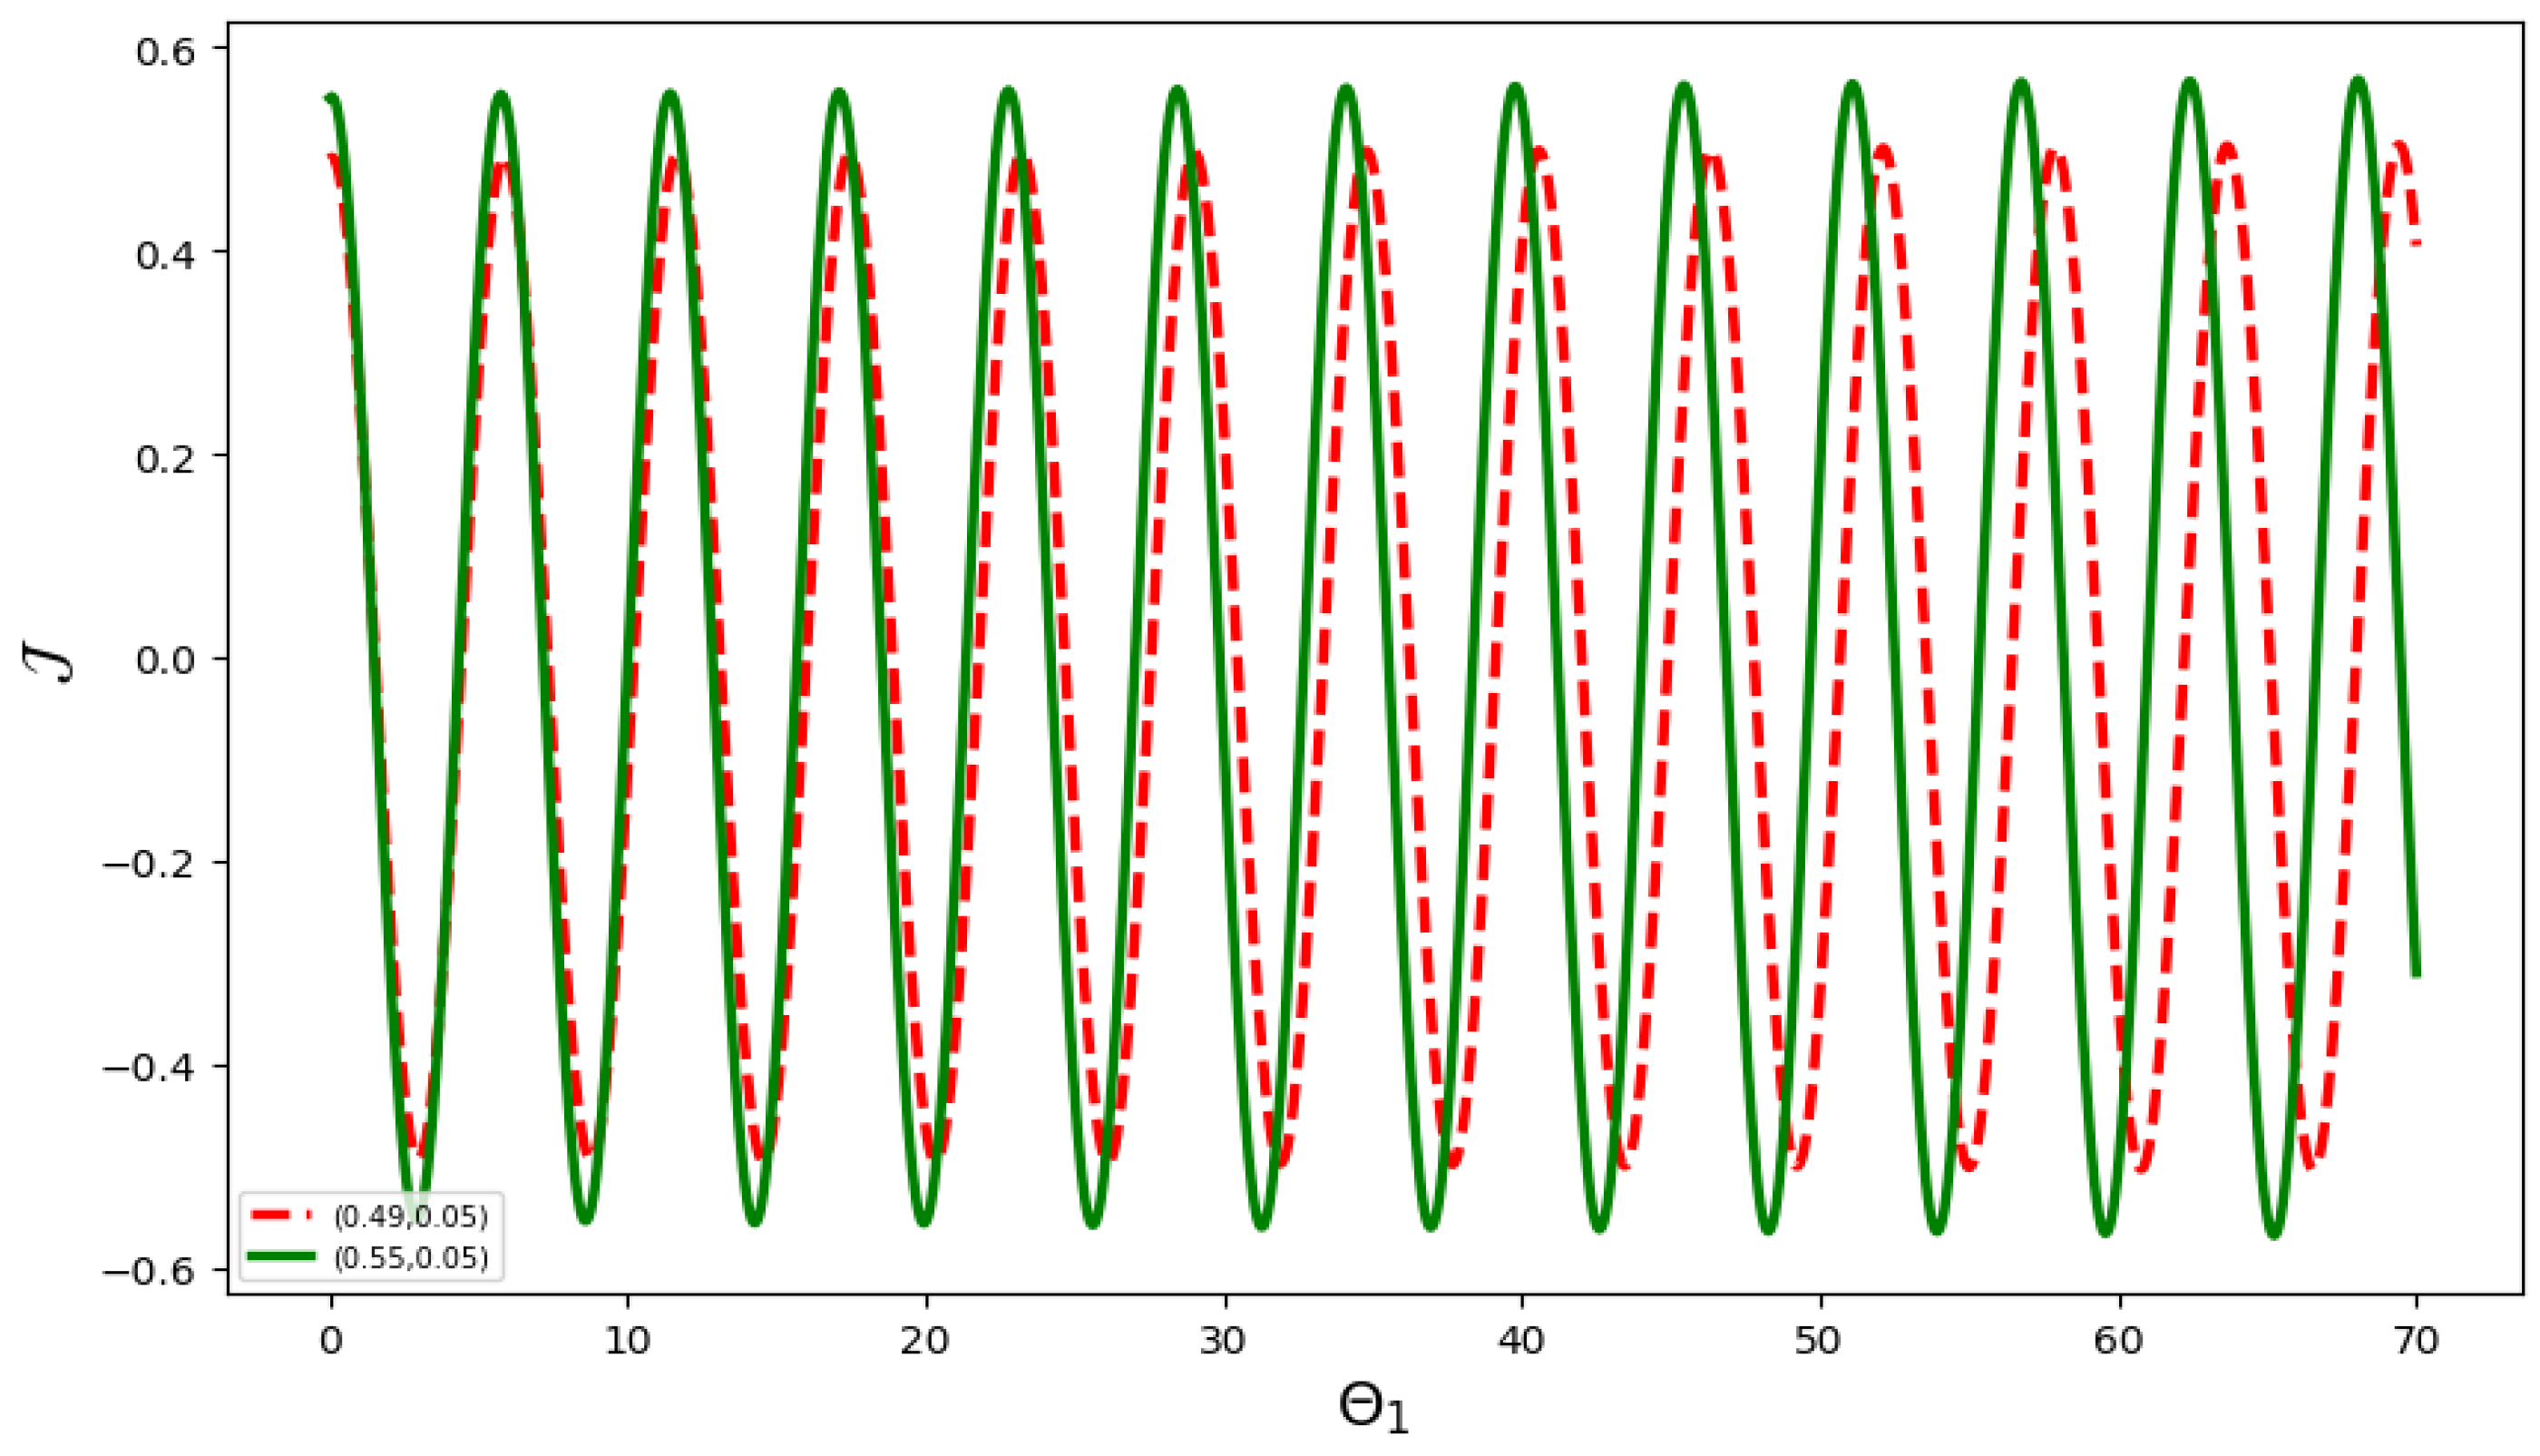
This section examines the model’s sensitivity to initial conditions, a crucial method for detecting chaos. Sensitivity analysis evaluates how changes in model parameters influence outcomes, shedding light on how physical properties affect system behavior [28]. We analyzed the model using various initial conditions, with consistent values of G 1 = 0.78 and G 2 = 0.89 :
  • The initial condition ( Θ 1 , J ) = ( 0.15 , 0.05 ) is represented by the red curve, and ( Θ 1 , J ) = ( 0.55 , 0.05 ) by the green curve in Figure 12.
  • The initial condition ( Θ 1 , J ) = ( 0.25 , 0.05 ) is represented by the red curve, and ( Θ 1 , J ) = ( 0.55 , 0.05 ) by the green curve in Figure 13.
  • The initial condition ( Θ 1 , J ) = ( 0.49 , 0.05 ) is represented by the red curve, and ( Θ 1 , J ) = ( 0.55 , 0.05 ) by the green curve in Figure 14.
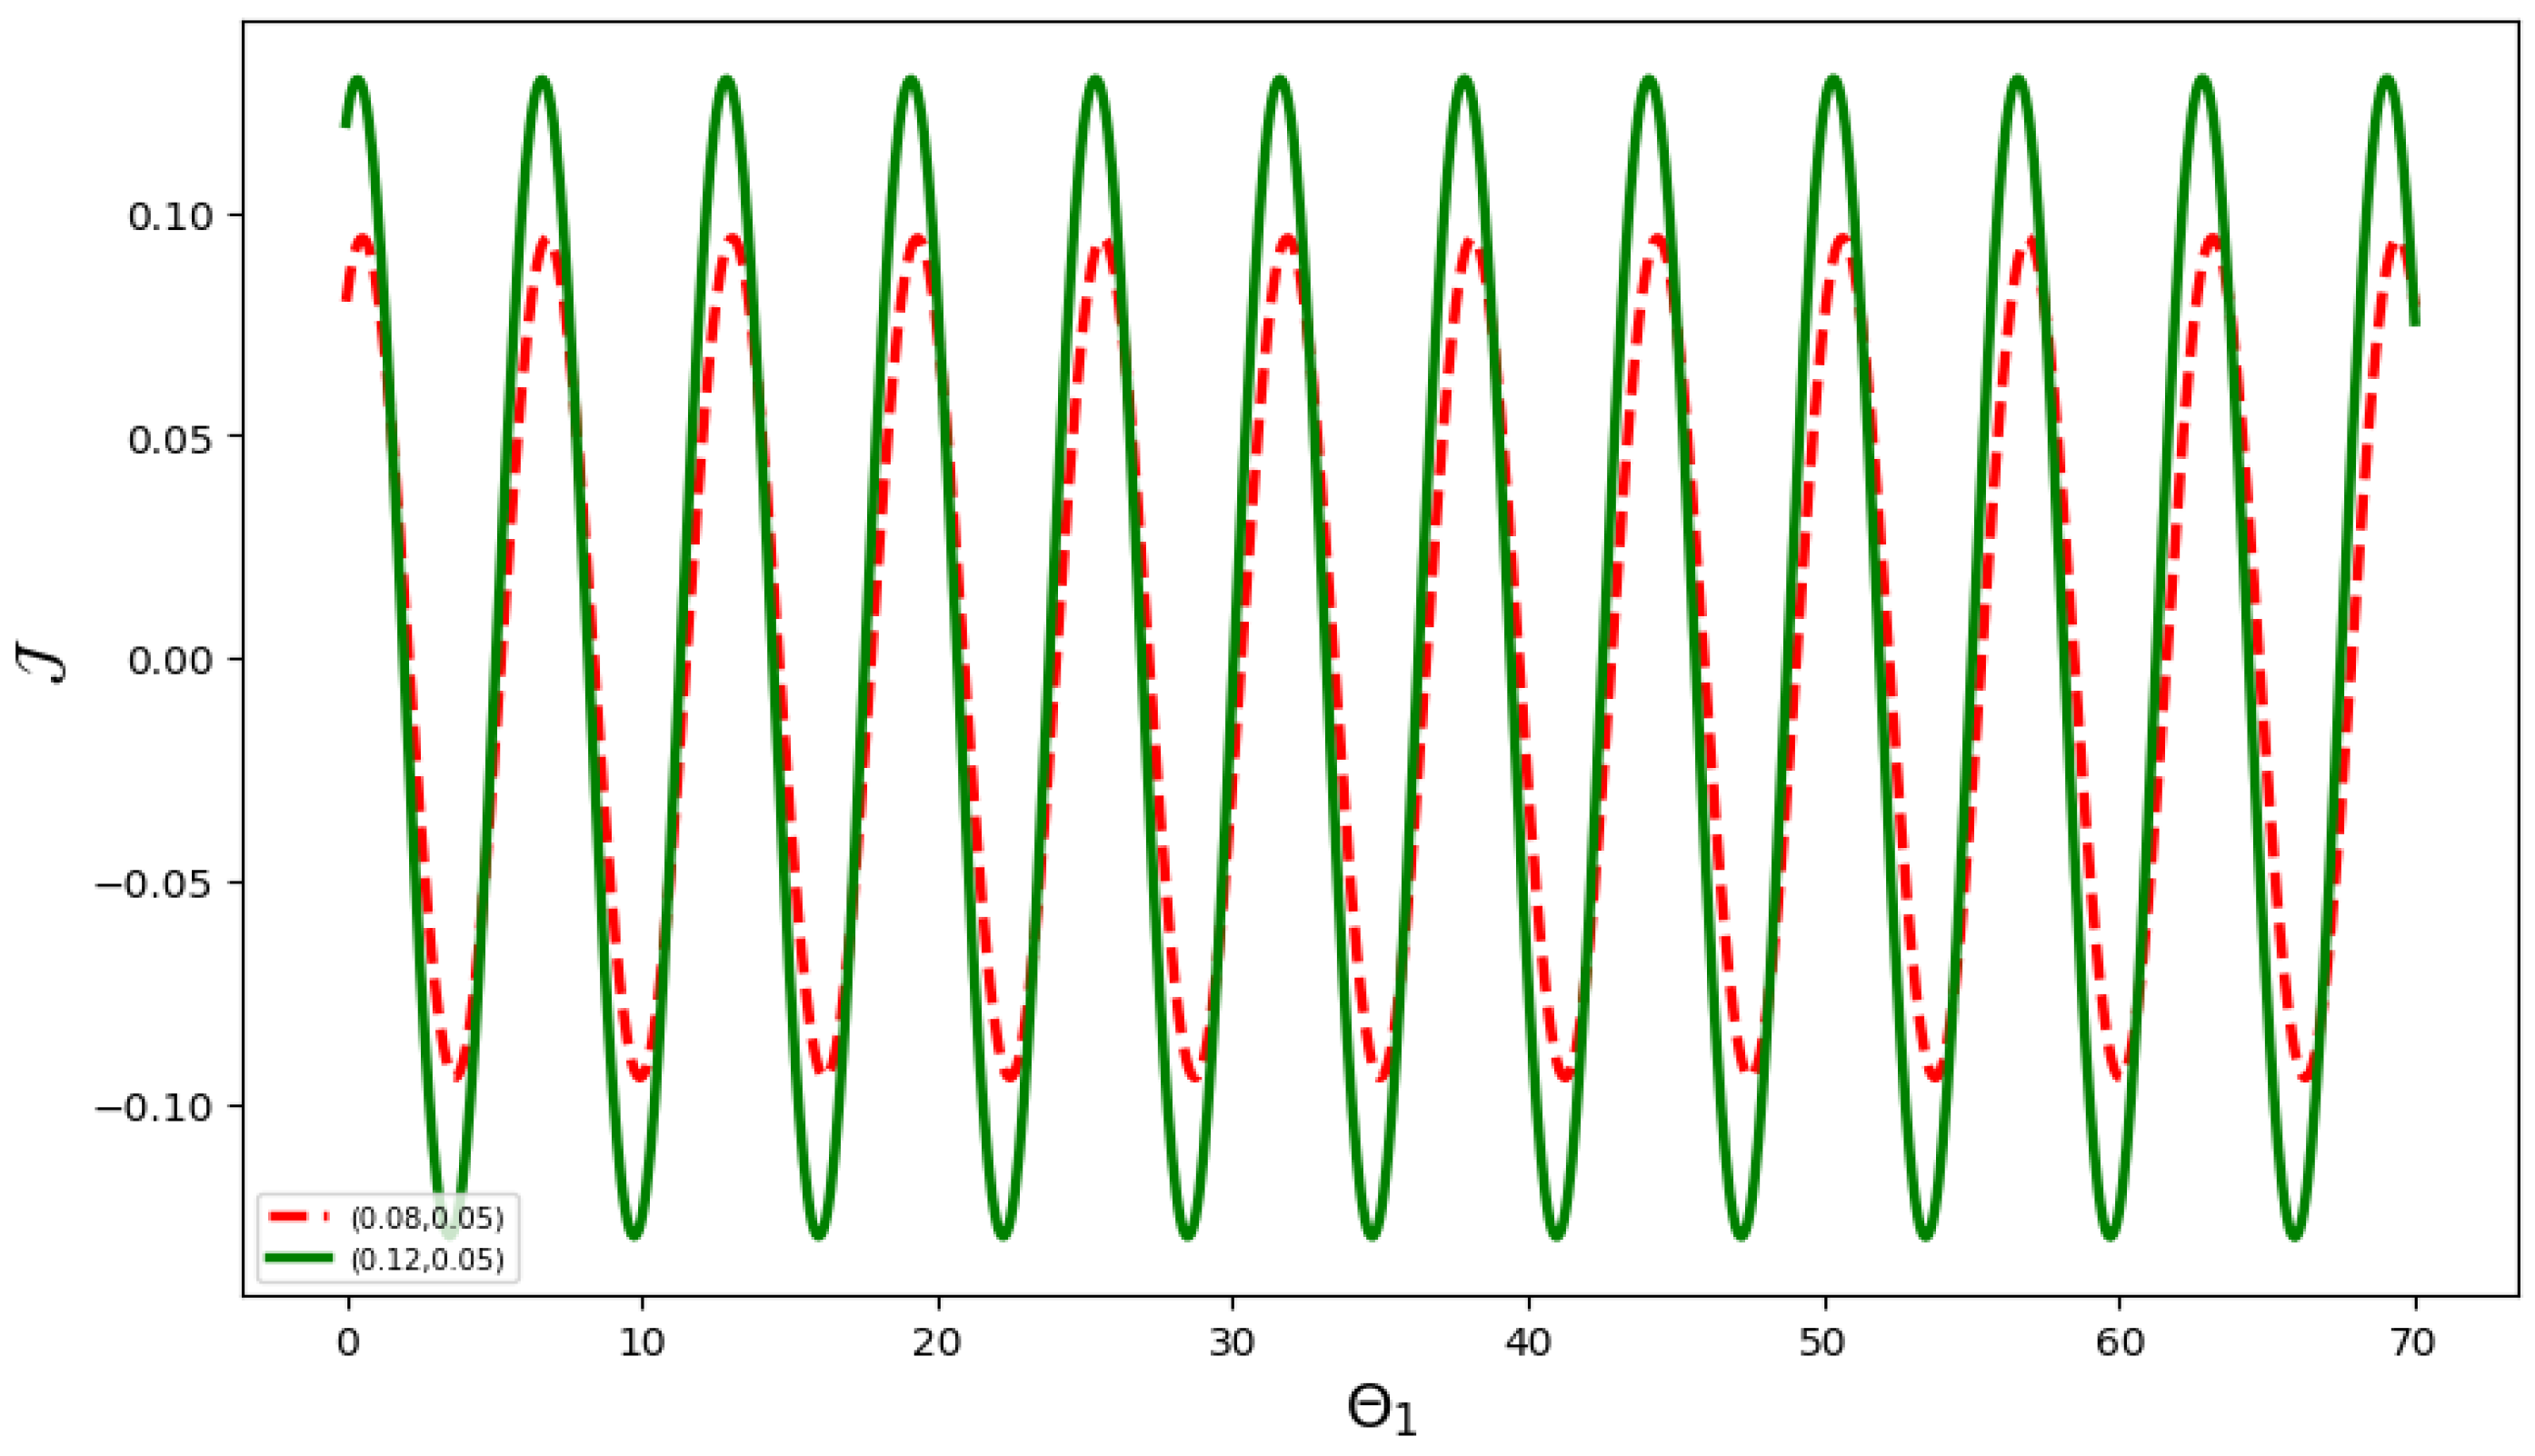
  • The initial condition ( Θ 1 , J ) = ( 0.08 , 0.05 ) is represented by the red curve, and ( Θ 1 , J ) = ( 0.12 , 0.05 ) by the green curve in Figure 15.
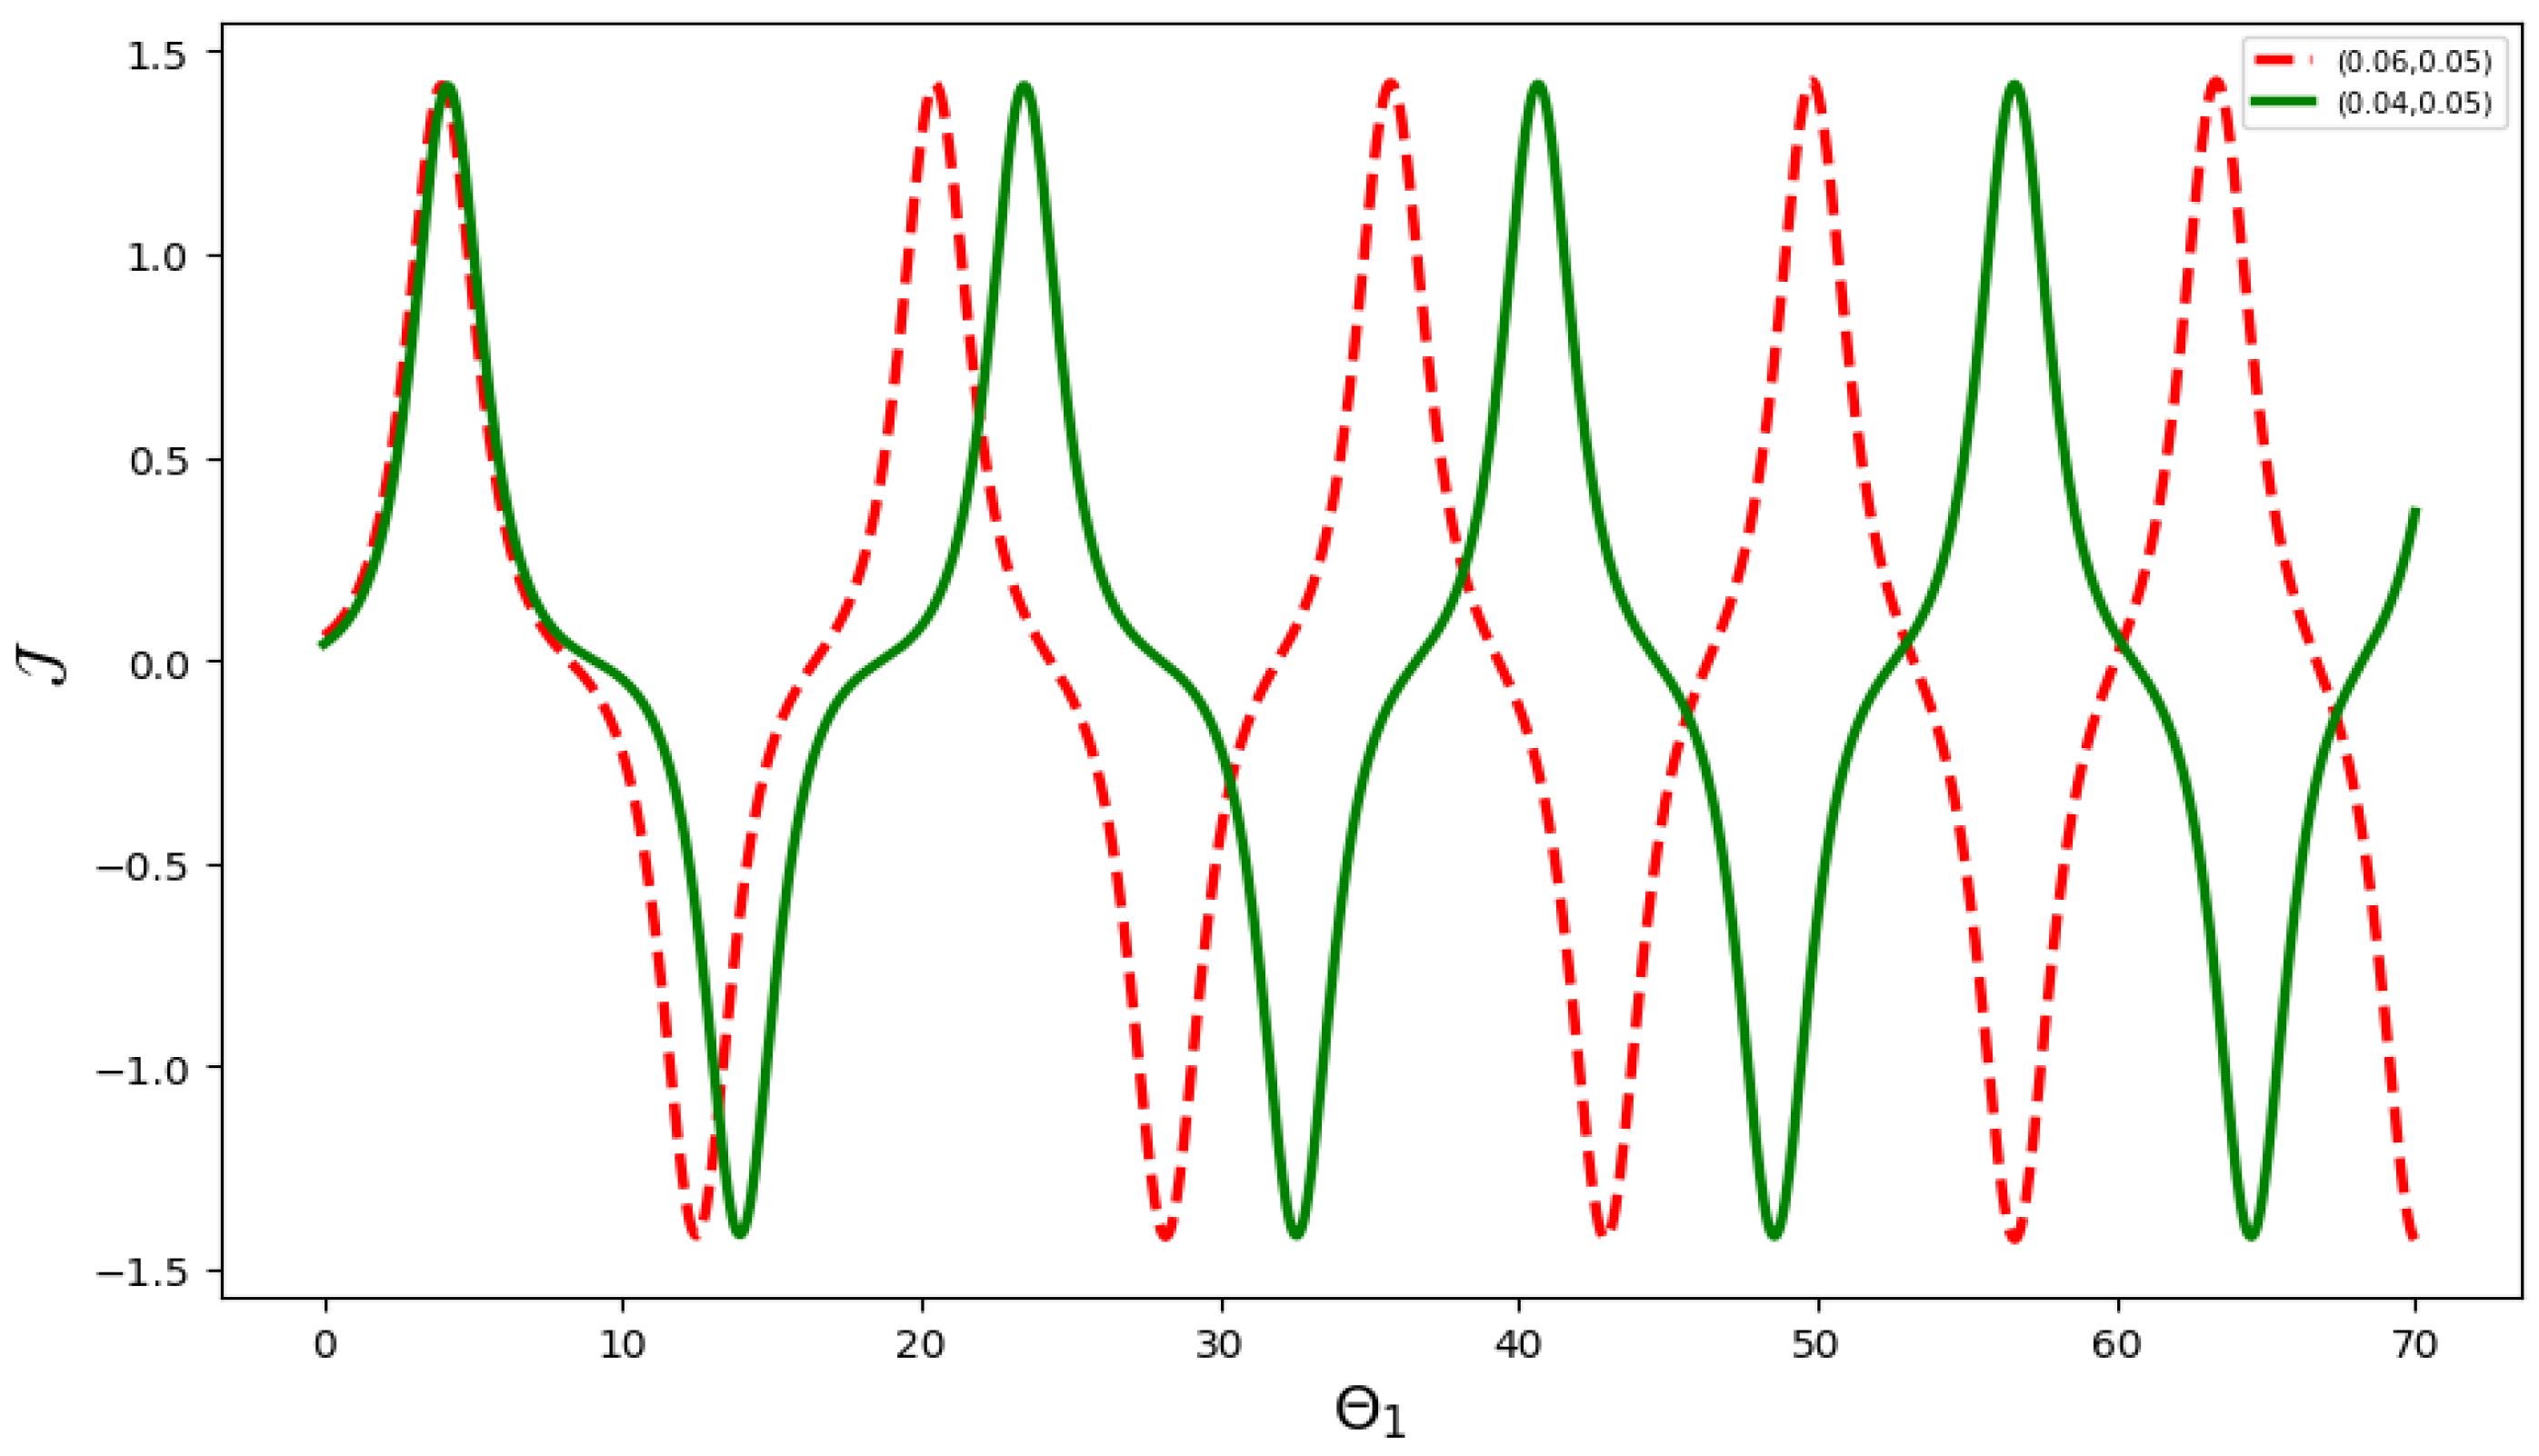
  • The initial condition ( Θ 1 , J ) = ( 0.06 , 0.05 ) is represented by the red curve, and ( Θ 1 , J ) = ( 0.054 , 0.05 ) by the green curve in Figure 16.
Despite the varying initial conditions, the system demonstrates only minor sensitivity while maintaining the same G 1 and G 2 values. Across all cases, we observe trajectories characterized by super nonlinear periodic and nonlinear periodic waves. Figure 12, Figure 13, Figure 14 and Figure 15 depict the super nonlinear periodic waves, while Figure 16 illustrates additional examples of these waves.

7. Solitary Wave Solutions for Equation (4)

Assuming E 1 = D 1 ( F 1 ) = 0 and E 2 = D 1 ( F 2 ) = D 1 ( F 3 ) = G 1 2 4 G 2 , we derive the solitary wave solutions of Equation (4) using the planar dynamical system theory.
  • Family 1:  G 1 > 0 , G 2 > 0 , and 0 < E < G 1 2 4 G 2 . Under these conditions, System (19) can be expressed as
    J 2 = G 2 2 ( Θ 1 4 2 G 1 G 2 Θ 1 2 + 2 E G 2 ) = G 1 2 ( Π 1 p 2 Θ 2 ) ( Π 2 p 2 Θ 2 ) ,
    where
    Π 1 p 2 = G 1 + G 1 2 4 G 2 E G 2 , and Π 2 p 2 = G 1 G 1 2 4 G 2 E G 2 .
    By substituting (39) into d Θ 1 d Ξ = J and performing the integration, the solutions of Equation (4) are expressed in terms of the Jacobian functions:
    A 1 ( α , τ ) = Π 1 p sn Π 2 p G 2 2 ( Ξ ) , Π 2 p Π 1 p e γ χ ( α , τ ) , Q 1 ( α , τ ) = ( ρ 2 + 2 ϱ Δ 1 Π 1 p 2 sn 2 Π 2 p G 2 2 ( Ξ ) , Π 2 p Π 1 p e γ χ ( α , τ ) , P 1 ( α , τ ) = ( ρ 2 + 2 ϱ Δ 1 Π 1 p 2 sn 2 Π 2 p G 2 2 ( Ξ ) , Π 2 p Π 1 p ) , σ 1 ( α , τ ) = 4 ρ 1 + m 0 ( r 2 + ϱ ( 1 + 2 K ) ) ( Δ 1 + Δ 2 ) Π 1 p 2 sn 2 Π 2 p G 2 2 ( Ξ ) , Π 2 p Π 1 p 4 m 0 .
  • Family 2: When G 1 > 0 , G 2 > 0 , and E = G 1 2 4 G 2 , the solitary wave of Equation (4) can be obtained when Π 1 p 2 = Π 1 p 2 = G 1 G 2 :
    A 2 ( α , τ ) = G 1 G 2 tanh G 2 2 Ξ e γ χ ( α , τ ) , Q 2 ( α , τ ) = ρ 2 + 2 ϱ Δ 1 G 1 G 2 tanh 2 G 2 2 Ξ e γ χ ( α , τ ) , P 2 ( α , τ ) = ρ 2 + 2 ϱ Δ 1 G 1 G 2 tanh 2 G 2 2 Ξ , σ 2 ( α , τ ) = 4 ρ 1 + m 0 ( r 2 + ϱ ( 1 + 2 K ) ) ( Δ 1 + Δ 2 ) G 1 G 2 tanh 2 G 2 2 Ξ 4 m 0 .
  • Family 3: When G 1 < 0 , G 3 < 0 , and G 1 2 4 G 2 < E < 0 , System (19) can be reformulated as
    J 2 = G 2 2 ( Θ 1 4 + 2 G 1 G 2 Θ 1 2 2 E G 2 ) = G 2 2 ( Θ 2 Π 3 p 2 ) ( Π 4 p 2 Θ 2 ) ,
    where
    Π 3 p 2 = G 1 G 1 2 4 G 2 E G 2 , and Π 4 p 2 = G 1 + G 1 2 4 G 2 E G 2 .
    By substituting (39) into d Θ 1 d Ξ = J and performing the integration, the solutions of Equation (4) are expressed in terms of the Jacobian functions:
    A 3 ( α , τ ) = Π 3 p dn Π 3 p G 2 2 Ξ , Π 4 p 2 Π 3 p 2 Π 4 p e γ χ ( α , τ ) , Q 3 ( α , τ ) = ρ 2 2 ϱ Δ 1 Π 3 p 2 dn 2 Π 3 p G 2 2 Ξ , Π 4 p 2 Π 3 p 2 Π 4 p e γ χ ( α , τ ) , P 3 ( α , τ ) = ρ 2 2 ϱ Δ 1 Π 3 p 2 dn 2 Π 3 p G 2 2 Ξ , Π 4 p 2 Π 3 p 2 Π 4 p , σ 4 ( α , τ ) = 4 ρ 1 + m 0 ( r 2 + ϱ ( 1 + 2 K ) ) ( Δ 1 + Δ 2 ) Π 3 p 2 dn 2 Π 3 p G 2 2 Ξ , Π 4 p 2 Π 3 p 2 Π 4 p 4 m 0 .
  • Family 4: When G 1 < 0 , G 2 < 0 , and E = 0 , the solitary wave of Equation (4) can be obtained if Π 3 p 2 = 0 and Π 4 p 2 = 2 G 1 G 2 :
    A 4 ( α , τ ) = 2 G 1 G 2 sech G 1 Ξ e γ χ ( α , τ ) , Q 4 ( α , τ ) = ρ 2 + 4 ϱ Δ 1 G 1 G 2 sech 2 G 1 Ξ e γ χ ( α , τ ) , P 4 ( α , τ ) = ρ 2 + 4 ϱ Δ 1 G 1 G 2 sech 2 G 1 Ξ , σ 4 ( α , τ ) = 4 ρ 1 + m 0 ( r 2 + ϱ ( 1 + 2 K ) ) ( Δ 1 + Δ 2 ) 2 G 1 G 2 sech 2 G 1 Ξ 4 m 0 .
  • Family 5: When G 1 < 0 , G 2 < 0 , and E > 0 , System (19) can be reformulated as
    J 2 = G 2 2 ( Θ 1 4 + 2 G 1 G 2 Θ 1 2 4 E G 2 ) = G 2 2 ( Π 5 p 2 + Θ 2 ) ( Π 6 p 2 Θ 2 ) ,
    where
    Π 5 p 2 = G 1 + G 1 2 4 G 2 E G 2 , and Π 6 p 2 = G 1 G 1 2 4 G 2 E G 2 .
    By substituting (39) into d Θ 1 d Ξ = J and performing the integration, the solutions of Equation (4) are expressed in terms of the Jacobian functions:
    A 5 ( α , τ ) = Π 6 p cn Π 3 p G 2 ( Π 5 p 2 + Π 6 p 2 ) 2 Ξ , Π 6 p Π 5 p 2 + Π 6 p 2 e γ χ ( α , τ ) , Q 5 ( α , τ ) = ρ 2 2 ϱ Δ 1 Π 6 p 2 cn 2 Π 3 p G 2 ( Π 5 p 2 + Π 6 p 2 ) 2 Ξ , Π 6 p Π 5 p 2 + Π 6 p 2 e γ χ ( α , τ ) , P 5 ( α , τ ) = ρ 2 2 ϱ Δ 1 Π 6 p 2 cn 2 Π 3 p G 2 ( Π 5 p 2 + Π 6 p 2 ) 2 Ξ , Π 6 p Π 5 p 2 + Π 6 p 2 , σ 5 ( α , τ ) = 4 ρ 1 + m 0 ( r 2 + ϱ ( 1 + 2 K ) ) ( Δ 1 + Δ 2 ) Π 6 p 2 cn 2 Π 3 p G 2 ( Π 5 p 2 + Π 6 p 2 ) 2 Ξ , Π 6 p Π 5 p 2 + Π 6 p 2 4 m 0 .

8. Graphical Interpretation

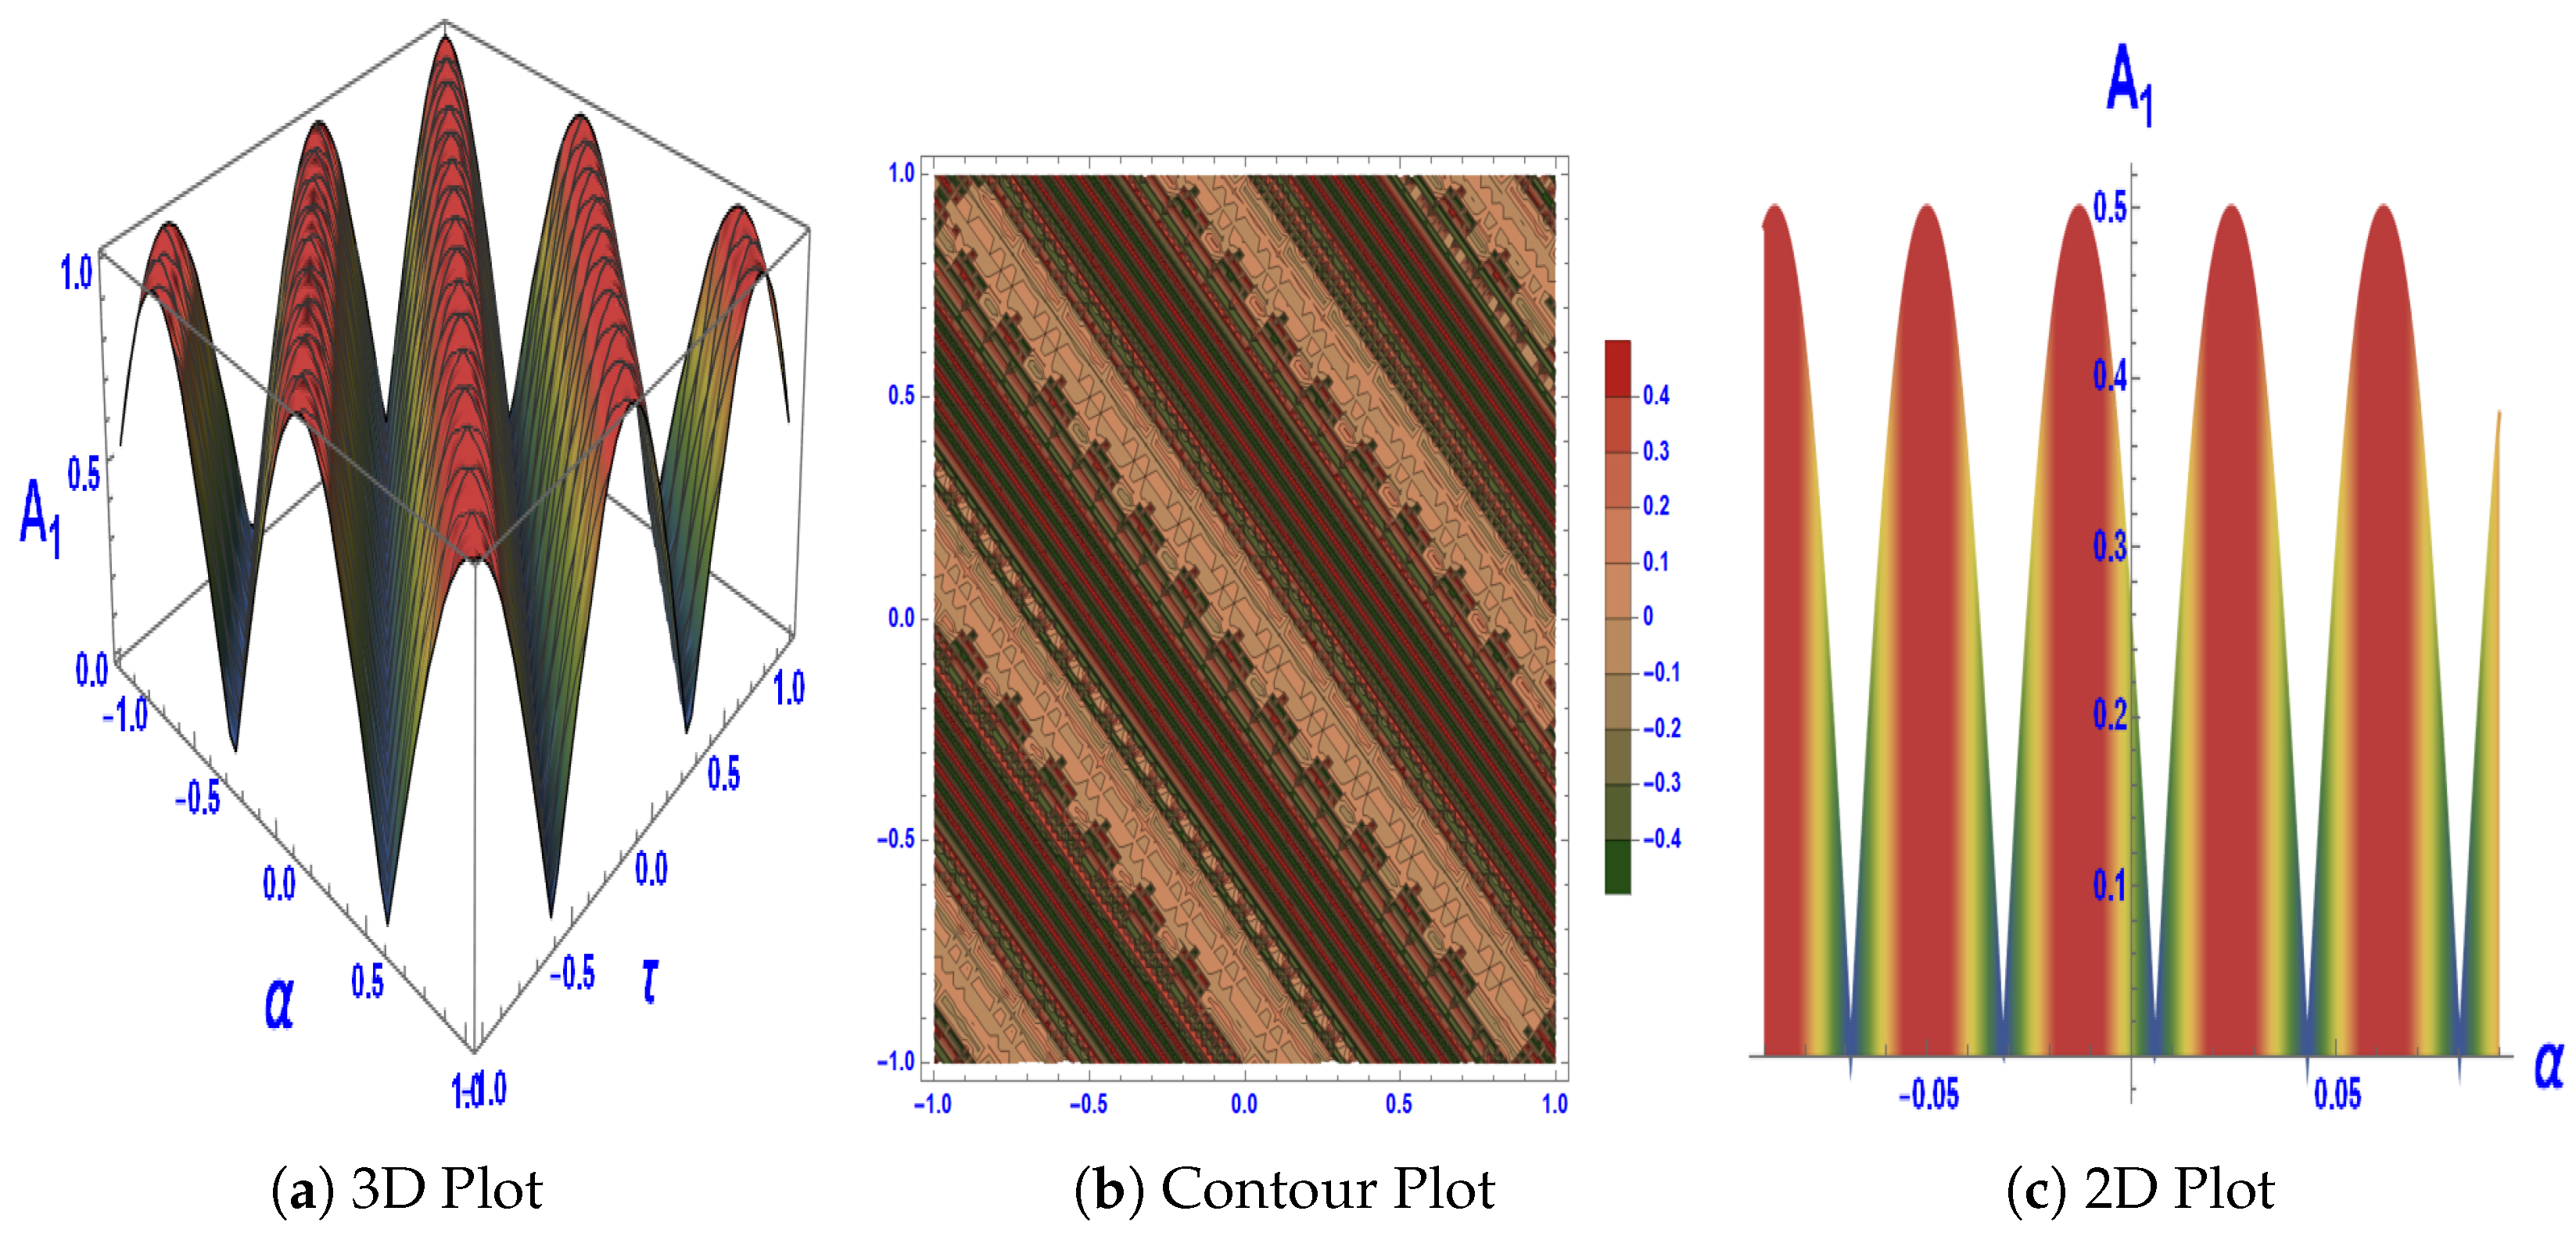
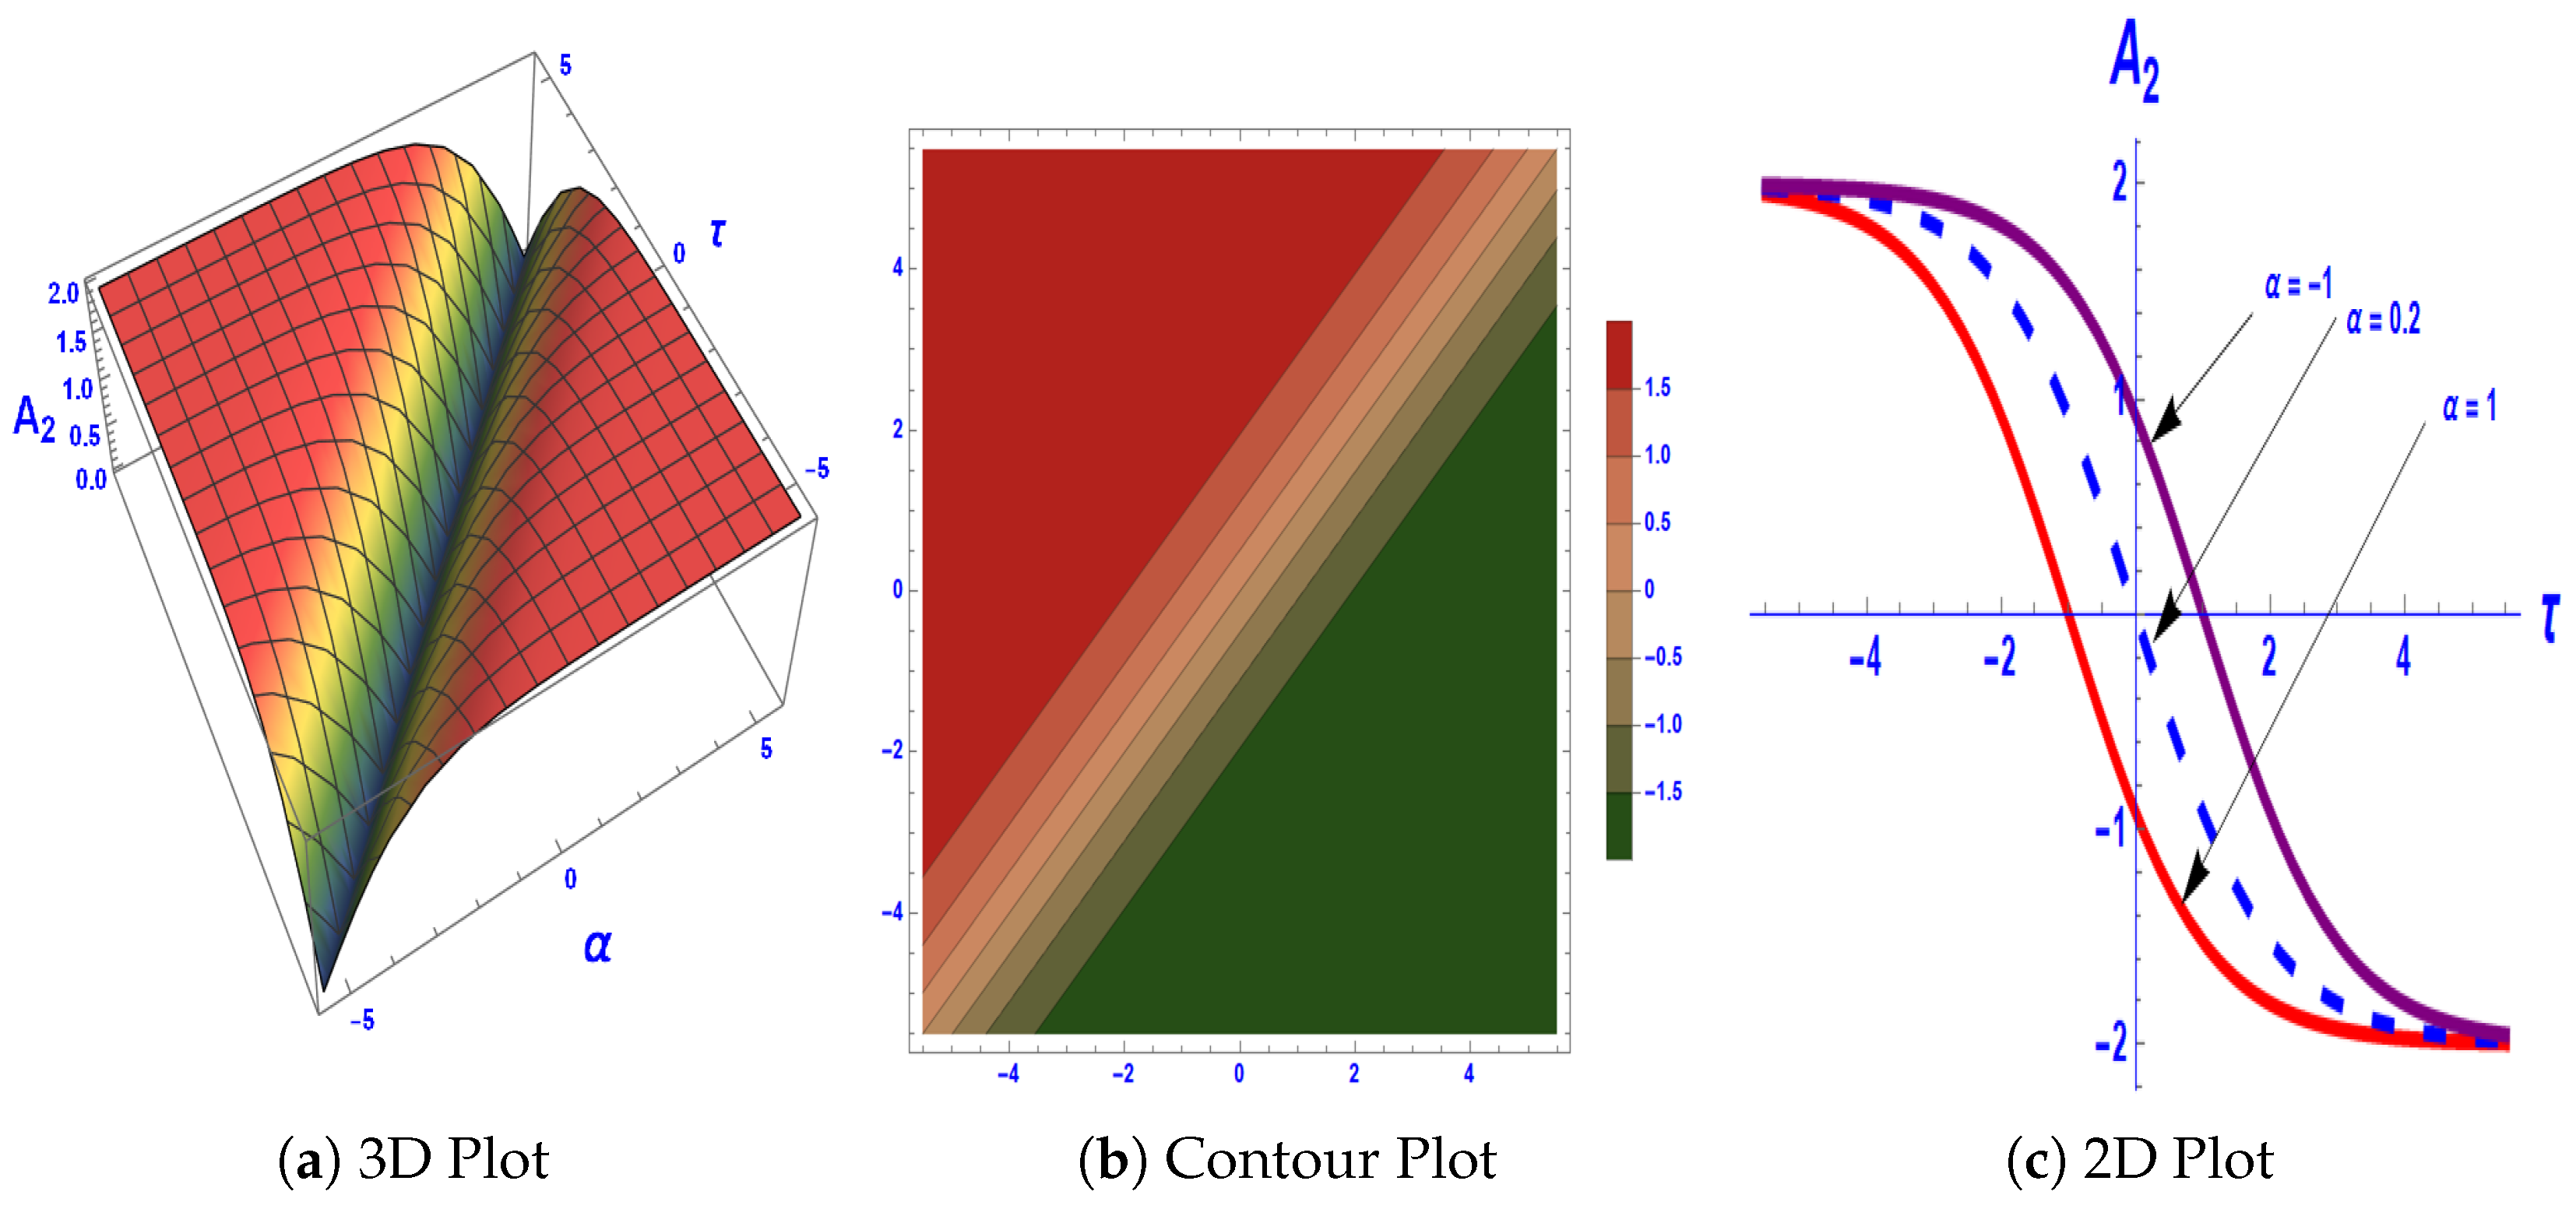
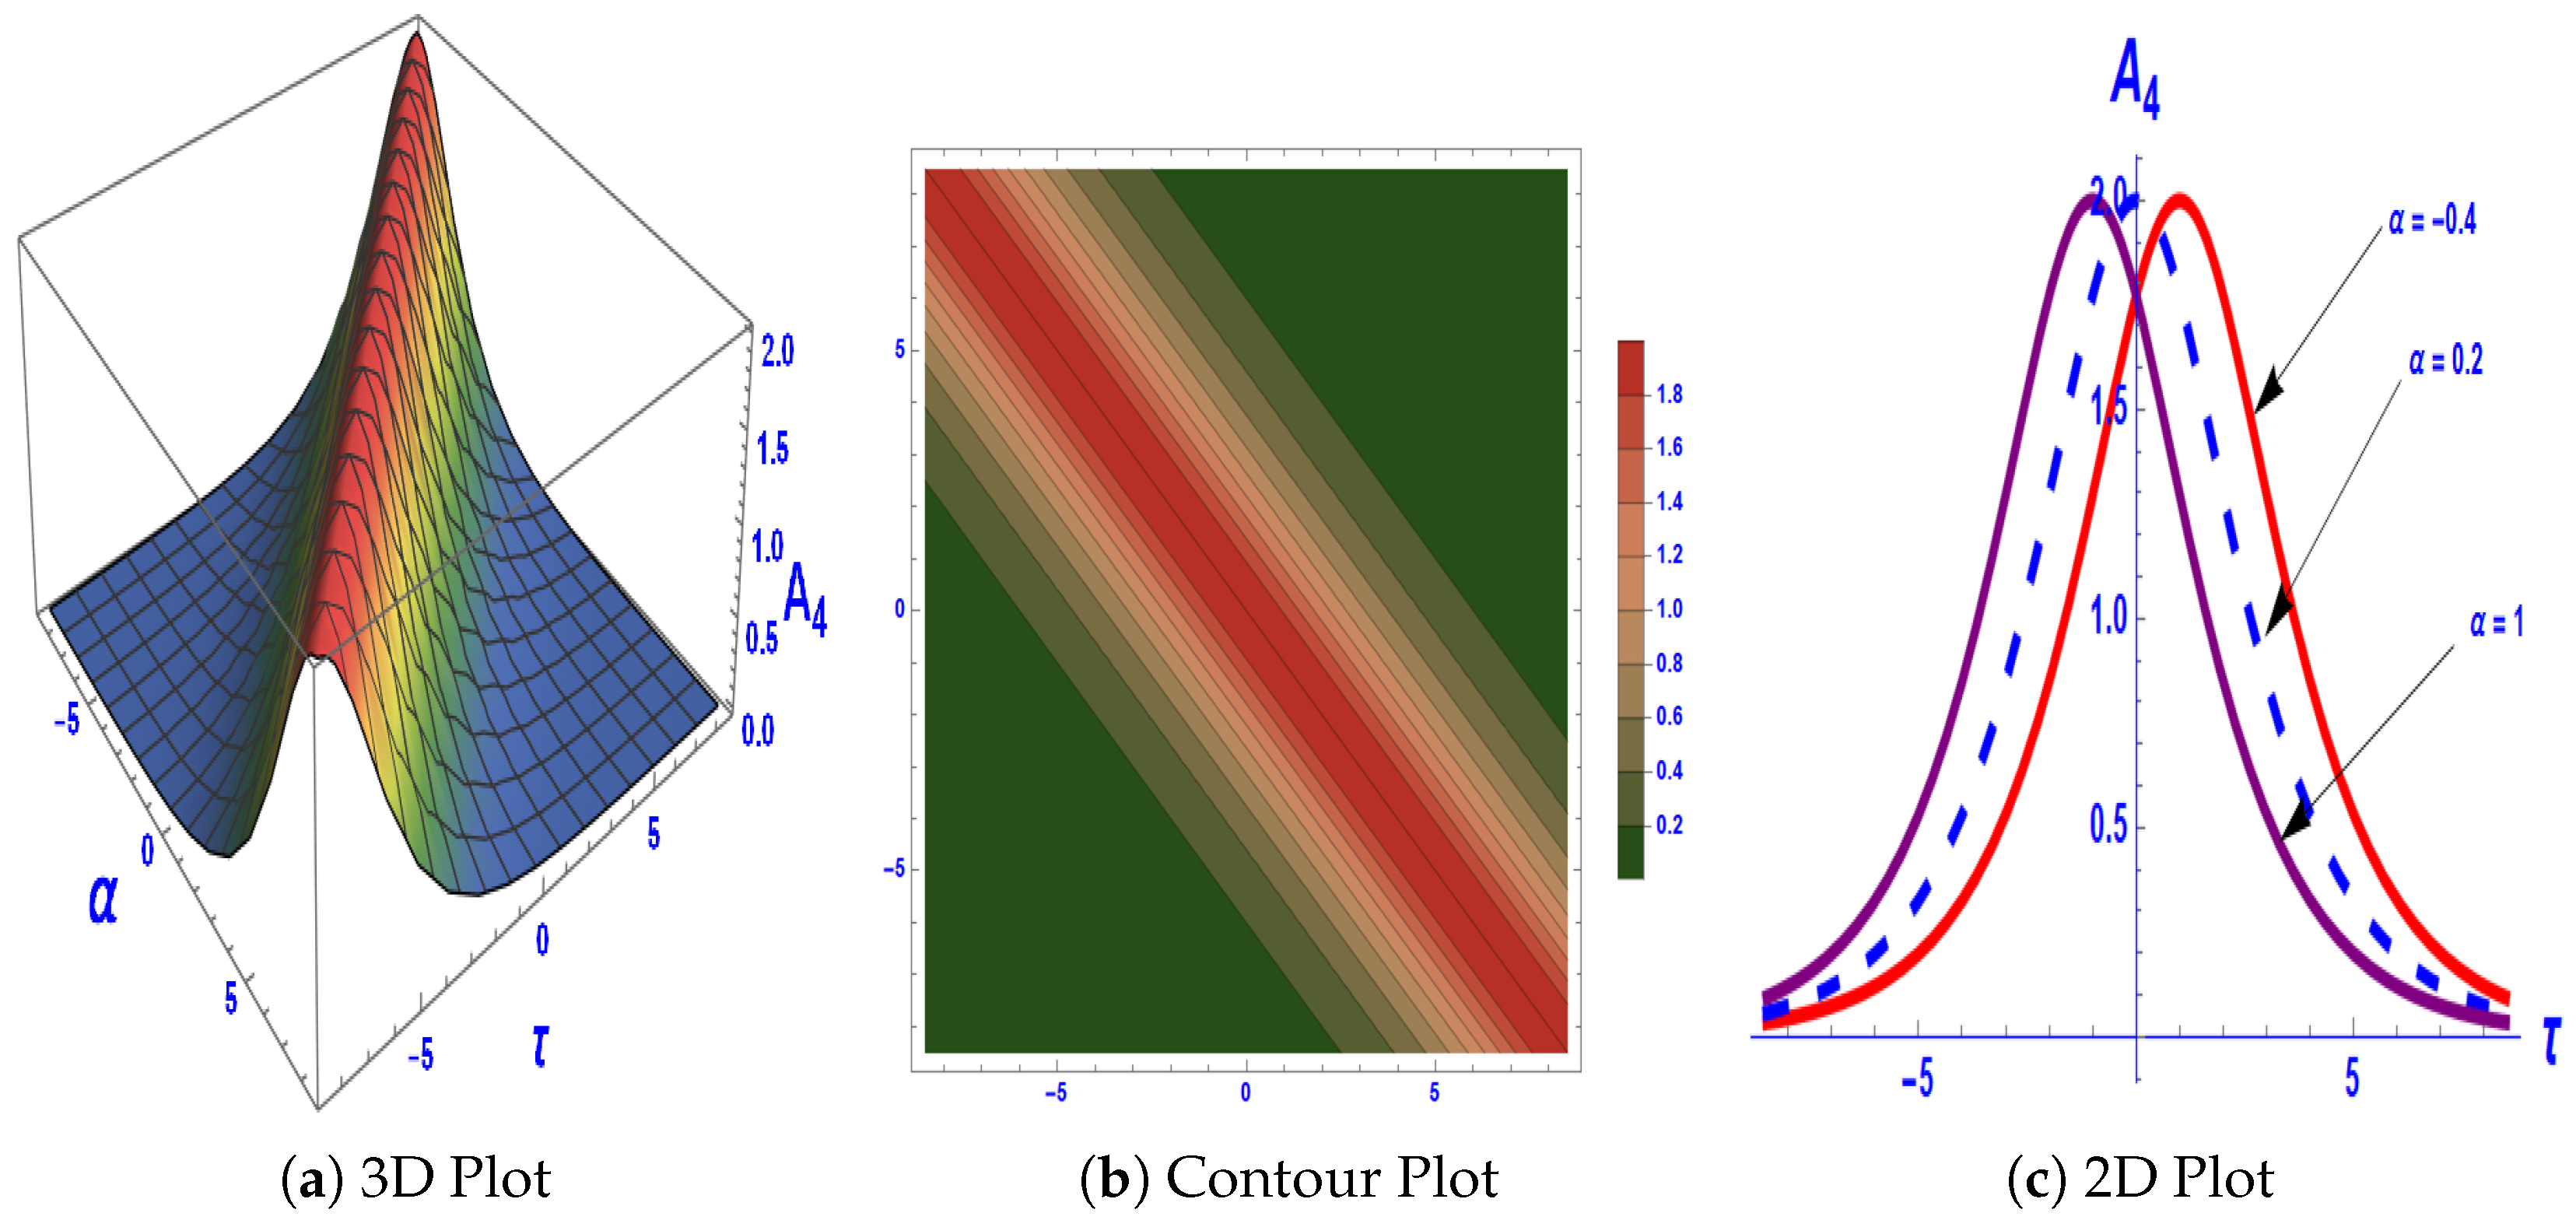
In this section, we present the modular length of the solutions A 1 ( α , τ ) , A 2 ( α , τ ) , and A 4 ( α , τ ) using 3D graphs, 2D graphs, and contour plots, as illustrated in Figure 17, Figure 18, Figure 19 and Figure 20 respectively. In Figure 17, the solution A 1 ( α , τ ) , expressed as a Jacobian function, exhibits periodic soliton behavior, emphasizing its modular length with the parameters γ = 2.2 , G 2 = 144 , r 1 = 0.75 , r 2 = 0.86 , Π 2 = 4 , Π 1 = 2 , ρ = 1 , and m 0 = 3 , over the domain α , τ [ 1.2 , 1.2 ] . Periodic soliton behavior is integral to the stable propagation of waves in nonlinear systems, encompassing applications in fiber optics, plasma physics, and fluid dynamics. It facilitates effective energy transmission and communication across diverse technological platforms.
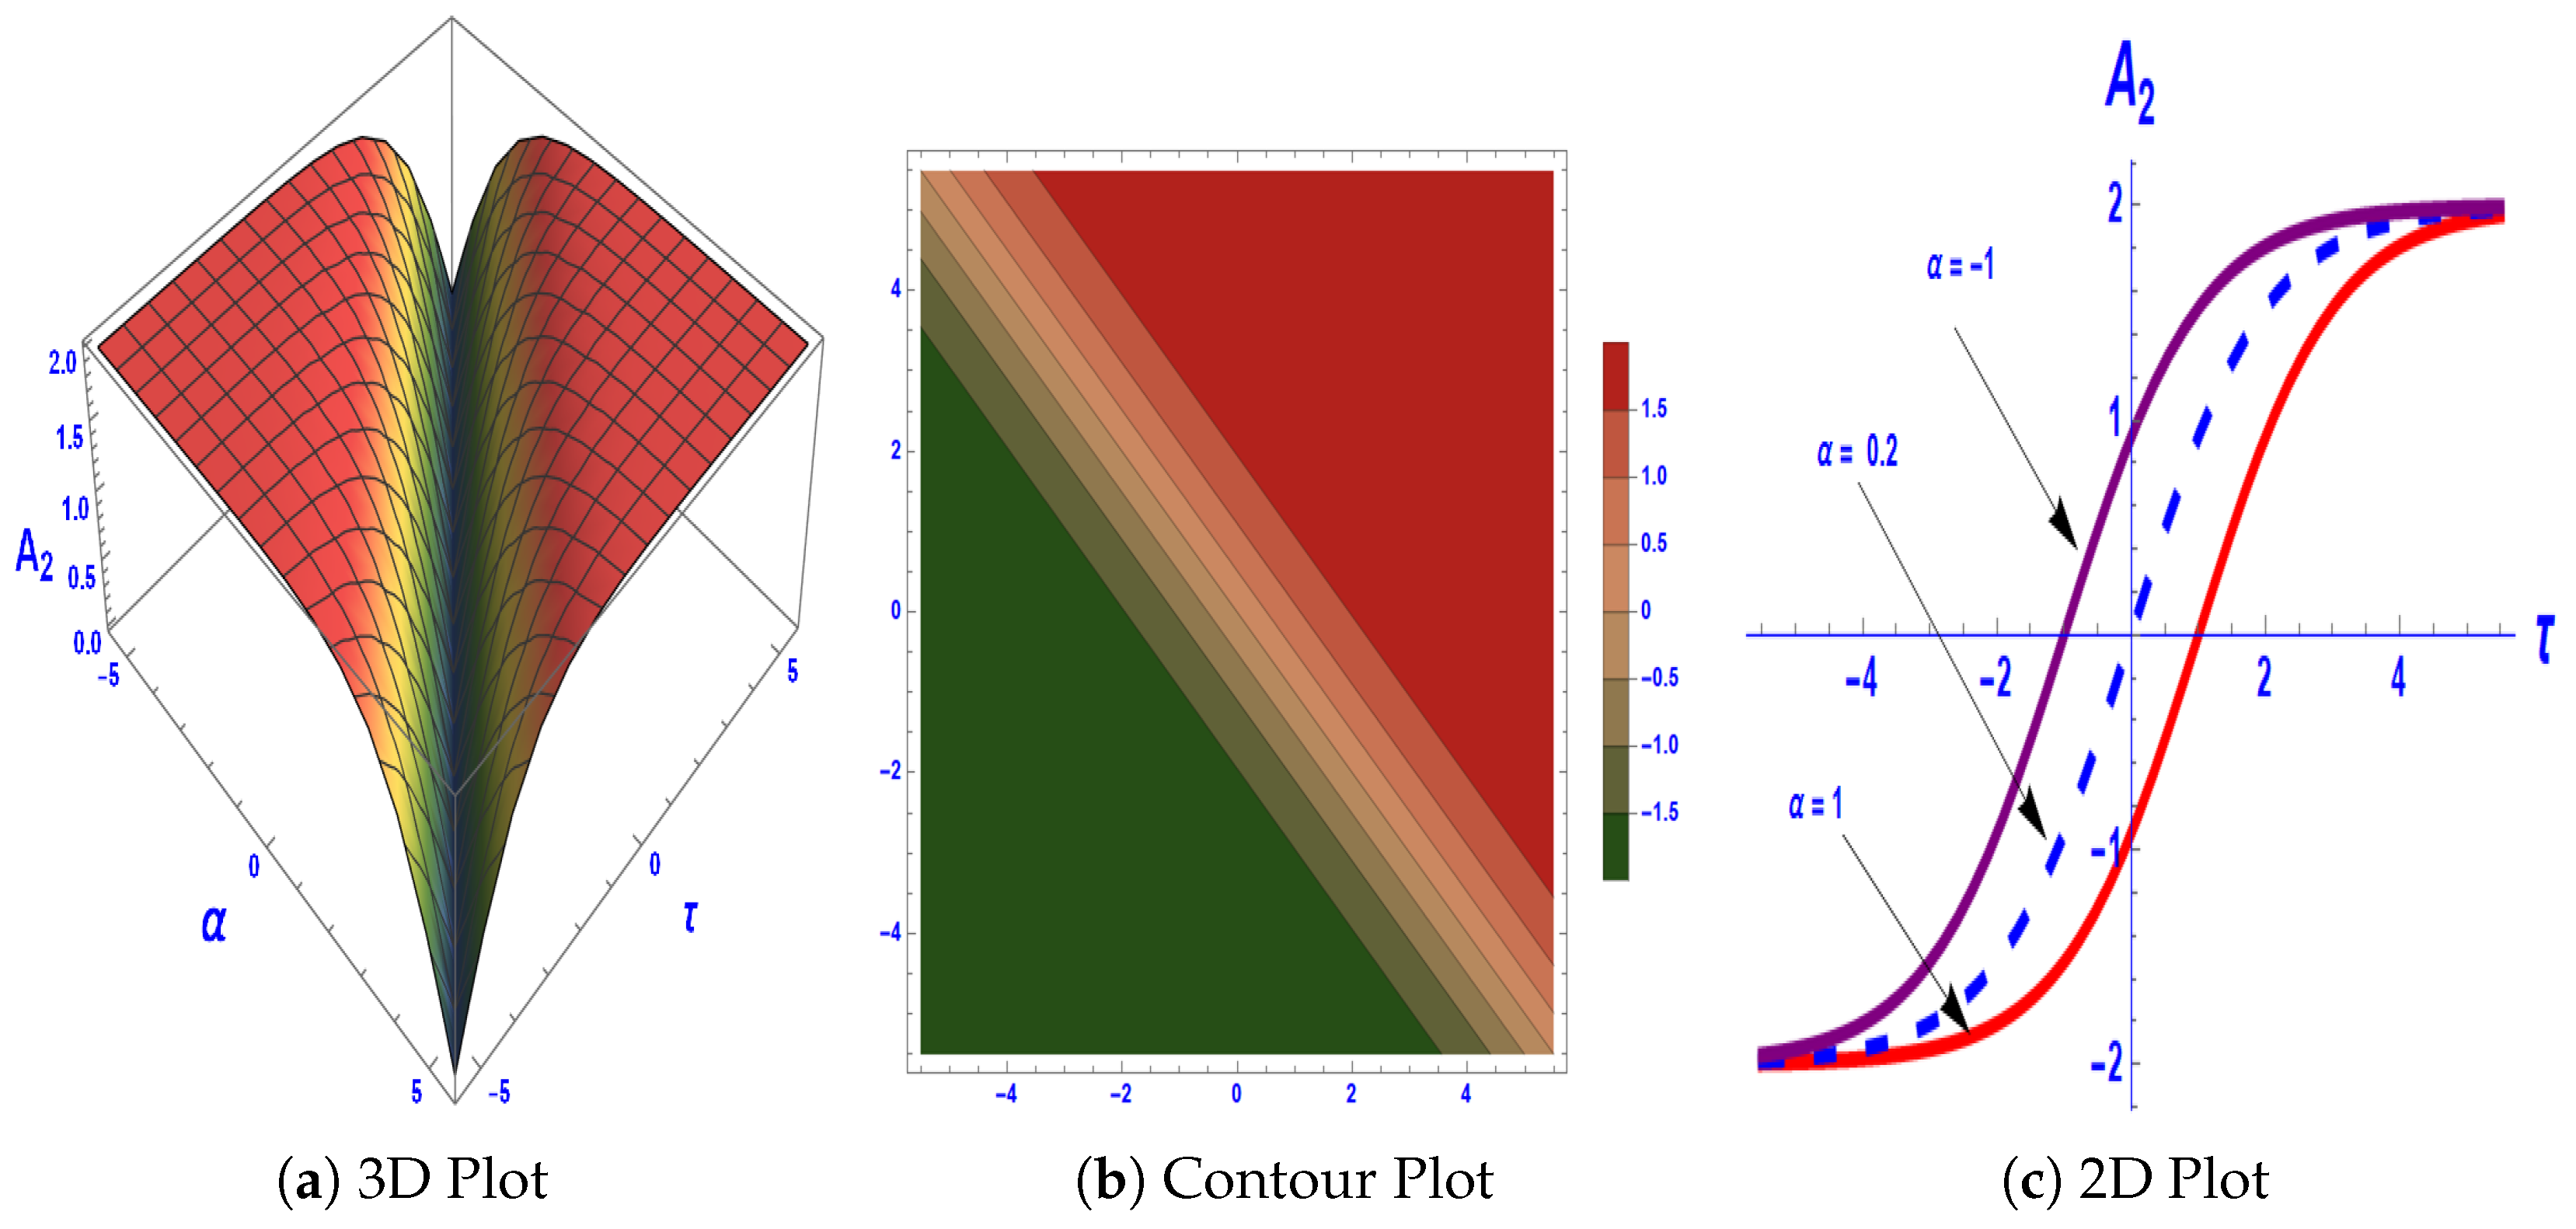
In Figure 18, the solution A 2 ( α , τ ) , represented by a trigonometric function, displays a right dark soliton behavior with parameters ρ = 0.65 , γ = 0.67 , G 1 = 4.33 , G 2 = 1.23 , Π 2 = 4 , r 1 = 0.75 , r 2 = 0.86 , Π 1 = 2 , and m 0 = 0.5 , over the domain α , τ [ 5.5 , 5.5 ] . For the 2D plot, we analyze the behavior by varying α while keeping the same domain and parameters. In Figure 19, the solution A 2 ( α , τ ) , also represented by a trigonometric function, exhibits left dark soliton behavior with parameters ρ = 0.65 , γ = 0.67 , G 1 = 4.33 , G 2 = 1.23 , Π 2 = 4 , r 1 = 0.75 , r 2 = 0.86 , Π 1 = 2 , and m 0 = 0.5 , over the domain α , τ [ 5.5 , 5.5 ] . Similarly, the 2D plot investigates behavior by varying α under identical conditions. Dark soliton behavior is pivotal in the realm of nonlinear wave dynamics, providing valuable insights into wave propagation across various physical systems. Its relevance extends to domains such as optics, plasma physics, and fluid dynamics, where it contributes to the comprehension of pulse shaping, stability, and energy transmission.
In Figure 20, the solution A 4 ( α , τ ) , modeled as a hyperbolic function, demonstrates bright soliton behavior with the parameters γ = 0.67 , G 1 = 4.23 , G 2 = 1.03 , Π 2 = 4 , r 1 = 0.75 , r 2 = 0.86 , Π 1 = 2 , ρ = 0.65 , and m 0 = 1.5 , across the domain α , τ [ 8.5 , 8.5 ] . For the 2D plot, the behavior is analyzed for various values of α within the same domain and parameter set. Bright soliton behavior is critical for elucidating the stability and propagation of localized waves within nonlinear media, including fiber optics and plasma physics. Its applications are broad, influencing communication systems by enhancing the development of efficient signal transmission and information processing methodologies.

9. Conclusions

In the present study, we examine the dynamic properties and solitary wave solutions of the Zhanbota-IIA equation, which is of paramount importance in the field of nonlinear optics. Through the manipulation of parameters E , G 1 , and G 2 , we reformulate the Zhanbota-IIA equation into a two-dimensional planar dynamical system and employ computational software to generate the corresponding phase portraits of the system. The phase portrait allows for a clear visualization of the orbital characteristics inherent to the dynamical system as shown in Figure 1. The energy levels are discussed using the Hamiltonian function, as shown in Figure 2. Moreover, we incorporate a periodic disturbance term into the system, thereby producing two-dimensional phase diagrams, three-dimensional phase portraits, sensitivity analysis diagrams, bifurcation diagrams, and Lyapunov exponent diagrams as shown in Figure 3, Figure 4, Figure 5, Figure 6, Figure 7, Figure 8, Figure 9, Figure 10, Figure 11, Figure 12, Figure 13, Figure 14, Figure 15 and Figure 16. These dynamic analyses facilitate a comprehensive exploration of the behavior exhibited by the disturbed system. Furthermore, by integrating Jacobian functions with the methodology of planar dynamical systems, we derive the solitary wave solution of the Zhanbota-IIA equation and present its representations in three-dimensional, two-dimensional, and contour plots as shown in Figure 17, Figure 18, Figure 19 and Figure 20. Through the execution of this research, alongside a comparative analysis with extant literature, we not only ascertain the dynamic characteristics of both the Zhanbota-IIA system and its perturbed equivalent, but also proffer the solitary wave solution. This investigation contributes significant theoretical perspectives regarding the dynamic behavior of the Zhanbota-IIA equation and the transmission of solitary wave solutions within nonlinear optical fibers.
Future Direction: In the future, we can work on conservation laws, lump solutions, breather solutions, and multi-soliton structures of the Zhanbota-IIA equation. We can also explore numerical solutions of the Zhanbota-IIA equation using various schemes such as the finite difference method, the finite element method, spectral methods, the variational iteration method, a domain decomposition method, the homotopy perturbation method, and the homotopy analysis method. On the analytical side, further extensions may involve the inverse scattering transform, the Hirota bilinear method, Darboux transformation, Lie symmetry analysis, and the tanh–coth expansion method. Moreover, this work can be extended by incorporating neural network and machine learning approaches to approximate solutions and predict complex dynamics.

Author Contributions

Conceptualization, M.S. and B.; methodology, M.S. and B.; software, M.S. and B.; validation, M.S. and B.; formal analysis, M.S. and B.; investigation, M.S. and B.; writing—original draft, M.S. and B.; writing—review and editing, M.S., B. and M.D.l.S.; supervision, M.S.; project administration, M.D.l.S.; funding acquisition, M.D.l.S. All authors have read and agreed to the published version of the manuscript.

Funding

This research received support from the Basque Government through Grant IT1555-22 for publication.

Data Availability Statement

The datasets used and/or analyzed during the current study are available from the corresponding author upon reasonable request.

Acknowledgments

Manuel De la Sen is grateful to MICIU/AEI/10.13039/501100011033 and FEDER/UE for partially funding their research work through grants PID202-123543OB-C21 and PID2021-123543OB-C2.

Conflicts of Interest

The authors declare no conflicts of interest.

References

  1. Awan, S.E.; Badshah, F.; Awais, M.; Parveen, N.; Sabir, Z.; Khan, Z.A. Analyzing unsteady flow of shear-thinning nanofluids over a cylinder with exponential stretching and shrinking: An artificial neural network approach. Chaos Solitons Fractals 2025, 195, 116301. [Google Scholar] [CrossRef]
  2. Ma, W.X. A combined integrable hierarchy with four potentials and its recursion operator and bi-Hamiltonian structure. Indian J. Phys. 2025, 99, 1063–1069. [Google Scholar] [CrossRef]
  3. Ma, W.X.; Zhong, Y.D. A 4×4 Matrix Spectral Problem Involving Four Potentials and Its Combined Integrable Hierarchy. Axioms 2025, 14, 594. [Google Scholar] [CrossRef]
  4. Mathanaranjan, T.; Yesmakhanova, K.; Myrzakulov, R.; Naizagarayeva, A. Optical wave structures and stability analysis of integrable Zhanbota equation. Mod. Phys. Lett. B 2024, 39, 2550071. [Google Scholar] [CrossRef]
  5. Butt, A.R.; Farooq, F.B.; Abbas, H.; Alqahtani, N.A.; Imran, M.; Bekir, A. Multi-stability and dynamical analysis of Zhanbota-IIA equation with couple of integrating architectures. Phys. Scr. 2024, 100, 015220. [Google Scholar] [CrossRef]
  6. He, J.H. Some asymptotic methods for strongly nonlinear equations. Int. J. Mod. Phys. B 2006, 20, 1141–1199. [Google Scholar] [CrossRef]
  7. Kong, H.Y.; Guo, R. Dynamic behaviors of novel nonlinear wave solutions for the Akbota equation. Optik 2023, 282, 170863. [Google Scholar] [CrossRef]
  8. Sergazina, A.; Myrzakulova, Z.; Yesmakhanova, K.; Myrzakulov, R.; Nugmanova, G. Integrable spin systems in 2 + 1, 1 + 1 and 1 + 0 dimensions. a(a+1) 2023, 2, x2. [Google Scholar] [CrossRef]
  9. Li, P.; Qiao, R.; Xu, C.; Yiao, M.; Qu, Y.; Ahmad, S. Exploration of soliton solutions and dynamical analysis of the q-form Zhanbota equation: An application to image encryption. Phys. A Stat. Mech. Appl. 2025, 675, 130809. [Google Scholar] [CrossRef]
  10. He, G.; Liu, S.H. Physics of Nonlinear Optics; World Scientific: Singapore, 1999. [Google Scholar]
  11. Cao, X. Bäcklund transformations with two pseudo-potentials. Appl. Math. Lett. 2016, 61, 13–19. [Google Scholar] [CrossRef]
  12. Hussain, E.; Tedjani, A.H.; Farooq, K.; Beenish. Modeling and Exploration of Localized Wave Phenomena in Optical Fibers Using the Generalized Kundu–Eckhaus Equation for Femtosecond Pulse Transmission. Axioms 2025, 14, 513. [Google Scholar] [CrossRef]
  13. Beenish; Hussain, E.; Younas, U.; Tapdigoglu, R.; Garayev, M. Exploring Bifurcation, Quasi-Periodic Patterns, and Wave Dynamics in an Extended Calogero–Bogoyavlenskii–Schiff Model with Sensitivity Analysis. Int. J. Theor. Phys. 2025, 64, 146. [Google Scholar] [CrossRef]
  14. Arshed, S.; Raza, N.; Kaplan, M. Painlevé analysis, dark and singular structures for pseudo-parabolic type equations. Mod. Phys. Lett. B 2022, 36, 2250104. [Google Scholar] [CrossRef]
  15. Zhang, X.; Chen, Y. Inverse scattering transformation for generalized nonlinear Schrödinger equation. Appl. Math. Lett. 2019, 98, 306–313. [Google Scholar] [CrossRef]
  16. Li, Z.; Lyu, J.; Hussain, E. Bifurcation, chaotic behaviors and solitary wave solutions for the fractional Twin-Core couplers with Kerr law non-linearity. Sci. Rep. 2024, 14, 22616. [Google Scholar] [CrossRef]
  17. Hussain, E.; Malik, S.; Yadav, A.; Shah, S.A.A.; Iqbal, M.A.B.; Ragab, A.E.; Mahmoud, H.M. Qualitative analysis and soliton solutions of nonlinear extended quantum Zakharov–Kuznetsov equation. Nonlinear Dyn. 2024, 112, 19295–19310. [Google Scholar] [CrossRef]
  18. Jhangeer, A.; Faridi, W.A.; Alshehri, M. Soliton wave profiles and dynamical analysis of fractional Ivancevic option pricing model. Sci. Rep. 2024, 14, 23804. [Google Scholar] [CrossRef] [PubMed]
  19. Ali, F.; Jhangeer, A.; Muddassar, M. Comprehensive classification of multistability and Lyapunov exponent with multiple dynamics of nonlinear SchrÖdinger equation. Nonlinear Dyn. 2025, 113, 10335–10364. [Google Scholar] [CrossRef]
  20. Tang, L.; Biswas, A.; Yıldırım, Y.; Alshomrani, A.S. Bifurcations and optical soliton perturbation for the Lakshmanan–Porsezian–Daniel system with Kerr law of nonlinear refractive index. J. Opt. 2024, 1–6. [Google Scholar] [CrossRef]
  21. Lu, T.; Tang, L.; Chen, Y.; Chen, C. Dynamical behaviors, chaotic pattern and multiple optical solitons for coupled stochastic Schrödinger–Hirota system in magneto-optic waveguides with multiplicative white noise via Itô calculus. Results Phys. 2024, 60, 107679. [Google Scholar] [CrossRef]
  22. Perko, L. Differential Equations and Dynamical Systems; Springer Science & Business Media: Dordrecht, The Netherlands, 2013; Volume 7. [Google Scholar]
  23. Beenish; Samreen, M. Bifurcation, Multistability, and Soliton Dynamics in the Stochastic Potential Korteweg-de Vries Equation. Int. J. Theor. Phys. 2025, 64, 1–22. [Google Scholar] [CrossRef]
  24. Kopçasız, B. Qualitative analysis and optical soliton solutions galore: Scrutinizing the (2 + 1)-dimensional complex modified Korteweg–de Vries system. Nonlinear Dyn. 2024, 112, 21321–21341. [Google Scholar] [CrossRef]
  25. Beenish; Asim, M.; Boulaaras, S.; Rahman, M.U. Dynamical behaviour and solutions in the fractional Gross–Pitaevskii model. Math. Comput. Model. Dyn. Syst. 2025, 31, 2529190. [Google Scholar] [CrossRef]
  26. Beenish; Samreen, M.; Salem, A.F. Mathematical Modeling, Bifurcation Theory, and Chaos in a Dusty Plasma System with Generalized (r, q) Distributions. Axioms 2025, 14, 610. [Google Scholar] [CrossRef]
  27. Zhao, S.; Li, Z. The analysis of traveling wave solutions and dynamical behavior for the stochastic coupled Maccari’s system via Brownian motion. Ain Shams Eng. J. 2024, 15, 103037. [Google Scholar] [CrossRef]
  28. Jhangeer, A.; Beenish. Study of magnetic fields using dynamical patterns and sensitivity analysis. Chaos Solitons Fractals 2024, 182, 114827. [Google Scholar] [CrossRef]
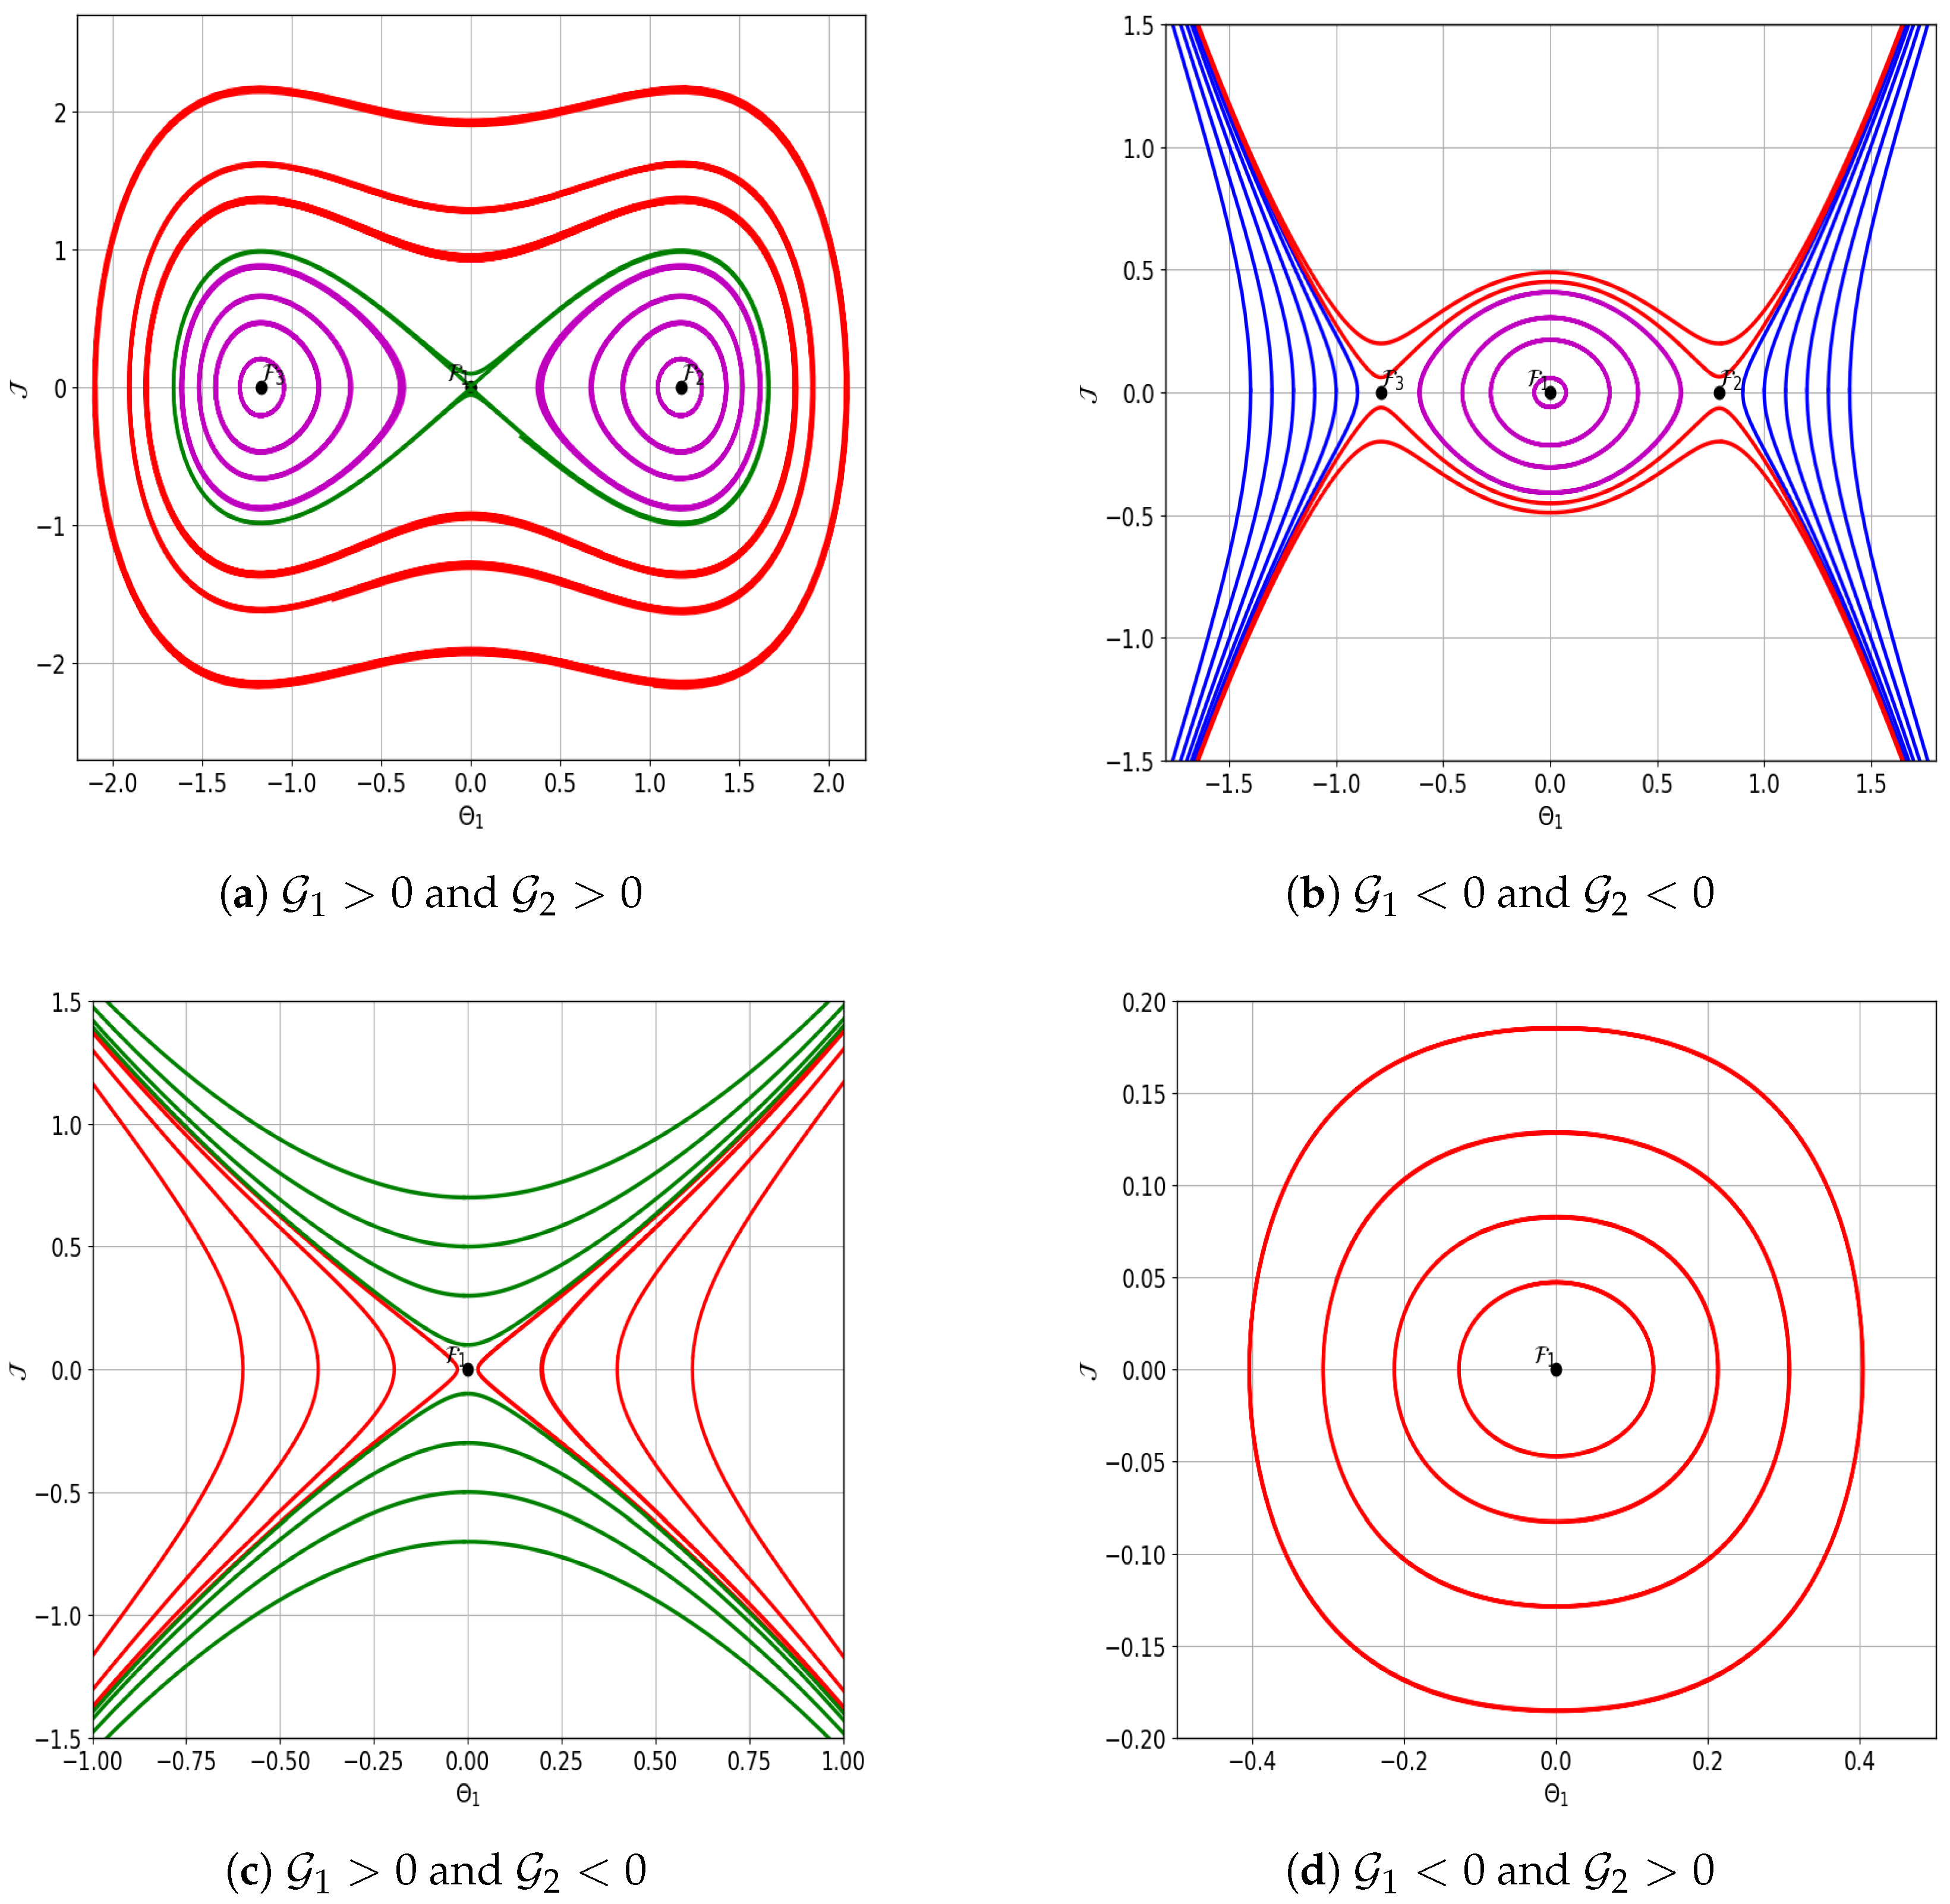
Figure 1. Bifurcation phase portraits at the equilibrium points of the dynamical system (19).
Mca 30 00100 g001
Figure 2. Contour visualization of the Hamiltonian function (24) across different values of G 1 and G 2 .
Mca 30 00100 g002
Figure 3. Chaotic and quasi-periodic behaviors of the system (30) with ϵ 0 = 0.7 and ζ = 0.2 .
Mca 30 00100 g003
Figure 4. Chaotic and quasi-periodic behaviors of the system (30) with ϵ 0 = 1.2 and ζ = 0.2 .
Mca 30 00100 g004
Figure 5. Chaotic and quasi-periodic behaviors of the system (30) with ϵ 0 = 1.5 and ζ = 0.2 .
Mca 30 00100 g005
Figure 6. Chaotic and quasi-periodic behaviors of the system (30) with ϵ 0 = 1.9 and ζ = 0.2 .
Mca 30 00100 g006
Figure 7. Chaotic and quasi-periodic behaviors of the system (30) with ϵ 0 = 1.9 and ζ = 2.2 .
Mca 30 00100 g007
Figure 8. Periodic behaviors of the system (30) absent of the perturbed term.
Mca 30 00100 g008
Figure 9. The multi-stability of the dynamical system (30) was calculated using the parameter values G 1 = 0.87 , G 2 = 0.67 , ϵ 0 = 1.9 and ζ = 0.2 .
Mca 30 00100 g009
Figure 10. The chaotic attactor of the dynamical system (30) were calculated using the initial condition (0.59, 0.04, 0.27) and the parameter values G 1 = 0.87 , G 2 = 0.67 , ϵ 0 = 0.09 and ζ = 0.24 .
Mca 30 00100 g010
Figure 11. The chaotic behavior of System (30) is analyzed for the parameters G 1 = 0.87 , G 2 = 0.67 , ϵ 0 = 1.9 , and ζ = 3.2 , using the initial condition ( 0.59 , 0.14 , 0.27 ) .
Mca 30 00100 g011
Figure 12. Analyzing the sensitivity of the present model (19) under these initial conditions ( Θ 1 , J ) = ( 0.15 , 0.05 ) and ( Θ 1 , J ) = ( 0.55 , 0.05 ) .
Mca 30 00100 g012
Figure 13. Conducting a sensitivity assessment of the existing model (19) based on the specified initial conditions ( Θ 1 , J ) = ( 0.25 , 0.05 ) and ( Θ 1 , J ) = ( 0.55 , 0.05 ) .
Mca 30 00100 g013
Figure 14. Examining how sensitive the current model (19) is when these initial conditions are applied ( Θ 1 , J ) = ( 0.49 , 0.05 ) and ( Θ 1 , J ) = ( 0.55 , 0.05 ) .
Mca 30 00100 g014
Figure 15. Evaluating the sensitivity of the model (19) in response to these initial conditions ( Θ 1 , J ) = ( 0.08 , 0.05 ) and ( Θ 1 , J ) = ( 0.12 , 0.05 ) .
Mca 30 00100 g015
Figure 16. Evaluating the sensitivity of the model (19) in response to these initial conditions ( Θ 1 , J ) = ( 0.06 , 0.05 ) and ( Θ 1 , J ) = ( 0.04 , 0.05 ) .
Mca 30 00100 g016
Figure 17. Visualization of A 1 highlighting its modular length with γ = 2.2 , G 2 = 144 , r 1 = 0.75 , r 2 = 0.86 , Π 2 = 4 , Π 1 = 2 , ρ = 1 , and m 0 = 3 .
Mca 30 00100 g017
Figure 18. Depiction of the modular length of the solution A 2 under parameters γ = 0.67 , G 1 = 4.33 , G 2 = 1.23 , Π 2 = 4 , r 1 = 0.75 , r 2 = 0.86 , Π 1 = 2 , ρ = 0.65 , and m 0 = 0.5 .
Mca 30 00100 g018
Figure 19. Depiction of the modular length of the solution A 2 under parameters γ = 0.67 , G 1 = 4.33 , G 2 = 1.23 , Π 2 = 4 , r 1 = 0.75 , r 2 = 0.86 , Π 1 = 2 , ρ = 0.65 , and m 0 = 0.5 .
Mca 30 00100 g019
Figure 20. The solution A 4 is shown with its modular length for γ = 0.67 , G 1 = 4.23 , G 2 = 1.03 , Π 2 = 4 , r 1 = 0.75 , r 2 = 0.86 , Π 1 = 2 , ρ = 0.65 , and m 0 = 1.5 .
Mca 30 00100 g020
Disclaimer/Publisher’s Note: The statements, opinions and data contained in all publications are solely those of the individual author(s) and contributor(s) and not of MDPI and/or the editor(s). MDPI and/or the editor(s) disclaim responsibility for any injury to people or property resulting from any ideas, methods, instructions or products referred to in the content.