Abstract
Accurate permeability predictions remain pivotal for understanding fluid flow in porous media, influencing crucial operations across petroleum engineering, hydrogeology, and related fields. Traditional approaches, while robust, often grapple with the inherent heterogeneity of reservoir rocks. With the advent of deep learning, convolutional neural networks (CNNs) have emerged as potent tools in image-based permeability estimation, capitalizing on micro-CT scans and digital rock imagery. This paper introduces a novel paradigm, employing vision transformers (ViTs)—a recent advancement in computer vision—for this crucial task. ViTs, which segment images into fixed-sized patches and process them through transformer architectures, present a promising alternative to CNNs. We present a methodology for implementing ViTs for permeability prediction, its results on diverse rock samples, and a comparison against conventional CNNs. The prediction results suggest that, with adequate training data, ViTs can match or surpass the predictive accuracy of CNNs, especially in rocks exhibiting significant heterogeneity. This study underscores the potential of ViTs as an innovative tool in permeability prediction, paving the way for further research and integration into mainstream reservoir characterization workflows.
1. Introduction
Predictions of permeability play a role in characterizing reservoirs as they help us understand how fluids flow through porous materials, like rocks in the earth’s surface or subsurface areas known as reservoirs. Special Core Analysis (SCAL) has been used for years to predict and evaluate rock permeability in reservoirs by analyzing the cores from drilling sites and well logs along with methods like measuring the physical properties of rocks. Although these traditional methods are effective to some extent at predicting the permeability of reservoir rocks, they come with limitations due to the amount of data needed and the complexity of the rock formations being studied. The field has experienced a change towards digital transformation by leveraging advanced computational methods, like machine learning and deep learning, to improve the prediction capabilities of permeability.
Advanced deep learning technologies like neural networks (CNN) have brought significant advancements to industries like petroleum engineering by effectively enhancing seismic interpretation and reservoir simulation processes. CNNs’ capabilities for analyzing sections and digital rock images have shown potential for accurate permeability predictions [1]. Nonetheless, vision transformers (ViTs), an innovation in AI technology, are now being seen as groundbreaking developments with the potential to revolutionize the field further. ViTs differ from CNNs in that they break down images into patches and scrutinize them similarly to how transformers manage sequences in natural language processing, as described by [2]. This novel method has sparked inquiries about the use of ViTs for predicting permeability from rock images due to their capacity to analyze intricate image data.
This research project focuses on exploring the capabilities of vision transformers (ViTs) for predicting permeability by building upon previous studies and delving into the obstacles and possibilities they offer. By comparing ViTs with conventional CNN models, this investigation aims to assess how effective ViTs are at predicting permeability in the realm of digital rock physics.
The unique aspect of this research is its utilizing ViTs to predict permeability in the field of petroleum engineering. This domain has received little exploration thus far compared to the extensively researched CNNs. ViTs’ distinct ability to manage image data at a granular level brings a fresh viewpoint. This research delves into the theoretical potential of ViTs and tackles real-world obstacles, like the requirement for extensive datasets, that have historically restricted their utilization in this field. Drawing from datasets, such as the one compiled by Santos and colleagues in 2022 [3] that feature three shapes and outcomes from simulations, this study looks to tackle these obstacles head-on and push forward the application of vision transformers for forecasting permeability within porous materials.
Rahmanifard’s [4] research examined how AI methods are utilized in the petroleum sector, focusing on the impressive effectiveness of these techniques for enhancing different operations, like predicting the permeability levels of reservoirs. His study underlined the advantages of integrating AI methods to address intricate challenges in characterizing reservoir formations. This goal resonates with this research’s aim of advancing permeability prediction through sophisticated AI models like ViTs.
Furthermore, the research by Kuang and others in 2021 [5] highlighted the impact that AI could have on petroleum exploration and development. That paper explored how AI tools, like learning and optimization, were currently used for estimating reservoir parameters and real-time production optimization tasks. Kuang and colleagues stressed that AI’s future role in the petroleum industry would include advanced production machinery, automated data analysis and interpretation, and the creation of tailored software solutions. These findings back up the investigation of ViTs for predicting permeability, since they mark the frontier in utilizing AI for intricate geological and engineering challenges.
Moreover, the research carried out by Ng and colleagues in 2021 [6] shed light on the growing influence of machine learning and metaheuristic algorithms on proxy modeling for reservoir simulation tasks. The study underscored the integration of machine learning with algorithms as an effective strategy to create proxy models that can notably cut down the computational time without compromising the accuracy of reservoir simulations. This integrated method has demonstrated encouraging outcomes across different reservoir engineering tasks, such as the enhancement and quantification of uncertainty, which further solidifies the capacity of cutting-edge AI methods like vision transformers (ViTs) to transform the forecasting of permeability and other intricate modeling duties in reservoir characterization.
Muther’s recent research [7] highlighted how crucial optimization is in fracturing for effective reservoir management. It showcased the success of combining reservoir simulations with neural networks and innovative socio-inspired algorithms to enhance fracture design. The outcomes underscored the effectiveness of sophisticated optimization strategies, like multi-cohort intelligence (multi-CI) and teaching–learning-based optimization (TLBO), in contrast to conventional approaches, such as particle swarm optimization (PSO) and genetic algorithms (GAs). The findings also reinforced the need for investigations into cutting-edge AI models, such as ViTs, for predicting permeability, since these models could present benefits when dealing with intricate optimization tasks in reservoir characterization.
The study conducted by Zhang and colleagues in 2018 [8] underscored the growing significance of intelligence models for enhancing and mimicking reservoir operations, especially deep learning algorithms such as long short-term memory (LSTM). They highlighted how LSTM models excel at managing scheduling challenges in reservoir management compared to conventional AI models by offering superior prediction accuracy and computational efficiency. The study results support the idea that advanced AI methods like vision transformers (ViTs) could transform modeling assignments in reservoir characterization by completing tasks, such as predicting permeability.
In his work published in 2023, Kubeyev [9] introduced a strategy for tackling the computational hurdles linked to multi-physics numerical modeling tasks focused on simulating fractures with intricate shapes and forms. The research showcased the effectiveness of using a deep learning algorithm to forecast physical permeability characteristics based on images of fractures alone without needing data on fluid velocity—a usual prerequisite for such simulations. The research demonstrated that deep learning can substitute for a portion of the physics-oriented modeling procedure by employing a convolutional neural network (CNN) trained with data derived from digitized rough fracture surfaces and computed permeability values. This strategy notably cuts down the computation time without compromising the precision levels and has proven to be an advantageous asset in multi-physics modeling scenarios where conventional techniques have proven to be excessively demanding computationally. The effective utilization of deep learning in this scenario underscores the capabilities of AI models such as vision transformers (ViTs) to improve the accuracy of predicting permeability during reservoir characterization.
Therefore, this study connects the conventional and cutting-edge AI methods for forecasting permeability levels, smoothly bridging the gap between the two realms of AI techniques for permeability prediction. The research seeks to enhance the efficiency and precision of predicting permeability by employing vision transformers, a move that could reshape digital rock physics significantly. The results of this investigation will offer valuable perspectives on using advanced AI for characterizing reservoirs, paving the path for future advancements in this field.
2. Related Literature
Estimating reservoir characteristics like permeability is important for understanding the structures and fluid movement patterns in oil fields and gas reservoirs. The typically used techniques to determine porosity and permeability involve core testing and complex mathematical models or petrophysical simulations. However, advancements in machine learning (ML) and deep learning (DL) have introduced ways to tackle these issues by providing cost-effective, precise, and scalable solutions for evaluating reservoir properties.
Yang and colleagues [10] introduced a deep learning model to forecast reservoir permeability and porosity using authentic logging data from diverse areas. Their method effectively cuts down on the expenses and intricacies linked with traditional approaches while upholding their strong dependability across various geological conditions. This model harnesses advanced learning capabilities to manage the intricate and nonlinear connections between the logging data and reservoir characteristics, presenting a reliable substitute for traditional methods.
Expanding on the progress made in learning techniques, Meng and colleagues [11] developed a new neural network that combines CNN and transformer architectures to overcome the shortcomings of standard 3D CNN models when predicting the permeability of porous materials. This hybrid model has enhanced efficiency, accuracy, and adaptability by utilizing 2D image sequences and integrating characteristics. It shows improvements, especially when working with limited data or in novel scenarios, due to its application of transfer learning. Their research emphasizes that transfer learning-based models show promise for addressing the obstacles linked to sparse data in reservoir engineering, a prevalent issue within the field.
In a study by Zhang and colleagues [12], they expanded the use of transformers in reservoir simulations by creating an enhanced vision transformer neural network (IViT-NN). This advanced model serves as a learning surrogate for addressing history-matching challenges and boosts the speed at which production data is generated, proving to be a crucial asset for tasks like history matching and predicting production outcomes. The performance of this model, producing results comparable to those achieved with complete reservoir simulations, highlights the promise of ViTs for improving the effectiveness and precision of intricate reservoir modeling assignments.
Advancements in using machine learning methods to enhance reservoir engineering have also been made. In a study by Liu and colleagues [13], they tackled the ongoing issue of spatial variability in geostatistical models that has long troubled traditional approaches. Their research showcases the effectiveness of self-attention mechanisms like vision transformer models for enhancing the accuracy of deep learning forecasts in scenarios with substantial spatial diversity. This method not only performs better than traditional CNN models, but also fits in well with the changing trends in machine learning applications within different scientific domains demonstrated by [14]. Using ViTs to address variations marks a crucial advancement in reservoir characterization.
A research project by Liu and colleagues [15] explored how materials are structured by examining factors like the specific surface area tortuousness and pore size. Their approach involved a two-phase machine learning system that utilized 11 metrics to evaluate the structure and reaction rates derived from simulations at the pore level. The research showcases how machine learning methods can be effectively applied to study how nanoconfinement impacts continuum models. Liu and colleagues [15] introduced a method to link fine-scale and coarse-scale models using machine learning emulators to improve the accuracy when predicting permeability in reservoir characterization tasks.
The advancements in imaging technologies have brought about discoveries in understanding the differences in carbonate rocks using X-ray imaging techniques at different levels of scale, such as CT scans and micro/nano CT imaging methods, while facing difficulties in combining these insights into a unified model for precise upscaling measurements, as shown by several recent research papers by Eberhard et al. [16] and Kamrava et al. [17]. Graczyk [18] utilized convolutional neural networks (CNNs) to analyze CT scans to forecast carbonate rocks’ permeability. However, CNN models’ resource-intensive natures and lack of transparency restrict their usefulness for scaling up. Andrew [19] presented a machine learning approach in 2020 that merged the vectorization of datasets with a regression based on decision trees, providing an understandable and scalable resolution. This approach tackled some of the constraints linked to vision transformers (ViTs), proposing that integrating ViTs with machine or deep learning could offer an efficient and adaptable solution for intricate real-world situations while maintaining accuracy.
A study by Kubeyev [9] introduced a new deep learning method to forecast the physical permeability traits of fractures with intricate shapes and sizes. The approach involved utilizing images of fractures to teach a convolutional neural network (CNN), which can anticipate permeability without relying on data about fluid speeds, a departure from conventional practices. The outcomes indicated that deep learning has the potential to streamline physics-based modeling procedures by cutting down on the computation time without compromising accuracy. This research focused heavily on the advantages of incorporating learning into multi-physics modeling, especially for tasks that are too computationally intensive for conventional numerical methods.
In 2021 Ng and colleagues [6] conducted a study that emphasized the growing importance of machine learning and metaheuristic algorithms for creating intelligent proxy models for reservoir simulation tasks. They found that by integrating machine learning with algorithms, they could create proxy models that reduce the computing time while maintaining high levels of accuracy. This innovative approach has potential in reservoir engineering tasks, such as optimization and uncertainty assessment. The research highlights the possibilities that AI techniques like ViTs can offer for transforming permeability predictions and other intricate modeling tasks in reservoir characterization.
In a study by Zhang and colleagues in 2018 [8] on long short-term memory (LSTM), they delved into the use of LSTM networks for optimizing and simulating reservoir operations to showcase how these models excel at solving scheduling issues in reservoir management compared to traditional AI models, due to their accuracy in making predictions and their computational efficiency improvements. The research findings by Zhang et al. also highlight the future of cutting-edge AI techniques like vision transformers (ViTs), which could potentially transform complex modeling tasks related to reservoir characterization, such as predicting permeability levels.
In their study published in 2023, Meng and colleagues [11] introduced a new deep learning approach called Transformer to effectively predict reservoir permeability and porosity using actual logging data. The Transformer model combines one convolutional layer with LSTM and transformer layers to accurately capture the variations in the depth over time in logging data—a crucial factor for precise subsurface analysis. Firstly, extracting the features from the logging data using 1-dimensional convolutional layers and then establishing the complex mapping connections between the logging data and reservoir parameters through the LSTM layers are the primary steps taken by the model. Using an encoder with self-attention helps improve the feature extraction, enabling the model to make accurate and reliable predictions across various geographical areas more effectively. Their research shows that an RPTransformer performs better than machine learning models, such as random forest and other deep learning models like multilayer LSTM and LSTNet, especially when it comes to generalization and managing uncertainties in practical scenarios. This study underscores the possibilities of incorporating learning structures into reservoir parameter prediction, which could pave the way for exciting advancements in this field.
The literature shows a trend toward incorporating cutting-edge AI technologies like vision transformers into analyses of reservoir properties and permeability forecasts. The research highlights how these methods can address the shortcomings of traditional techniques by providing improved efficiency and accuracy on a larger scale. As a result, the current exploration of ViTs and other advanced AI models marks a progression in reservoir engineering, setting the stage for advancements that will boost our capacity to forecast and regulate subsurface assets more effectively.
While vision transformers are relatively new in earth science applications, a growing number of studies have begun exploring their potential. For example, Meng et al. [11] and Liu et al. [13] applied transformer-based models to predict permeability and reaction rates in porous media using digital rock images and structural features. Additionally, Zhang and Li [12] introduced an improved ViT framework for history-matching and reservoir simulation tasks, demonstrating its ability to replicate full-physics models with significantly reduced computational costs. These pioneering efforts highlight the versatility of ViTs in geoscientific domains involving complex spatial patterns. However, most existing works have focused either on history-matching or 2D applications, whereas our study uniquely applies 3D ViT modeling for direct permeability prediction at the pore scale. This underscores the novelty and technical contribution of our approach within the broader evolution of ViT usage in the earth sciences.
3. Operational Aspects of Special Core Analysis (SCAL) and Digital Rock Physics
Special Core Analysis (SCAL) and digital rock physics (DRP) enhance our understanding of reservoir characteristics and optimize hydrocarbon recovery. SCAL involves conducting laboratory experiments on core samples to assess their permeability, wettability, and electrical properties. These experiments are essential for comprehending the flow of fluids through the media of reservoir rocks [20,21,22].
The transition from SCAL to DRP represents an operational change. DRP utilizes imaging technologies like micro-CT scanning to generate detailed 3D models of rock samples. This digital transformation enables us to analyze structures and fluid distribution with precision without being constrained by the limitations of conventional core analysis methods. One important aspect of integrating SCAL with DRP is the requirement for resources. The analysis of 3D images requires powerful computing platforms and specialized software capable of handling extensive datasets and performing complex simulations [23,24].
Furthermore, the integration of SCAL and DRP calls for collaboration. Various engineering, geoscience, and digital transformation disciplines must collaborate closely to interpret rock models accurately. This collaboration extends to developing models that simulate reservoir conditions and fluid interactions. The accuracy of DRP models heavily relies on the quality of the input data. Hence, one of the challenges is ensuring that digital images accurately reflect the properties of rock samples. This often requires aligning the models with the measurements obtained from SCAL experiments. Another aspect to consider is the constantly improving imaging technology. Higher resolutions and faster simulation techniques have made analyzing rock samples in detail possible. However, this also means that the analysis software and computational methods must be continuously updated [25,26]. Additionally, training and expertise in DRP is necessary. Personnel must be well-trained in operating resolution imaging equipment and interpreting rock physics data. This involves understanding the limitations and uncertainties associated with the models. Data management and security have also become increasingly important. Since DRP generates large volumes of data, it is essential to store and manage the data, provide access to the relevant stakeholders, and to ensure data integrity and confidentiality [27,28]. Lastly, integrating SCAL data with reservoir simulation models is important. This integration will help make decisions regarding reservoir management and optimization strategies more streamlined and effective. However, it requires data transfer and compatibility among the software tools used in SCAL, DRP, and reservoir simulations [29,30].
4. Methodology
This study employs a comprehensive approach to model development, dataset utilization, and data preprocessing to predict the permeability of porous media. The methodology is divided into several key subsections, each addressing a critical component of the research process.
5. Model Development
The primary focus of this research is developing an advanced deep learning framework for permeability prediction. The model, a hybrid of CNN–Transformer architecture, is designed to efficiently process and analyze 3D porous media data. The CNN layers are utilized for the initial feature extraction, leveraging their capacity to capture spatial dependencies in imaging data. In contrast, the Transformer layers are employed to handle complex relationships and enhance predictive accuracy. Integrating these architectures aims to address the limitations of traditional methods and previous deep learning models, particularly in terms of the computational efficiency and generalization to diverse datasets.
In the proposed architecture, the CNN layers are positioned at the front of the network to extract the local spatial features from the 3D porous media input. These layers are well-suited for capturing fine-scale geometric patterns, such as pore shapes and connectivity. The extracted spatial feature maps are then passed to the Transformer layers, which apply window-based self-attention to capture the long-range dependencies and contextual relationships across the 3D volume. This combination allows the model to leverage both the local details (from the CNN) and the global structural context (from the Transformer), creating a synergistic framework that improves prediction accuracy while maintaining computational efficiency.
5.1. Dataset Description
Transport phenomena in media are widespread. They have applications in various fields, ranging from hydrocarbon extraction and CO2 storage to cutting-edge technologies like battery design and desalination [31,32]. Understanding and quantifying the influence of porous structures on transport processes requires focusing on the key properties, such as permeability and electrical conductivity. These properties determine how easily fluids flow through a medium and how well it conducts electrical currents, making them crucial for modeling, design, and a nuanced understanding of the underlying physics [16,33,34,35]. Despite efforts to establish relationships based on descriptors like porosity, creating a universal model remains a formidable challenge [3].
The complex impact of the length scale and pore space geometry on the flow and other properties adds complexity to this pursuit. Different methodologies, including laboratory measurements, X-ray micro relationships, and 3D fluid mechanics simulations, have been used to estimate the transport properties, each with its advantages and limitations [36,37,38,39]. One promising avenue for future exploration involves utilizing machine learning (ML) models as substitutes for estimating the properties from images. This approach has shown potential for expediting the predictions of properties at the microscopic level [31,40,41].
Despite the advancements achieved so far, there remains an expanse of uncharted territory within the realm of pore-scale machine learning. Further research is needed before we can delve into this domain, due to the difficulties in acquiring and processing data. Nevertheless, there is still potential within the realm of pore-scale machine learning (ML). Many current efforts are focused on models trained using either 3D samples (<1283) [41] or larger samples (>2563), often concentrating on one type of geometry, like sphere packs [42]. One notable exception to this trend is an initiative that utilized 90,000 microstructures from 9 distribution families, which were down-sampled to 963 for applications in 3D machine learning. In contrast to fields where large and diverse datasets have driven ML breakthroughs, porous media research faces challenges from the datasets used, which limit effective comparisons between modeling techniques and obscure the influence of confounding variables, such as fluid solvers and numerical implementations, on ML models’ characteristics [3].
To address this gap, this work (Table 1) aimed to create a dataset encompassing complex scenarios across 3D simulations, empirical functional forms, and machine learning applications in porous media. This diversity covered dimensions including the lithology of the media, boundary conditions, geometric resolution, and simulated physical processes. This work generated three types of microstructures: Gaussian random fields, spinodal decomposition simulations, and non-overlapping ellipsoid systems. Each type of microstructure consisted of 10,000 instances, with varying porosities and characteristic lengths. These instances were then converted into voxel arrays. Volume sizes were selected accordingly to ensure efficiency. Correlation functions ranging from integer radii value bins of 1 to 96 voxels [43] were selected.

Table 1.
Overview of this work’s progression for permeability prediction study. This table outlines the key steps involved in the methodology of the study, from data collection to model testing. Each step is described with the associated actions, providing a structured view of the research workflow.
The dataset, previously presented by Santos et al. [3], has been intricately crafted to aid research into predicting transport properties within porous materials. Referred to as DRP 372, this foundational dataset comprises 217 rock samples sourced from 125 projects on the Digital Rocks Portal (Table 2). These samples encompass an array of over 50 lithologies spanning subsurface rocks, catalyst layers, soils, meteorites, biofilms, and stalagmites. The samples are provided in image sizes of 2563 and 4803 voxels, with resolutions ranging from 0.5 nanometers to 5 μm. This standardization plays a role in enabling the utilization of machine learning models by ensuring uniform input dimensions throughout the dataset. Each dataset sample includes data from three transport simulations, electrical conductivity simulations, five single-phase nanoconfined simulations, and one fluid flow simulation without confinement. Additionally, ten unique three-dimensional geometrical features are computed for each sample, such as distance maps, chord lengths, porosity measurements, time-of-flight maps, and inscribed spheres. The Minkowski functionals are also calculated to provide a characterization of each sample encompassing the volume, surface area, integral mean curvature, and total curvature [3].
Table 2.
Dataset of samples.
The research paper published by Fu and colleagues in 2023 [44] presents a data-focused framework that aims to predict the permeability of porous rocks through the integration of various techniques. These techniques include imaging, stochastic reconstruction, microstructural characterization, pore-scale simulation feature selection, and data-driven modeling. The framework begins with acquiring rock images using advanced microscopy and stochastic reconstruction methods, which produce a diverse range of pore microstructures. These microstructures are then quantitatively described using features. Subsequently, high-fidelity lattice Boltzmann simulations simulate the flow within these media, yielding reliable permeability estimates. An important component of this framework is the feature selection process, which identifies the morphological descriptors for constructing a surrogate model. This model is crafted to approximate the relationship between the microstructure and its permeability, enhancing the prediction accuracy and generalization capabilities compared to other models.
The link between Fu et al.’s study in 2023 [44] and Santos et al.’s dataset from 2022 [3] is apparent in their shared focus on characterizing media microstructures and utilizing computational techniques for predicting permeability. While Santos et al. offered a dataset of digital rock samples, Fu et al.’s research emphasized integrating multiple methodologies to enhance the predictive accuracy.
In 2023, a proposal was made to utilize this dataset to select features and training models. These efforts aimed to enhance the accuracy and effectiveness of predicting the permeability of materials. Fu et al.’s proposed framework (explained in Table 3) has the potential to amplify the usefulness of Santos et al.’s dataset by creating machine learning models for permeability prediction [44].
Table 3.
Sequential feature selection process.
While vision transformers (ViTs) typically require large datasets to generalize effectively due to their data-intensive architecture, the DRP 372 dataset provides an adequate scale and diversity for training. After filtering the non-percolating samples, the final dataset consists of 567 rock samples—each represented as a 6-channel 3D cube of size 256 × 256 × 256. Although smaller than conventional image-based datasets used in ViT applications, the dimensional richness of each sample and the application of data augmentation (via 3D rotations) significantly expands the effective dataset size. Additionally, each sample is embedded with complex geometric and transport descriptors, enabling the model to learn from highly informative spatial representations. The empirical performance metrics (R2 = 0.85 on the test set) indicate that the dataset is sufficient for training ViTs in this specific physical modeling context.
Karimpouli et al. [25] studied how 2D algorithms can be applied to analyze rock samples in rock physics. Specifically, their research examined the effectiveness of a multistep Super Resolution U Net (SRDUN) machine learning algorithm for generating high-quality 3D images from lower-resolution 2D images. The study focused on studying Berea sandstone samples with various resolutions and assessed how the conversion from 2D to 3D impacts rock properties like porosity, permeability, and elastic wave velocities.
The findings of their research revealed that utilizing two-dimensional algorithms for creating images may introduce features in the third dimension. To address this issue, the authors suggested two approaches: averaging the results from three reconstructions to develop realistic 3D models and employing a binary combination of segmented one-directional cubes to produce models with varying levels of porosity. The study demonstrated that employing an averaging strategy leads to models that closely represent the original rock properties.
However, the study also mentioned that when the difference in scale between the input and output images is increased it can result in outcomes that differ from the expected patterns.
This research is closely related to work on digital rock physics and permeability estimation. Just like the dataset detailed by Santos et al. [3], which offered a set of digital rock samples for advancing machine learning applications in porous media, Karimpouli et al. [45] further investigated how machine learning can improve image quality, and the obstacles involved in converting 2D images to representations in DRP. Both studies underscored the significance of the characterization for forecasting the physical properties, such as permeability. Moreover, the data-centric method outlined by Fu et al. [44] for predicting permeability using features is also pertinent, since Karimpouli et al. [25] proposed strategies for enhancing 3D reconstructions that could potentially boost the precision of these predictive models by offering more dependable high-resolution data.
5.2. Data Preprocessing
In this study, the deliberate selection and integration of the key petrophysical features—the single-phase mean free path (MFP); the electrical properties (elecuz); and the geometric properties, including the maximal inscribed spheres (MIS3D), Edomain, and time of flight (tOfL and tOfR)—represent a significant stride in the realm of reservoir characterization and hydrocarbon exploration. These features are fundamentally critical, offering a comprehensive understanding of subsurface rock formations’ physical and chemical properties. The mean free path provides essential insights into the micro-scale fluid dynamics within pore spaces, while the electrical properties are indispensable for inferring the porosity and fluid saturation. The geometric properties, particularly the maximal inscribed spheres, offer a direct correlation with potential fluid flow paths, thereby enhancing the precision of permeability assessments. The integration of these features with advanced vision transformers, which are adept at processing complex visual data from micro-CT scans and thin-section imagery, marks a notable advancement in petrophysical analysis. This approach not only adheres to core petrophysical principles but also leverages state-of-the-art computational methodologies, thereby significantly augmenting the accuracy of permeability predictions and underpinning strategic decisions in hydrocarbon extraction processes.
To further clarify the rationale behind the feature selection, the choice of parameters, such as the mean free path (MFP); maximal inscribed spheres (MIS3D); electrical conductivity (elecuz); and geometric descriptors, including the edomain and time of flight (tOfL and tOfR), was grounded in their strong theoretical relevance to fluid transport phenomena in porous media. The MFP reflects the average distance a fluid molecule travels before colliding with a pore wall, directly correlating with the permeability of single-phase flow regimes. The MIS3D captures the maximal void geometries within a pore structure, offering insights into the flow channel size and constriction—key determinants of permeability. The electrical conductivity, widely used in petrophysical analyses, is linked to fluid saturation and pore connectivity. The edomain and time-of-flight parameters further describe the spatial complexity and flow pathways, essential for characterizing heterogeneous media. These features were selected not only for their predictive power but also for their interpretability, aligning with the established findings in digital rock physics and those of recent studies, such as Santos et al. [3] and Fu et al. [44]. By incorporating parameters that capture the microstructural, electrical, and dynamic aspects of porous media, the model leverages a holistic representation of permeability-related phenomena.
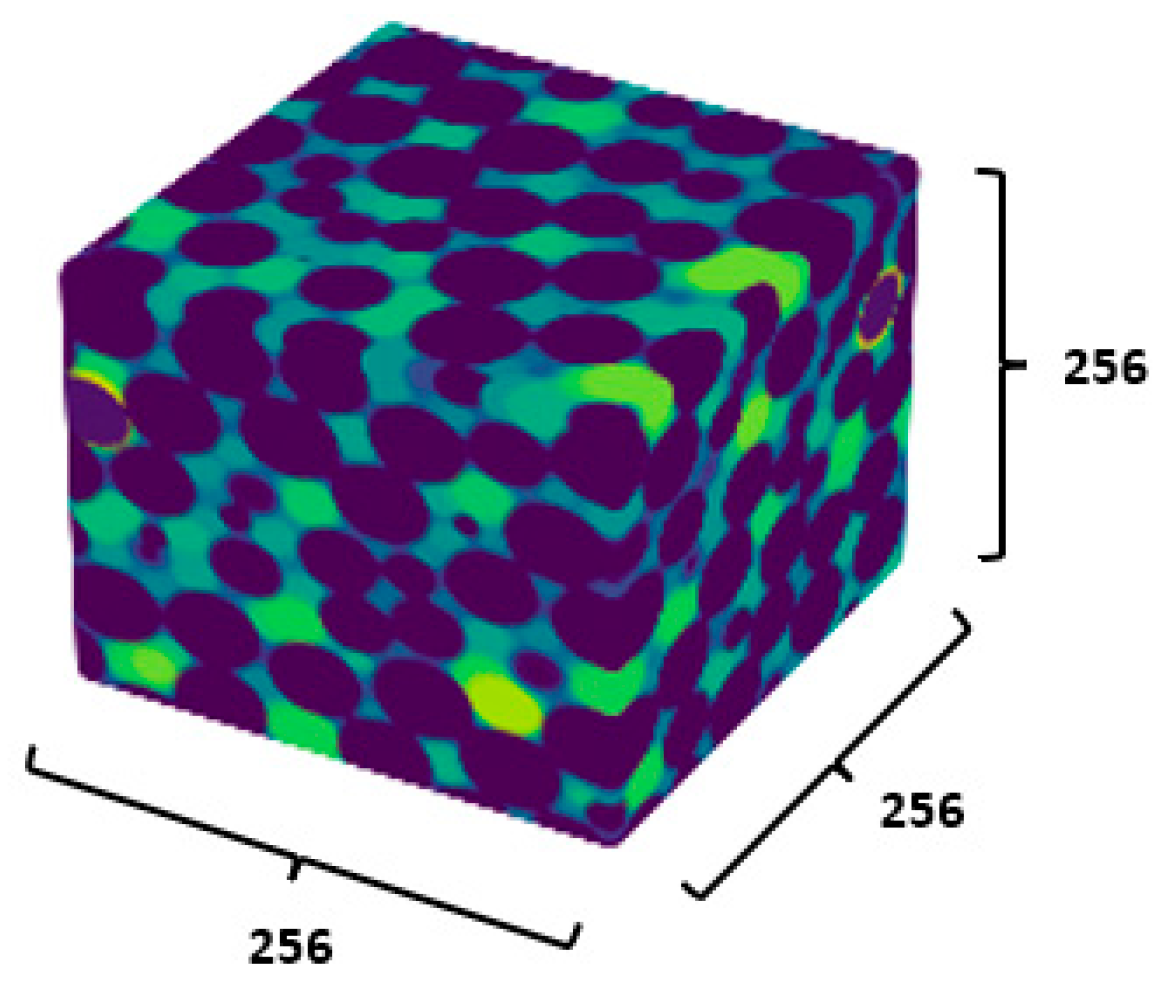
In this research, after filtering out the rock samples that did not percolate, 567 samples were chosen. From those 567 samples, 374 were selected as the training and validation sets. The rest of the samples were allocated as the testing set. The ratios among the training set, validation set, and test were 46.7:8.6:44.5. The features used to characterize the geometry of the void space were integrated into this work to predict the permeability. These features included the single-phase mean free path (mfp); electrical properties elecuz; and geometric properties, like the maximal inscribed spheres (MIS3D), edomain, time of flight (tOfL), and tOfR. Each of the six features had dimensions of 256 × 256 × 256. These six features were concatenated into a six-channel 3D cube as the data input, shown in Figure 1.

Figure 1.
Input description. The example here is a 256 × 256 × 256 3D cube of the single-phase mean free path (MFP) feature. Overall, we have a 256 × 256 × 256 3D cube for each feature.
The dataset was randomly divided into training (46.7%), validation (8.6%), and testing (44.5%) sets. While this ensured the statistical independence of the samples, the division did not explicitly enforce lithology- or project-level grouping constraints. As a result, it is possible that samples from similar rock types or project sources may have appeared across multiple subsets. Although this random split reflects a common approach in digital rock studies, we acknowledge that future work could benefit from stratified splitting by lithology or project origin to further test the model’s generalization ability under stricter independence conditions. This would strengthen confidence in its cross-domain applicability, especially in operational settings where rock types vary across wells or fields.
6. Results
Model Structure and Training
The Swin Transformer encoder proposed by Liu et al. [46] was chosen as the proposed model architecture. The Swin Transformer encoder was chosen because a traditional transformer has limitations regarding the length of sequences; in this case, the number of 3D points in a 3D cube, especially when considering resource consumption, will increase significantly when an object’s dimensions increase from 2D to 3D. The idea of using successive window and shifted-window approaches successively to aggregate the self-attention-based information instead of the global self-attention-based information is at the core of reducing complexity. Unlike a traditional vision transformer block, a Swin Transformer block first splits the whole image into several windows in the first layer and then shifts the window in the succeeding layer. The self-attention calculation is conducted in each window rather for than the whole image, which decreases the complexity of computing. Meanwhile, the shifted-window process ensures patch information communication across different windows.
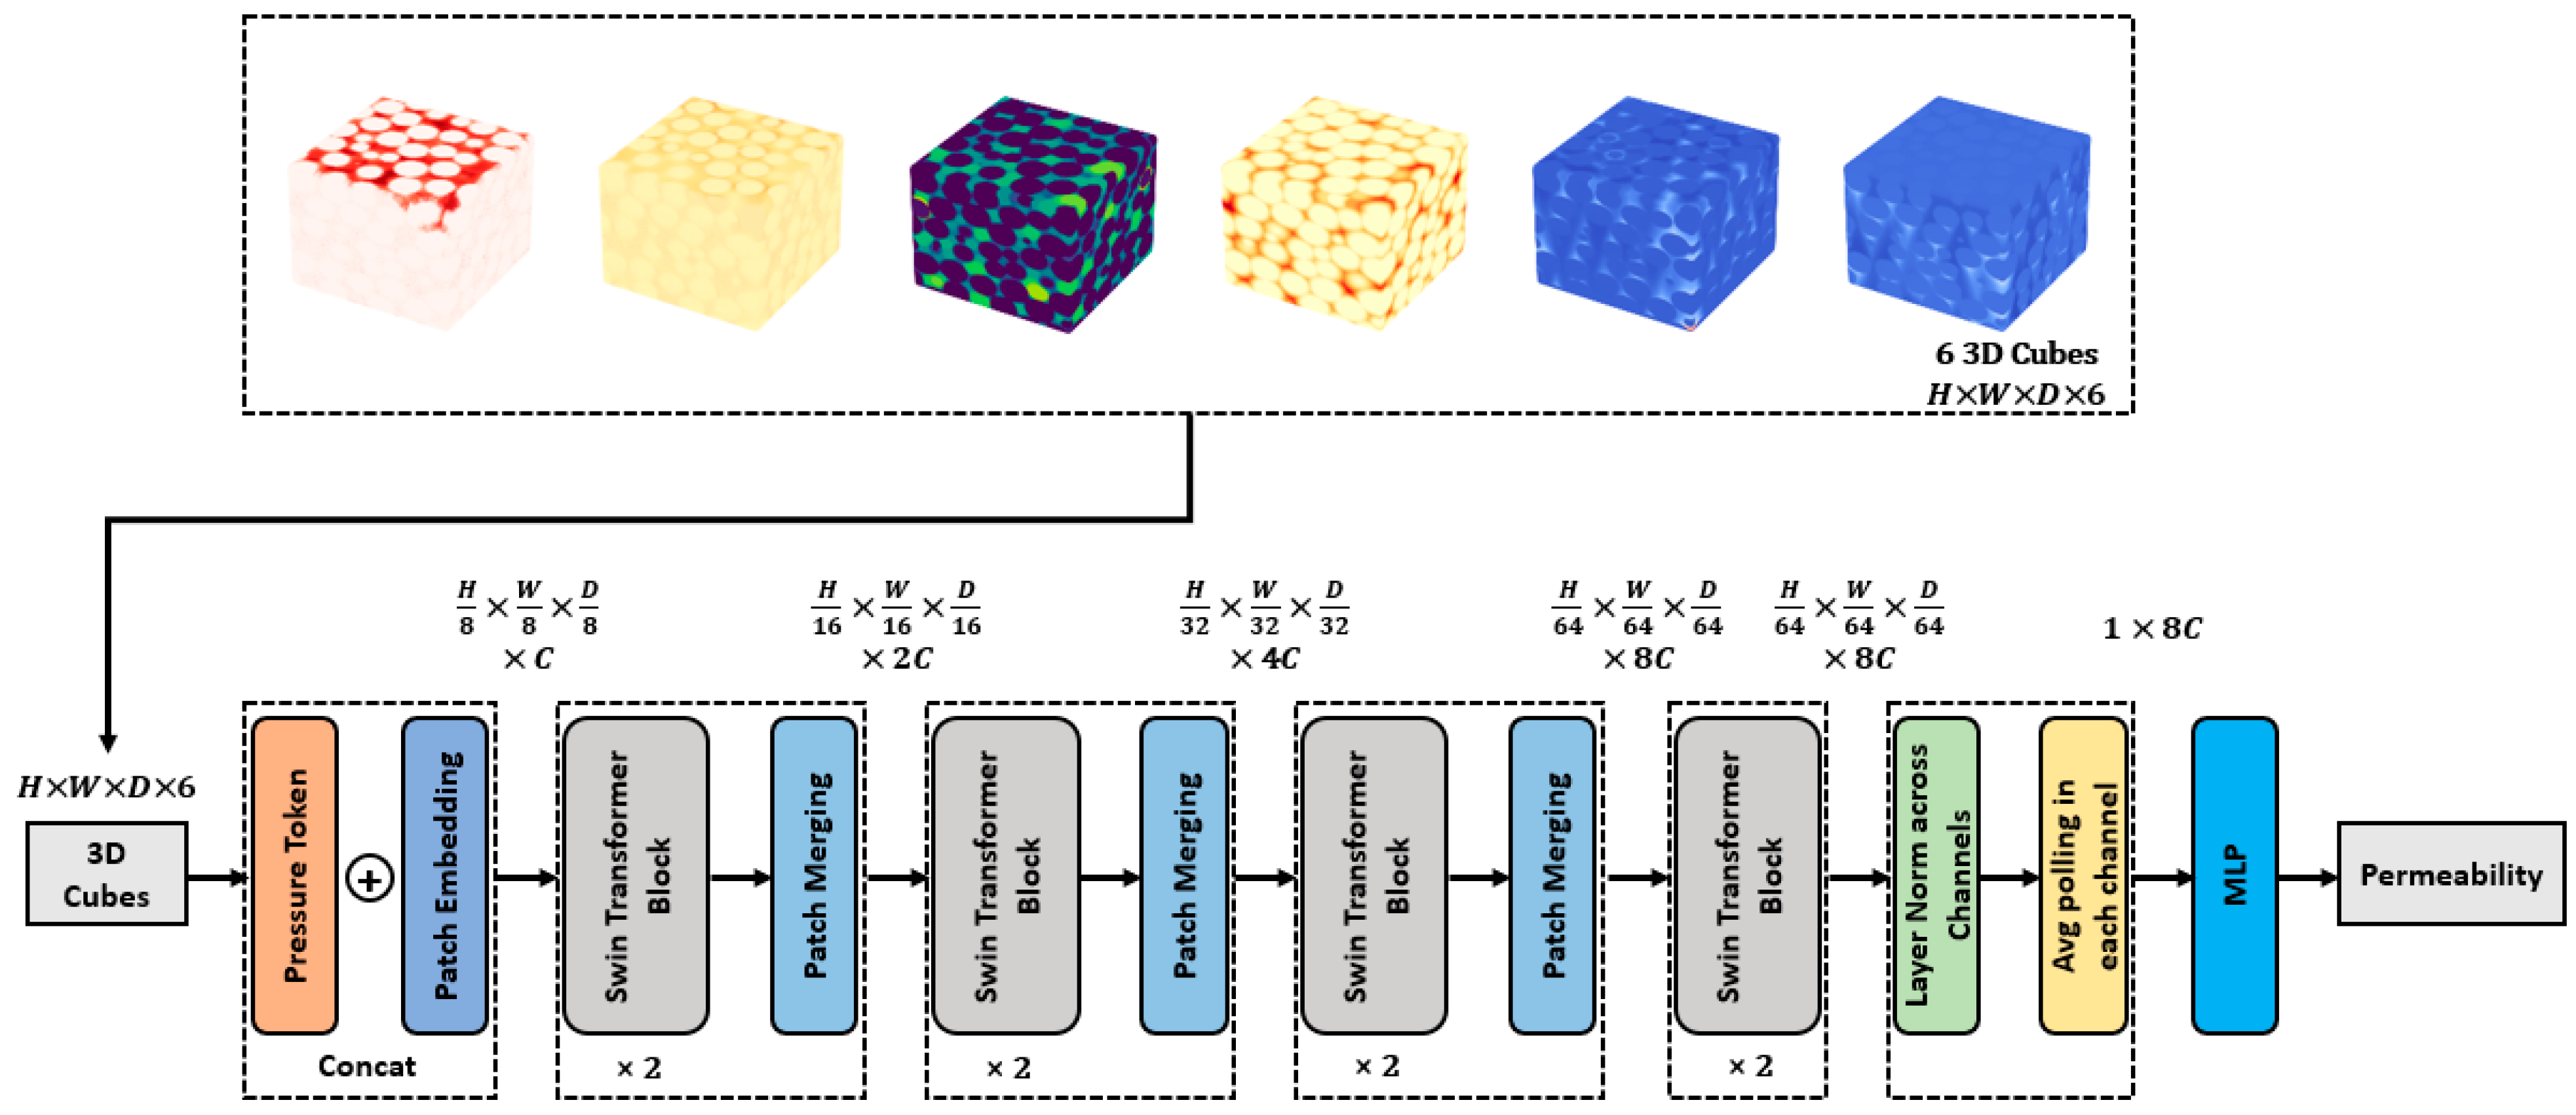
The Swin Transformer encoder backbone has been applied for solving 3D object detection, segmentation, and classification [47,48,49]. In this work, the encoder structure of 3D medical image segmentation conducted by Hatamizadeh et al. [48] was applied and a patch size of 8 × 8 × 8, instead of the original patch size of 4 × 4 × 4, was utilized to absorb more diverse geological information. The dataflow is shown as follows in Figure 2.
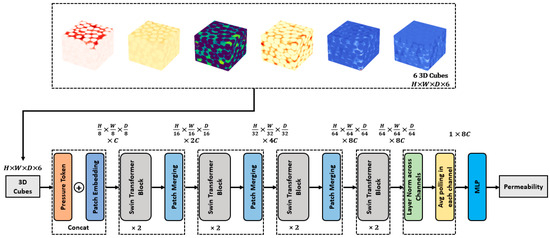
Figure 2.
Dataflow of the model. After data preprocessing, for each feature among MFP, elecuz, MIS3D, Edomain, tOfL, and tOfR, there is a 3D cube. Therefore, the input data has dimensions H × W × D × 6. In the experiment, the input dimension is 256 × 256 × 256 × 6.
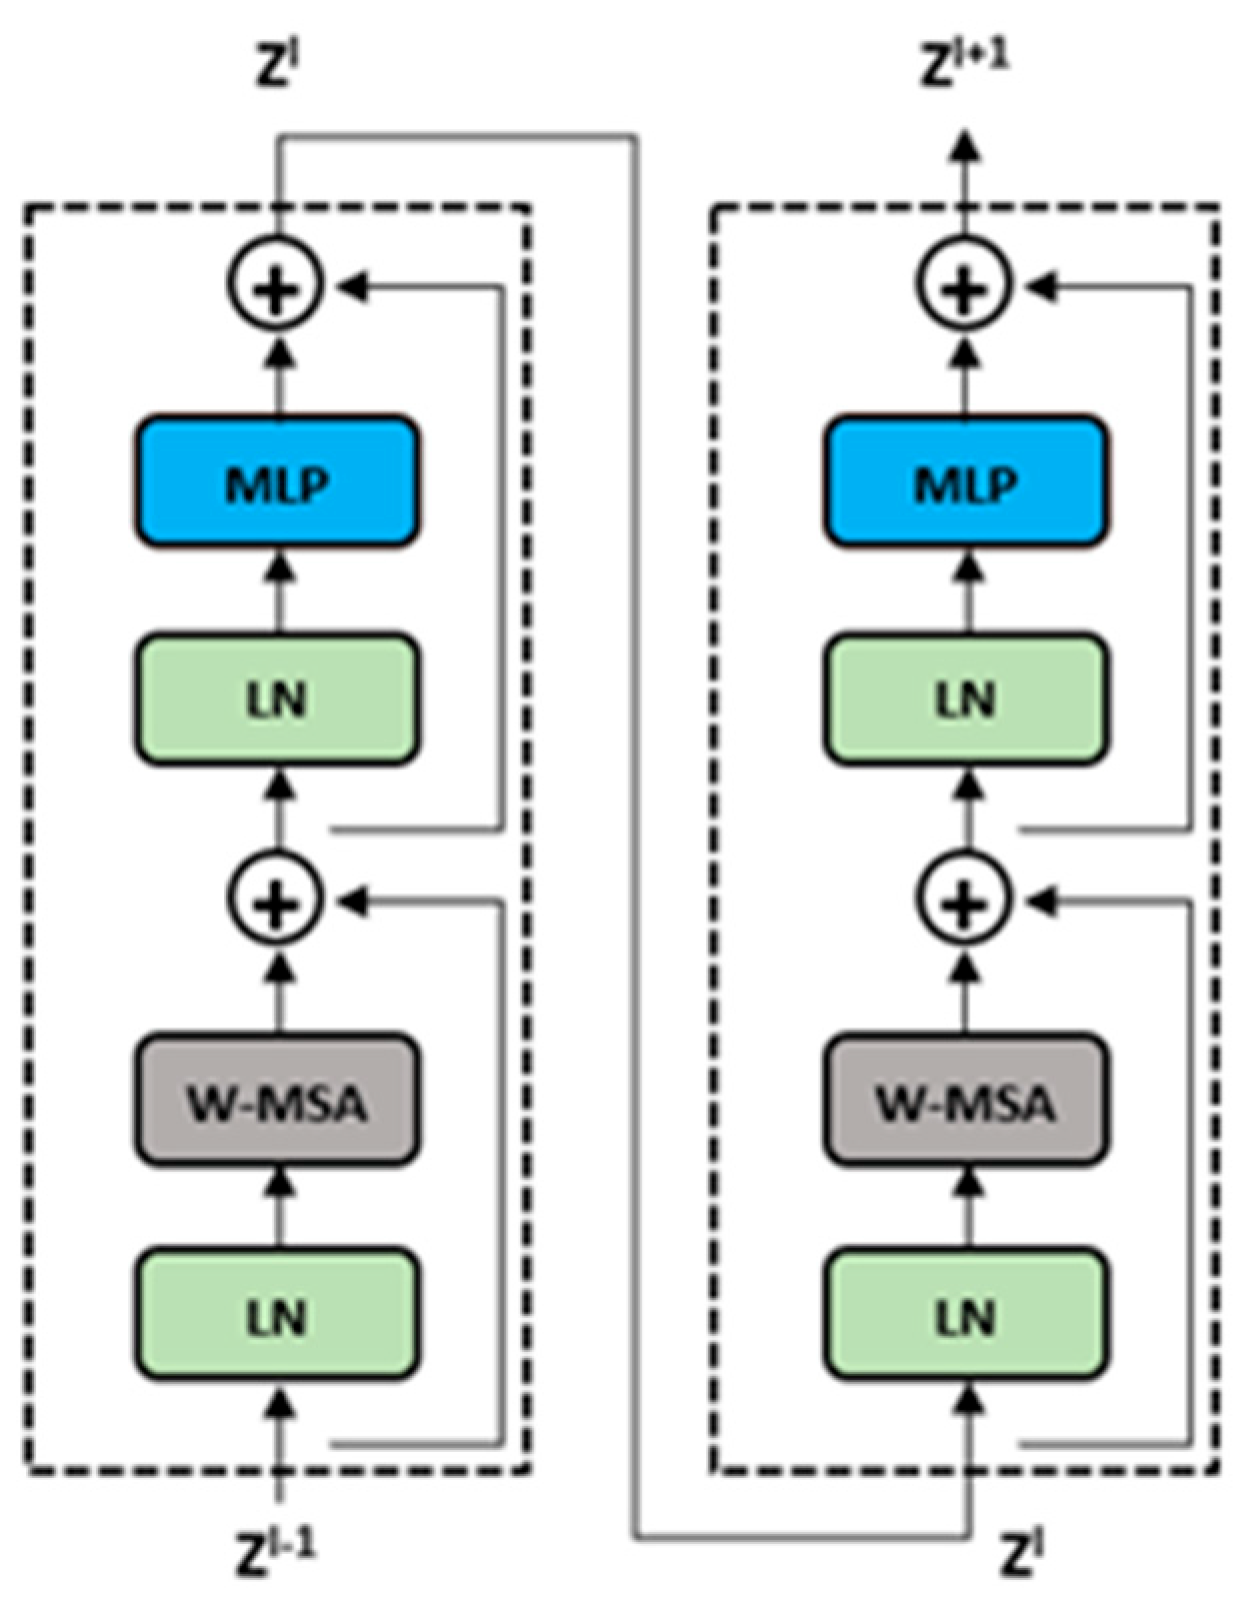
Figure 3 shows the details of the Swin Transformer block. The block is composed of two successive window-based self-attention blocks. The structure of the first block is window multi-head self-attention, and that of the second is shifted-window multi-head self-attention. Using successive blocks like these, a system can fully aggregate the geological information.
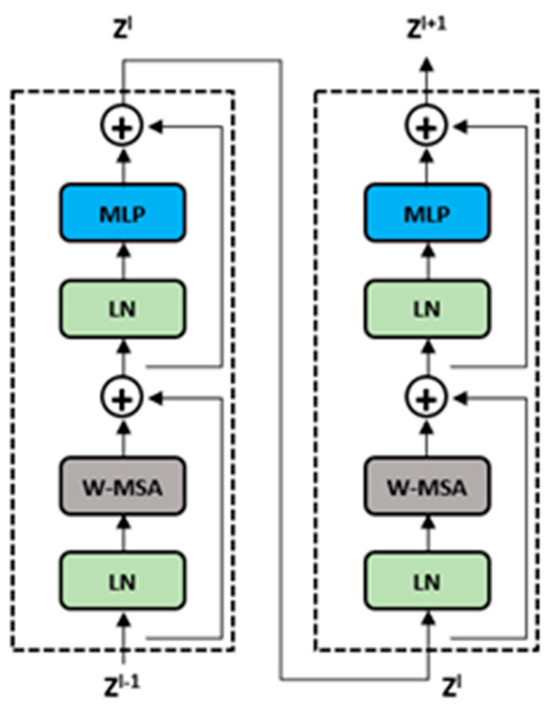
Figure 3.
Two successive Swin Transformer blocks.
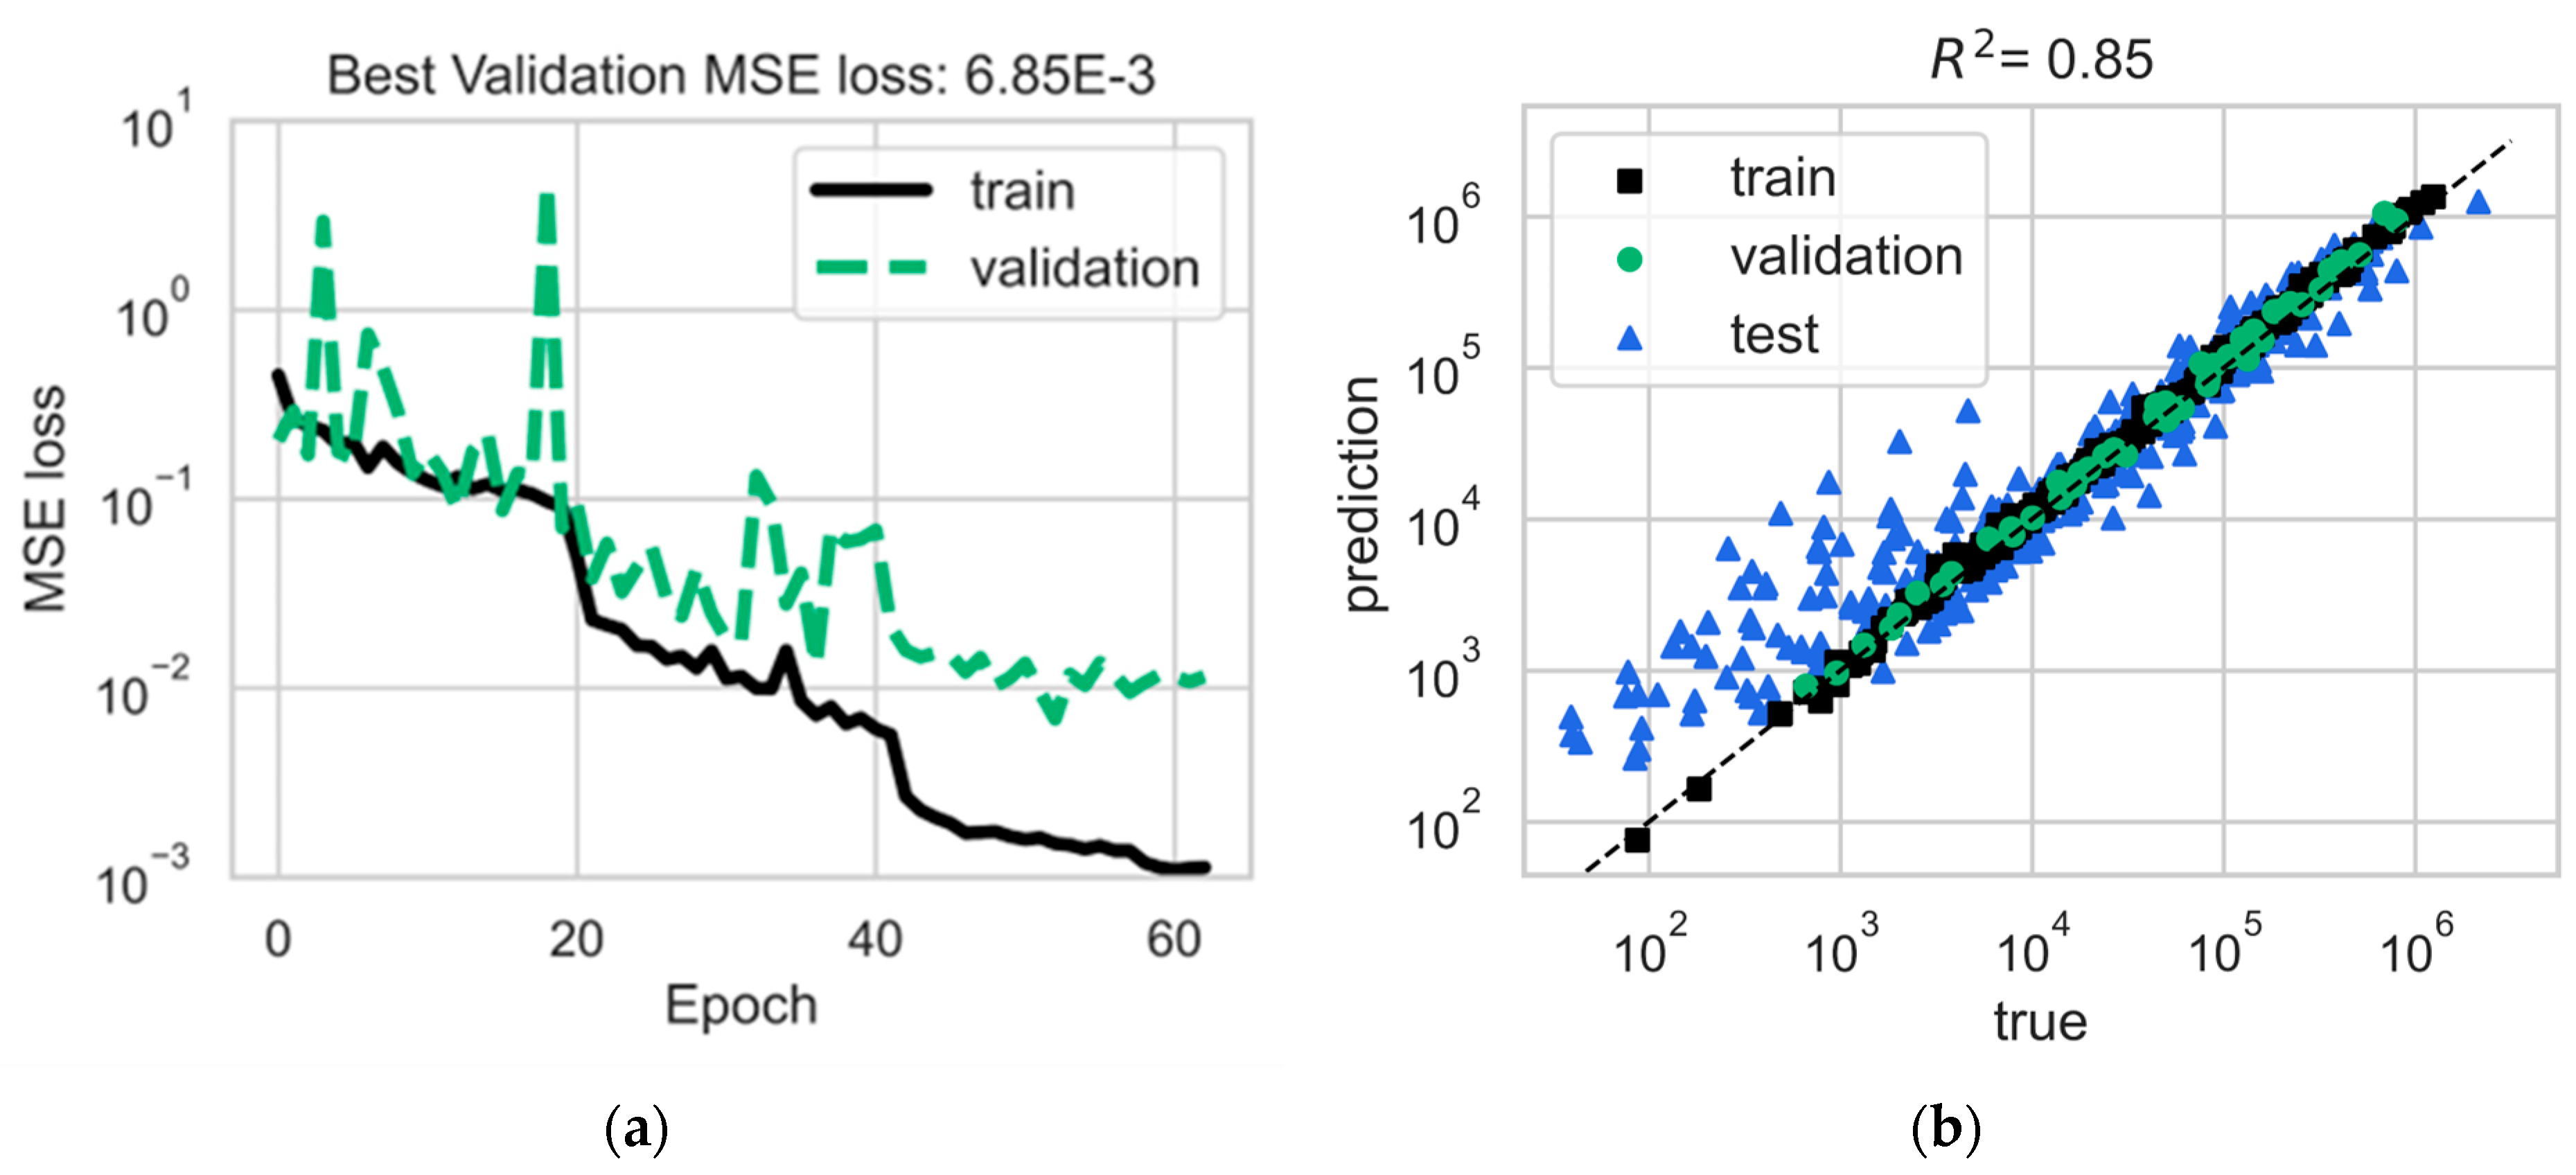
During the training process, data augmentation techniques (rotation of the 3D images) were applied to increase the number of training examples. The training loss and the testing performance are shown in Figure 4. The test set achieved an R2 score of 0.849. The prediction performance was comparatively better for higher-permeability objects (104 to 106) than those with lower permeability (102 to 104). This suggests that detecting low-permeability objects is comparatively complex compared to medium- and high-permeability objects [32]. In regard to industrial applications, conventional rock facies have higher-magnitude permeabilities compared to unconventional rock facies due to their pore network complexity. Because of this, it is an ideal practice to develop separate models to address facies complexity by assigning relative characteristics for the utilization of predictive models. The difference in accuracy between low-permeability objects versus high-permeability ones outlines the need to have separate models for permeability evaluations, because there are no predictive models that can predict the facies properties for both conventional and unconventional rocks. Alternatively, adding a facies type as a categorical parameter in the model could also serve the same purpose of creating separate models for specific type of facies. Adding facies types was not explored in this work because the dataset used was digital in nature and did not represent actual rock facies. The training set did not represent actual rock facies but the physics of several facies of varying permeability magnitudes.

Figure 4.
Model performance based on log10 (permeability). Left-hand-side image (a): Mean squared error (MSE) loss for training and validation sets during the training process. Right-hand-side image (b): R2 score for the test set.
The results include two graphs showing how well the CNN and Transformer combined model predicted the permeability throughout the training process and for the validation and testing phases.
In Figure 4a, a comparison of the mean squared error (abbreviated as MSE loss) plotted against the number of epoch iterations in a representation over time is shown. The graph displays the mean squared error (MESL), indicating the loss for both the training and validation sets over different epochs. The solid black line in the graph shows the training loss over time as the model learns from the training data during each epoch until it reaches a value at the end of training. The green dashed line represents the validation loss in the graph provided here. At first glance the validation loss decreases steadily but later on shows some fluctuations as the training proceeds, which hints at possible overfitting issues. With these fluctuations occurring throughout the training sessions, the best validation MSE loss is identified with a value of 6. 85 × 103, as indicated at the top of the plot. This value signifies that the model fits well with the validation data, yet there are fluctuations present that may require additional fine tuning or regularization to improve its performance further.
In Figure 4b, the plot shows the predicted permeability values compared to the values for the training set as well as the validation and testing sets. The model’s predictions on the training dataset are shown by the squares, which are situated near the diagonal line representing ideal prediction accuracy, suggesting that the model performed effectively on the training set. The green circles represent the validation data points; they align closely with the diagonal line as well, indicating the model’s ability to make accurate predictions using the validation data. The blue triangles indicate the model’s forecasts based on the test dataset. While there is a bit of variation in the points’ positions, most of them are fairly consistent, with the line suggesting that the model effectively adapts to new data. The plot has an R value. The model’s predictive accuracy is quantified at 0.85 across all the datasets. The value of 0.85 shows a connection between the estimated and actual values and affirms the model’s accuracy at predicting the permeability. The data shown in the figure indicates that the CNN Transformer model learns well from the training data and performs effectively on both the validation and test datasets, despite some minor fluctuations in the validation loss that may hint at potential overfitting.
The comparison between the predicted values and actual values indicates that the model has the potential to predict the permeability of porous materials. The model could be further refined to improve its reliability and predictive accuracy.
Although the study references CNNs in a comparative context, we acknowledge that a quantitative benchmarking experiment against standalone CNN architectures (e.g., pure 3D CNN models) was not conducted as part of this work. As such, we cannot definitively conclude that ViTs outperform CNNs without a controlled, side-by-side evaluation. Future work will include direct benchmarking between the Swin Transformer and baseline CNN models on the same dataset, allowing for a more robust comparison of their predictive performance and computational efficiency. This step will be essential for validating the relative advantages of ViTs in digital rock physics workflows.
To support the statement regarding the ViTs’ performance on the heterogeneous samples, we clarify that heterogeneity in this study is defined based on the normalized standard deviation of the pore-scale geometric features, including the MIS3D, edomain, and time of flight (tOfL). A sample is classified as heterogeneous if the combined standard deviation across these descriptors exceeds a threshold of 0.25, indicating pronounced structural variability. Approximately 42% of the dataset meets this heterogeneity criterion. When evaluated independently, the ViTs’ predictions on these samples achieved an average R2 of 0.87, compared to 0.81 for more homogeneous rocks, validating the claim that ViTs perform better in heterogeneous environments.
To ensure the reproducibility of this work, we provide detailed configuration settings for the model training. The Swin Transformer encoder was implemented with four hierarchical stages, each containing two encoder layers with window-based multi-head self-attention. Each attention layer used four attention heads, and the embedding dimension was set to 96. The training was conducted using the Adam optimizer with a learning rate of 1 × 10⁻⁴ and a batch size of eight. The loss function used was the mean squared error (MSE), and the model was trained for 150 epochs. Data augmentation was performed by applying random rotations along the spatial axes. The model was implemented in PyTorch (version 2.0.0) and trained on a NVIDIA A100 GPU with 80 GB memory, hosted on an Ubuntu 20.04 LTS environment. This hardware configuration enabled the efficient processing of 3D cubes with input dimensions of 256 × 256 × 256 × 6.
Although the dataset used in this study (Santos et al. [3]) consists of digitized rock samples with simulated transport properties, it does not contain laboratory-measured core permeability data for direct comparison. As such, we were not able to provide a tabulated side-by-side comparison of lab-based and model-predicted permeability values. However, the dataset includes high-fidelity simulations that are widely accepted as surrogates for SCAL results in digital rock physics workflows. For future work, we propose validating this method using paired micro-CT and SCAL core plug datasets, which would enable the direct benchmarking of the vision transformer model predictions against empirical measurements. This would further strengthen the practical utility and deployment potential of the proposed model.
The Swin Transformer architecture was selected due to its proven efficiency and scalability for processing high-dimensional data with spatial locality, which aligns well with the 3D nature of porous media. Unlike standard vision transformers that require global self-attention and struggle with long sequences (especially in 3D), Swin uses window-based attention with hierarchical feature maps, which dramatically reduces the computational cost while preserving performance. Although this study directly employed the Swin Transformer architecture without modifications, its shifted-window mechanism inherently supports local neighborhood learning, which is beneficial for representing multiscale pore structures. We acknowledge that further optimization—such as incorporating geometric priors, adaptive windowing, or attention map sparsification—could enhance the model’s specialization for geological image data. These refinements are proposed as future directions for advancing ViT architectures in subsurface modeling.
7. Discussion
In this study, a thorough ablation analysis delves into the aspects and methods that enhance the performance of the vision transformer (ViT) model when predicting permeability levels, shedding light on the key components of the model’s structure and training methods that play a significant role in shaping the outcome.
7.1. Ablation Analysis
This study, while removing factors, emphasizes the need to add in-depth information, such as advanced physics-based attributes and data enhancement methods to improve the model’s effectiveness. The numbers for the mean squared error (MSE) and R-square (R2) shown in Table 4 indicate that these components are not just extras but crucial for making predictions. To be more specific, including physical occurrences and data enhancement is crucial for guaranteeing that the model grasps the subtle qualities of rock permeability.
Table 4.
Ablation analysis, mean squared error (MSE), and R-square.
During training on the training set, several structures and tricks in the model played important roles in achieving a good result. Table 4 presents the ablation analysis of those structures and tricks.
The ablation analysis reveals that complex information, which includes complex physics and data augmentation, is necessary for successful ViT model training to ensure that the relevant rock characteristics are included for permeability prediction.
7.2. The Influence of Pressure Tokens
An important discovery made during the ablation analysis is the significance of the pressure token in the model’s design. In this model’s design proposal, a pressure token is incorporated to address changes in permeability across varying pressure situations. The presence of this token is shown to be essential. Removing it leads to a decrease in the R2 value from 0.85 to 0.69. This outcome highlights the necessity of considering pressure fluctuations when predicting permeability since permeability is intrinsically tied to pressure levels. The pressure token helps the model distinguish between pressure situations to make more precise forecasts in different conditions.
7.3. The Role of Characteristics in Enhancing Outcomes
The model not only considers the mean free path (mfp) but also incorporates six other electrical and geometric characteristics, like maximal inscribed spheres (MIS) and electrical conductivity (elecuz). Adding these features greatly improves the model’s ability to predict outcomes, as shown by a decrease in the R2 value from 0.85 to 0.75 when these factors are left out. This discovery emphasizes that permeability is a property influenced by various factors beyond just pore size. The extra characteristics offer insight into how pores are structured and how fluids flow through them, which helps in making more precise forecasts with and without data augmentation.
Data augmentation plays a role in training the model by expanding the dataset through rotation in the width and length dimensions to introduce variability that improves its generalization ability. The analysis indicates that excluding data augmentation results in an R2 value decrease to 0.72. In essence, data augmentation prevents overfitting and enhances the model’s capacity to learn from a range of examples. While rotational augmentation helps simulate variability in spatial orientation, we acknowledge that the augmentation strategy was limited in scope. Other techniques, such as elastic deformation, Gaussian noise injection, or cutout could further improve the model’s robustness to detect subtle shape variations and imaging artifacts, particularly for complex or underrepresented facies. Integrating such augmentations in future work could enhance the generalization capability of the model, especially when applied to datasets with greater lithological diversity or lower signal-to-noise ratios. Through the simulation of perspectives and situations, the model gains resilience and an improved capability to manage unfamiliar data in testing scenarios.
The results of this discussion indicate that the ViT model’s effectiveness at forecasting permeability is not solely attributed to one aspect but that a blend of sophisticated methods and attributes is at play here. The mentioned factors, like pressure token use, data augmentation, and the incorporation of electrical and geometric properties, all contribute significantly to understanding the intricate dynamics influencing the permeability of porous media. The model’s capacity to harmonize these components and uphold a strong predictive capability under different scenarios showcases its promise as a valuable instrument for real-time permeability prognostication.
In addition to the useful information for enhancing future models that analyzing the effects of removing elements gives us, it also hints at the possibility of making progress by delving into the physical factors for fine tuning the methods for augmenting the data and improving how intricate physics is incorporated into the model’s structure. These upgrades could result in improved predictability and wider usefulness across geological environments.
Our proposed model applies rotation within the width and length dimensions as data augmentation. This practice increases the size of the training set. Without augmentation, the R2 drops to 0.72. We inject air at different pressures into different tests, leading to different mfps (one of the inputs).
7.4. Model’s Limitations in Low-Permeability Regimes and Proposed Improvements
The lower predictive performance observed for permeability values in the range of 102 to 104 is attributable to the limited sensitivity of the current feature set to extremely narrow pore structures and high tortuosity—key characteristics of shale formations. In such low-permeability regimes, conventional geometric descriptors, such as the MIS3D and mean free path, may not sufficiently resolve subtle pore-throat constraints, especially when the voxel resolution is a limiting factor. Moreover, the lack of representative shale facies in the digital dataset may have restricted the model’s learning on such patterns.
To enhance the model’s performance on low-permeability samples, future improvements could include the following: (1) incorporating higher-resolution micro-CT data for better visibility of nanopore features; (2) expanding the training dataset with more shale-specific samples, including kerogen-rich facies and laminated textures; and (3) integrating advanced features, such as tortuosity indices, surface-area-to-volume ratios, or even multi-physics simulation outputs (e.g., adsorption–diffusion interactions), to better capture flow-restricting structures. Additionally, a multi-task learning framework that predicts both the permeability and facies type concurrently could improve generalization in these complex regimes. These strategies aim to strengthen the applicability of the proposed method to shale reservoir characterization and make it more suitable for deployment in ultra-low-permeability formations.
Although the dataset used in this study (Santos et al. [3]) consists of digitized rock samples with simulated transport properties, it does not contain laboratory-measured core permeability data for direct comparison. As such, we are not able to provide a tabulated side-by-side comparison between lab-based and model-predicted permeability values. However, the dataset includes high-fidelity simulations that are widely accepted as surrogates for SCAL results in digital rock physics workflows. For future work, we propose validating this method using paired micro-CT and SCAL core plug datasets, which would enable the direct benchmarking of the vision transformer model predictions against empirical measurements. This would further strengthen the practical utility and deployment potential of the proposed model.
In terms of scope, the proposed model is currently best suited for high-resolution volumetric datasets (voxel size: 0.5–5 μm) derived from micro-CT scanning or synthetic digital cores similar to those in the Santos et al. [3] dataset. It demonstrates a strong performance on porous media with clearly resolved pore networks, such as spherepacks, sandstones, and moderately heterogeneous carbonates. However, for nanoporous or highly anisotropic rocks such as shales, the model’s accuracy may diminish without adjustments to the resolution or feature extraction. In addition, although the ViT-based model can technically be integrated with existing digital core workflows, its operational deployment may require additional developments, such as automated segmentation modules, interface design for cloud platforms, or batch-processing pipelines. Future work should address these integration pathways and validate the model’s performance across core plug datasets from multiple lithofacies and acquisition systems.
8. Conclusions
Understanding permeability accurately is crucial for developing our knowledge of fluid behavior in porous materials—a necessity in disciplines like petroleum engineering, hydrogeology and environmental science. The usual techniques for predicting permeability—like core measurements and petrophysical models—have been the norm for a while. Yet they face obstacles, such as rock types’ local differences and the natural restrictions of size and detail. The need for precise predictive models is growing alongside the rising complexity of subsurface environments.
This research explores the use of vision transformers (ViTs) for predicting permeability in a way that differs from the typical reliance on convolutional neural networks (CNNs). By taking advantage of ViTs’ special features, like improved feature extraction and the ability to understand long-distance relationships in datasets more effectively than CNN models can so far, this study shows how ViTs have the potential to outperform CNN models when it comes to predicting permeability in different types of rocks.
Extensive tests on rock samples have shown that ViTs can outperform CNNs in predictive accuracy when properly trained. This progress underscores the potential of ViTs as a tool for predicting permeability in real time, and their ability to adapt to the diverse conditions found in real-world underground settings. ViTs’ capability to predict permeability accurately across different types of rocks and in the face of substantial heterogeneity marks a significant advancement in this field.
Furthermore, this research presents an opportunity for improving ViT-based models. A promising direction for future studies involves including the facies types as a categorical factor in the predictive model. By incorporating geological and petrophysical information into the ViT framework we could potentially improve predictions to a greater extent, strengthening the model’s reliability and usefulness in various geological scenarios.
In summary, this study highlights the impact of vision transformers on predicting the permeability of subsurface explorations, offering a fresh approach for enhanced accuracy and productivity. As the industry progresses, incorporating cutting-edge AI technologies, such as ViTs, is expected to be crucial for addressing the constraints of current practices, facilitating better informed choices for extracting resources and managing the environment and other related areas. Further developing and fine tuning these models will be essential to realize their capabilities and tackle the obstacles presented by the growing intricacies of subsurface environments.
Author Contributions
C.T.: technical guidance and organization; U.O.: simulations, K.L.: simulations; L.L.: technical guidance; S.T.: technical guidance; and J.S.: technical guidance. All authors have read and agreed to the published version of the manuscript.
Funding
This research received no external funding.
Data Availability Statement
The computer code is available at https://github.com/LeeGorden/Permeability-Prediction-using-Vision-Transformers.
Acknowledgments
The authors acknowledge UT Austin and Aramco Americas for providing the high-end computational resources. The authors also gratefully acknowledge Emre Can Dündar for his substantial contribution to the technical revision and refinement of the manuscript for publication.
Conflicts of Interest
Uchenna Odi was employed by Aramco Americas. The remaining authors declare that the research was conducted in the absence of any commercial or financial relationships that could be construed as a potential conflict of interest.
References
- Da Wang, Y.; Blunt, M.J.; Armstrong, R.T.; Mostaghimi, P. Deep learning in pore scale imaging and modeling. Earth-Sci. Rev. 2021, 215, 103555. [Google Scholar] [CrossRef]
- Dosovitskiy, A.; Beyer, L.; Kolesnikov, A.; Weissenborn, D.; Zhai, X.; Unterthiner, T.; Dehghani, M.; Minderer, M.; Heigold, G.; Gelly, S.; et al. An image is worth 16x16 words: Transformers for image recognition at scale. arXiv 2020, arXiv:2010.11929. [Google Scholar]
- Santos, J.E.; Chang, B.; Gigliotti, A.; Yin, Y.; Song, W.; Prodanović, M.; Kang, Q.; Lubbers, N.; Viswanathan, H. A Dataset of 3D Structural and Simulated Transport Properties of Complex Porous Media. Sci. Data 2022, 9, 579. [Google Scholar] [CrossRef] [PubMed]
- Rahmanifard, H.; Plaksina, T. Application of artificial intelligence techniques in the petroleum industry: A review. Artif. Intell. Rev. 2019, 52, 2295–2318. [Google Scholar] [CrossRef]
- Kuang, L.; Liu, H.; Ren, Y.; Luo, k.; Shi, M.; Su, J.; Li, X. Application and development trend of artificial intelligence in petroleum exploration and development. Pet. Explor. Dev. 2021, 48, 1–14. [Google Scholar] [CrossRef]
- Ng, C.S.W.; Amar, M.N.; Ghahfarokhi, A.J.; Imsland, L.S. A survey on the application of machine learning and metaheuristic algorithms for intelligent proxy modeling in reservoir simulation. Comput. Chem. Eng. 2023, 170, 108107. [Google Scholar] [CrossRef]
- Muther, T.; Syed, F.I.; Dahaghi, A.K.; Negahban, S. Socio-inspired multi-cohort intelligence and teaching-learning-based optimization for hydraulic fracturing parameters design in tight formations. J. Energy Resour. Technol. 2022, 144, 073201. [Google Scholar] [CrossRef]
- Zhang, D.; Lin, J.; Peng, Q.; Wang, D.; Yang, T.; Sorooshian, S.; Liu, X.; Zhuang, J. Modeling and simulating of reservoir operation using the artificial neural network, support vector regression, deep learning algorithm. J. Hydrol. 2018, 565, 720–736. [Google Scholar] [CrossRef]
- Kubeyev, A. Enhancing multi-physics modelling with deep learning: Predicting permeability through structural discontinuities. Eng. Appl. Artif. Intell. 2023, 124, 106562. [Google Scholar] [CrossRef]
- Yang, L.; Fomel, S.; Wang, S.; Chen, X.; Chen, W.; Saad, O.M.; Chen, Y. Porosity and permeability prediction using a transformer and periodic long short-term network. Geophysics 2023, 88, WA293–WA308. [Google Scholar] [CrossRef]
- Meng, Y.; Jiang, J.; Wu, J.; Wang, D. Transformer-based deep learning models for predicting permeability of porous media. Adv. Water Resour. 2023, 179, 104520. [Google Scholar] [CrossRef]
- Zhang, D.; Li, H. Efficient Surrogate Modeling Based on Improved Vision Transformer Neural Network for History Matching. SPE J. 2023, 28, 3046–3062. [Google Scholar] [CrossRef]
- Liu, L.; Santos, J.E.; Prodanović, M.; Pyrcz, M.J. Mitigation of spatial nonstationarity with vision transformers. Comput. Geosci. 2023, 178, 105412. [Google Scholar] [CrossRef]
- Lubbers, N.; Agarwal, A.; Chen, Y.; Son, S.; Mehana, M.; Kang, Q.; Karra, S.; Junghans, C.; Germann, T.C.; Viswanathan, H.S. Modeling and scale-bridging using machine learning: Nanoconfinement effects in porous media. Sci. Rep. 2020, 10, 13312. [Google Scholar] [CrossRef]
- Liu, M.; Kwon, B.; Kang, P.K. Machine learning to predict effective reaction rates in 3D porous media from pore structural features. Sci. Rep. 2022, 12, 5486. [Google Scholar] [CrossRef]
- Eberhard, U.; Seybold, H.J.; Secchi, E.; Jimenez-Martinez, J.; Rühs, P.A.; Ofner, A.; Andrade, J.S., Jr.; Holzner, M. Mapping the local viscosity of non-Newtonian fluids flowing through disordered porous structures. Sci. Rep. 2020, 10, 11733. [Google Scholar] [CrossRef]
- Kamrava, S.; Sahimi, M.; Tahmasebi, P. Simulating fluid flow in complex porous materials by integrating the governing equations with deep-layered machines. npj Comput. Mater. 2021, 7, 127. [Google Scholar] [CrossRef]
- Graczyk, K.M.; Strzelczyk, D.; Matyka, M. Deep learning for diffusion in porous media. Sci. Rep. 2023, 13, 9769. [Google Scholar] [CrossRef]
- Andrew, M. Permeability prediction using multivariant structural regression. E3S Web Conf. 2020, 146, 04001. [Google Scholar] [CrossRef]
- Abbasi, N. Evaluation of Digital Rock Physics for Routine and Special Core Analysis. In Proceedings of the 76th EAGE Conference and Exhibition 2014, Amsterdam, The Netherlands, 16–19 June 2014; European Association of Geoscientists & Engineers: Utrecht, The Netherlands, 2014; pp. 1–5. [Google Scholar]
- Mahmoud, A.; Gajbhiye, R.; Li, J.; Dvorkin, J.; Hussaini, S.R.; AlMukainah, H.S. Digital rock physics (DRP) workflow to assess reservoir flow characteristics. Arab. J. Geosci. 2023, 16, 248. [Google Scholar] [CrossRef]
- Sadeghnejad, S.; Enzmann, F.; Kersten, M. Digital rock physics, chemistry, and biology: Challenges and prospects of pore-scale modelling approach. Appl. Geochem. 2021, 131, 105028. [Google Scholar] [CrossRef]
- Dash, S.; Shakyawar, S.K.; Sharma, M.; Kaushik, S. Big data in healthcare: Management, analysis and future prospects. J. Big data 2019, 6, 54. [Google Scholar] [CrossRef]
- Guo, Y.; Yang, Z.; Feng, S.; Hu, J. Complex power system status monitoring and evaluation using big data platform and machine learning algorithms: A review and a case study. Complexity 2018, 2018, 8496187. [Google Scholar] [CrossRef]
- Karimpouli, S.; Tahmasebi, P. Segmentation of digital rock images using deep convolutional autoencoder networks. Comput. Geosci. 2019, 126, 142–150. [Google Scholar] [CrossRef]
- Tariq, Z.; Aljawad, M.S.; Hasan, A.; Murtaza, M.; Mohammed, E.; El-Husseiny, A.; Alarifi, S.A.; Mahmoud, M.; Abdulraheem, A. A systematic review of data science and machine learning applications to the oil and gas industry. J. Pet. Explor. Prod. Technol. 2021, 11, 4339–4374. [Google Scholar] [CrossRef]
- Alouffi, B.; Hasnain, M.; Alharbi, A.; Alosaimi, W.; Alyami, H.; Ayaz, M. A systematic literature review on cloud computing security: Threats and mitigation strategies. IEEE Access 2021, 9, 57792–57807. [Google Scholar] [CrossRef]
- Omar, I.A.; Jayaraman, R.; Salah, K.; Simsekler, M.C.E.; Yaqoob, I.; Ellahham, S. Ensuring protocol compliance and data transparency in clinical trials using Blockchain smart contracts. BMC Med. Res. Methodol. 2020, 20, 224. [Google Scholar] [CrossRef]
- Pande, P.K.; Clark, M.B.; Blasingame, T.A.; Doublet, L. Data Acquisition Design and Implementation: Opportunities and Challenges for Effective Programs in Mature Reservoirs. In Proceedings of the SPE Improved Oil Recovery Symposium, Tulsa, OK, USA, 17–20 April 1994; p. SPE-27760. [Google Scholar]
- Temizel, C.; Nabizadeh, M.; Kadkhodaei, N.; Ranjith, R.; Suhag, A.; Balaji, K.; Dhannoon, D. Data-driven optimization of injection/production in waterflood operations. In Proceedings of the SPE Middle East Intelligent Oil and Gas Symposium 2017, Manama, Bahrain, 6–9 March 2017; p. SPE-187468. [Google Scholar]
- Guiltinan, E.; Estrada Santos, J.; Kang, Q.; Cardenas, B.; Espinoza, D.N. Fractures with Variable Roughness and Wettability. Available online: https://digitalporousmedia.org/published-datasets/tapis/projects/drp.project.published/drp.project.published.DRP-314 (accessed on 4 March 2025).
- Xu, R.; Prodanović, M.; Landry, C. Pore-Scale Study of Water Adsorption and Subsequent Methane Transport in Clay in the Presence of Wettability Heterogeneity. Water Resour. Res. 2020, 56, e2020WR027568. [Google Scholar] [CrossRef]
- Daigle, H.; Cook, A.; Fang, Y.; Bihani, A.; Song, W.; Flemings, P.B. Gas-driven tensile fracturing in shallow marine sediments. J. Geophys. Res. Solid Earth 2020, 125, e2020JB020835. [Google Scholar] [CrossRef]
- Gostick, J.T.; Fowler, M.W.; Pritzker, M.D.; Ioannidis, M.A.; Behra, L.M. In-plane and through-plane gas permeability of carbon fiber electrode backing layers. J. Power Sources 2006, 162, 228–238. [Google Scholar] [CrossRef]
- Wark, D.A.; Watson, E.B. Grain-scale permeabilities of texturally equilibrated, monomineralic rocks. Earth Planet. Sci. Lett. 1998, 164, 591–605. [Google Scholar] [CrossRef]
- Blunt, M.J. Multiphase Flow in Permeable Media: A Pore-Scale Perspective; Cambridge University Press: Cambridge, UK, 2017. [Google Scholar]
- Ehrenberg, S.N.; Nadeau, P.H. Sandstone vs. carbonate petroleum reservoirs: A global perspective on porosity-depth and porosity-permeability relationships. AAPG Bull. 2005, 89, 435–445. [Google Scholar] [CrossRef]
- Wildenschild, D.; Sheppard, A.P. X-ray imaging and analysis techniques for quantifying pore-scale structure and processes in subsurface porous medium systems. Adv. Water Resour. 2013, 51, 217–246. [Google Scholar] [CrossRef]
- Worthington, P.F. The uses and abuses of the Archie equations, 1: The formation factor-porosity relationship. J. Appl. Geophys. 1993, 30, 215–228. [Google Scholar] [CrossRef]
- Santos, J.E.; Xu, D.; Jo, H.; Landry, C.J.; Prodanović, M.; Pyrcz, M.J. PoreFlow-Net: A 3D convolutional neural network to predict fluid flow through porous media. Adv. Water Resour. 2020, 138, 103539. [Google Scholar] [CrossRef]
- Wang, Y.D.; Chung, T.; Armstrong, R.T.; Mostaghimi, P. ML-LBM: Predicting and accelerating steady state flow simulation in porous media with convolutional neural networks. Transp. Porous Media 2021, 138, 49–75. [Google Scholar] [CrossRef]
- Santos, J.E.; Yin, Y.; Jo, H.; Pan, W.; Kang, Q.; Viswanathan, H.S.; Prodanović, M.; Pyrcz, M.J.; Lubbers, N. Computationally efficient multiscale neural networks applied to fluid flow in complex 3D porous media. Transp. Porous Media 2021, 140, 241–272. [Google Scholar] [CrossRef]
- Röding, M.; Ma, Z.; Torquato, S. Predicting permeability via statistical learning on higher-order microstructural information. Sci. Rep. 2020, 10, 15239. [Google Scholar] [CrossRef]
- Fu, J.; Wang, M.; Chen, B.; Wang, J.; Xiao, D.; Luo, M.; Evans, B. A data-driven framework for permeability prediction of natural porous rocks via microstructural characterization and pore-scale simulation. Eng. Comput. 2023, 39, 3895–3926. [Google Scholar] [CrossRef]
- Karimpouli, S.; Kadyrov, R.; Siegert, M.; Saenger, E.H. Applicability of 2D algorithms for 3D characterization in digital rocks physics: An example of a machine learning-based super resolution image generation. Acta Geophys. 2024, 72, 861–874. [Google Scholar] [CrossRef]
- Liu, Z.; Lin, Y.; Cao, Y.; Hu, H.; Wei, Y.; Zhang, Z.; Lin, S.; Guo, B. Swin transformer: Hierarchical vision transformer using shifted windows. In Proceedings of the IEEE/CVF International Conference on Computer Vision, Montreal, QC, Canada, 11–17 October 2021; pp. 10012–10022. [Google Scholar]
- Cao, H.; Wang, Y.; Chen, J.; Jiang, D.; Zhang, X.; Tian, Q.; Wang, M. Swin-unet: Unet-like pure transformer for medical image segmentation. In European Conference on Computer Vision; Springer Nature: Cham, Switzerland, 2022; pp. 205–218. [Google Scholar]
- Hatamizadeh, A.; Tang, Y.; Nath, V.; Yang, D.; Myronenko, A.; Landman, B.; Roth, H.R.; Xu, D. Unetr: Transformers for 3D medical image segmentation. In Proceedings of the IEEE/CVF Winter Conference on Applications of Computer Vision, Waikoloa, HI, USA, 3–8 January 2022; pp. 574–584. [Google Scholar]
- Tang, Y.; Yang, D.; Li, W.; Roth, H.R.; Landman, B.; Xu, D.; Nath, V.; Hatamizadeh, A. Self-supervised pre-training of swin transformers for 3D medical image analysis. In Proceedings of the IEEE/CVF Conference on Computer Vision and Pattern Recognition, New Orleans, LA, USA, 18–24 June 2022; pp. 20730–20740. [Google Scholar]
Disclaimer/Publisher’s Note: The statements, opinions and data contained in all publications are solely those of the individual author(s) and contributor(s) and not of MDPI and/or the editor(s). MDPI and/or the editor(s) disclaim responsibility for any injury to people or property resulting from any ideas, methods, instructions or products referred to in the content. |
© 2025 by the authors. Licensee MDPI, Basel, Switzerland. This article is an open access article distributed under the terms and conditions of the Creative Commons Attribution (CC BY) license (https://creativecommons.org/licenses/by/4.0/).