Abstract
Physical activity recognition using accelerometry is a rapidly advancing field with significant implications for healthcare, sports science, and wearable technology. This research presents an interesting approach for classifying physical activities using solely accelerometry data, signals that were taken from the available “MHEALTH dataset” and processed through artificial neural networks (ANNs). The methodology involves data acquisition, preprocessing, feature extraction, and the application of deep learning algorithms to accurately identify activity patterns. A major innovation in this study is the incorporation of a new feature derived from the radius of curvature. This time-domain feature is computed by segmenting accelerometry signals into windows, conducting double integration to derive positional data, and subsequently estimating a circumference based on the positional data obtained within each window. This characteristic is computed across the three movement planes, providing a robust and comprehensive feature for activity classification. The integration of the radius of curvature into the ANN models significantly enhances their accuracy, achieving over 95%. In comparison with other methodologies, our proposed approach, which utilizes a feedforward neural network (FFNN), demonstrates superior performance. This outperforms previous methods such as logistic regression, which achieved 93%, KNN models with 90%, and the InceptTime model with 88%. The findings demonstrate the potential of this model to improve the precision and reliability of physical activity recognition in wearable health monitoring systems.
1. Introduction
Physical inactivity is alarmingly recognized as the fourth leading risk factor for global mortality [1]. The close association between engaging in physical activities and sports with a range of health benefits is well-documented [2,3]. Consequently, enhancing lifestyles, promoting healthy behaviors, and mitigating chronic diseases have become critical priorities [4]. Furthermore, the integration of sophisticated technology and computing in healthcare plays an increasingly vital role in our daily lives, opening up numerous potential research areas, notably in Human Activity Recognition (HAR) [5,6].
1.1. Human Activity Recognition
HAR predominantly utilizes wearable devices to identify and categorize human physical activities in both controlled and uncontrolled settings. In recent years, HAR has gained prominence due to its extensive applications across various fields such as healthcare, sports science, video game development, and activity tracking [7]. Especially, HAR in healthcare plays a crucial role in monitoring, managing chronic conditions, promoting healthy lifestyles, detecting health issues early, and supporting personalized care, refs. [8,9,10]. It has the potential to enhance patient outcomes, optimize healthcare delivery, and contribute to advancements in medical research and public health initiatives. It can be implemented using data from different types of sensors; these are generally divided into two main categories: (1) environmental sensors, such as video cameras used in monitoring areas, which are limited by their need for fixed infrastructure [11,12], and (2) integrated sensors located within portable devices that enhance and expand the capabilities of human monitoring systems at any location [13].
Environmental sensors often require costly on-site installation for effective monitoring [14], while vision systems rely on cameras and are frequently perceived as intrusive [15]. The most widely used alternatives, wearable devices, have garnered significant attention from researchers due to their popularity, ease of use, and affordability. These devices are embedded in various gadgets such as smartphones, smartwatches, medical monitoring devices, or fitness bands [16,17].
Various studies have introduced HAR algorithms using signals captured by wearable sensors attached to different body parts, achieving commendable classification performance [18]. However, challenges arise with the discomfort users may experience when wearing sensors on specific body parts and the energy limitations of mobile devices. These sensors are often uncomfortable for users and do not provide a viable long-term solution. Hence, developing HAR algorithms that allow for the use of wearable devices on multiple body parts is an opportunity area [19,20,21,22].
One of the most effective sensors in HAR applications is the accelerometer. Given the advancements in integrated circuit technology, it can be worn continuously for days or even weeks, presenting a practical solution to the limitations related to energy consumption and wearer comfort. HAR, with accelerometers, utilizes these sensors to detect and classify human activities by analyzing their movement patterns. Accelerometers directly measure human body movements, responding to factors such as frequency, intensity, and inclination [23]. This allows for the accurate monitoring of physical activities in real-time.
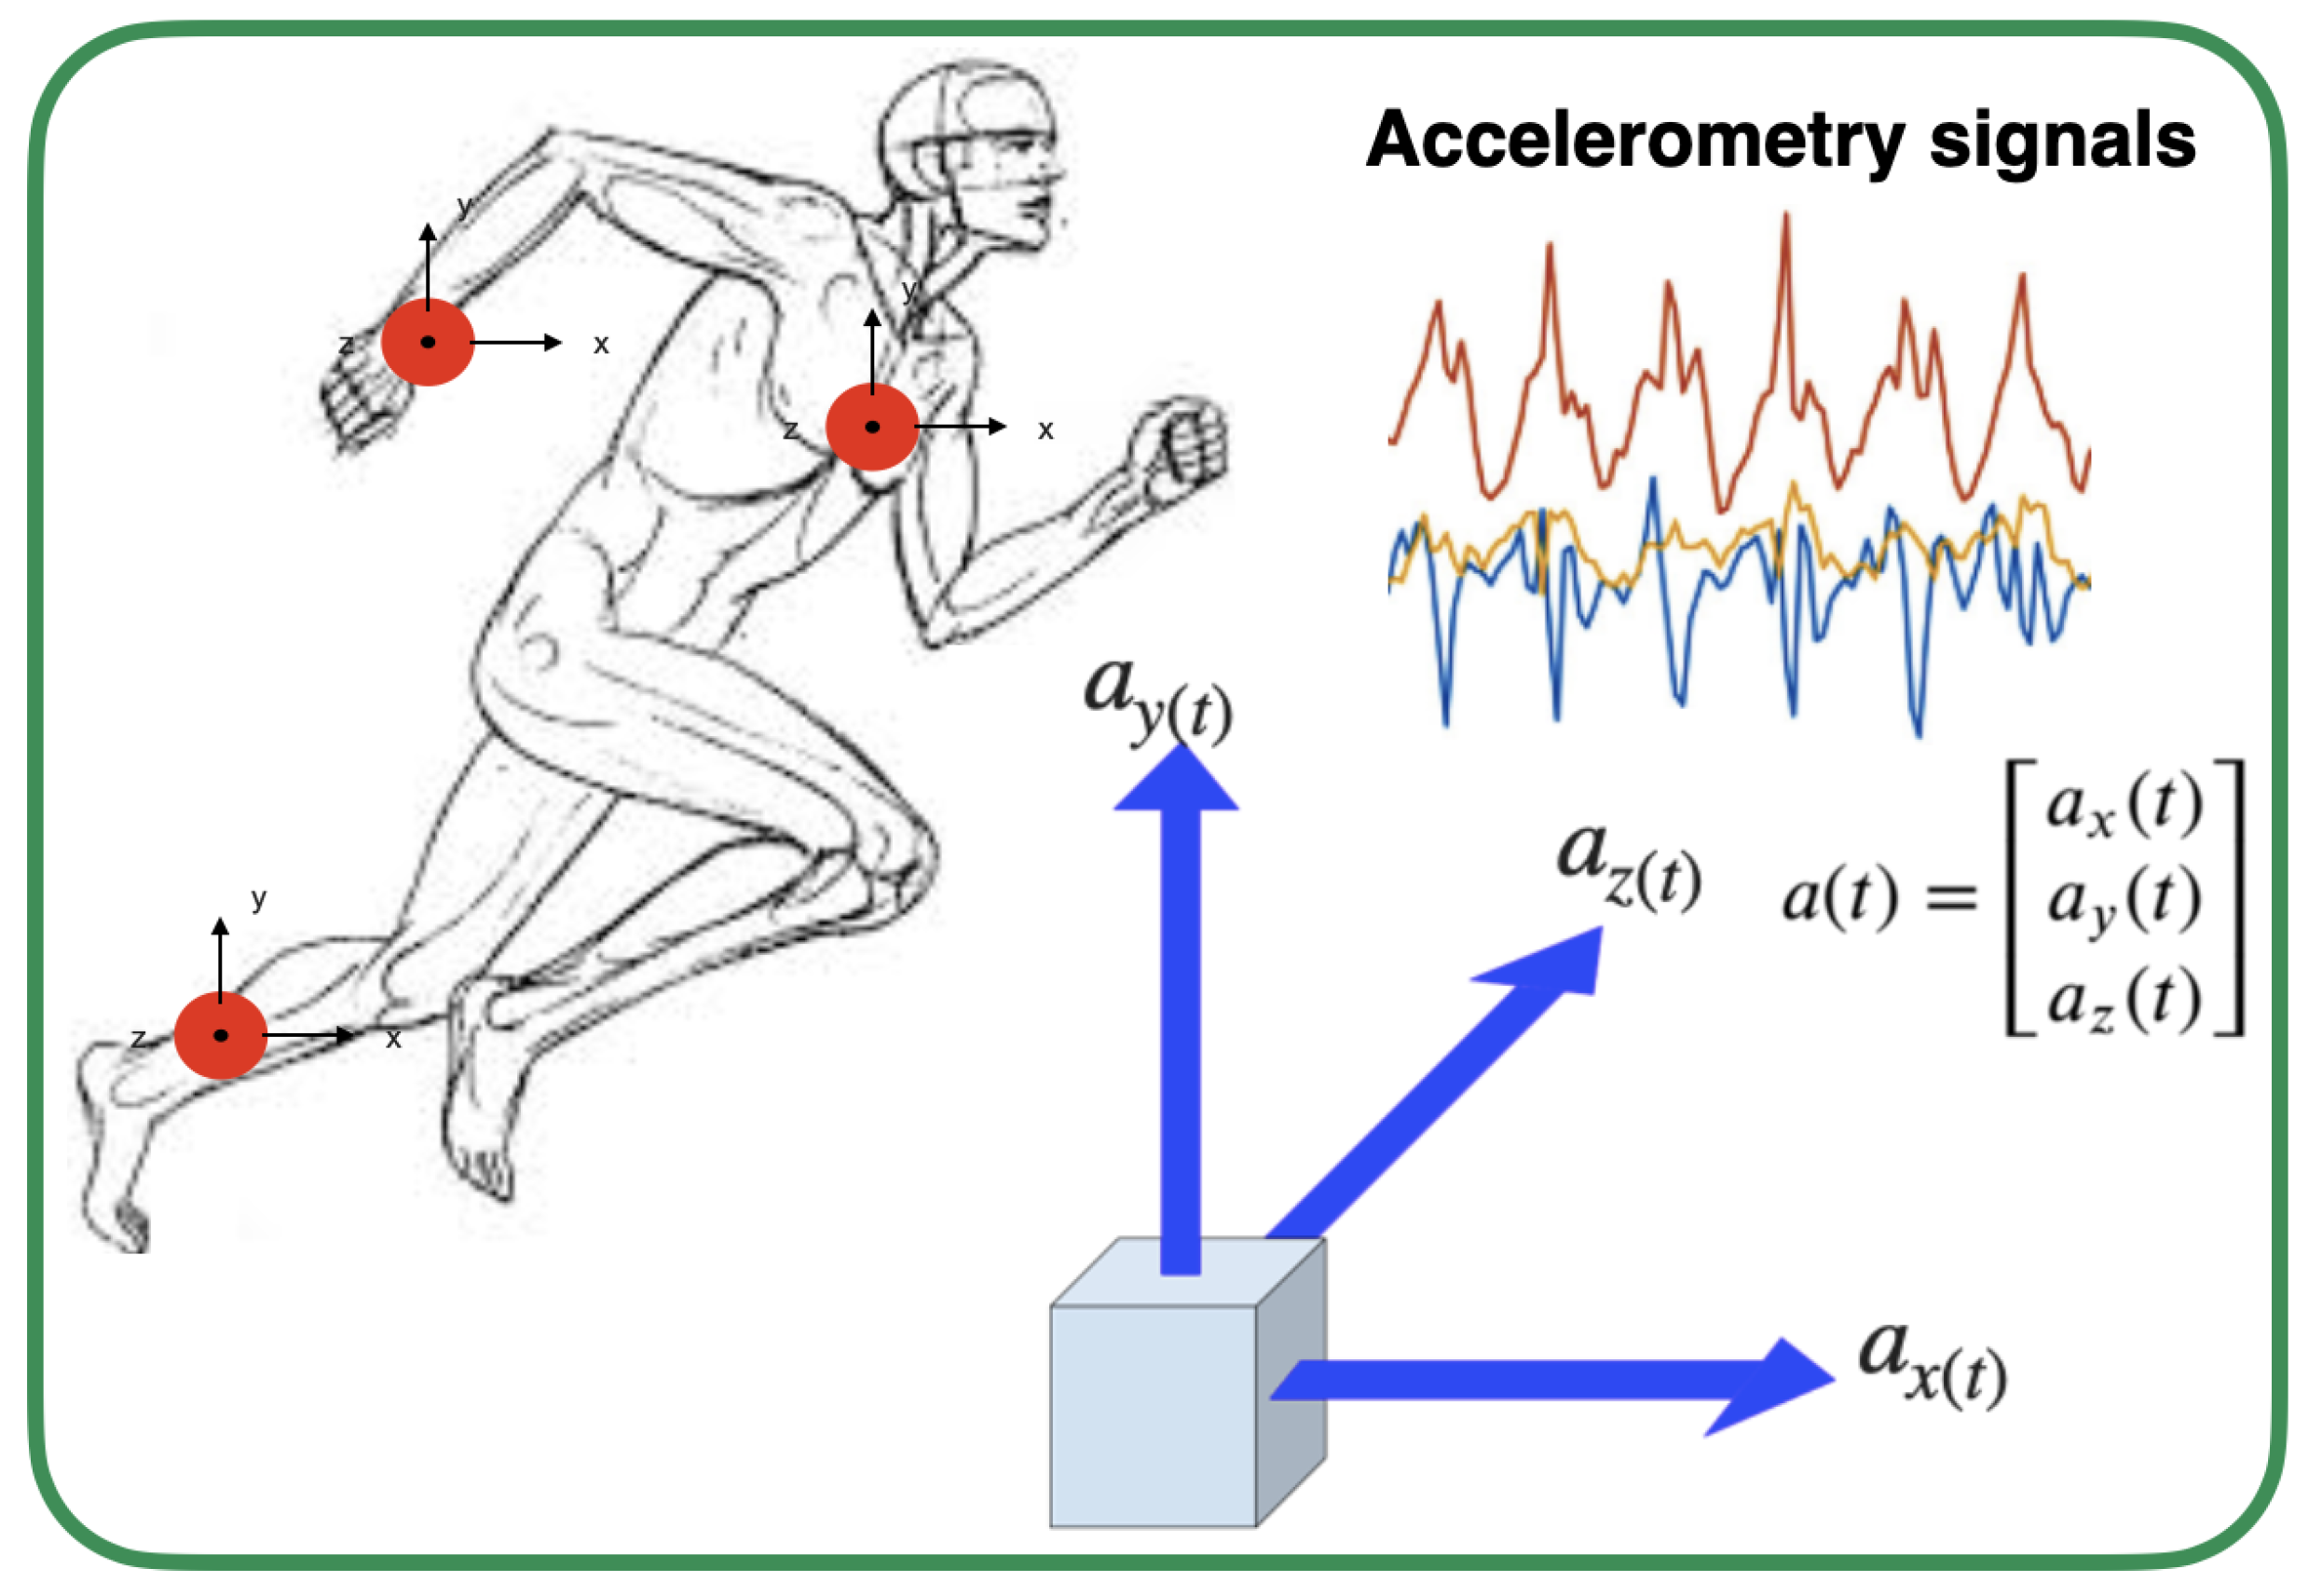
This motion sensor can detect acceleration in the three orthogonal axes of space (x, y and z). Therefore, it is essential to extract features considering each axis independently or in combination. This approach enables the sensor to capture signals accurately from any movement plane of the human body, offering a comprehensive and detailed perspective on movement, as illustrated in Figure 1.
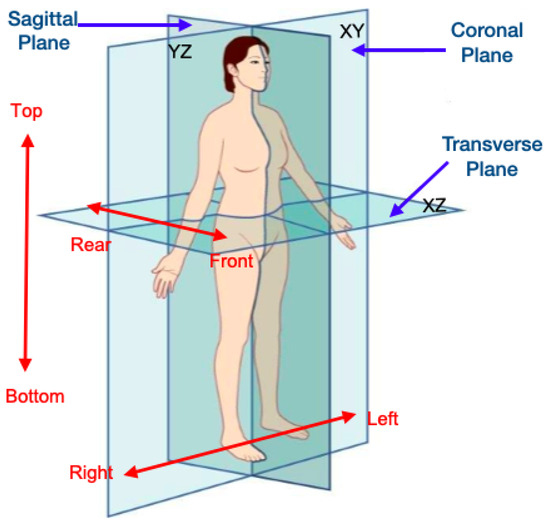
Figure 1.
Planes of human movement.
1.2. Sensor Position
When utilizing accelerometers in HAR, it is crucial to consider that the output patterns of accelerometer signals vary depending on the body position. Therefore, alternative approaches have been proposed to develop multiple models capable of classifying physical activity across different accelerometer placements on the body [19,20,21,22]. In this way, the user has more freedom of choice, increasing the probability of the success of HAR and enhancing models’ performance [24,25,26].
Analyses such as those presented in [27] show how the classification capability and performance of the model are directly affected by the number and combination of accelerometer positions used. However, this can result in consequences such as increased costs, reduced comfort, and the generation of larger and more complex datasets [26].
HAR systems use machine learning or deep learning models to recognize activities [28]. Deep learning models have bolstered the performance and robustness of HAR [29], accelerating its adoption. These models can decrease the computational work in the data preprocessing and feature extraction phases, while enhancing generalization performance and model reliability [30].
Hence, determining the accelerometer’s position facilitates the adaptation of HAR systems to different body configurations. One significant contribution of this work is that detecting the sensor’s position allows for the development of specific deep learning models that enhance the precision and reliability of HAR.
1.3. Related Works
This section reviews the main advances and methodologies in HAR, including feature extraction techniques, machine learning models, and innovative approaches. The goal is to provide a clear overview of current trends and identify opportunities for further research and improvement in HAR technology.
Despite their various applications, HAR algorithms still face several challenges, such as: (1) the complexity and diversity of daily activities, (2) variability between subjects for the same activity, (3) computational inefficiency on embedded and portable devices, and (4) difficulty in handling data [31]. HAR systems utilizing wearable inertial sensors, such as accelerometers, utilize temporal signals.
This signal type has not been extensively researched, necessitating innovative approaches to extract valuable features for HAR. In ref. [32], the activity recognition accuracy is improved by incorporating attention into multi-head convolutional neural networks for better feature extraction and selection. In a related work, ref. [33] proposed a feature incremental activity recognition method named FIRF, which evaluates the performance of continuously recognizing new emerging features. These features, extracted from a new sensor, are incrementally added at different time steps. Additionally, ref. [34] proposed the Down-Sampling One-Dimensional Local Binary Pattern method. Their HAR system consists of two stages: firstly, a conversion was applied to the sensor signals to extract statistical features from the newly formed signals, and secondly, classification was performed using these features. In [35], attention mechanisms enhance temporal convolutional networks (TCNs) to better capture temporal dependencies and identify key patterns in activity data. Similarly, ref. [36] improves model performance by combining wearable ambient light sensors with traditional IMUs to detect environmental changes linked to activities, leading to better accuracy. Additionally, ref. [37] explores using a single triaxial accelerometer with features from the time, frequency, and statistical domains to capture human activity dynamics more comprehensively.
The exploration of new features is crucial for developing models that deliver robust real-world results. By integrating innovative characteristics, we can enhance the accuracy of activity recognition systems, leading to the advancement of smarter wearable devices for monitoring and evaluating physical activity. Hence, this study focuses on extracting a new characteristic closely linked to movement dynamics: the radius of curvature. This time-domain feature is computed by segmenting accelerometry signals into windows, conducting double integration to derive positional data, and subsequently estimating a circumference based on the data obtained within each window, across movement planes.
Table 1 provides a comparison between the proposed model and other state-of-the-art approaches in activity classification. This comparison highlights the differences in methodologies and performance metrics across various studies. It is highlighted that the proposed FFNN-based model has a competitive performance that is equal or superior to the most accurate models, which shows that the developed approach is as effective or more in HAR as the state-of-the-art techniques.

Table 1.
Performance comparison of the proposed model and state-of-the-art methods.
1.4. Based Methodology
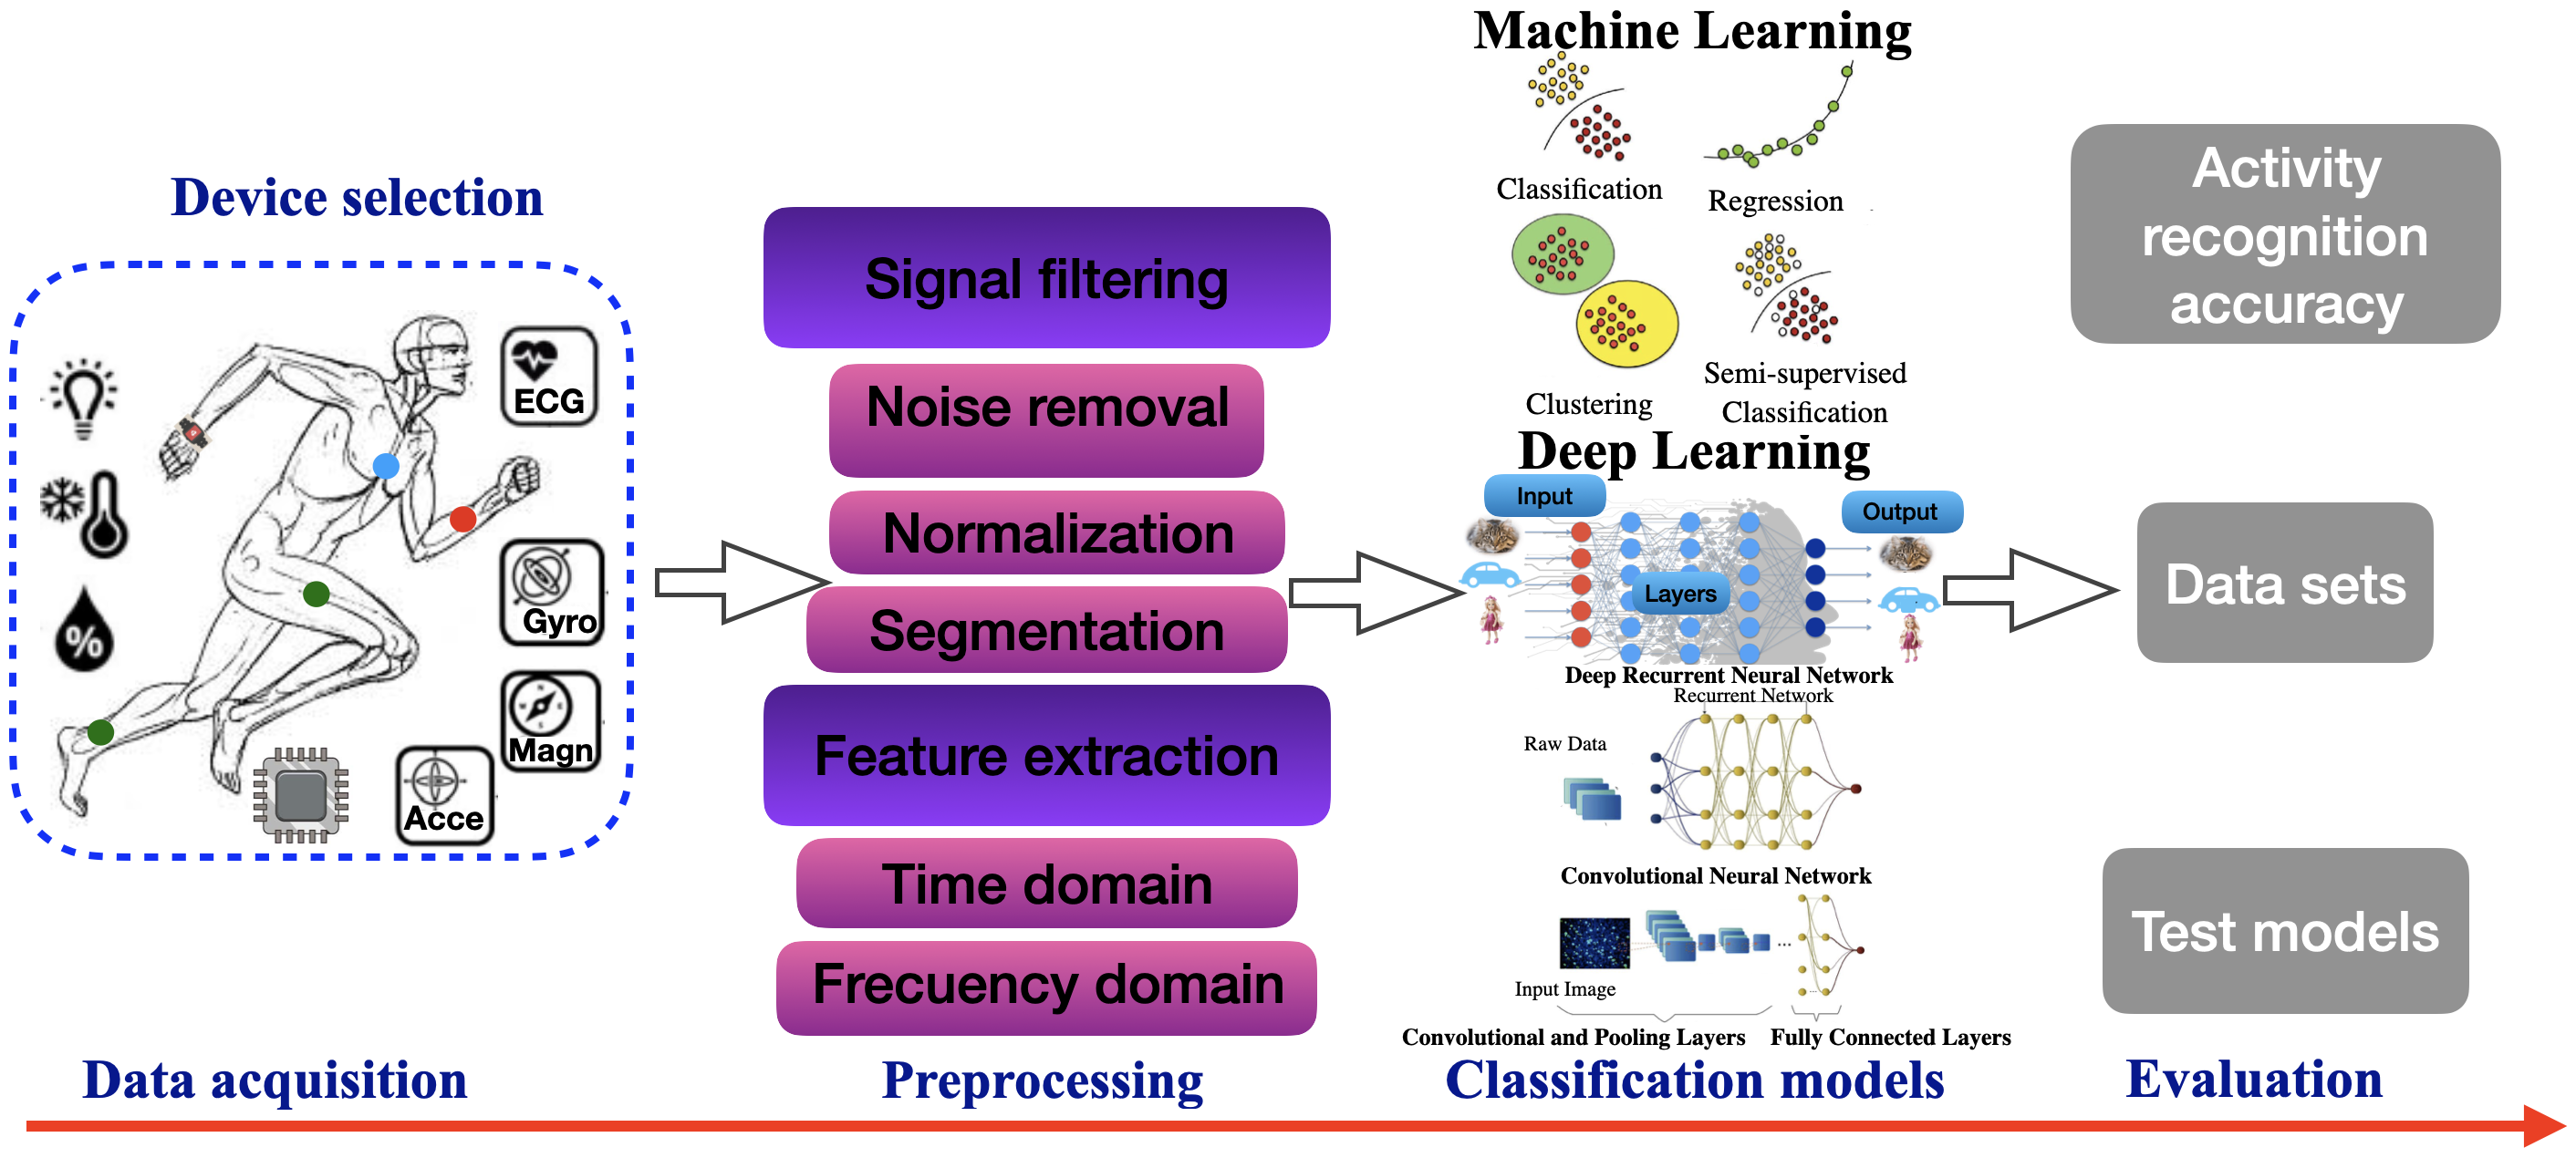
To design and evaluate any HAR systems, specific steps must traditionally be followed to retrieve activity information from the sensor. These steps are referred to as the activity recognition chain [44]. Firstly, data collection is conducted, focusing on determining the specifics of the data acquisition process. The second step consists of performing data preprocessing using methods to fit the signals and extract the characteristics that are used as input information in the classification models. The third step involves selecting the appropriate learning model and training it. Finally, in the fourth step, the model is evaluated in terms of activity recognition metrics, as shown in Figure 2.

Figure 2.
Human activity recognition chain.
As indicated in the HAR chain process, it is necessary to consider important aspects of signal acquisition, such as the sampling frequency. In the context of capturing human body motion, the majority of its energy, specifically 99%, is concentrated below 15 Hz [45]. Therefore, a sampling frequency of over 30 Hz is sufficient to capture interesting information, present in refs. [46,47,48].
Additionally, the automatic classification of accelerometry data requires a preprocessing phase where various techniques are used to enhance signals, such as filtering, signal segmentation, and feature extraction. Complex feature extraction techniques are needed to improve success, which would lead to an increased data processing power [49].
Within the preprocessing stage, segmentation is performed, where time-series sensor data are segmented before feature extraction; the sliding window technique is a common example of the methodologies used at this stage [50]. Some research also implements an overlap between two consecutive segments; from each sampled window, a vector of features must be obtained [51]. Feature extraction can be classified into two main domains: the time domain and the frequency domain, with the time domain being the most commonly used due to its simplicity of computation [52].
ANNs are an important branch of artificial intelligence, defined as models inspired by the structure and function of the human brain [15]. They have been shown to be effective on a wide range of tasks, including HAR, as they have the ability to learn complex patterns in data and extract discriminative features, resulting in a powerful tool [53].
In accordance with the Table 2, the proposed model relies solely on accelerometers, whereas previous studies use multiple sensors and perform feature extraction in the frequency and time domains, or combinations of these, which increases the processing complexity to achieve high performance. Therefore, this model could serve as a viable alternative for devices with limited resources, as its performance balances the use of multiple sensors and complex transformations. Hence, exploring new features closely related to human movement dynamics could provide enough information to enhance model accuracy.
Table 2.
Comparison with previous research.
The main proposal and contribution of this work is the adaptation of well-known temporal features combined with a new feature, which is obtained based on the calculation of the curvature radius from positions obtained in the three planes of motion. This characteristic is closely related to the movement patterns that people perform during physical activity, enabling HAR algorithms to be performed successfully, thus maintaining computational simplicity in the algorithms and reducing the need for complex data transformations. To classify activities, a feedforward neural network (FFNN) was used.
2. Materials and Methods
2.1. Dataset
This work has been developed using the available “MHEALTH dataset” (Mobile Health), created to evaluate human behavior analysis techniques based on multimodal body sensing [46]. To capture the data from accelerometry signals, three triaxial accelerometer sensors were used. Authors recorded accelerations, from sensors placed on the chest, right wrist, and left ankle of each subject, attached using elastic straps to measure the motion experienced by different parts of the body. All sensing activities were recorded at a sampling rate of 50 Hz, which is considered sufficient for capturing human activity. The data were collected in an out-of-laboratory setting with no restrictions on how the activities were to be performed, except that the subjects were required to exert maximum effort.
The dataset includes recordings of body motion from ten volunteers with diverse profiles, collected while they performed 12 physical activities considered common in daily life. Additionally, the labels used serve to identify the activities, as shown in Table 3.
Table 3.
Activity Set.
2.2. System Architecture for HAR Process
The general architecture of the HAR system used in this work is shown in Figure 3. The proposed scheme encompasses data preprocessing and transformation, as well as the use of a Random Forest (RF) classifier model to detect the sensor position on the body; lastly, the activity classification is performed using FFNN models, selected based on the position detected earlier, therefore three different models have been developed to calculate HAR. Given that raw acceleration data from portable sensors experience considerable variations over time, classifying them based only on data from a single point becomes impossible [31]. Therefore, HAR methods are based on a series of data collected over a given time interval [59]; in this work, periods of 20 s are selected to perform the classification task.
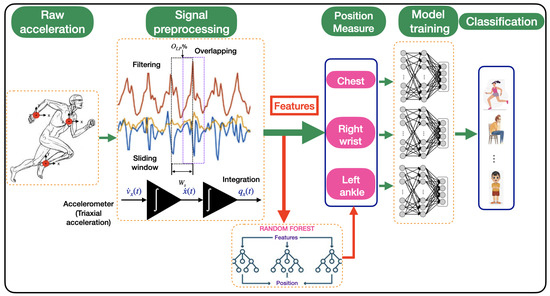
Figure 3.
Schematic of the proposed system for HAR process.
In next sections, a detailed study of different stages is presented.
2.3. Preprocessing Data
The raw accelerometry signals are characterized by being affected by signal noise, which makes it difficult to use them in their original state. The presence of noise and its negative effects on the classification models are mitigated in the preprocessing stage of the data, making them suitable for use as inputs to the recognition models [60].
In the preprocessing step, the accelerometer raw signals that were sampled at 50 Hz are filtered to reduce noise. According to [48], an ideal low-pass frequency filter set at a (cutoff frequency of 10 Hz) allows us to capture all relevant acceleration for physical activity while minimizing the impact of noise, which is utilized in this research.
2.4. Data Segmentation
The time-dependent raw acceleration dataset is divided into segments, which can vary in length according to the selected window size, during the data segmentation process. All operations related to signal preprocessing are performed considering each of these segments. Previous studies in the context of activity classification have already examined different configurations in terms of window size and signal segmentation process.
They claim that overlapping windows are more suitable because they can handle transitions more accurately and avoid loss of information between segments [31]. In most of the studies performed for activity classification, the length of the windows varies in the range of 1 to 10 s [49]. Increasing the length of the windows in some cases can improve the recognition accuracy, but it is not always the best alternative. In any case, the window size should be chosen so that each window contains enough samples (at least one activity cycle) to distinguish similar movements [61]. The estimation of the number of windows can be carried out by using the following mathematical expression:
where (K) is the number of windows, (N) the signal length, (M) the window size and (R) the overlap factor.
The following expression is used to calculate the number of overlap samples:
where () is total number of overlap samples, () sampling rate (Hz), () window size (s) and () overlap percentage.
The sliding window approach is the predominant method used in the segmentation step of HAR. In this method, sensor signals are divided into windows of a fixed size. When adjacent windows overlap, this technique is referred to as overlapping sliding window.
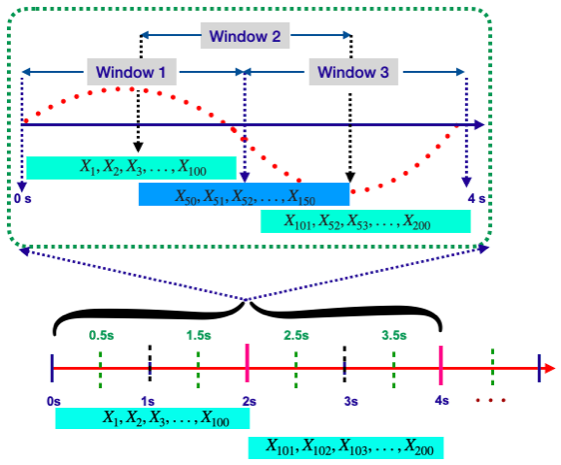
In this research, data segmentation is carried out using the sliding window technique, considering a window size of 2 s and an overlap of 50%, shown in Figure 4.

Figure 4.
Segmentation process using sliding window technique.
Taking into account the above details, 19 windows are generated within each 20 s time interval considered for classification process, sampled at 50 Hz.
2.5. Feature Extraction
Each time window is transformed into a feature vector, which is the input data in the position detection and activity classification models. In particular, our methodology consists of transforming the accelerometry signals into different types of representations, such as velocity and position, from which the characteristics are extracted. Therefore, to execute this transformation process, double integration using Euler’s method is initially performed on the acceleration triaxial signals, considering the following reference frame, shown in Figure 5.

Figure 5.
Triaxial accelerometer signals, reference frame.
Therefore, the kinematics of the position, velocity and acceleration can be expressed for each component as follows:
- X-axis component, where , , are the instantaneous acceleration, velocity and position, respectively:
- Y-axis component, where , , are the instantaneous acceleration, velocity and position:
- Z-axis component, where , , are the instantaneous acceleration, velocity and position:
Using the Euler method of double integration in each of the acceleration components, mathematically expressed below and considering initial conditions , , , , , , the following is obtained:
- X-axis component:
- Y-axis component:
- Z-axis component:
where is the window size.
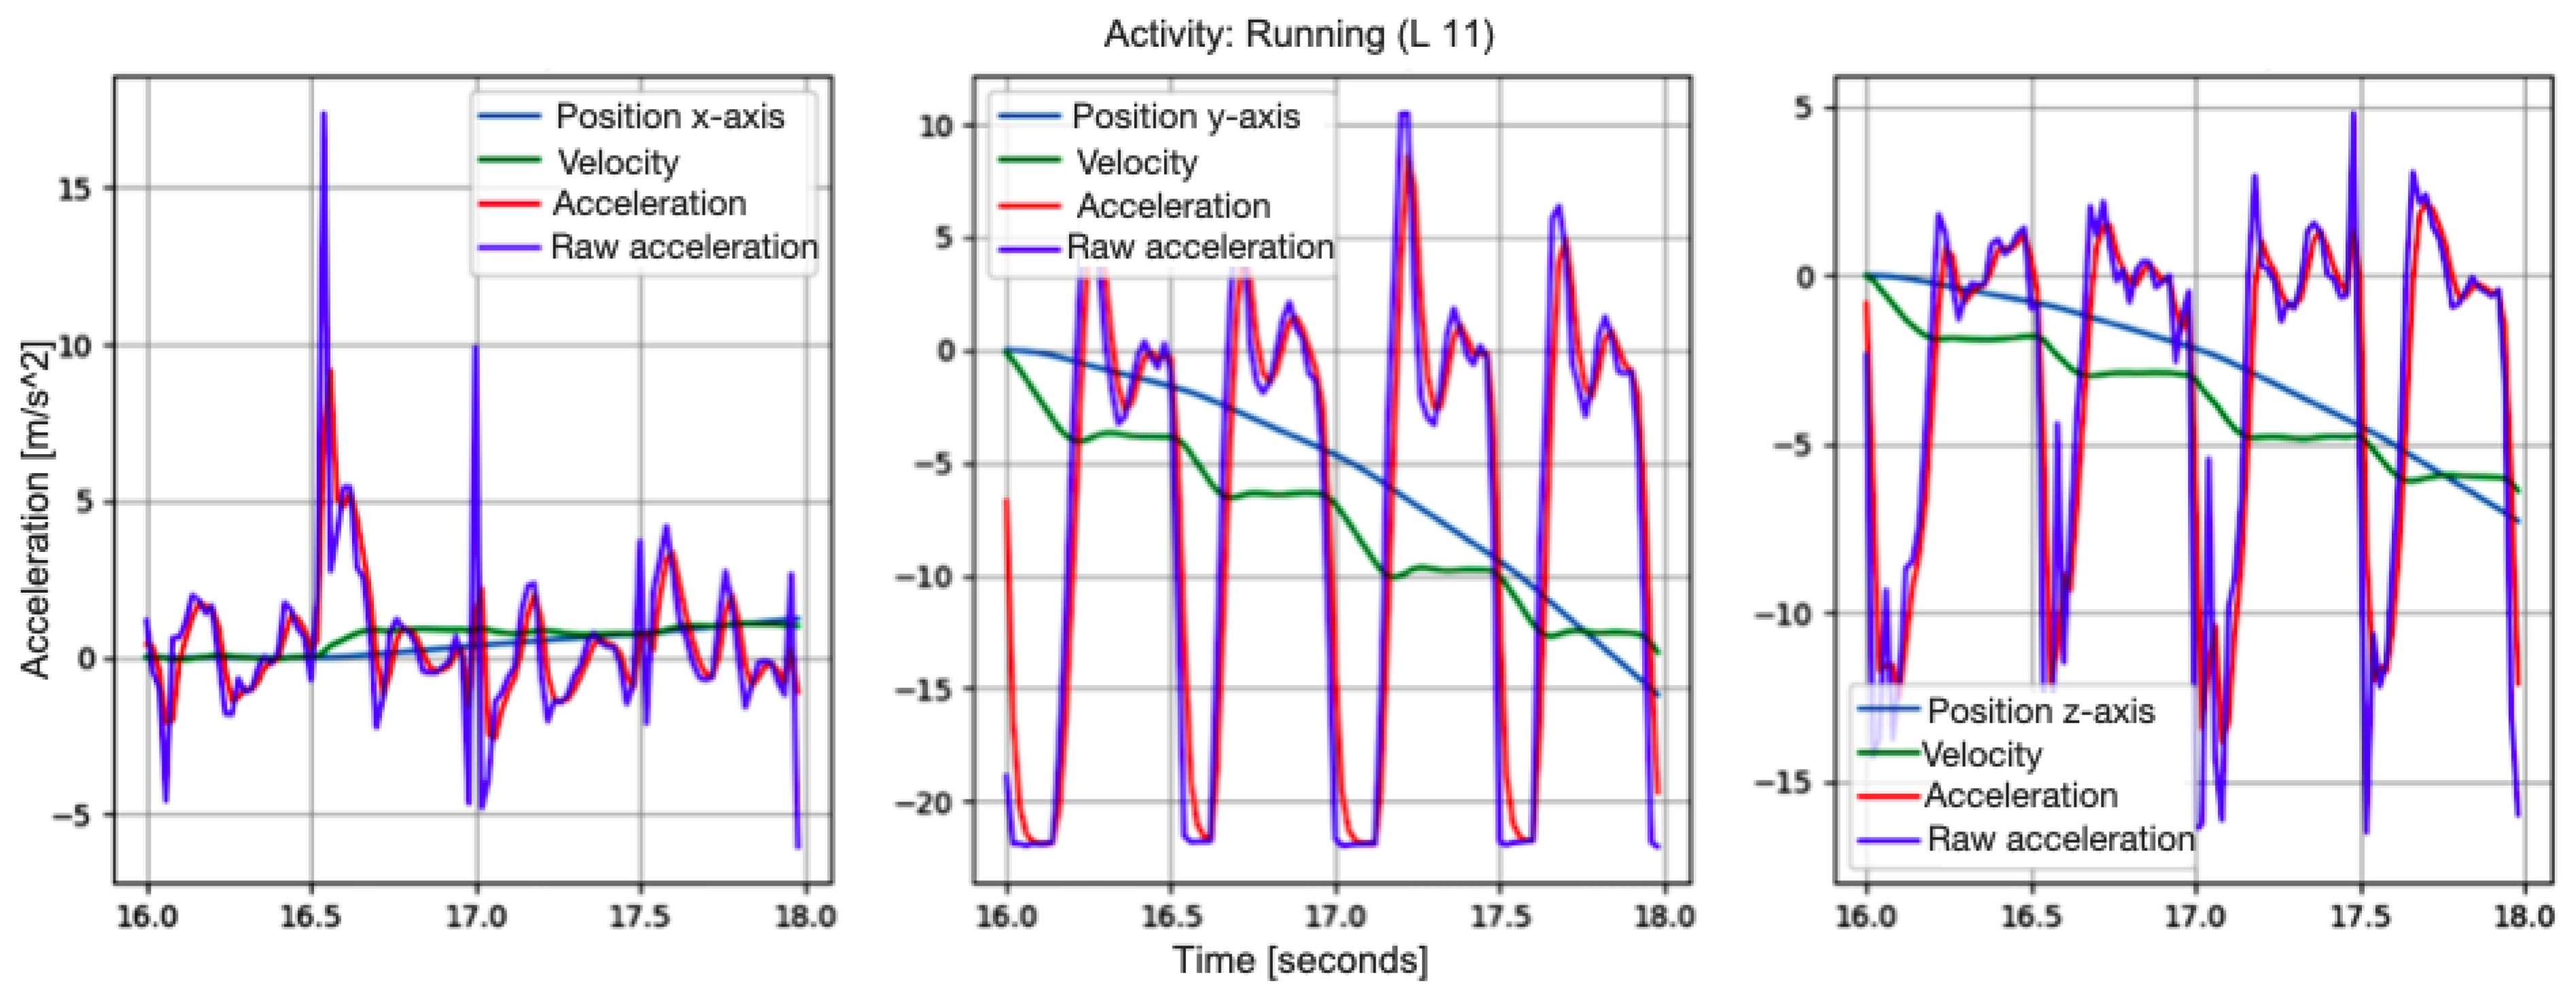
Once positions, velocities, and accelerations in (x, y, z) axes have been obtained in each window, as shown Figure 6, feature extraction is performed.
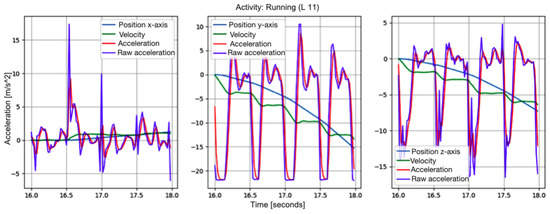
Figure 6.
Accelerometry, velocity and position signals per window.
This study proposes a novel approach to derive a new feature closely related to the dynamics of motion, which varies depending on the activity being performed. To achieve this, we calculate the curvature radius () from the positions obtained for each window using the Euler’s double integration method, considering different movement planes.
2.6. Proposed Estimating Model for Curvature Radius
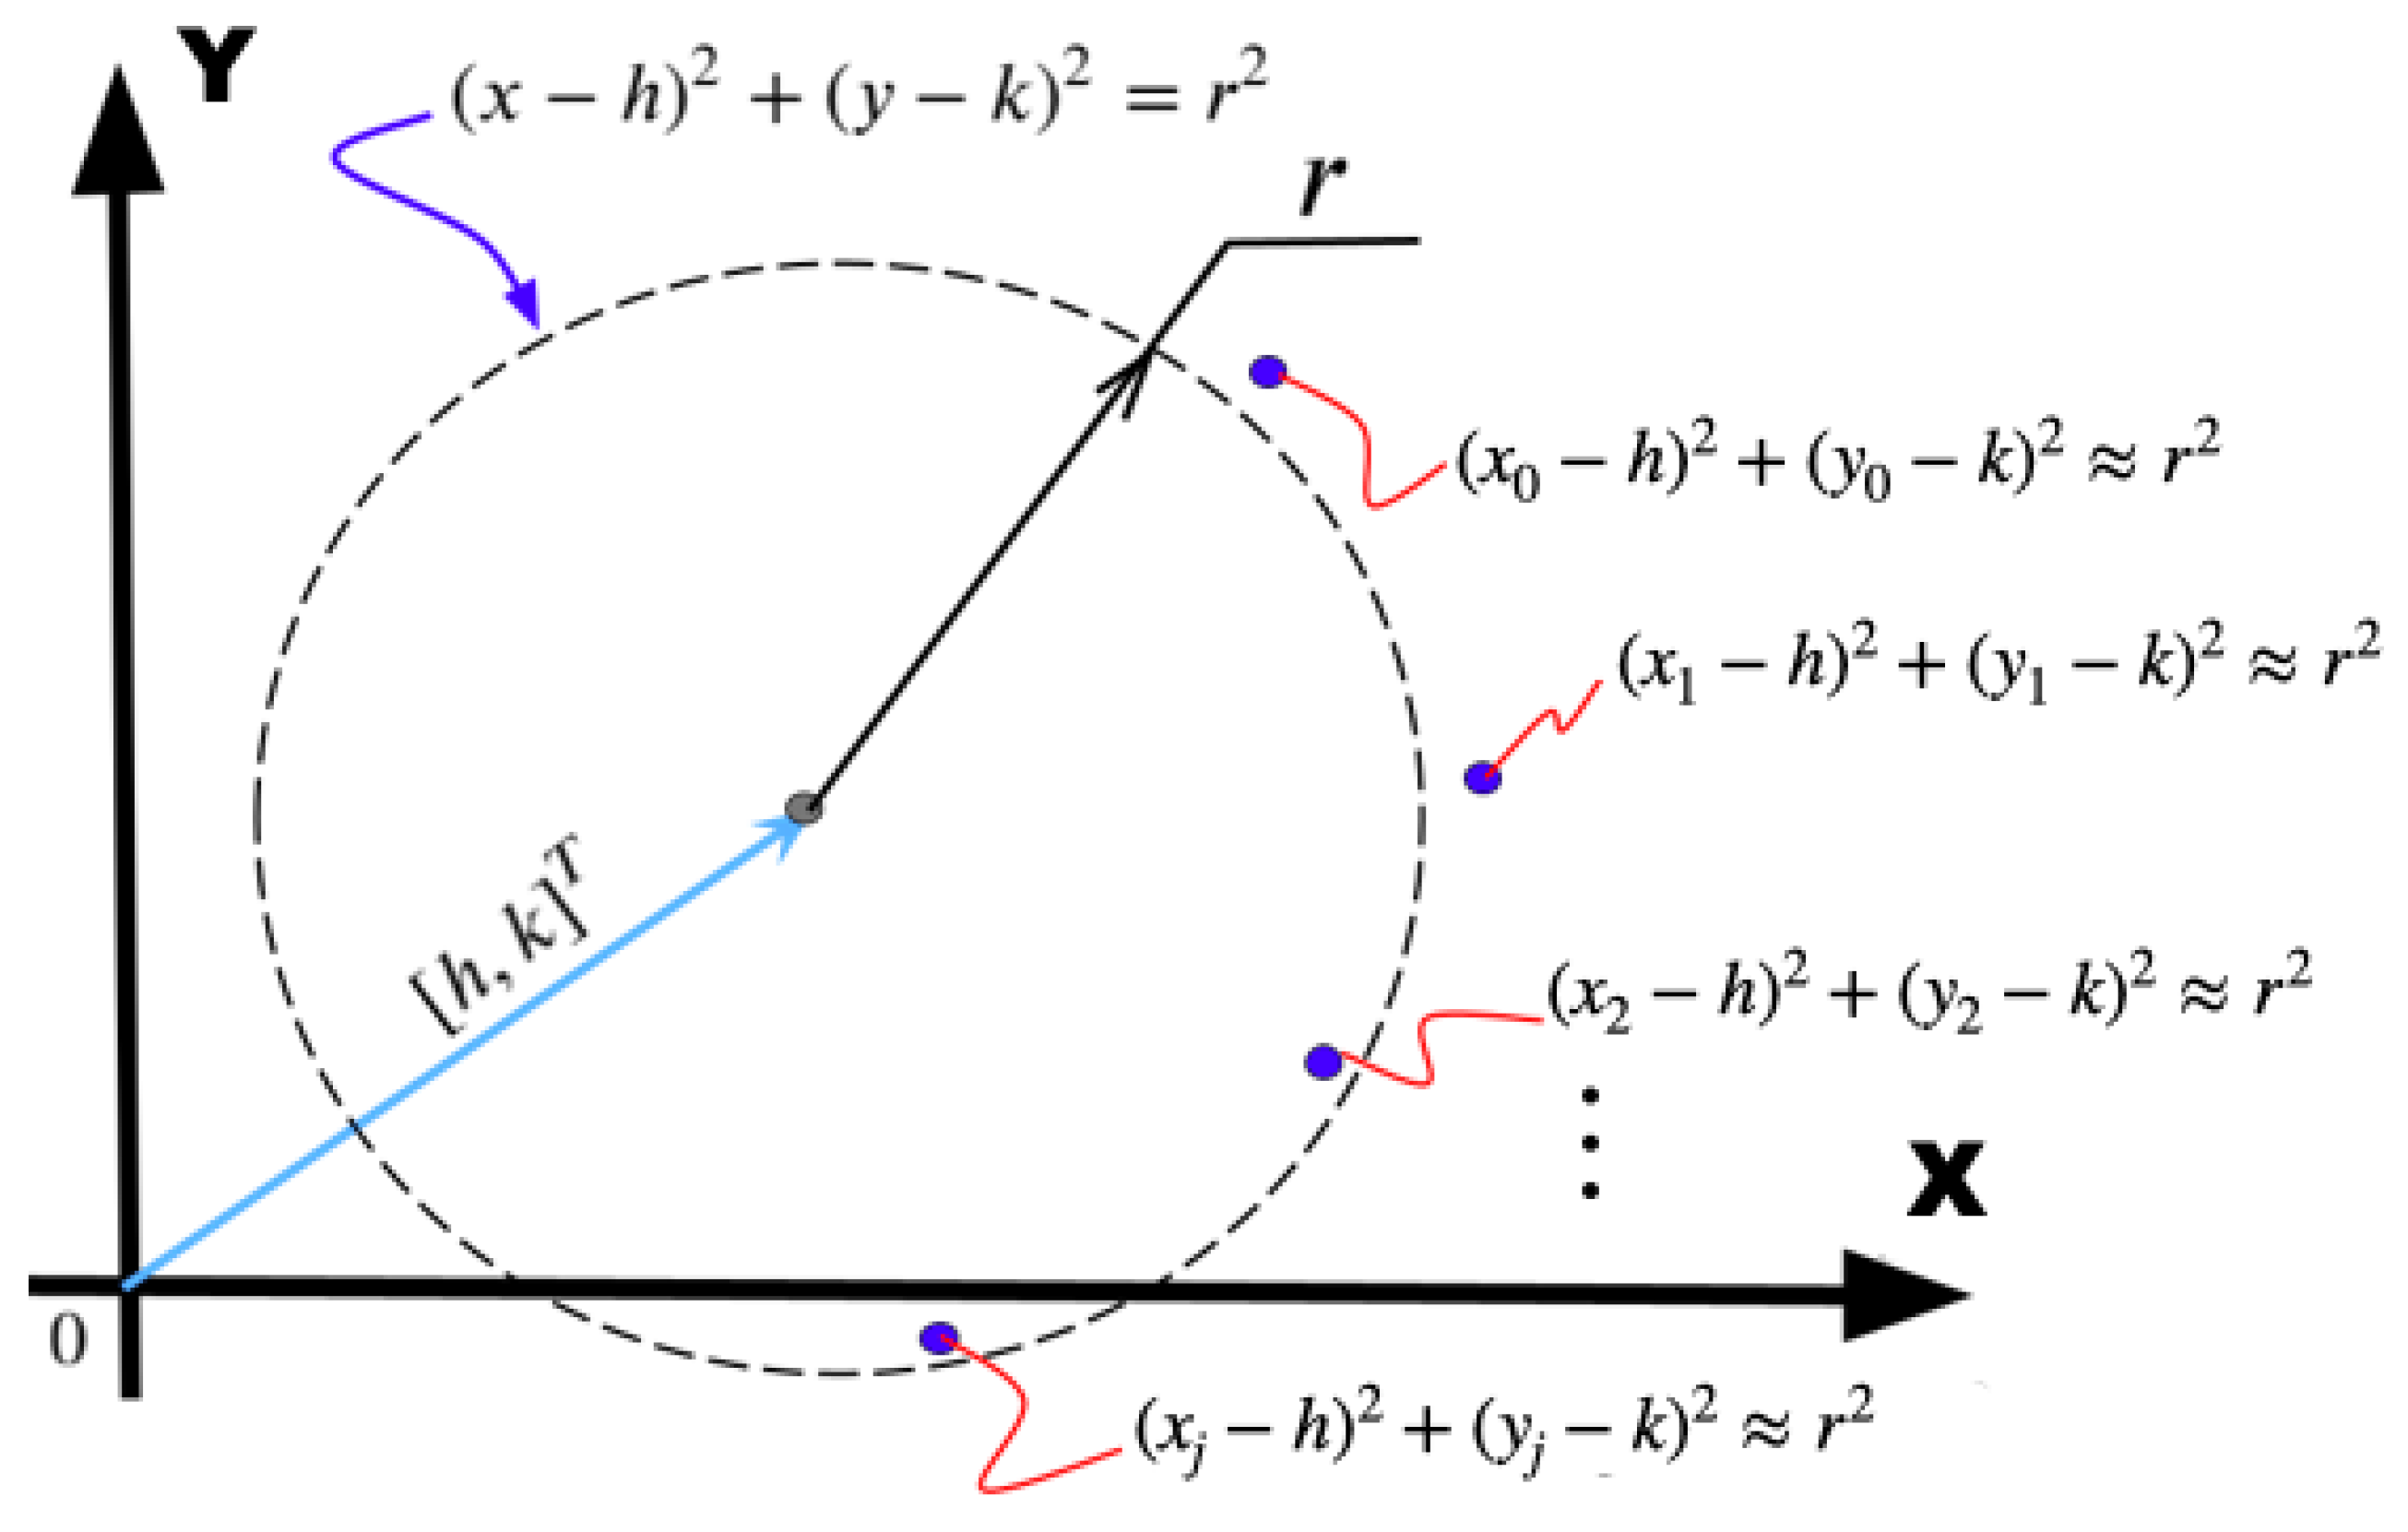
Taking into account the general equation of the circumference in a Cartesian plane, where are the coordinates of the center of the circle, r is the radius of the circle and are the coordinates of the position points on the plane, Figure 7, shows the calculation process in the coronal plane (x, y) axes.
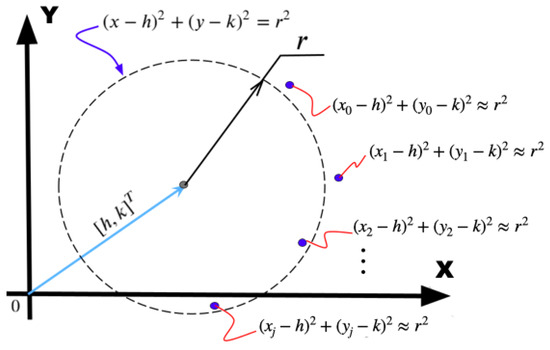
Figure 7.
Graphical description of point and the radius of curvature.
To calculate a point whose coordinate or position vector is denoted by the vector , this point is approximately equidistant to the number of points contained in the selected window size , considering at a distance r, the mathematical expression is:
To solve the point , it is necessary to re-express these equations in vector notation, expressed as follows:
The algebraic manipulations generate the following:
So, it is defined that:
Then:
In summary, we have a number of equations equal to the number of points within a window, and these equations express the same quadratic difference; therefore, we can formulate the equivalences between them.
Window size () equations can be constructed, leaving the affine terms on the left-side:
The matrix expression considering the coronal plane is:
Finally, the point corresponding to the center of the circle is obtained as follows:
where is known as the pseudo-inverse of .
Once the value of point is obtained in the coronal plane, we proceed to calculate the value of the approximately equidistant distance (curvature radius), as follows:
where is the curvature radius, () are the coordinates of the position points in the plane, are the coordinates of the center of the circle, considering all of them in the context of calculus in the coronal plane. In this work, the signals are segmented into 2 s periods, which means . Figure 8 shows an example of the graphical result after applying our methodology, where the value of depends on the trajectory of points corresponding to the calculated position, according to the analyzed plane.
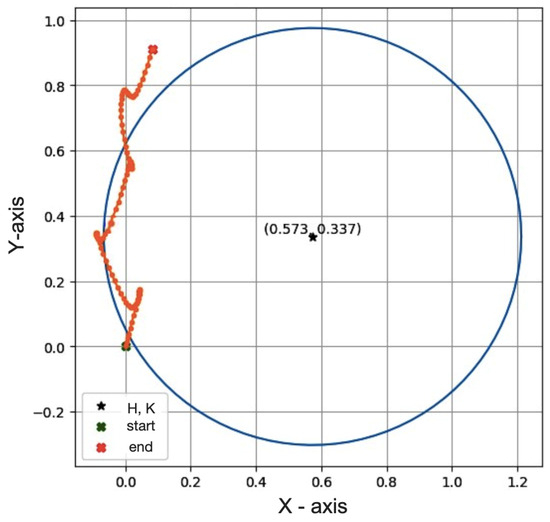
Figure 8.
Graphical example of the calculation process for in the coronal plane.
Therefore, it can be observed that, from the position trajectory obtained in the coronal plane during a two-second window, an upward movement with slight lateral deviations is recorded. This pattern corresponds directly to the dynamics of a person’s running motion. Moreover, the circumference calculated with the proposed algorithm demonstrates its efficiency, since it fits well to most of the points of the obtained trajectory. The value of the calculated radius of curvature () is also shown.
2.7. Proposed Feature Vector
Feature selection is a critical aspect in the development of ANN models. By carefully choosing relevant features extracted solely from the time domain, we rationalize the model complexity while ensuring robust classification accuracy in HAR.
Following this approach, the proposed feature vector is composed, considering that the estimation of curvature radius for each of the three planes of motion involves applying the method described (Section 2.6) Additionally, the mean and variance of the acceleration, velocity, and position signals from the three axes are calculated, as shown in Table 4.
Table 4.
Proposed feature vector.
Considering the segmentation process (Section 2.4), each processed data slice has 19 windows. Therefore, in the feature extraction process, 19 curvature radii are obtained in each plane, respectively, as shown in the following mathematical expressions.
- Curvature radius in the saggital plane , where the point corresponding to the center of the circle is obtained as follows:where is known as the pseudo-inverse of , () are the coordinates of the position points in the plane. Therefore, the curvature radius is obtained as follows:
- Curvature radius in the transverse plane , where the point corresponding to the center of the circle is obtained as follows:where is known as the pseudo-inverse of , () are the coordinates of the position points in the plane. Therefore, the curvature radius is obtained as follows:
Another 342 features are also extracted, corresponding to the calculation of the mean and variance of the position, velocity, and acceleration signals along the (x, y, z) axes. Finally, a vector of 399 features per activity is used to input data into both the HAR and RF algorithms.
2.8. Accelerometer Position Detection
The information required to determine the position of the accelerometer on the body is derived from the accelerations, which vary depending on where the sensor is placed. The core concept of on-body positioning involves analyzing acceleration data while the user is engaged in specific activities. Previous research has indicated that incorporating positional information enhances the model’s precision in HAR [62].
In this sense, for the automatic detection of the sensor position, an RF classifier containing three possible corresponding classes (chest, right wrist and left ankle) is used; the model is trained from the characteristics obtained in the feature vector proposed in this work, considering that there are N training examples, where each example has D features. The features are represented as a vector , for each example i. The corresponding class labels are represented as a vector for each example i.
where are the inputs, the features extracted at (x, y, z), and outputs class, corresponding to the detected position (chest, right wrist, left ankle).
The classification output of a RF model is determined by counting the class predictions from each tree and selecting the most frequent class as the final prediction.
where is the predicted output, M is the number of trees and is an indicator function that returns 1 if the prediction of tree i is equal to class Q, and 0 otherwise.
2.9. Measurement Validation
In this work, the signals from “MHEALTH dataset” are utilized to execute the HAR process, which has been widely used in some research [57,58,63]. The data are divided into two groups for training and testing the ANN models that classify the activities, and to perform an on-body position detection of the accelerometer using the RF algorithm. According to [64], a training and testing dataset split of 70/30 was determined to be the most effective ratio for training and validating machine learning models. Therefore, 70% of the participants’ data are used for training the models, specifically, while the remaining 30% are used for testing them. The following metrics were employed to evaluate the final classification performance of our proposed approach in HARL.
Accuracy indicates the proportion of correct predictions (positive and negative) over the total predictions made, for each class.
where is the number of true positive instances, is the number of true negatives, is the number of false positives, and is the number of false negatives.
Precision measures the accuracy of positive predictions made by the model.
Recall shows the proportion of positive instances that were correctly identified by the model for each class.
F1-score is the harmonic mean of precision and recall, providing a metric that balances both measures.
3. Results: Accelerometer Position Detection and Human Activity Recognition
3.1. Detection Position Model
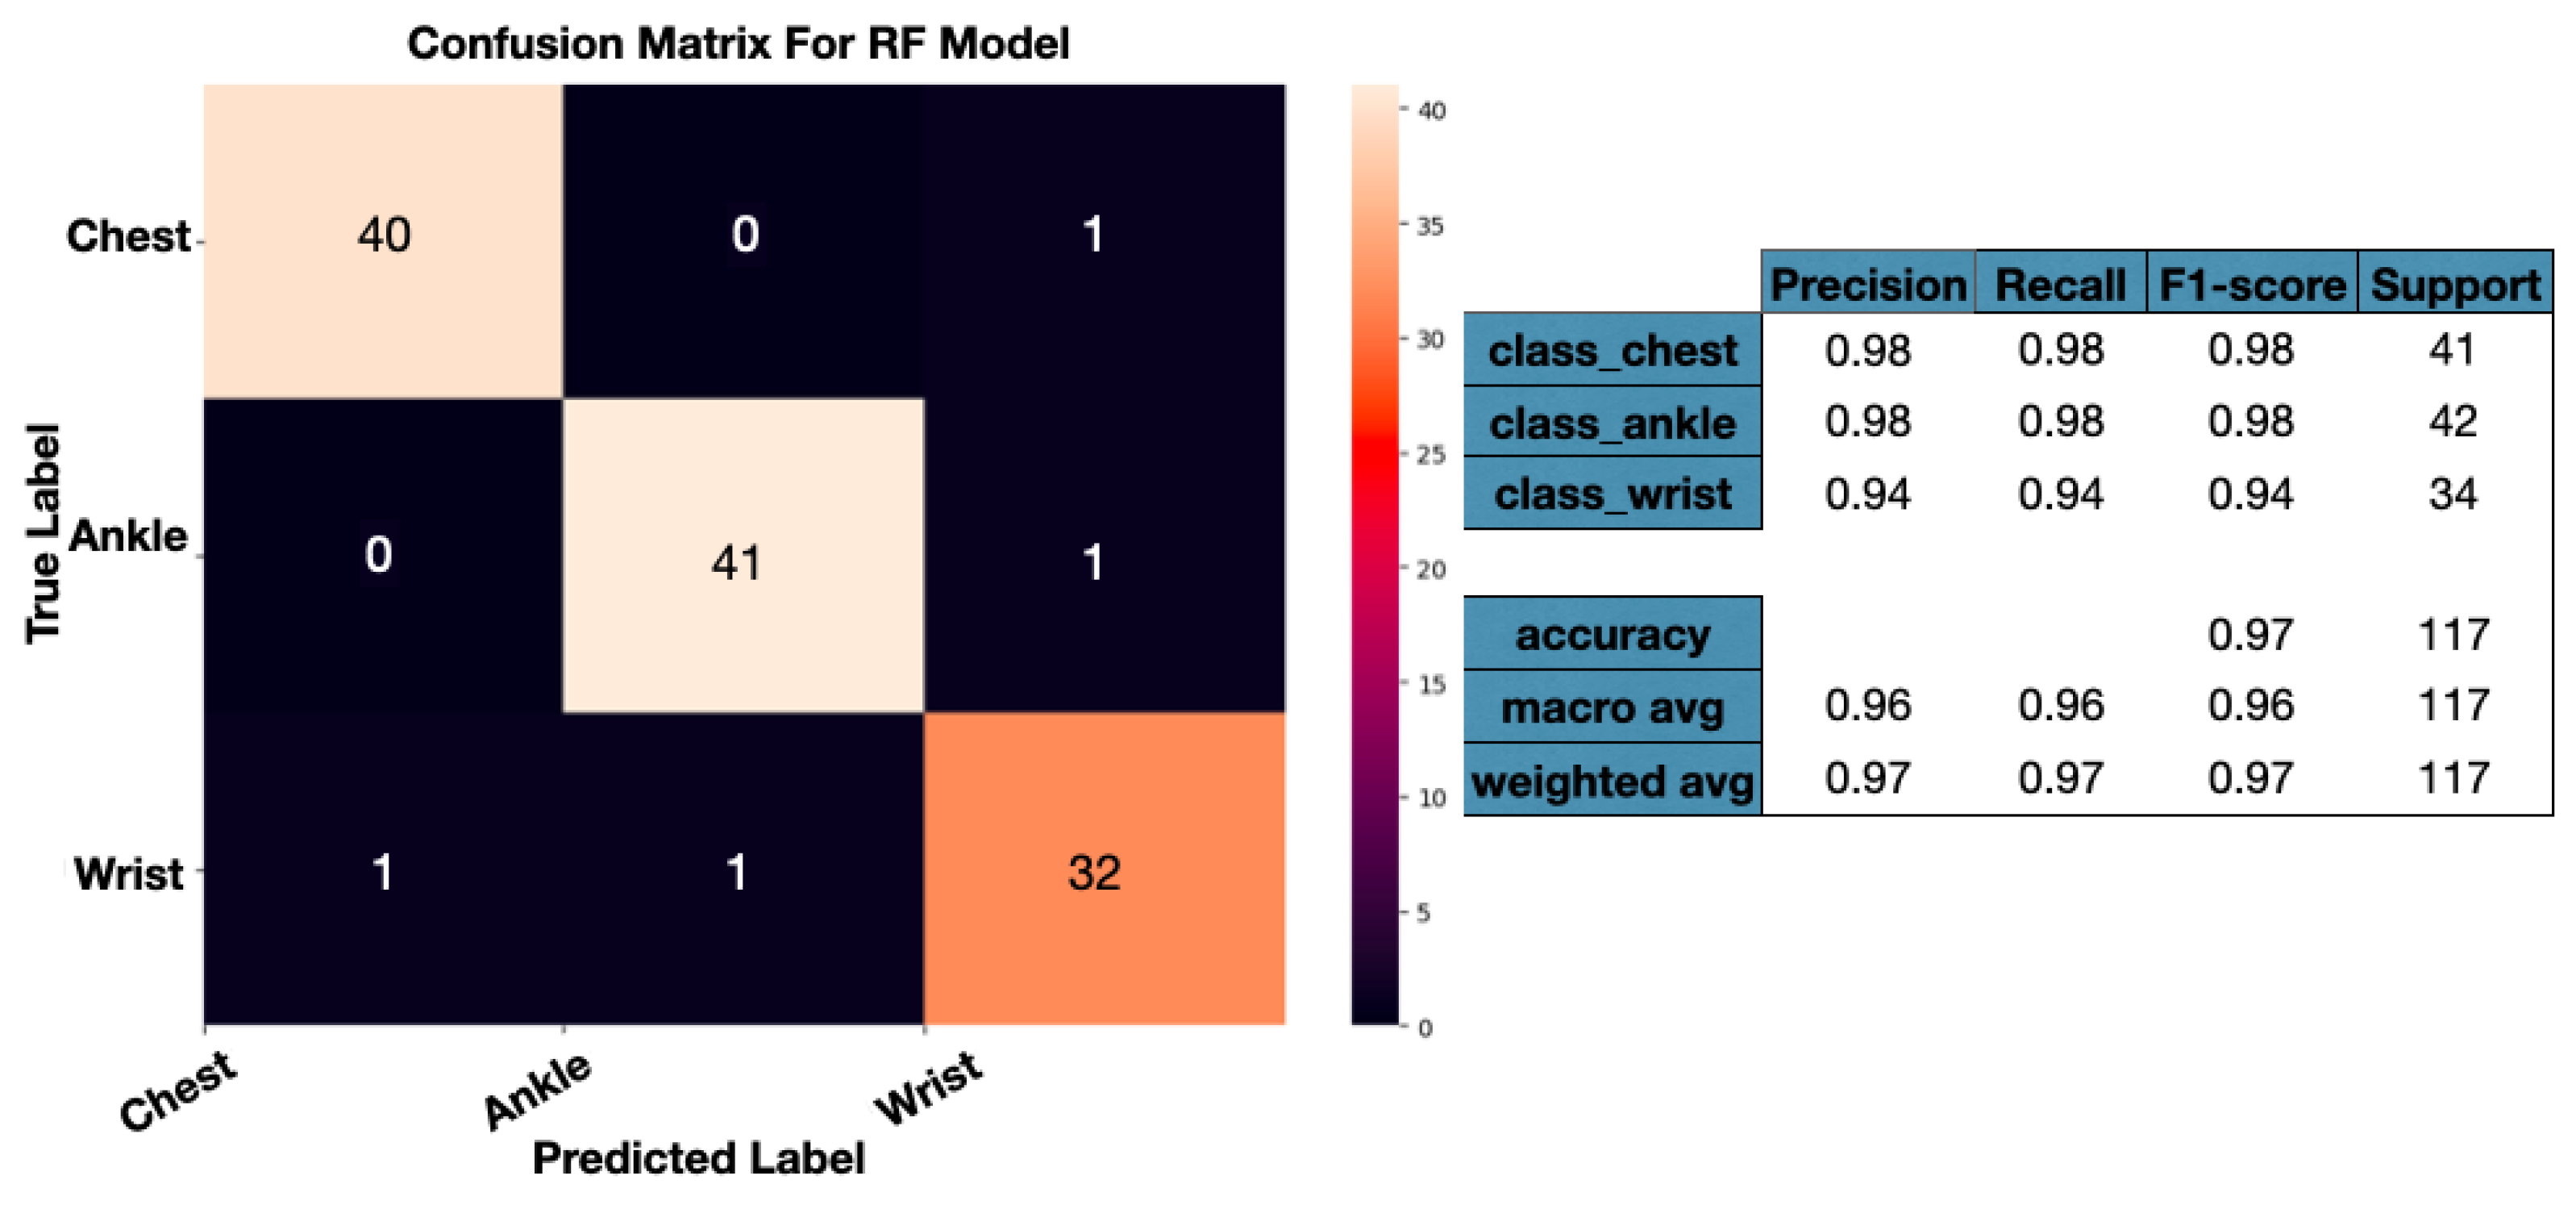
A RF classifier is a supervised machine learning algorithm. Its main job is to build multiple decision trees during training and combine their predictions to obtain a more robust and accurate final prediction. Each decision tree is constructed using a random subset of features and a random subset of training data. For classification, each tree in the forest generates a class prediction and, in the end, a majority vote or averaging of the predictions is used to determine the final class assigned. The RF algorithm was utilized to determine the sensor’s location on the body. Given a proposed feature vector (Section 2.7). The performance of the model is shown in the following confusion matrix, Figure 9 from which some important points can be determined.
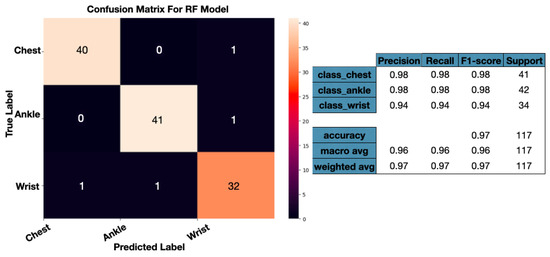
Figure 9.
Confusion matrix of RF model.
The results show that the RF model performs excellently overall, with an accuracy, recall, and F1-score above 0.94 for all evaluated classes, achieving an overall accuracy of 97%. Both macro- and weighted average metrics are also high, indicating consistent and robust classification performance across classes.
Additionally, when testing the classification using only the curvature radius as the input feature, an accuracy of 70% is achieved, demonstrating that this feature provides the most useful information to the model, although the model shows a slightly lower performance for the wrist class (94%) due to the high variability in hand movements.
3.2. Physical Activity Classification Models
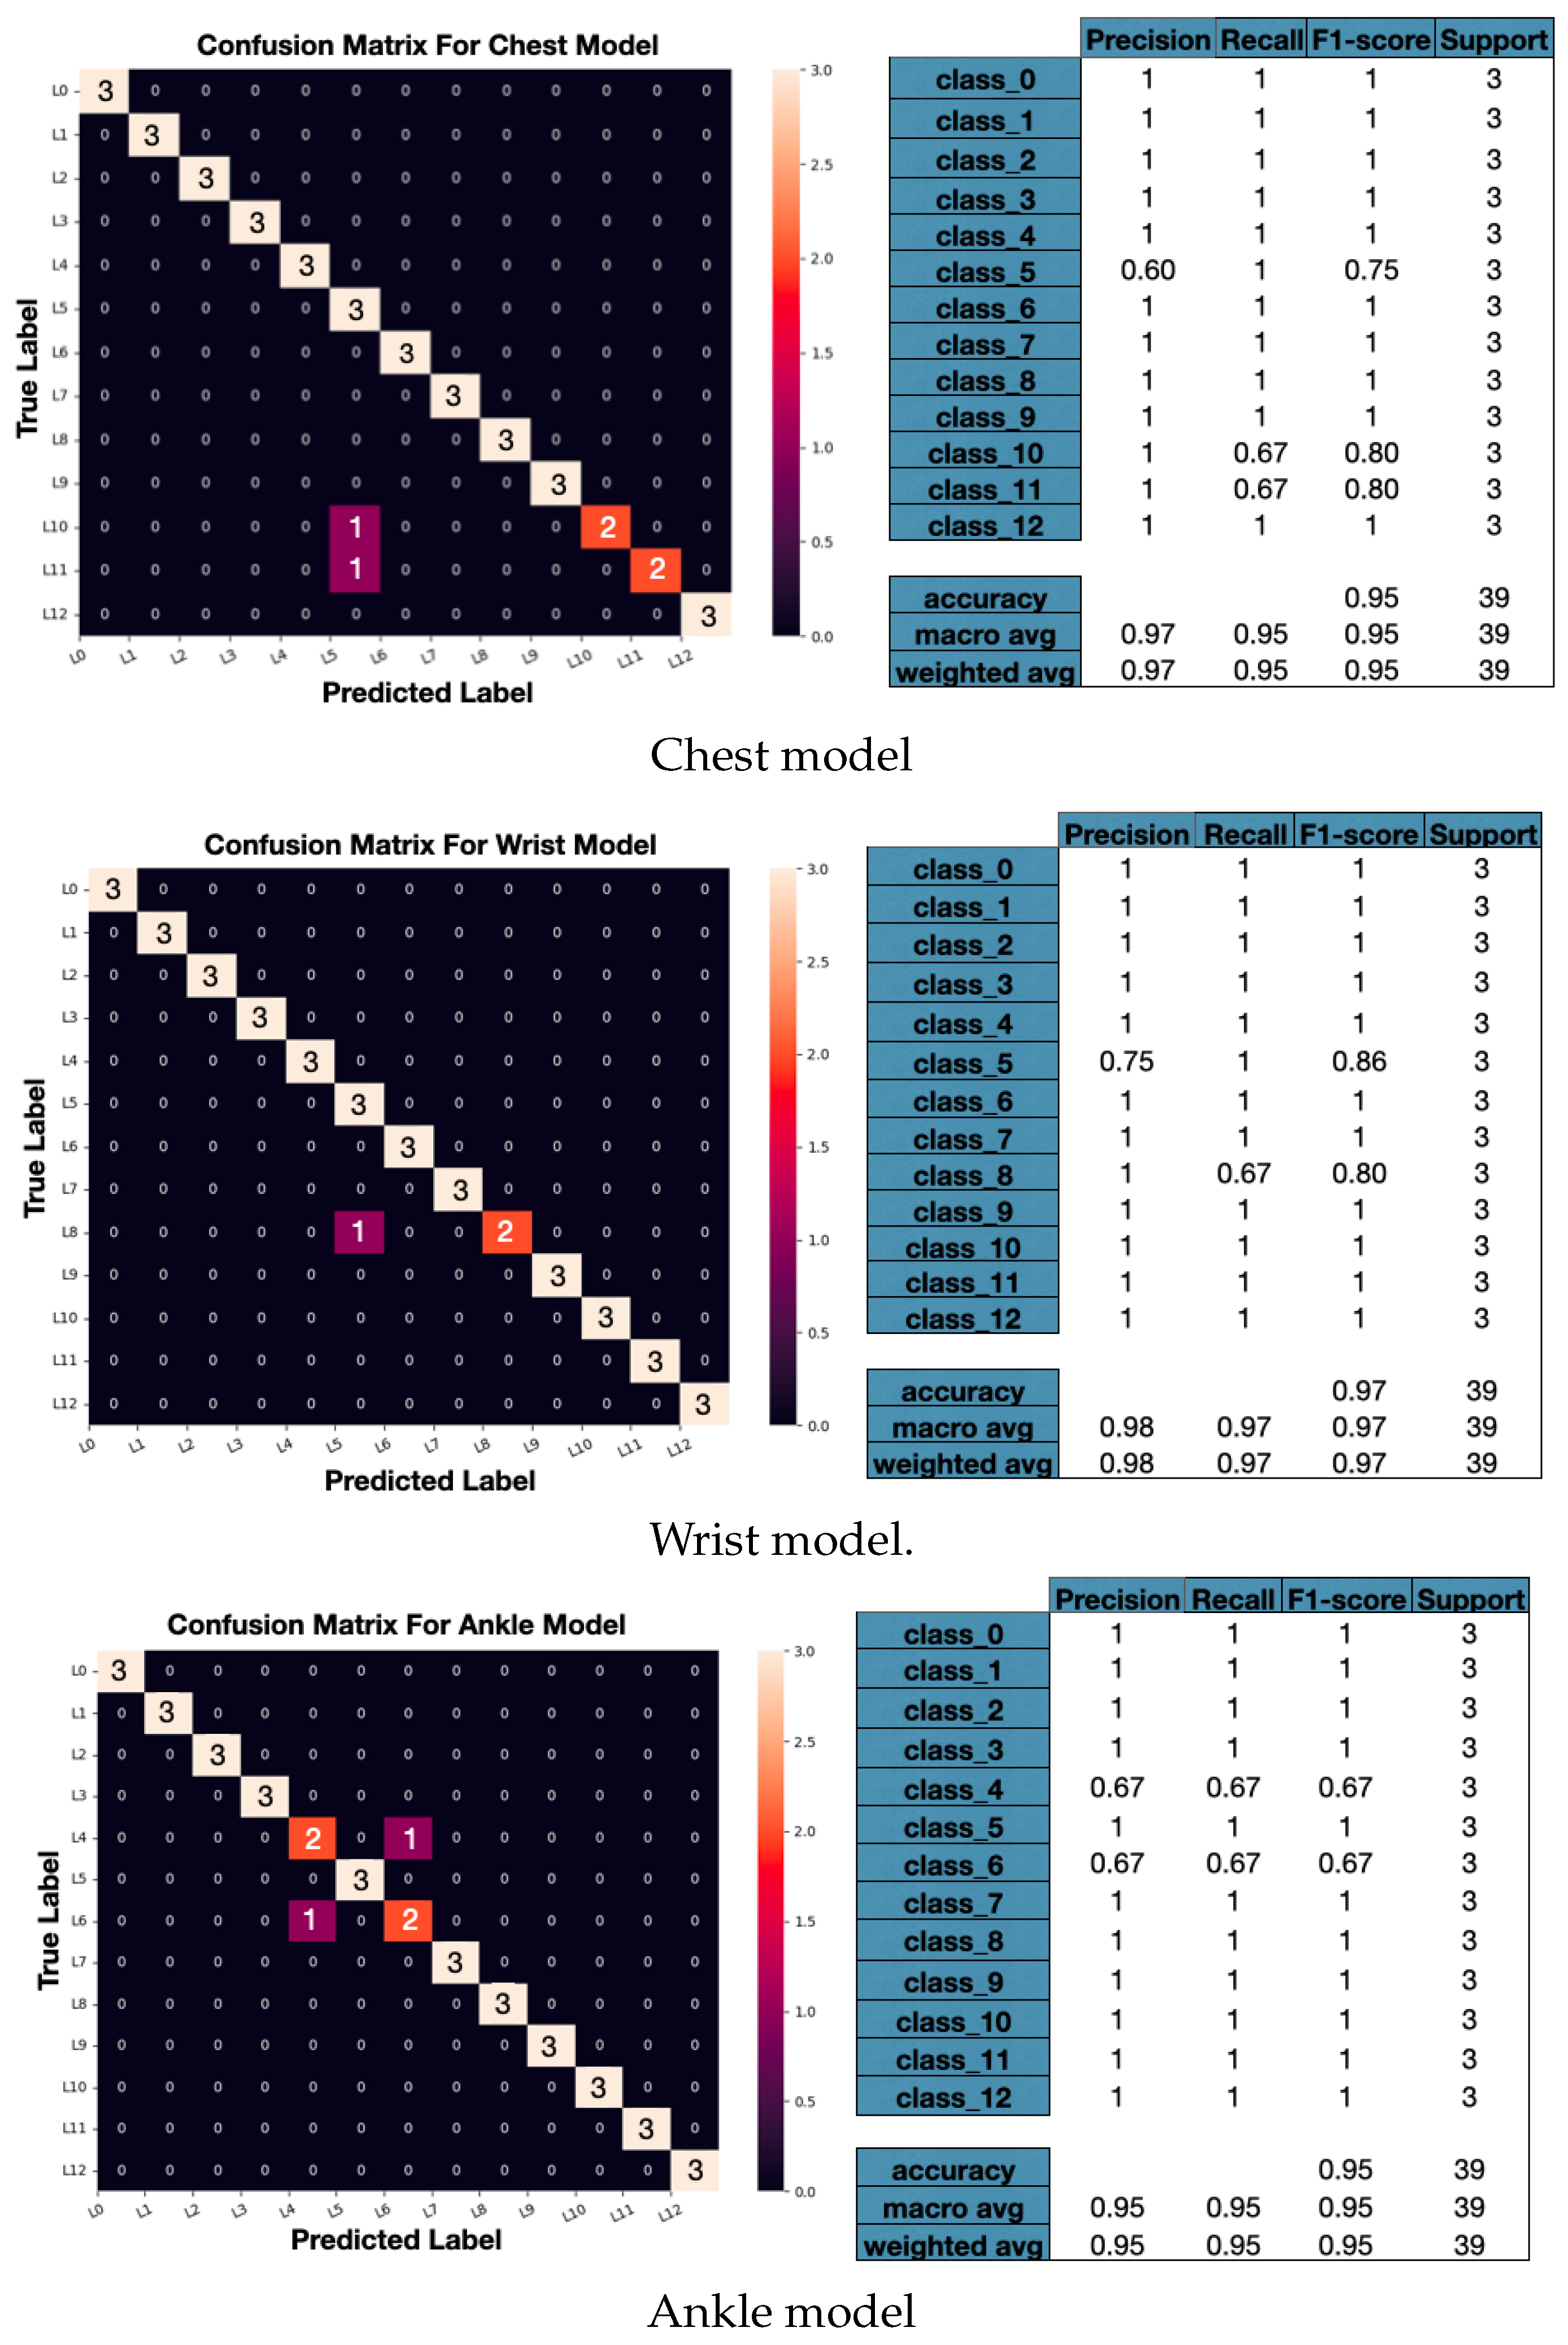
Once the position of the sensor has been determined, the next step is to classify the 12 previously labeled activities, shown in Table 3. A proposed features vector composed of 399 elements is used as the input to train activity recognition models, including curvature radius and statistics such as the mean and variance, with the features shown in Table 4. Therefore, three different neural network model structures of FFNN type were constructed. For any of the three cases, the input vector has the same dimensions, so the difference resides in the parameters of the ANN applied in each case. The results in Figure 10 show the performance of physical activity models.

Figure 10.
Performances of the HAR algorithms based on FFNNs when the model is tested.
According to the results from the chest model, the activities with an F1-score of 1, indicating the best performance, are standing still (L1), sitting and relaxing (L2), lying down (L3), walking (L4), forward waist bends (L6), frontal elevation of arms (L7), knee-bending (crouching) (L8), cycling (L9), and jump front–back (L12). This shows perfect precision and recall for these activities. The activities with the lowest performance are climbing stairs (L5), jogging (L10), and running (L11), which have lower F1-scores. Overall, the model has an accuracy of 95%, indicating strong classification ability.
For the ankle model, activities such as standing still (L1), sitting and relaxing (L2), lying down (L3), climbing stairs (L5), frontal elevation of arms (L7), knee-bending (crouching) (L8), cycling (L9), jogging (L10), running (L11), and jump front–back (L12) have accuracies and recalls of 1, showing perfect classification. Activities like walking (L4) and forward waist bends (L6) have lower accuracies and recalls of 0.67, indicating less accuracy. Overall, the model achieves a 95% accuracy, demonstrating strong performance in most cases.
Finally, in the wrist model, the activities with the best performance, where the model achieves perfect classification without errors, are standing still (L1), sitting and relaxing (L2), lying down (L3), walking (L4), forward waist bends (L6), frontal elevation of arms (L7), cycling (L9), jogging (L10), running (L11), and jump front–back (L12). The accuracy for climbing stairs (L5) and knee-bending (crouching) (L8) indicates that the percentage of times the model predicts the activity is 75% and 67%, respectively, which are the lowest. Overall, this model achieved the highest accuracy, at 97%.
Using only the curvature radius for training the models, the accuracy rates are 72% for the chest, 73% for the ankle, and 77% for the wrist, highlighting the usefulness of this feature.
Leave-One-Subject-Out (LOSO) validation was employed to assess the model’s robustness and generalization by evaluating its performance on data from a subject excluded during training. This approach offers a realistic estimate of how well the model generalizes to new individuals, helping to prevent overfitting and ensuring the model identifies general patterns rather than memorizing specific features of the training data.
The LOSO evaluation is showing in Table 5, it reveals a remarkable consistency in the accuracies obtained; the variations between subjects are minimal. This indicates that the model is robust to individual differences in the data. While the chest and wrist sensors show consistently high accuracies, the ankle sensor shows slight variability. This suggests that while the chest and wrist sensors offer greater classification stability, the ankle sensor may be subject to more noise or variability in the data, which influences the accuracy of the model.
Table 5.
Leave-One-Subject-Out (LOSO) cross-validation results.
4. Conclusions
In conclusion, the results suggest that the proposed features involving curvature radius are suitable and effective for constructing robust models for physical activity classification and position detection. Notably, using curvature radius alone achieves an accuracy of up to 77%. This underscores the significant role of curvature radius in HAR models, providing crucial insights into the dynamics and characteristics of human movements. The RF model performs excellent overall performance, with an overall accuracy of 97%, indicating its ability to correctly classify most positions. The wrist signals model shows the highest accuracy at 97%, but all classification models perform well, with accuracies above 95%.
Discussion and Limitations
Our methodology’s advantage lies in its ability to achieve high precision using only a few features; this offers advantages in terms of simplicity and computational efficiency, and unlike methods that employ frequency domain features or combinations of both domains, our approach avoids complex transformations, thus reducing processing and memory requirements.
Although, the calculation of the curvature radius is highly dependent on the dynamics of the movement. In activities with little dynamic variation, the ability of the model to extract useful information may be diminished. The sensitivity of the radius of curvature to the lack of variability in the data may limit the effectiveness of the method, which suggests that future research should address these aspects to further optimize the accuracy and applicability in various physical activity monitoring scenarios.
Despite these challenges, the simplicity and efficiency of our approach provides an attractive balance between performance and computational load, which is beneficial for applications on portable devices with limited resources.
Author Contributions
Conceptualization, E.C.-H., J.R.-R. and H.M.R.-U.; methodology, E.C.-H., J.R.-R. and H.M.R.-U.; software, E.C.-H., H.M.R.-U. and J.R.-R.; validation, E.C.-H., J.R.-R., H.M.R.-U. and G.L.O.-G.; formal analysis, E.C.-H., H.M.R.-U. and J.R.-R.; investigation, E.C.-H., R.F.E.-J., V.M.A.-M. and G.L.O.-G.; writing—original draft preparation, E.C.-H.; writing—review and editing, E.C.-H., H.M.R.-U. and J.R.-R.; supervision, J.R.-R., H.M.R.-U., V.M.A.-M., R.F.E.-J. and G.L.O.-G. All authors have read and agreed to the published version of the manuscript.
Funding
This research received no external funding.
Data Availability Statement
Data are contained within the article.
Acknowledgments
The authors acknowledge CONAHCYT for supporting Elizabeth Cavita Huerta through a Ph.D. Scholarship.
Conflicts of Interest
The authors declare no conflicts of interest.
References
- Cao, Z.B. Physical activity levels and physical activity recommendations in Japan. In Physical Activity, Exercise, Sedentary Behavior and Health; Springer: Tokyo, Japan, 2015; pp. 3–15. [Google Scholar]
- Black, N.; Johnston, D.W.; Propper, C.; Shields, M.A. The effect of school sports facilities on physical activity, health and socioeconomic status in adulthood. Soc. Sci. Med. 2019, 220, 120–128. [Google Scholar] [CrossRef] [PubMed]
- Atiq, F.; Mauser-Bunschoten, E.P.; Eikenboom, J.; van Galen, K.P.; Meijer, K.; de Meris, J.; Cnossen, M.H.; Beckers, E.A.; Laros-van Gorkom, B.A.; Nieuwenhuizen, L.; et al. Sports participation and physical activity in patients with von Willebrand disease. Haemophilia 2019, 25, 101–108. [Google Scholar] [CrossRef] [PubMed]
- Afshin, A.; Babalola, D.; Mclean, M.; Yu, Z.; Ma, W.; Chen, C.Y.; Arabi, M.; Mozaffarian, D. Information technology and lifestyle: A systematic evaluation of internet and mobile interventions for improving diet, physical activity, obesity, tobacco, and alcohol use. J. Am. Heart Assoc. 2016, 5, e003058. [Google Scholar] [CrossRef] [PubMed]
- Ungurean, L.; Brezulianu, A. An internet of things framework for remote monitoring of the healthcare parameters. Adv. Electr. Comput. Eng. 2017, 17, 11–16. [Google Scholar] [CrossRef]
- Ramanujam, E.; Perumal, T.; Padmavathi, S. Human activity recognition with smartphone and wearable sensors using deep learning techniques: A review. IEEE Sens. J. 2021, 21, 13029–13040. [Google Scholar] [CrossRef]
- Nweke, H.F.; Teh, Y.W.; Mujtaba, G.; Al-Garadi, M.A. Data fusion and multiple classifier systems for human activity detection and health monitoring: Review and open research directions. Inf. Fusion 2019, 46, 147–170. [Google Scholar] [CrossRef]
- Paraschiakos, S.; de Sá, S.; Okai, J.; Slagboom, E.; Beekman, M.; Knobbe, A. RNNs on Monitoring Physical Activity Energy Expenditure in Older People. arXiv 2020, arXiv:2006.01169. Available online: https://tinyurl.com/cfp7849a (accessed on 6 July 2021).
- Trost, S.G.; Wong, W.K.; Pfeiffer, K.A.; Zheng, Y. Artificial neural networks to predict activity type and energy expenditure in youth. Med. Sci. Sport. Exerc. 2012, 44, 1801. [Google Scholar] [CrossRef]
- Jang, Y.; Song, Y.; Noh, H.W.; Kim, S. A basic study of activity type detection and energy expenditure estimation for children and youth in daily life using 3-axis accelerometer and 3-stage cascaded artificial neural network. In Proceedings of the 2015 37th Annual International Conference of the IEEE Engineering in Medicine and Biology Society (EMBC), Milan, Italy, 25–29 August 2015; pp. 2860–2863. [Google Scholar]
- Dimiccoli, M.; Cartas, A.; Radeva, P. Activity Recognition from Visual Lifelogs: State of the Art and Future Challenges; Elsevier Ltd.: Amsterdam, The Netherlands, 2018; pp. 121–134. [Google Scholar] [CrossRef]
- Kang, K.H.; Shin, S.H.; Jung, J.; Kim, Y.T. Estimation of a Physical Activity Energy Expenditure with a Patch-Type Sensor Module Using Artificial Neural Network; John Wiley & Sons, Ltd.: Hoboken, NJ, USA, 2019; pp. 1–9. [Google Scholar] [CrossRef]
- Zeng, M.; Nguyen, L.T.; Yu, B.; Mengshoel, O.J.; Zhu, J.; Wu, P.; Zhang, J. Convolutional neural networks for human activity recognition using mobile sensors. In Proceedings of the 6th International Conference on Mobile Computing, Applications and Services, Austin, TX, USA, 6–7 November 2014; pp. 197–205. [Google Scholar]
- Xu, T.; Zhou, Y.; Zhu, J. New advances and challenges of fall detection systems: A survey. Appl. Sci. 2018, 8, 418. [Google Scholar] [CrossRef]
- Sathyanarayana, S.; Satzoda, R.K.; Sathyanarayana, S.; Thambipillai, S. Vision-based patient monitoring: A comprehensive review of algorithms and technologies. J. Ambient Intell. Humaniz. Comput. 2018, 9, 225–251. [Google Scholar] [CrossRef]
- Sunny, J.T.; George, S.M.; Kizhakkethottam, J.J. Applications and Challenges of Human Activity Recognition using Sensors in a Smart Environment. IJIRST—Int. J. Innov. Res. Sci. Technol. 2015, 2, 50–57. [Google Scholar]
- Bulling, A.; Blanke, U.; Schiele, B. A tutorial on human activity recognition using body-worn inertial sensors. ACM Comput. Surv. (CSUR) 2014, 46, 1–33. [Google Scholar] [CrossRef]
- Attal, F.; Mohammed, S.; Dedabrishvili, M.; Chamroukhi, F.; Oukhellou, L.; Amirat, Y. Physical human activity recognition using wearable sensors. Sensors 2015, 15, 31314–31338. [Google Scholar] [CrossRef] [PubMed]
- Mannini, A.; Sabatini, A.M.; Intille, S.S. Accelerometry-based recognition of the placement sites of a wearable sensor. Pervasive Mob. Comput. 2015, 21, 62–74. [Google Scholar] [CrossRef] [PubMed]
- Fujinami, K.; Kouchi, S. Recognizing a Mobile Phone’s Storing Position as a Context of a Device and a User. In Mobile and Ubiquitous Systems: Computing, Networking, and Services, Proceedings of the International Conference on Mobile and Ubiquitous Systems: Computing, Networking, and Services, Beijing, China, 12–14 December 2012; Springer: Berlin/Heidelberg, Germany, 2012; pp. 76–88. [Google Scholar]
- Durmaz Incel, O. Analysis of movement, orientation and rotation-based sensing for phone placement recognition. Sensors 2015, 15, 25474–25506. [Google Scholar] [CrossRef]
- Kunze, K.; Lukowicz, P. Dealing with sensor displacement in motion-based onbody activity recognition systems. In Proceedings of the 10th International Conference on Ubiquitous Computing, Seoul, Republic of Korea, 21–24 September 2008; pp. 20–29. [Google Scholar]
- Garnotel, M.; Simon, C.; Bonnet, S. Physical activity estimation from accelerometry. In Proceedings of the 2019 41st Annual International Conference of the IEEE Engineering in Medicine and Biology Society (EMBC), Berlin, Germany, 23–27 July 2019; pp. 6–10. [Google Scholar]
- Kurban, O.C.; Yildirim, T. Daily motion recognition system by a triaxial accelerometer usable in different positions. IEEE Sens. J. 2019, 19, 7543–7552. [Google Scholar] [CrossRef]
- Clevenger, K.A.; Pfeiffer, K.A.; Montoye, A.H. Cross-generational comparability of hip-and wrist-worn ActiGraph GT3X+, wGT3X-BT, and GT9X accelerometers during free-living in adults. J. Sport. Sci. 2020, 38, 2794–2802. [Google Scholar] [CrossRef]
- Bao, L.; Intille, S.S. Activity recognition from user-annotated acceleration data. In Pervasive Computing, Proceedings of the International Conference on Pervasive Computing, Vienna, Austria, 21–23 April 2004; Springer: Berlin/Heidelberg, Germany, 2004; pp. 1–17. [Google Scholar]
- Altini, M.; Penders, J.; Vullers, R.; Amft, O. Estimating energy expenditure using body-worn accelerometers: A comparison of methods, sensors number and positioning. IEEE J. Biomed. Health Inform. 2014, 19, 219–226. [Google Scholar] [CrossRef]
- Wang, J.; Chen, Y.; Hao, S.; Peng, X.; Hu, L. Deep learning for sensor-based activity recognition: A survey. Pattern Recognit. Lett. 2019, 119, 3–11. [Google Scholar] [CrossRef]
- Sharifani, K.; Amini, M. Machine learning and deep learning: A review of methods and applications. World Inf. Technol. Eng. J. 2023, 10, 3897–3904. [Google Scholar]
- Kanjo, E.; Younis, E.M.; Ang, C.S. Deep learning analysis of mobile physiological, environmental and location sensor data for emotion detection. Inf. Fusion 2019, 49, 46–56. [Google Scholar] [CrossRef]
- Lara, O.D.; Labrador, M.A. A survey on human activity recognition using wearable sensors. IEEE Commun. Surv. Tutor. 2012, 15, 1192–1209. [Google Scholar] [CrossRef]
- Zhang, H.; Xiao, Z.; Wang, J.; Li, F.; Szczerbicki, E. A novel IoT-perceptive human activity recognition (HAR) approach using multihead convolutional attention. IEEE Internet Things J. 2019, 7, 1072–1080. [Google Scholar] [CrossRef]
- Hu, C.; Chen, Y.; Peng, X.; Yu, H.; Gao, C.; Hu, L. A Novel Feature Incremental Learning Method for Sensor-Based Activity Recognition. IEEE Trans. Knowl. Data Eng. 2019, 31, 1038–1050. [Google Scholar] [CrossRef]
- Kuncan, F.; Kaya, Y.; Kuncan, M. A novel approach for activity recognition with down-sampling 1D local binary pattern. Adv. Electr. Comput. Eng. 2019, 19, 35–44. [Google Scholar] [CrossRef]
- Wei, X.; Wang, Z. TCN-attention-HAR: Human activity recognition based on attention mechanism time convolutional network. Sci. Rep. 2024, 14, 7414. [Google Scholar] [CrossRef]
- Ray, L.S.S.; Geißler, D.; Liu, M.; Zhou, B.; Suh, S.; Lukowicz, P. ALS-HAR: Harnessing Wearable Ambient Light Sensors to Enhance IMU-based HAR. arXiv 2024, arXiv:2408.09527. [Google Scholar]
- Liandana, M.; Hostiadi, D.P.; Pradipta, G.A. A New Approach for Human Activity Recognition (HAR) Using A Single Triaxial Accelerometer Based on a Combination of Three Feature Subsets. Int. J. Intell. Eng. Syst. 2024, 17, 235–250. [Google Scholar]
- Geravesh, S.; Rupapara, V. Artificial neural networks for human activity recognition using sensor based dataset. Multimed. Tools Appl. 2023, 82, 14815–14835. [Google Scholar] [CrossRef]
- Hafeez, S.; Alotaibi, S.S.; Alazeb, A.; Al Mudawi, N.; Kim, W. Multi-Sensor-Based Action Monitoring and Recognition via Hybrid Descriptors and Logistic Regression. IEEE Access 2023, 11, 48145–48157. [Google Scholar] [CrossRef]
- Jantawong, P.; Jitpattanakul, A.; Mekruksavanich, S. Enhancement of Human Complex Activity Recognition using Wearable Sensors Data with InceptionTime Network. In Proceedings of the 2021 2nd International Conference on Big Data Analytics and Practices (IBDAP), Bangkok, Thailand, 26–27 August 2021. [Google Scholar]
- Mekruksavanich, S.; Jitpattanakul, A.; Sitthithakerngkiet, K.; Youplao, P.; Yupapin, P. Resnet-se: Channel attention-based deep residual network for complex activity recognition using wrist-worn wearable sensors. IEEE Access 2022, 10, 51142–51154. [Google Scholar] [CrossRef]
- Lohit, S.; Wang, Q.; Turaga, P. Temporal transformer networks: Joint learning of invariant and discriminative time warping. In Proceedings of the IEEE/CVF Conference on Computer Vision and Pattern Recognition, Long Beach, CA, USA, 15–20 June 2019; pp. 12426–12435. [Google Scholar]
- Neverova, N.; Wolf, C.; Lacey, G.; Fridman, L.; Chandra, D.; Barbello, B.; Taylor, G. Learning human identity from motion patterns. IEEE Access 2016, 4, 1810–1820. [Google Scholar] [CrossRef]
- AlShorman, O.; Alshorman, B.; Masadeh, M.S. A review of physical human activity recognition chain using sensors. Indones. J. Electr. Eng. Inform. (IJEEI) 2020, 8, 560–573. [Google Scholar]
- Karantonis, D.M.; Narayanan, M.R.; Mathie, M.; Lovell, N.H.; Celler, B.G. Implementation of a real-time human movement classifier using a triaxial accelerometer for ambulatory monitoring. IEEE Trans. Inf. Technol. Biomed. 2006, 10, 156–167. [Google Scholar] [CrossRef]
- Banos, O.; Garcia, R.; Holgado-Terriza, J.A.; Damas, M.; Pomares, H.; Rojas, I.; Saez, A. mHealthDroid: A novel framework for agile development of mobile health applications. In Proceedings of the International Workshop on Ambient Assisted Living, Belfast, UK, 2–5 December 2014; pp. 2–5. [Google Scholar]
- Yang, J. Toward physical activity diary: Motion recognition using simple acceleration features with mobile phones. In Proceedings of the 1st International Workshop on Interactive Multimedia for Consumer Electronics, Beijing, China, 23 October 2009; pp. 1–10. [Google Scholar]
- Fridolfsson, J.; Börjesson, M.; Buck, C.; Ekblom, Ö.; Ekblom-Bak, E.; Hunsberger, M.; Lissner, L.; Arvidsson, D. Effects of frequency filtering on intensity and noise in accelerometer-based physical activity measurements. Sensors 2019, 19, 2186. [Google Scholar] [CrossRef]
- Preece, S.J.; Goulermas, J.Y.; Kenney, L.P.; Howard, D. A comparison of feature extraction methods for the classification of dynamic activities from accelerometer data. IEEE Trans. Biomed. Eng. 2008, 56, 871–879. [Google Scholar] [CrossRef]
- Dehghani, A.; Sarbishei, O.; Glatard, T.; Shihab, E. A quantitative comparison of overlapping and non-overlapping sliding windows for human activity recognition using inertial sensors. Sensors 2019, 19, 5026. [Google Scholar] [CrossRef]
- San-Segundo, R.; Montero, J.M.; Barra-Chicote, R.; Fernández, F.; Pardo, J.M. Feature extraction from smartphone inertial signals for human activity segmentation. Signal Process. 2016, 120, 359–372. [Google Scholar] [CrossRef]
- Shoaib, M.; Bosch, S.; Incel, O.D.; Scholten, H.; Havinga, P.J. A survey of online activity recognition using mobile phones. Sensors 2015, 15, 2059–2085. [Google Scholar] [CrossRef]
- Nweke, H.F.; Teh, Y.W.; Al-Garadi, M.A.; Alo, U.R. Deep learning algorithms for human activity recognition using mobile and wearable sensor networks: State of the art and research challenges. Expert Syst. Appl. 2018, 105, 233–261. [Google Scholar] [CrossRef]
- Bennasar, M.; Price, B.A.; Gooch, D.; Bandara, A.K.; Nuseibeh, B. Significant features for human activity recognition using tri-axial accelerometers. Sensors 2022, 22, 7482. [Google Scholar] [CrossRef]
- Gil-Martín, M.; San-Segundo, R.; Fernandez-Martinez, F.; Ferreiros-López, J. Improving physical activity recognition using a new deep learning architecture and post-processing techniques. Eng. Appl. Artif. Intell. 2020, 92, 103679. [Google Scholar] [CrossRef]
- Dua, N.; Singh, S.N.; Semwal, V.B. Multi-input CNN-GRU based human activity recognition using wearable sensors. Computing 2021, 103, 1461–1478. [Google Scholar] [CrossRef]
- Kutlay, M.A.; Gagula-Palalic, S. Application of machine learning in healthcare: Analysis on MHEALTH dataset. Southeast Eur. J. Soft Comput. 2016, 4. [Google Scholar] [CrossRef]
- Cosma, G.; Mcginnity, T.M. Feature extraction and classification using leading eigenvectors: Applications to biomedical and multi-modal mHealth data. IEEE Access 2019, 7, 107400–107412. [Google Scholar] [CrossRef]
- Sztyler, T.; Stuckenschmidt, H. On-body localization of wearable devices: An investigation of position-aware activity recognition. In Proceedings of the 2016 IEEE International Conference on Pervasive Computing and Communications (PerCom), Sydney, NSW, Australia, 14–19 March 2016; pp. 1–9. [Google Scholar]
- Ciuti, G.; Ricotti, L.; Menciassi, A.; Dario, P. MEMS sensor technologies for human centred applications in healthcare, physical activities, safety and environmental sensing: A review on research activities in Italy. Sensors 2015, 15, 6441–6468. [Google Scholar] [CrossRef]
- Janidarmian, M.; Roshan Fekr, A.; Radecka, K.; Zilic, Z. A comprehensive analysis on wearable acceleration sensors in human activity recognition. Sensors 2017, 17, 529. [Google Scholar] [CrossRef]
- Coskun, D.; Incel, O.D.; Ozgovde, A. Phone position/placement detection using accelerometer: Impact on activity recognition. In Proceedings of the 2015 IEEE Tenth International Conference on Intelligent Sensors, Sensor Networks and Information Processing (ISSNIP), Singapore, 7–9 April 2015; pp. 1–6. [Google Scholar]
- O’Halloran, J.; Curry, E. A Comparison of Deep Learning Models in Human Activity Recognition and Behavioural Prediction on the MHEALTH Dataset. In Proceedings of the Irish Conference on Artificial Intelligence and Cognitive Science, Galway, Ireland, 5–6 December 2019; pp. 212–223. [Google Scholar]
- Nguyen, Q.H.; Ly, H.B.; Ho, L.S.; Al-Ansari, N.; Le, H.V.; Tran, V.Q.; Prakash, I.; Pham, B.T. Influence of data splitting on performance of machine learning models in prediction of shear strength of soil. Math. Probl. Eng. 2021, 2021, 4832864. [Google Scholar] [CrossRef]


Disclaimer/Publisher’s Note: The statements, opinions and data contained in all publications are solely those of the individual author(s) and contributor(s) and not of MDPI and/or the editor(s). MDPI and/or the editor(s) disclaim responsibility for any injury to people or property resulting from any ideas, methods, instructions or products referred to in the content. |
© 2024 by the authors. Licensee MDPI, Basel, Switzerland. This article is an open access article distributed under the terms and conditions of the Creative Commons Attribution (CC BY) license (https://creativecommons.org/licenses/by/4.0/).