Article

Investigation of Details in the Transition to Synchronization in Complex Networks by Using Recurrence Analysis

by
Roberto C. Budzinski
*,
Bruno Rafael Reichert Boaretto
,
Thiago L. Prado
and
Sergio Roberto Lopes
Departamento de Física, Universidade Federal do Paraná, 81531-980 Curitiba, PR, Brazil
*
Author to whom correspondence should be addressed.
Math. Comput. Appl. 2019, 24(2), 42; https://doi.org/10.3390/mca24020042
Submission received: 18 March 2019 / Revised: 10 April 2019 / Accepted: 17 April 2019 / Published: 20 April 2019
(This article belongs to the Special Issue Dynamics Days Latin America and the Caribbean 2018)

Abstract

:
The study of synchronization in complex networks is useful for understanding a variety of systems, including neural systems. However, the properties of the transition to synchronization are still not well known. In this work, we analyze the details of the transition to synchronization in complex networks composed of bursting oscillators under small-world and scale-free topologies using recurrence quantification analysis, specifically the determinism. We demonstrate the existence of non-stationarity states in the transition region. In the small-world network, the transition region denounces the existence of two-state intermittency.

1. Introduction

Many natural phenomena can be modeled and studied through a mathematical approach. Especially, complex networks are useful for analyzing problems involving physical, biological, chemical, engineering, and even social perspectives [1,2]. In this way, coupled oscillators are able to investigate a large class of dynamical systems in a theoretical, computational or even experimental field [3,4,5,6]. As an example, neural networks can be understood as coupled oscillators where it is possible to associate the bursting neuron to a phase oscillator [7].
In the scenario of complex networks, the neural system can be modeled on two scales. In the internal connection scheme, each network node can be understood as a neuron and their connections as the edges [8], which are able to simulate a single network, as used in many works [9,10,11,12,13]. On the other hand, considering the inter-networks connection scheme, it is possible to consider a neural system composed of different sub-areas, so each sub-network can be understood as a node and their connections as the edges, building a network of networks [14,15,16,17,18].
The connection architecture of complex networks is very important in the dynamical properties observed at a global level of behavior. Regarding neural networks, many topologies are considered, such as small-world, scale-free, and random ones [9,16,19] where a transition from unsynchronized to synchronized states is observed. The role of connection architecture is very important to the paths to synchronization, where different phenomena can be observed as a function of topology [20,21,22]. In real neural systems, the characteristics of these topology schemes are observed [23,24,25], which motivates the investigation of the influence of topology on the dynamical properties of the networks.
Regarding complex networks, it is known that this kind of system can show emergent behavior, where the global behavior observed is richer than the sum of the individual element behaviors. In this way, the existence of non-monotonic transitions to synchronization as a function of coupling strength in neural networks [26,27,28,29,30], where non-stationary states can be noticed, has been reported in the literature. In some cases, in the transition region, on–off intermittency in the two states has been observed, where the network displays the existence of two locally stable states but globally unstable ones [18,26], as defined in [31]. In [9], the dynamical properties regarding synchronization and transition characteristics are studied as a function of the connection architecture, with both small-world and random topologies being considered. In the present paper, we extend the analysis and consider the scale-free topology, since there are topological differences between the connection schema. In the small-world network, there is a local connection structure plus a non-local one. On the other hand, in the random network, there is homogeneity in the connectivity distribution, which consists of an assortative network and composes a very different scenario in comparison to the scale-free network, which generally consists of hubs of connections and forms a disassortative network [32,33]. In fact, these differences may influence the dynamical properties of systems regarding synchronization, as observed in [20,21,22,33].
In order to simulate the neural behavior, we consider the coupled map developed by Rulkov [34]. Using this model, it is possible to reproduce bursting behavior, which is characterized by a sequence of chaotic spikes followed by a period of resting [35]. This kind of neural activity is observed in real neural systems, as reported in [36,37,38]. The building of networks involves two different topologies: small-world, obtained through the Newman–Watts route [39], and scale-free (power law distribution of connectivity), obtained through the Barabasi–Albert approach [40], since these topologies characteristics are observed in real neural systems.
To perform the numerical analyses of dynamical properties regarding phase synchronization and (non-)stationarity of the transition region, the Kuramoto order parameter [3] and recurrence quantification analysis (RQA) [41,42] are used. In RQA, the determinism is used, which evaluates the ratio of recurrent points that belong to diagonal structures. To use the Kuramoto order parameter, data from each neuron that composes the network is necessary since a phase is associated with the bursting behavior of all neurons. The use of recurrence quantification only requires a time series that characterizes the dynamical systems. In the case of networks, the determinism is evaluated from the mean field time series. It is known that the mean field of a phase synchronized network has a “periodic” oscillation where the amplitude is bigger than in an unsynhcronized case, as observed in [11,26]. This approach makes an experimental validation possible since the recurrence quantification analysis is able to analyze experimental time series [43,44,45,46].
In this paper, we investigate a network composed of 1024 chaotic bursting neurons simulated through the Rulkov map in terms of phase synchronization and transition region characteristics as a function of coupling strength. Here, we focus on the small-world and scale-free topologies and their influence on the dynamical properties of the neural networks. We show that the transition to phase synchronization depicts non-stationary characteristics; however, the transition occurs for smaller values of coupling strength in the scale-free network. On the other hand, the existence of two-state on–off intermittency is observed for the small-world network.
The paper is divided as follows. In Section 2, the Rulkov map and the bursting behavior are described. In Section 3, the connection architectures are shown, and the small-world and scale-free building approaches are described. In Section 4, the synchronization and intermittency quantifiers are presented. In Section 5, the results and a discussion are presented, which support the conclusions in Section 6.

2. Rulkov Map

The Rulkov map is able to reproduce different dynamical behaviors, such as chaotic spikes and a set of chaotic bursts [47]. The bi-dimensional Rulkov map can be described as
x t + 1 , i = α 1 + x t , i 2 + y t , i + I t , i ,
y t + 1 , i = y t , i β x t , i + γ ,
where xi and yi are the fast and slow variables of the ith neuron. The set of parameters (α = 4.1, β = γ = 0.001) is chosen in order to obtain the bursting behavior, following [34]. The coupling term Ii represents the influence of the other neurons in the ith neuron and is given by
I t , i = ε χ j = 1 N a i , j x t , j ,
where ε is the coupling strength, χ is the normalization factor given by the average number of connections in the network [48], and ai,j is the adjacency matrix element where
a i j = 1 , if i and j are connected , 0 , if i and j are not connected .
Here, we consider a small-world and a scale-free networks.
Figure 1 depicts an example of the dynamical behavior of the fast and slow variables of the Rulkov map. Panel (a) represents x where bursting behavior can be observed, which is characterized by a sequence of chaotic spikes followed by a resting time. Panel (b) depicts y as a function of t, where each time that a burst starts, the slow variable assumes a maximum. For the interval of coupling strength (ε) used, the bursting behavior is maintained.
Since the fast variable x reproduces the bursting behavior, it is possible to understand x as the neuron membrane potential, and the mean field potential can be described as [9]
V ¯ t = 1 N i = 1 N x t , i ,
where N = 1024 is the number of oscillators (neurons) in the network.

3. Connection Architecture

The topology is very important to the dynamical properties of the networks. In fact, in neural networks, the connection scheme can be even more important than the structural variants of the neurons [49]. In this way, many results show that neural systems can display different topological properties, with small-world and scale-free characteristics being observed in real systems [50,51,52,53].
To build the scale-free network, we used the Barabasi–Albert approach [54], which can be described by two processes:
  • the network is expanded by the addition of new nodes;
  • the nodes added preferentially build connections to nodes that are already well-connected.
This approach is able to build a network where the distribution of the connectivity probability follows a power law: P(k) ∼ kν with ν > 1.
Regarding real neural systems, experimental evidence indicates that some brain activities may depict scale-free properties where the average number of connections is ≈4 [52,53]. Moreover, it is known that the human functional network may present scale-free characteristics where there is a power-law connectivity distribution following an exponent 2.0 ≤ ν ≤ 2.2 [52].
The scale-free network used in this paper has N = 1024 nodes with n = 4088 connections and ν = 2.20, which gives an average number of connections of χsf = 4, which is used as the normalization factor in Equation (3).
In order to obtain the small-world connection matrix, the Newman–Watts route is used [39], where non-local connections are added in a second neighborhood regular network with a probability of p. The network is composed of N = 1024 nodes, and the total number of connections is given by
n = 4 N local + N ( N 5 ) p nonlocal ,
where p = 1 leads to a globally connected network. Here, the number of local connection is 4096, and by using p = 5.3 × 10⁻⁴, 554 non-local connections are obtained, which leads to n = 4650 connections. For this network, the average number of connections is given by χsw = 4.53.
It is possible to evaluate the average path length (L) and the clustering coefficient (C) [50] of the small-world network. For the matrix used in this paper, Csw = 0.3585 ∼ 10−1 and Lsw = 6.012 ∼ 1 are obtained using the NetworkX library [55]. However, it is possible to evaluate these quantifiers for an equivalent (with a similar number of connections) random network using the expressions Lrandom ∼ ln(N)/ln(n/N) and Crandomn/N2 [56].
Defining the merit variable Γ = λC/λL where λL = Lsw/Lrandom and λC = Csw/Crandom [57,58] is possible to analyze the small-world existence condition. If Γ > 1, then the network considered has a small-world topology. For the network used here, Crandom ∼ 10−3 and Lrandom ∼ 1, which leads to Γ ∼ 102, confirming that the networks used have a small-world topology.
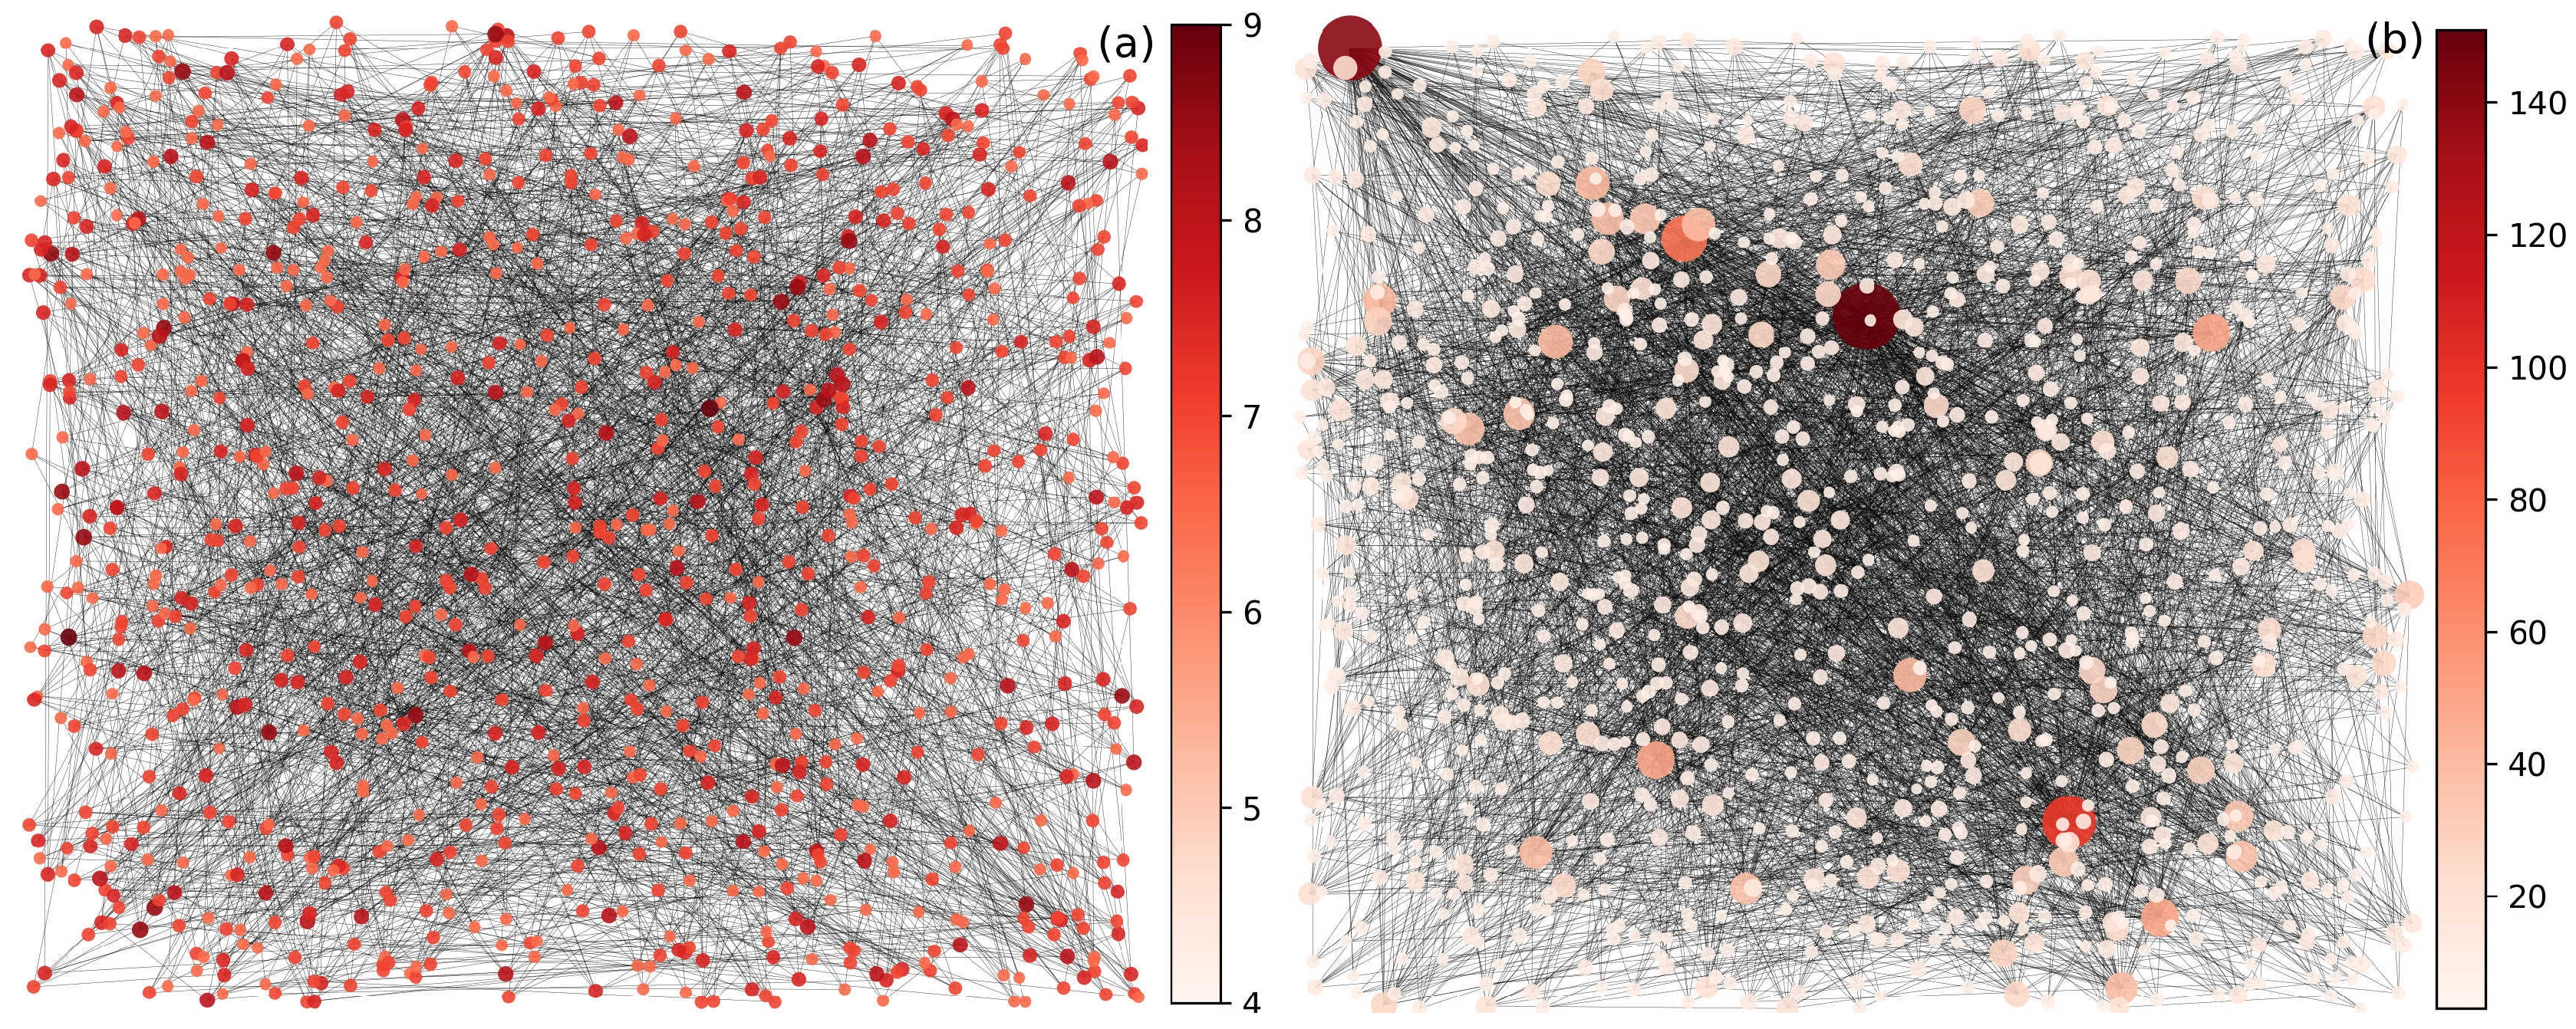
Figure 2 depicts the graph representation of the networks used in this paper. Panel (a) shows the small-world network, and panel (b) represents the scale-free one. One difference between the networks consists of the degree of connectivity, since in the small-world network the most connected neuron has 9 connections, while in the scale-free case this number is bigger than 140. Besides this, in the scale-free case is observed the formation of hubs characterized by larger connected neurons, which leads to non-homogeneity in the connectivity degree, while in the small-world network a different scenario is noticed, and the degree of neurons connectivity is similar.

4. Quantifiers

The synchronization of chaotic systems has been extensively studied since the last century [50,59,60,61]. Here, we focus on the phase synchronization of networks composed of bursting neurons. There are different approaches to obtain the phase of chaotic oscillators; however, we have used the slow variable y to identify every time a burst starts. In this way, the phase is increased by 2π every maximum of y, and a continuous variation of the phase is obtained through [60,62]
θ ( t ) = 2 π k + 2 π t t k t k + 1 t k , t k < t < t k + 1 ,
where tk,i is the time when the kth burst of the ith neuron starts. It is important to emphasize that the bursting behavior is maintained for the entire interval of coupling strength used (ε), which means that phase can be obtained from the time series of the maximum of y without reconstruction of the dynamics in the higher dimensional phase space [60].
To evaluate phase synchronization based on phase θ, the Kuramoto order parameter is used [3]. Considering the phase of all neurons, it is possible to define
R ( t ) = 1 N j = 1 N e i θ j ( t ) .
If the system is (not) in a phase synchronized state, then R → 1 (R → 0).
To obtain the synchronization level as a function of the coupling strength, the time average of R(t) can be computed for each value of ε. The mean value of the Kuramoto order parameter is given by
R = 1 t f t 0 t = t 0 t f R ( t ) ,
where tf is the total simulation time, and t0 is the transient time.
Recurrence quantification analyses are useful for analyzing the synchronization characteristics of dynamical systems [9,26,42,63,64]. The original work about recurrence analyses is based on a visual approach to identifying dynamical properties [65]. On the other hand, it is known that the mathematical structure of recurrence plots (RP) offers information about the dynamics of a system [41,42].
Here, we perform recurrence analyses based on the time series of the mean field of the network, described by Equation (4). In this case, the recurrence matrix is defined as
R a b ( δ ) = Θ ( δ | | x a x b | | ) , x a R , a , b = 1 , 2 , , S ,
where Θ is the Heaviside function, δ is the recurrence threshold, and S is the size of time series analyzed. Based on a time series of size S, of the mean field potential of the network described by Equation (4), it is possible to obtain the recurrence matrix through the use of Equation (9). The procedure consists in analyzing whether each point of the time series is close enough to another point (the difference between them must be smaller or equal to δ). After considering the entire time series, a matrix (S × S) is obtained where if a state xa is (not) recurrent to another xb, Rab assumes one (zero). The visual approach to analyzing the system consists of relating the recurrent (not recurrent) point to a black (white) dot [65]. In order to fix δ ∈ [0, 1], the time series of the mean field must be normalized.
In order to analyze the synchronization of the network, the diagonal lines in the recurrence matrix are very important since their distributions are related to the regularity of the trajectories. A diagonal line of length is understood as a segment of the trajectory rather close to another segment of the trajectory during time steps in a different time [41].
In this way, the better quantifier for the synchronization analysis is the determinism, which gives the ratio of recurrent points that belong to diagonal lines over all recurrent points in the recurrence matrix defined by Equation (9). This method is useful since the mean field of a phase synchronized network, depicted by Equation (4), has “periodic” oscillations, as observed in [26,30].The determinism is defined as
Δ ( min , δ , V ¯ ) = = min S P ( , δ ) = 1 S P ( , δ ) ,
where min is the minimum length to consider a diagonal line. P(, δ) is the probability distribution function (PDF) of the diagonal lines.
In a similar approach that uses the Kuramoto order parameter, it is possible to evaluate the mean value of the determinism using
Δ = 1 t f t 0 t = t 0 t f Δ ( t ) .

5. Results and Discussions

The numerical results have been obtained from initial conditions that follow a random distribution in the intervals described by the fast and slow variables (see Figure 1), which avoid any initial trend. The transient time is given by t0 = 100,000.
An important point to note is the dependence of the recurrence quantification analyses (RQA) on the recurrence parameters, an particularly, the recurrence threshold (δ) and minimum diagonal length (min). If δ → 1, all points will be considered recurrent, and the determinism becomes saturated [41]. Similar behavior is obtained if min → 1, since all points will be considered as diagonal structures [41]. In order to use RQA to investigate dynamical properties regarding phase synchronization and/or non-stationarity, it is necessary to optimize the quantifiers through the choice of recurrence parameters [9,43]. The choice of recurrence threshold parameter follows [43],where the condition is described by d[Δ(δ)]/ = “a maximum” leading to δ = 0.11, which results in the highest sensitivity of the quantifier determinism (Δ). The minimum diagonal length (min = 35) is chosen in order avoid small diagonals, and the determinism (Δ) is better able to distinguish the phase synchronized states [9]. The determinism is evaluated using a moving window of 10,000 points.
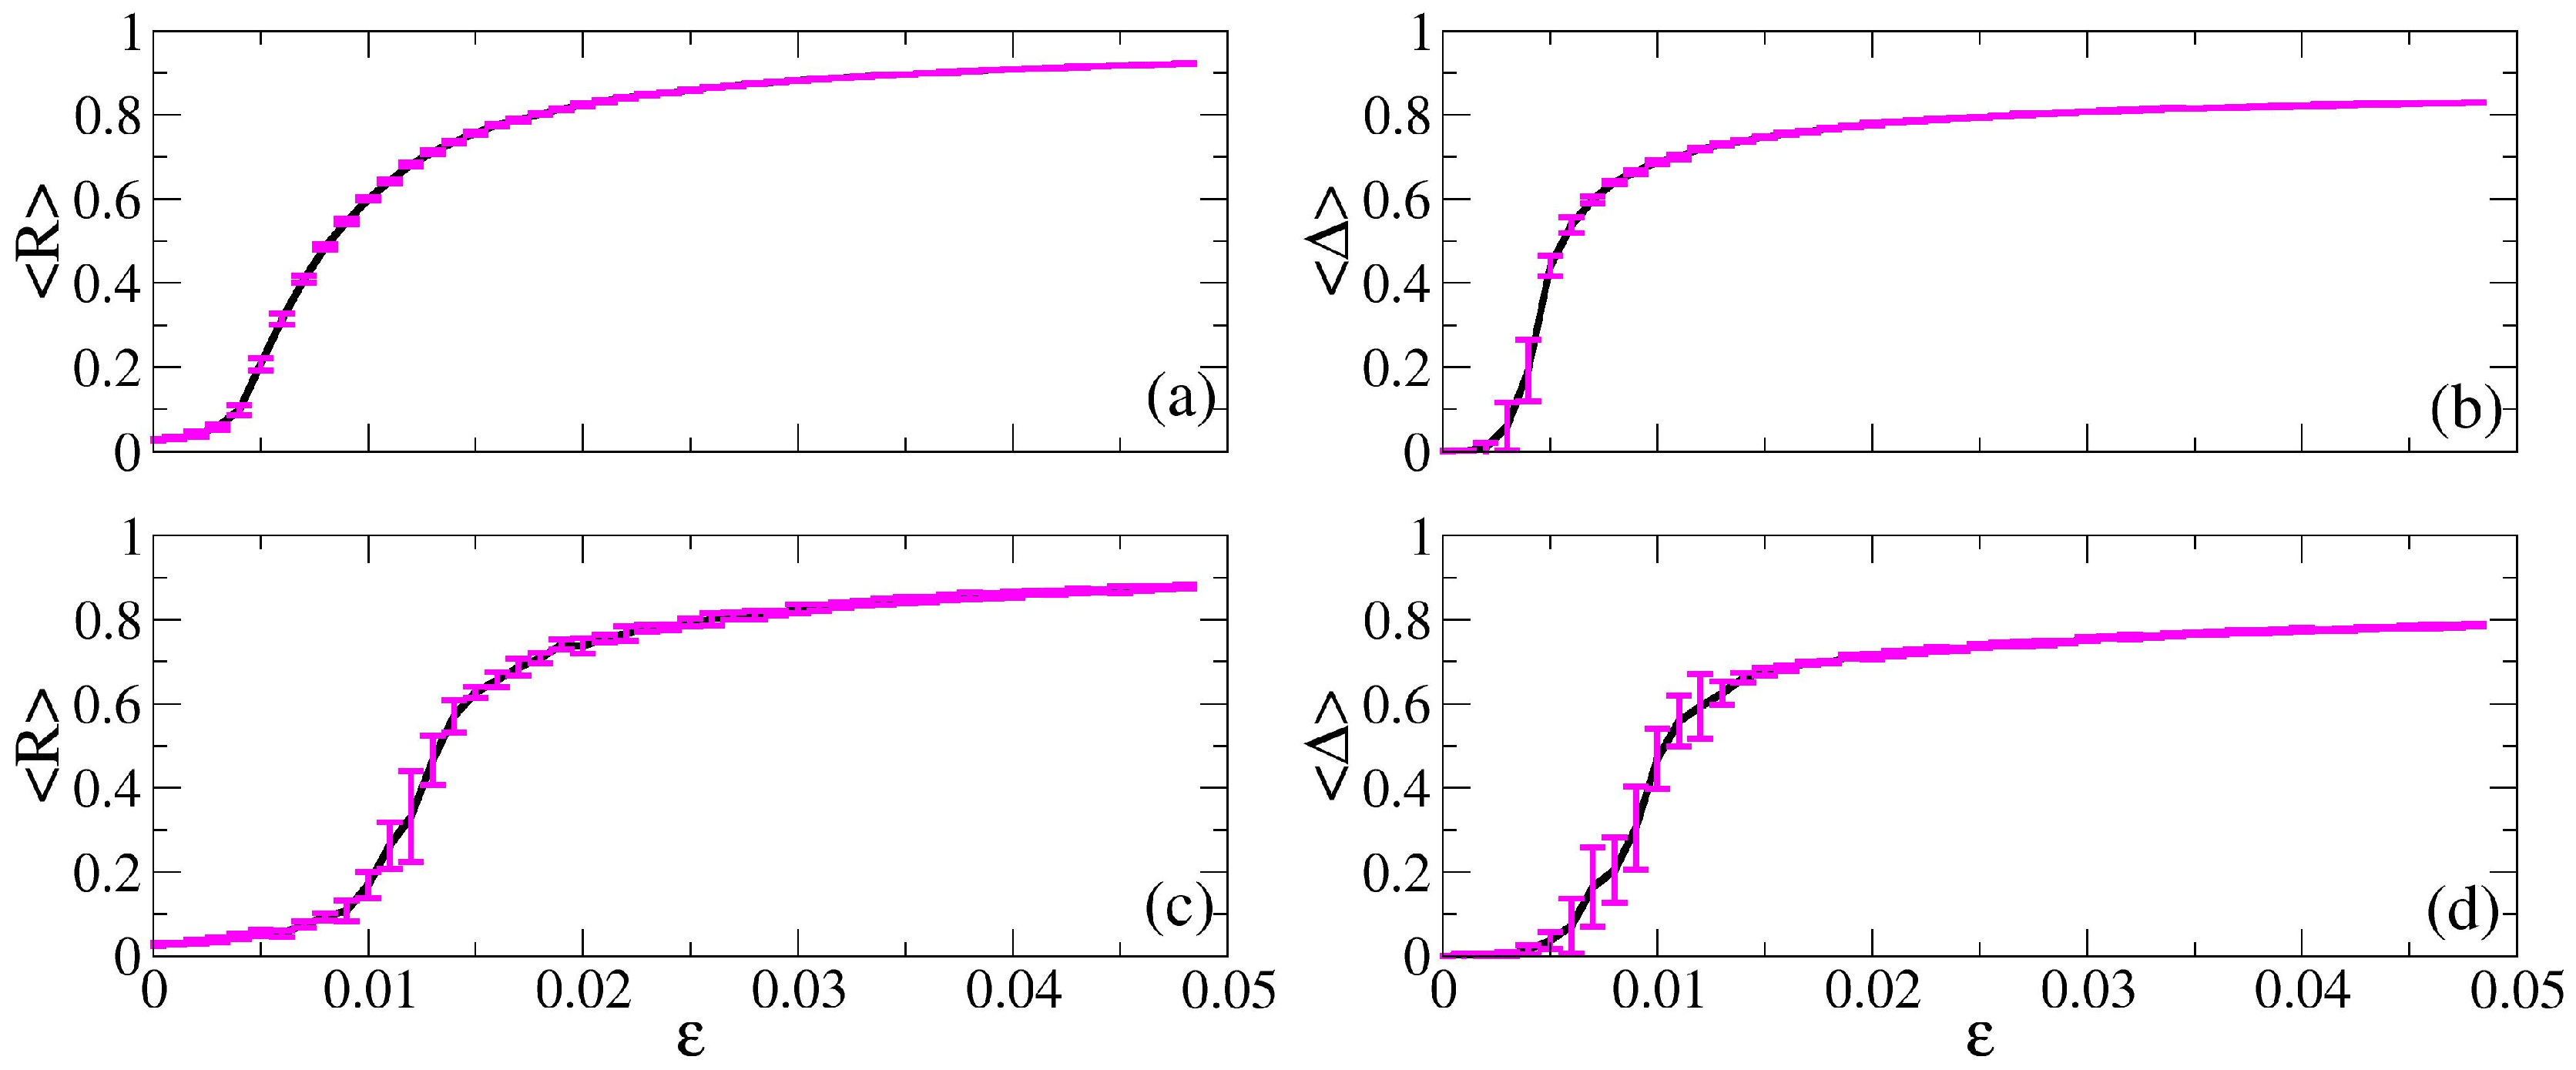
The phase synchronization main scenario is depicted in Figure 3, where the synchronization characteristics are studied as a function of the coupling strength. Here, the total time of simulation is given by tf = 250,000. Panels (a) and (b) depict the mean value of the Kuramoto order parameter (〈R〉) and the mean value of the determinism (〈Δ〉) for the scale-free network. Panels (c) and (d) depict the same analysis for the small-world network. Here, 20 different seeds for the initialization of the system are considered, and the vertical magenta bars indicate the dispersion (standard deviation) over initial conditions. For both networks, a clear transition from unsynchronized to phase synchronized state is observed; however, in the scale-free network, the transition occurs for smaller values of coupling strength in comparison to the small-world network. The dispersion over initial conditions is bigger at the transition region for both cases; however, for the small-world network, the phenomenon is more visible. A similar scenario is observed in [9].
In the scale-free network, the transition occurs where 0.0025 < ε < 0.012, where the increase in the coupling strength makes the system reach the phase synchronized state. In the small-world network, the transition region is characterized by 0.005 < ε < 0.017, and phase synchronization is observed for higher values of ε. This fact indicates that the scale-free network reaches the phase synchronized states for smaller values of ε in comparison to the small-world network. A similar scenario is observed in [66], where small-world networks reach synchronous behavior slower than other topologies. However, it is important to emphasize that the coupling term given by Equation (3) depends on the coupling strength (ε) and normalization factor χ. In this case, the normalization factor for each network is given by χsf = 4 (scale-free) and χsw = 4.53 (small-world), which leads to a relative factor of 1.13 between them. On the other hand, the difference in the coupling strength regime for the occurrence of the transition and phase synchronization is bigger than 1.13, so it is possible to conclude that the scale-free network reaches the phase synchronized state for a smaller coupling strength than the small-world one. Considering the small-world and random networks, it is possible to observe a higher level of synchronization in the random case [9,16]. Here, a similar scenario to the small-world and scale-free case is obtained; however, a new phenomenon regarding the critical value of ε is observed, as previously mentioned. In fact, the scale-free network presents a smaller value of ε to reach synchronization in comparison to the small-world and random cases, as studied in [9]. A similar scenario is observed in [20].
In order to investigate the details regarding synchronization characteristics, Figure 4 depicts the fast variable x for all neurons in the network as a function of t. Panel (a) represents the scale-free network with ε = 0.002, panel (b) ε = 0.005, and panel (c) ε = 0.040. Panel (d) represents the small-world network with ε = 0.002, panel (e) ε = 0.011, and panel (f) ε = 0.040. In the unsynchronized states (panels (a) and (d)), the neurons start their bursts without any coherence; however, in the transition region (panels (b) and (e)), the formation of horizontal structures is noticed. Finally, in panels (c) and (f), the phase synchronization where the horizontal structures denounce the spatial–temporal coherence of their bursts can be noticed.
The mean field of the networks (Equation (4)) is depicted in Figure 5. It is important to note that the mean field consists of more easily experimentally accessible data than the individual signal. As observed in [12,30,67], the amplitude of the mean field of the network is related to the phase synchronization. Here, the scale-free (panels (a), (b), and (c)) and small-world networks (panels (d), (e), and (f)) are considered. In the unsynchronized cases (panels (a) and (d)) where ε = 0.002, the amplitude of the mean field V ¯ is vanishing. However, increases in the coupling strength (panel (b)—ε = 0.005 and panel (e)—ε = 0.011) lead the network to the transition region, where a small amplitude of V ¯ is observed. Importantly, the amplitude of the mean field varies as a function of t, as observed in [26], which indicates the possible existence of intermittency. Finally, for higher values of coupling ε = 0.040 (panels (c), and (f)), the mean field depicts an oscillatory behavior with a higher amplitude, and the frequencies are related to the bursting activity, which indicates phase synchronization behavior.
The “periodic” behavior of the mean field time series makes possible the use of RQA to evaluate the synchronization characteristics of the networks [9,26,67]. As depicted in Figure 3, the mean value of the determinism (〈Δ〉) is able to distinguish the level of phase synchronization. Figure 6 depicts the recurrence plot obtained from the recurrence matrix described by Equation (9), where the black dots are related to the recurrent points and the white dots to the non-recurrent ones. Here, the recurrence matrix is obtained from the mean field time series described by Equation (4) and depicted in Figure 5. Panel (a) of Figure 6 depicts the recurrence plot of an unsynchronized state, while panel (b) depicts the recurrence plot of a phase synchronized one. It is noticed that in the phase synchronized case, the diagonal structures are much clearer, which leads to a higher value of determinism (Δ) and makes its use possible for analyzing the synchronization characteristics of networks.
The determinism is able to distinguish between more (less) synchronized states with just the use of the mean field time series [26]. In this way, it is possible to analyze the time series of the determinism in order to obtain information about synchronization characteristics as a function of t. Following [9], the temporal standard deviation of the determinism time series for different values of coupling strength (ε) offers information about the intermittency between states with different synchronization levels.
σ ( A ) = 1 T t = 1 T ( A ( t ) A ) 2 ,
where A represents the Kuramoto order parameter (R) or the determinism (Δ), and T is the length of the time series considered. Here, a stationary time series of R or Δ leads to a vanishing value of σ. On the other hand, if the time series of R or Δ display an intermittent behavior, where the network assumes different synchronization level states as a function of t, then σ assumes higher values [18].
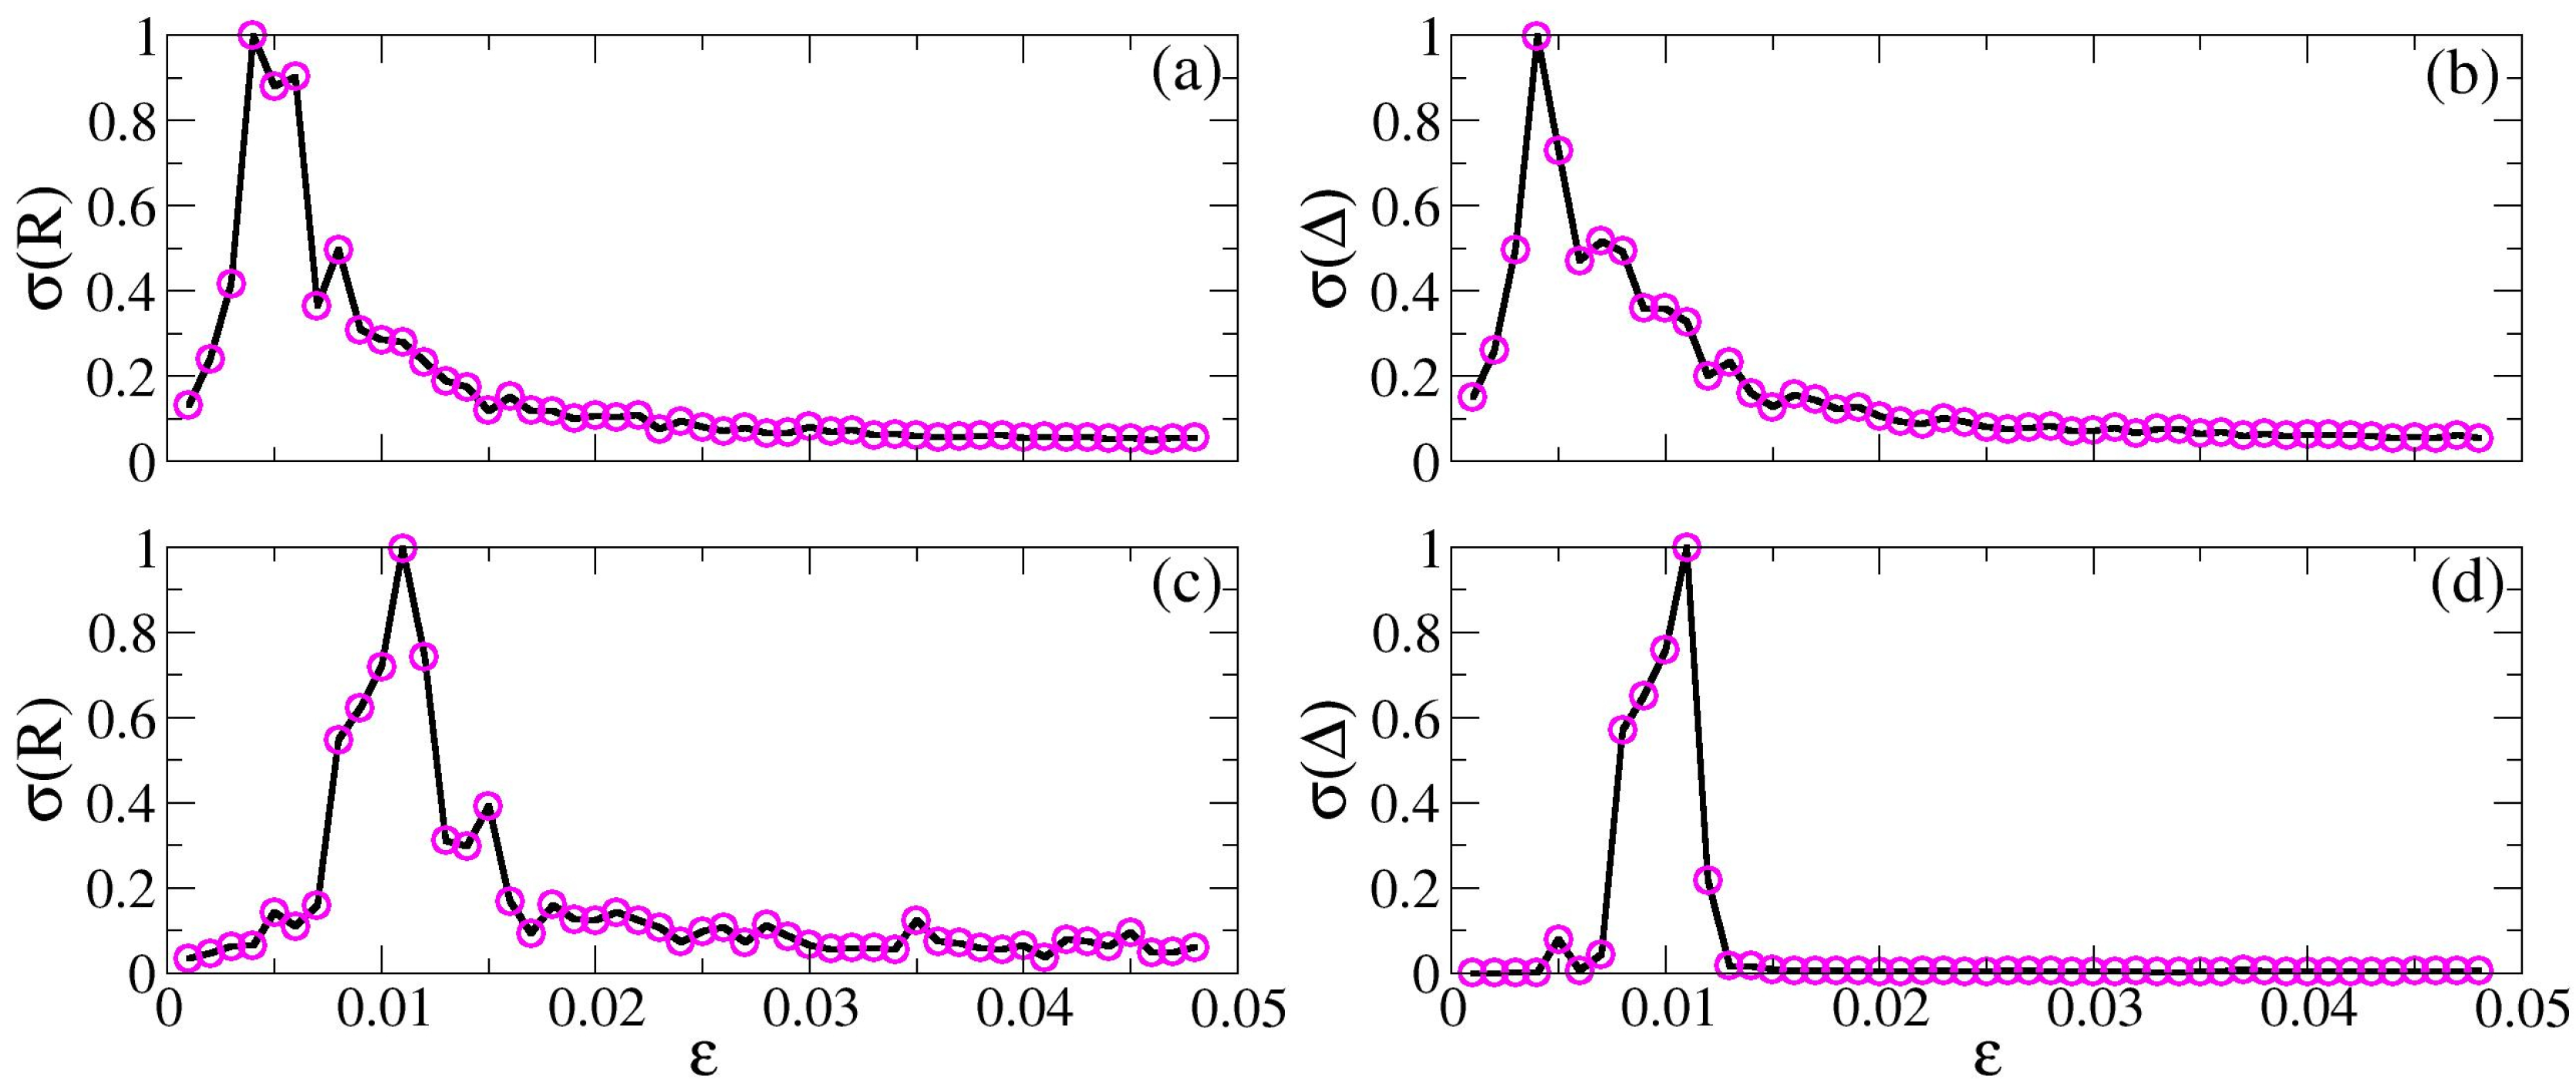
Figure 7 depicts the temporal standard deviation of the Kuramoto order parameter and the determinism time series as a function of the coupling strength (ε). Here, panels (a) and (b) depict σ(R) and σ(Δ) for the scale-free network, while panels (c) and (d) depict σ(R) and σ(Δ) for the small-world network, where σ is normalized by its maximum value. For all cases, it is observed that increases in the coupling strength lead to σ increases, until a maximum. After reaching the maximum, increases in ε lead to σ decreases until it reaches a vanishing value. Similar behavior is observed in [9], where the maximum of σ is located at the transition region of the coupling value.Here, the observed behavior is the same since the transition region depicted in Figure 3 is related to the region where σ depicts higher values. This is indicative of intermittent behavior [18]. Again, for the scale-free network, the transition region, and consequently the intermittent region, occur at smaller values of coupling strength in comparison to the small-world network (see discussion about Figure 3). In particular, the maximum occurs at ε ≈ 0.0045 in the scale-free network, and for the small-world network, the maximum is observed at ε ≈ 0.010.
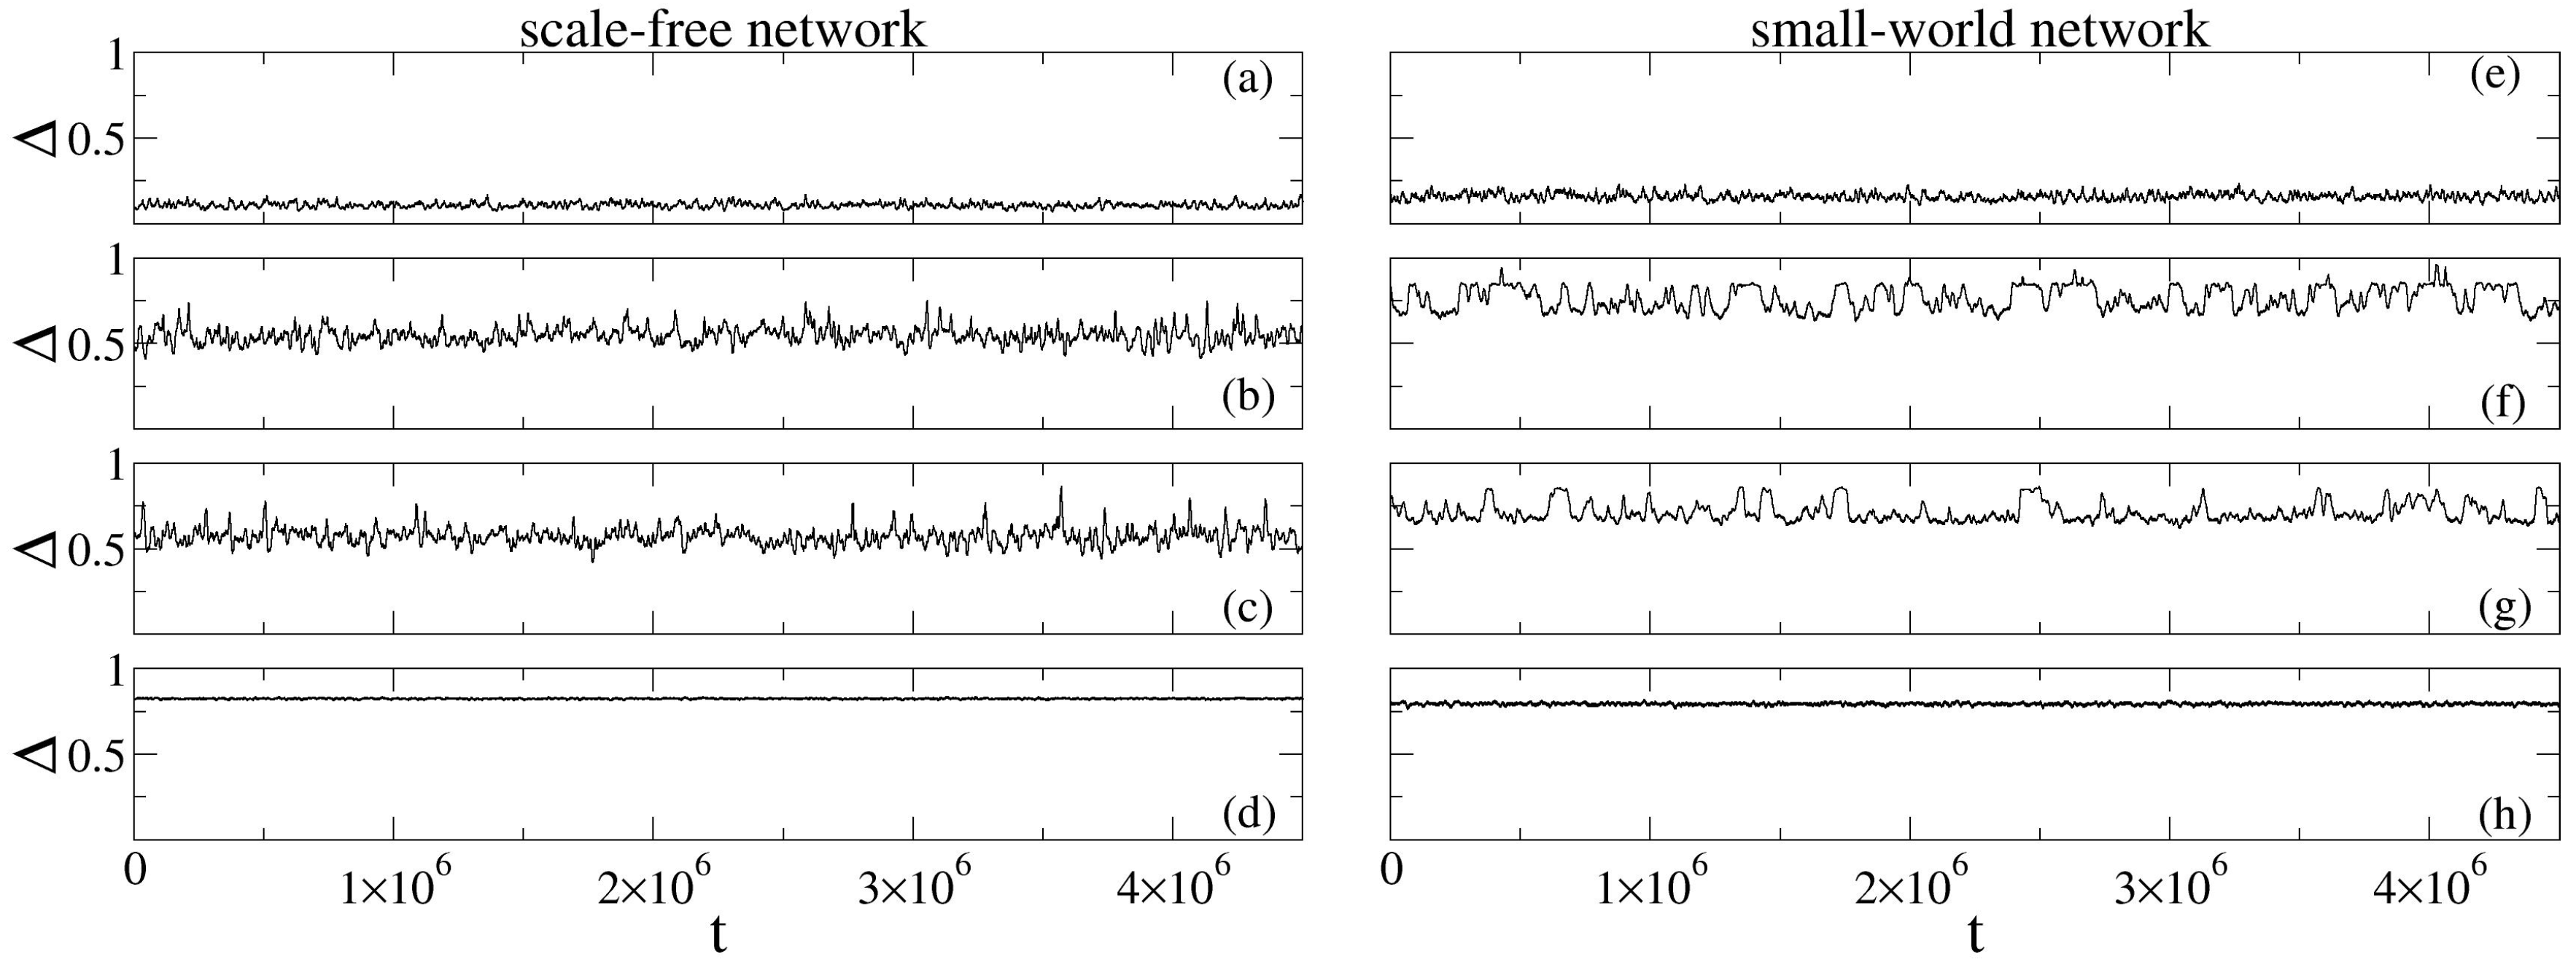
The determinism time series (Δ) is depicted in Figure 8 in order to obtain more details regarding the network dynamical properties in the different situations, as depicted in Figure 3, Figure 4 and Figure 5. As previously mentioned, the recurrence matrix (Equation (9)) is evaluated from the mean field time series. In this way, the diagonal structures observed in Figure 6b are related to trajectories that are close enough (smaller or equal to δ) at different times. Through the optimization of δ following [43], it is possible to use the determinism to quantify the synchronization level of the network as a function of time. In Figure 8, scale-free (panels (a), (b), (c), and (d)) and small-world networks (panels (e), (f), (g), and (h)) are considered, where panels (a) and (e) represent the unsynchronized states with ε = 0.002. It is observed that the determinism assumes small values, which correspond to a unsynchronized states [9]. Panels (b) and (c) represent the states at the transition region for the scale-free network (ε = 0.0045 and ε = 0.0050), where it is observed that the determinism shifts between different values. This fact indicates that the network assumes different synchronization states as a function of t, characterizing an intermittent behavior. Similarly, panels (f) and (g) represent the states at the transition region of the small-world network (ε = 0.0105 and ε = 0.0110). Again, an intermittent behavior is observed, where the determinism shifts between different values; however, in this case, two plateaus of synchronization are observed, indicating the possible existence of two-state on–off synchronization [18,26,68]. In [9], a similar system is considered under small-world and random topologies. Despite the random case not showing the intermittence between two states, it is possible to observe differences in comparison to the scale-free case, since in the scale-free case, the existence of the higher state is less pronounced. Finally, panels (d) and (g) represent phase synchronized states for the scale-free and small-world networks (ε = 0.040), respectively, where a stationary signal is observed for high values of Δ in both cases.
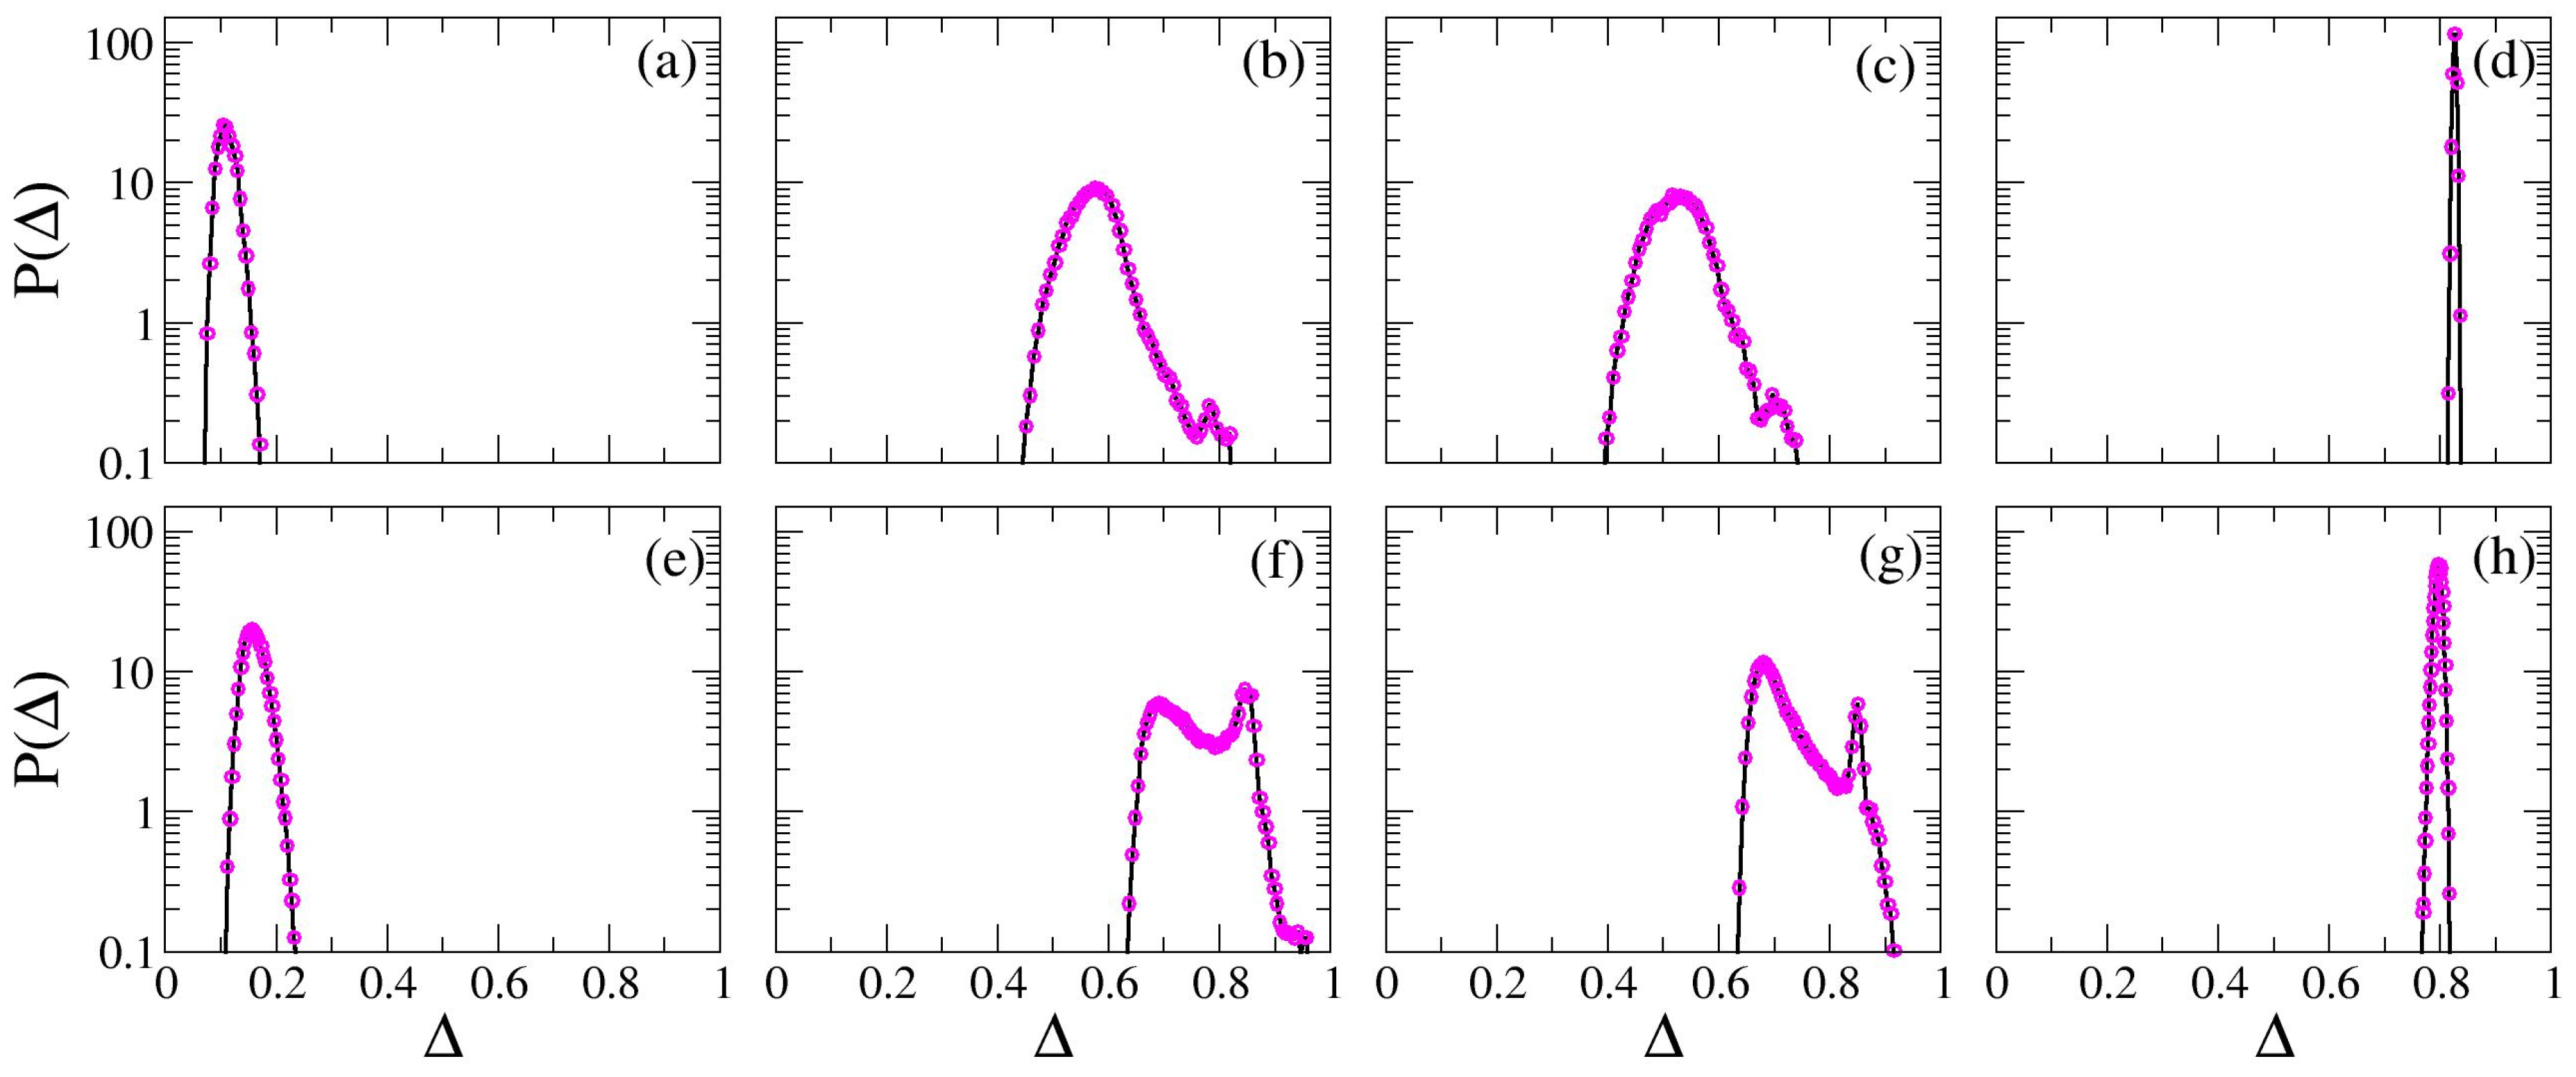
Figure 9 depicts the probability distribution functions (PDFs) of the determinism time series with a length of 107 points, since long-term data is necessary to evaluate the temporal behavior of the networks [26]. The first row, panels (a), (b), (c), and (d) represent the scale-free network while the second row, panels (e), (f), (g), and (h) represent the small-world one. Panels (a) and (e) represent the unsynchronized state of scale-free and small-world networks, respectively, where ε = 0.002. In this case, a uni-modal distribution with a small dispersion over the mean value of Δ is observed, indicating the unsynchronized state [26].
If the coupling strength is increased, the networks assume the transition states, where the temporal standard deviations (σ) of the determinism time series are higher for both topologies considered, thus an intermittent behavior is expected. In this way, panels (b), (c), (f), and (g) represent the states at the transition region for the scale-free and small-world networks. Here, in panel (b) ε = 0.0045 and in panel (c) ε = 0.0050, a non-symmetric distribution of Δ(t) is observed, which indicates a non-stationary situation. In panels (f) and (g), the PDFs of Δ(t) at the transition state of the small-world network is depicted, where ε = 0.0105 and ε = 0.0110, respectively. Here, a non-stationary behavior is again observed since there is a non-symmetric distribution. However, for these cases, the existence of two states with similar occurrence probabilities is observed in the presence of two peaks in the PDFs. A similar scenario is observed in [9,18,26]. In fact, in [9], the distribution of Δ with two peaks is observed in the small-world case. In the random case, a main peak and a shoulder in the distribution of Δ is observed. A comparison between the random and scale-free topologies makes it possible to notice that in both cases, there is no two-state intermittence; however, the random case presents a more unsymmetric PDF of Δ, which indicates a higher level of non-stationarity.
Finally, panels (d) and (h) of Figure 9 are representative of phase synchronized global stable states for scale-free and small-world networks where ε = 0.040. The PDFs are uni-modal with a very small dispersion over the mean value, which indicates that the state is stationary and globally stable [26]. It is important to emphasize that for the scale-free case (panel (d)), the mean value of the PDF of Δ is higher than in the small-world case (panel (g)), which suggest a higher level of phase synchronization.

6. Conclusions

The characteristics of synchronization in complex networks are very interesting and can be used for application in many nature phenomena [1,2,42,60]. Recently, studies have identified a non-stationary transition in bursting neurons networks [11,18,26] where, in some cases, the existence of two-state on–off intermittency is observed.
In order to analyze neural networks, we have used the Kuramoto order parameter [3], which uses the individual signal of all neurons in the network through the association of a phase based on the bursting activity. Moreover, we used recurrence quantification analysis [41,42,65], which is based on a time series that characterize the dynamical system. To analyze the mean field time series, we used the determinism, which is the ratio of recurrent points that belong to a diagonal structure.
Here, we have focused on a scale-free network composed of 1024 bursting neurons (oscillators) with 4088 connections and a small-world network composed of 1024 bursting neurons coupled trough 4096 local connections and 554 non-local ones. We noted a clear transition from unsynchronized to phase synchronized states where non-stationary behavior was observed in both cases. A similar scenario has been observed in [9,11,26,27,69]. Despite the higher number of connections in the small-world case, the transition region and the phase synchronized states were observed for smaller values of coupling strength in the scale–free case.
We have based our analyses in methodology proposed in [9], but here, we extended the study to a scale-free connection architecture since topology plays an important role in the dynamics of systems. It is important to emphasize that there are significant differences between small-world, random, and scale-free topologies. The small-world connection architecture is characterized by a regular local connections scheme with the addition of non-local ones. The random connection architecture is characterized by a more homogeneity in the connectivity, while the scale-free one is the opposite, since there are hubs of connections. The results have shown that the small-world case demonstrates the existence of two-state intermittence, as explored in [68]. Regarding the scale-free network, despite the non-stationary transition, this phenomenon is not observed. Similar results are obtained in [9] for random networks; however, it is also possible to observe differences between scale-free and random networks, as the random ones present a more non-stationary transition.
The study of complex networks has many application fields and is of great theoretical interest. Here, we have demonstrated that small-world and scale-free networks composed of bursting neurons can show non-stationary behavior at the transition to phase synchronization. These kinds of topologies find support in real neural systems, besides a large class of dynamical systems [1,23,50,52]. Thus, the present paper offers a theoretical/computational approach to understanding neural phenomena, since synchronization and intermittent behavior may be related to neural diseases [70,71] such as Parkinson’s disease, autism, and Alzheimer’s [72,73,74,75].

Author Contributions

Conceptualizon: R.C.B., B.R.R.B., T.L.P., S.R.L.; Software: R.C.B., B.R.R.B., T.L.P.; Numerical simulations: R.C.B.; Discussions: R.C.B., B.R.R.B., T.L.P., S.R.L.; Draft preparation: R.C.B.; Writing—review: R.C.B., B.R.R.B., T.L.P., S.R.L.; Supervision: S.R.L.

Acknowledgments

This study was financed in part by the Coordenação de Aperfeiçoamento de Pessoal de Nível Superior - Brasil (CAPES) - Finance Code 001. The authors acknowledge the support of Conselho Nacional de Desenvolvimento Científico e Tecnológico, CNPq - Brazil, grant number 302785/2017-5, Coordenação de Aperfeiçoamento de Pessoal de Nível Superior, CAPES, through project numbers 88881.119252/2016-01, and Financiadora de Estudos e Projetos (FINEP).

Conflicts of Interest

The authors declare no conflict of interest.

References

  1. Strogatz, S.H. Exploring complex networks. Nature 2001, 410, 268–276. [Google Scholar] [CrossRef]
  2. Bullmore, E.; Sporns, O. Complex brain networks: Graph theoretical analysis of structural and functional systems. Nat. Rev. Neurosci. 2009, 10, 186. [Google Scholar] [CrossRef] [PubMed]
  3. Kuramoto, Y. Chemical Oscillations, Waves, and Turbulence; Springer Science & Business Media: Berlin/Heidelberg, Germany, 2012. [Google Scholar]
  4. Rubido, N.; Cabeza, C.; Kahan, S.; Ávila, G.R.; Marti, A.C. Synchronization regions of two pulse-coupled electronic piecewise linear oscillators. Eur. Phys. J. D 2011, 62, 51–56. [Google Scholar] [CrossRef]
  5. Ottino-Löffler, B.; Strogatz, S.H. Kuramoto model with uniformly spaced frequencies: Finite-N asymptotics of the locking threshold. Phys. Rev. E 2016, 93, 062220. [Google Scholar] [CrossRef]
  6. Etémé, A.S.; Tabi, C.B.; Mohamadou, A. Firing and synchronization modes in neural network under magnetic stimulation. Commun. Nonlinear Sci. Numer. Simul. 2019, 72, 432–440. [Google Scholar] [CrossRef]
  7. Ferrari, F.A.S.; Viana, R.L. Building phase synchronization equivalence between coupled bursting neurons and phase oscillators. J. Phys. Commun. 2018, 2, 025014. [Google Scholar] [CrossRef] [Green Version]
  8. Hilgetag, C.C.; Kaiser, M. Lectures in Supercomputational Neuroscience: Dynamics in Complex Brain Networks; Springer: Berlin, Germany, 2008. [Google Scholar]
  9. Budzinski, R.C.; Boaretto, B.R.R.; Rossi, K.L.; Prado, T.L.; Kurths, J.; Lopes, S.R. Nonstationary transition to phase synchronization of neural networks induced by the coupling architecture. Phys. A Stat. Mech. Appl. 2018, 507, 321–334. [Google Scholar] [CrossRef]
  10. Batista, C.A.S.; Viana, R.L.; Ferrari, F.A.S.; Lopes, S.R.; Batista, A.M.; Coninck, J.C.P. Control of bursting synchronization in networks of Hodgkin-Huxley-type neurons with chemical synapses. Phys. Rev. E 2013, 87, 042713. [Google Scholar] [CrossRef] [PubMed]
  11. Boaretto, B.R.R.; Budzinski, R.C.; Prado, T.L.; Kurths, J.; Lopes, S.R. Suppression of anomalous synchronization and nonstationary behavior of neural network under small-world topology. Phys. A Stat. Mech. Appl. 2018, 497, 126–138. [Google Scholar] [CrossRef]
  12. Batista, C.A.S.; Lopes, S.R.; Viana, R.L.; Batista, A.M. Delayed feedback control of bursting synchronization in a scale-free neuronal network. Neural Netw. 2010, 23, 114–124. [Google Scholar] [CrossRef] [PubMed]
  13. Yu, H.; Wang, J.; Liu, Q.; Deng, B.; Wei, X. Delayed feedback control of bursting synchronization in small-world neuronal networks. Neurocomputing 2013, 99, 178–187. [Google Scholar] [CrossRef]
  14. Ferrari, F.A.S.; Viana, R.L.; Reis, A.S.; Iarosz, K.C.; Caldas, I.L.; Batista, A.M. A network of networks model to study phase synchronization using structural connection matrix of human brain. Phys. A Stat. Mech. Appl. 2018, 496, 162–170. [Google Scholar] [CrossRef]
  15. Protachevicz, P.R.; Borges, R.R.; da Silva Reis, A.; Borges, F.S.; Iarosz, K.C.; Caldas, I.L.; Lameu, E.L.; Macau, E.E.N.; Viana, R.L.; Sokolov, I.M.; et al. Synchronous behaviour in network model based on human cortico-cortical connections. Physiol. Meas. 2018, 39, 7. [Google Scholar] [CrossRef]
  16. Yamamoto, H.; Kubota, S.; Shimizu, F.A.; Hirano-Iwata, A.; Niwano, M. Effective subnetwork topology for synchronizing interconnected networks of coupled phase oscillators. Front. Comput. Neurosci. 2018, 12, 17. [Google Scholar] [CrossRef]
  17. Mugnaine, M.; Reis, A.S.; Borges, F.S.; Borges, R.R.; Ferrari, F.A.S.; Iarosz, K.C.; Caldas, I.L.; Lameu, E.L.; Viana, R.L.; Szezech, J.D.; et al. Delayed feedback control of phase synchronisation in a neuronal network model. Eur. Phys. J. Spec. Top. 2018, 227, 1151–1160. [Google Scholar] [CrossRef]
  18. Budzinski, R.C.; Boaretto, B.R.R.; Prado, T.L.; Lopes, S.R. Phase synchronization and intermittent behavior in healthy and Alzheimer-affected human-brain-based neural network. Phys. Rev. E 2019, 99, 022402. [Google Scholar] [CrossRef] [PubMed]
  19. Lameu, E.L.; Batista, C.A.S.; Batista, A.M.; Iarosz, K.; Viana, R.L.; Lopes, S.R.; Kurths, J. Suppression of bursting synchronization in clustered scale-free (rich-club) neuronal networks. Chaos Interdiscip. J. Nonlinear Sci. 2012, 22, 043149. [Google Scholar] [CrossRef] [PubMed]
  20. Gómez-Gardenes, J.; Moreno, Y.; Arenas, A. Paths to synchronization on complex networks. Phys. Rev. Lett. 2007, 98, 034101. [Google Scholar] [CrossRef]
  21. Zhang, X.; Boccaletti, S.; Guan, S.; Liu, Z. Explosive synchronization in adaptive and multilayer networks. Phys. Rev. Lett. 2015, 114, 038701. [Google Scholar] [CrossRef] [PubMed]
  22. Zhang, X.; Zou, Y.; Boccaletti, S.; Liu, Z. Explosive synchronization as a process of explosive percolation in dynamical phase space. Sci. Rep. 2014, 4, 5200. [Google Scholar] [CrossRef]
  23. Varshney, L.R.; Chen, B.L.; Paniagua, E.; Hall, D.H.; Chklovskii, D.B. Structural Properties of the Caenorhabditis elegans Neuronal Network. PLOS Comput. Biol. 2011, 7, e1001066. [Google Scholar] [CrossRef]
  24. He, Y.; Chen, Z.J.; Evans, A.C. Small-world anatomical networks in the human brain revealed by cortical thickness from MRI. Cereb. Cortex 2007, 17, 2407–2419. [Google Scholar] [CrossRef] [PubMed]
  25. Stam, C.J.; Van Straaten, E.C.W. The organization of physiological brain networks. Clin. Neurophysiol. 2012, 123, 1067–1087. [Google Scholar] [CrossRef]
  26. Budzinski, R.C.; Boaretto, B.R.R.; Prado, T.L.; Lopes, S.R. Detection of nonstationary transition to synchronized states of a neural network using recurrence analyses. Phys. Rev. E 2017, 96, 012320. [Google Scholar] [CrossRef]
  27. Xu, K.; Maidana, J.P.; Castro, S.; Orio, P. Synchronization transition in neuronal networks composed of chaotic or non-chaotic oscillators. Sci. Rep. 2018, 8, 8370. [Google Scholar] [CrossRef]
  28. Blasius, B.; Montbrió, E.; Kurths, J. Anomalous phase synchronization in populations of nonidentical oscillators. Phys. Rev. E 2003, 67, 035204. [Google Scholar] [CrossRef]
  29. Prado, T.L.; Lopes, S.R.; Batista, C.A.S.; Kurths, J.; Viana, R.L. Synchronization of bursting Hodgkin–Huxley-type neurons in clustered networks. Phys. Rev. E 2014, 90, 032818. [Google Scholar] [CrossRef]
  30. Boaretto, B.R.R.; Budzinski, R.C.; Prado, T.L.; Kurths, J.; Lopes, S.R. Neuron dynamics variability and anomalous phase synchronization of neural networks. Chaos Interdiscip. J. Nonlinear Sci. 2018, 28, 106304. [Google Scholar] [CrossRef]
  31. Galuzio, P.P.; Lopes, S.R.; Viana, R.L. Two-state on-off intermittency caused by unstable dimension variability in periodically forced drift waves. Phys. Rev. E 2011, 84, 056211. [Google Scholar] [CrossRef]
  32. Newman, M.E.J. The structure and function of complex networks. SIAM Rev. 2003, 45, 167–256. [Google Scholar] [CrossRef]
  33. Liu, W.; Wu, Y.; Xiao, J.; Zhan, M. Effects of frequency-degree correlation on synchronization transition in scale-free networks. Europhys. Lett. 2013, 101, 38002. [Google Scholar] [CrossRef]
  34. Rulkov, N.F. Regularization of synchronized chaotic bursts. Phys. Rev. Lett. 2001, 86, 183. [Google Scholar] [CrossRef] [PubMed]
  35. Coombes, S.; Bressloff, P.C. Bursting: The Genesis of Rhythm in the Nervous System; World Scientific: Singapore, 2005. [Google Scholar]
  36. Feudel, U.; Neiman, A.; Pei, X.; Wojtenek, W.; Braun, H.A.; Huber, M.; Moss, F. Homoclinic bifurcation in a Hodgkin–Huxley model of thermally sensitive neurons. Chaos Interdiscip. J. Nonlinear Sci. 2000, 10, 231–239. [Google Scholar] [CrossRef]
  37. Braun, H.A.; Dewald, M.; Schäfer, K.; Voigt, K.; Pei, X.; Dolan, K.; Moss, F. Low-dimensional dynamics in sensory biology 2: Facial cold receptors of the rat. J. Comput. Neurosci. 1999, 7, 17–32. [Google Scholar] [CrossRef] [PubMed]
  38. Gerstner, W.; Kistler, W.M. Spiking Neuron Models: Single Neurons, Populations, Plasticity; Cambridge University Press: Cambridge, UK, 2002. [Google Scholar]
  39. Newman, M.E.J.; Watts, D.J. Scaling and percolation in the small-world network model. Phys. Rev. E 1999, 60, 7332–7342. [Google Scholar] [CrossRef] [Green Version]
  40. Barabási, A.; Albert, R.; Jeong, H. Scale-free characteristics of random networks: the topology of the world-wide web. Phys. A Stat. Mech. Appl. 2000, 281, 69–77. [Google Scholar] [CrossRef] [Green Version]
  41. Marwan, N.; Romano, M.C.; Thiel, M.; Kurths, J. Recurrence plots for the analysis of complex systems. Phys. Rep. 2007, 438, 237–329. [Google Scholar] [CrossRef]
  42. Zou, Y.; Donner, R.V.; Marwan, N.; Donges, J.F.; Kurths, J. Complex network approaches to nonlinear time series analysis. Phys. Rep. 2019, 787, 1–97. [Google Scholar] [CrossRef]
  43. Prado, T.d.L.; dos Santos Lima, G.Z.; Lobão-Soares, B.; do Nascimento, G.C.; Corso, G.; Fontenele-Araujo, J.; Kurths, J.; Lopes, S.R. Optimizing the detection of nonstationary signals by using recurrence analysis. Chaos Interdiscip. J. Nonlinear Sci. 2018, 28, 085703. [Google Scholar] [CrossRef]
  44. Corso, G.; Prado, T.D.L.; Lima, G.Z.S.; Kurths, J.; Lopes, S.R. Quantifying entropy using recurrence matrix microstates. Chaos Interdiscip. J. Nonlinear Sci. 2018, 28, 083108. [Google Scholar] [CrossRef]
  45. Lima, G.Z.S.; Lopes, S.R.; Prado, T.L.; Lobao-Soares, B.; do Nascimento, G.C.; Fontenele-Araujo, J.; Corso, G. Predictability of arousal in mouse slow wave sleep by accelerometer data. PLoS ONE 2017, 12, e0176761. [Google Scholar] [CrossRef]
  46. Neves, F.M.; Viana, R.L.; Pie, M.R. Recurrence analysis of ant activity patterns. PLoS ONE 2017, 12, e0185968. [Google Scholar] [CrossRef] [PubMed]
  47. Rulkov, N.F. Modeling of spiking-bursting neural behavior using two-dimensional map. Phys. Rev. E 2002, 65, 041922. [Google Scholar] [CrossRef] [PubMed]
  48. Borges, R.R.; Borges, F.S.; Lameu, E.L.; Batista, A.M.; Iarosz, K.C.; Caldas, I.L.; Viana, R.L.; Sanjuán, M.A.F. Effects of the spike timing-dependent plasticity on the synchronisation in a random Hodgkin–Huxley neuronal network. Commun. Nonlinear Sci. Numer. Simul. 2016, 34, 12–22. [Google Scholar] [CrossRef] [Green Version]
  49. Kandel, E.R.; Schwartz, J.H.; Jessell, T.M.; Siegelbaum, S.A.; Hudspeth, A.J. Principles of Neural Science; McGraw-Hill: New York, NY, USA, 2000. [Google Scholar]
  50. Watts, D.J.; Strogatz, S.H. Collective dynamics of ‘small-world’ networks. Nature 1998, 393, 440–442. [Google Scholar] [CrossRef]
  51. Lo, C.Y.; Wang, P.N.; Chou, K.H.; Wang, J.; He, Y.; Lin, C.P. Diffusion tensor tractography reveals abnormal topological organization in structural cortical networks in Alzheimer’s disease. J. Neurosci. 2010, 30, 16876–16885. [Google Scholar] [CrossRef]
  52. Chialvo, D.R. Critical brain networks. Phys. A Stat. Mech. Appl. 2004, 340, 756–765. [Google Scholar] [CrossRef] [Green Version]
  53. Eguiluz, V.M.; Chialvo, D.R.; Cecchi, G.A.; Baliki, M.; Apkarian, A.V. Scale-free brain functional networks. Phys. Rev. Lett. 2005, 94, 018102. [Google Scholar] [CrossRef]
  54. Barabási, A.L.; Albert, R. Emergence of scaling in random networks. Science 1999, 286, 509–512. [Google Scholar]
  55. Hagberg, A.; Schult, D.; Swart, P. Exploring network structure, dynamics, and function using NetworkX. In Proceedings of the 7th Python in Science Conference, Pasadena, CA, USA, 19–24 August 2008; pp. 11–16. [Google Scholar]
  56. Boccara, N. Modeling Complex Systems; Springer Science & Business Media: New York, NY, USA, 2010. [Google Scholar]
  57. Albert, R.; Barabási, A. Statistical mechanics of complex networks. Rev. Mod. Phys. 2002, 74, 47–97. [Google Scholar] [CrossRef] [Green Version]
  58. Sporns, O.; Zwi, J.D. The small world of the cerebral cortex. Neuroinformatics 2004, 2, 145–162. [Google Scholar] [CrossRef]
  59. Rosenblum, M.G.; Pikovsky, A.S.; Kurths, J. Phase synchronization of chaotic oscillators. Phys. Rev. Lett. 1996, 76, 1804. [Google Scholar] [CrossRef] [PubMed]
  60. Boccaletti, S.; Kurths, J.; Osipov, G.; Valladares, D.; Zhou, C. The synchronization of chaotic systems. Phys. Rep. 2002, 366, 1–101. [Google Scholar] [CrossRef]
  61. Bar-Yam, Y. Dynamics of Complex Systems; Addison-Wesley: Reading, MA, USA, 1997. [Google Scholar]
  62. Ivanchenko, M.V.; Osipov, G.V.; Shalfeev, V.D.; Kurths, J. Phase Synchronization in Ensembles of Bursting Oscillators. Phys. Rev. Lett. 2004, 93, 134101. [Google Scholar] [CrossRef] [PubMed]
  63. Lameu, E.L.; Yanchuk, S.; Macau, E.E.N.; Borges, F.S.; Iarosz, K.C.; Caldas, I.L.; Protachevicz, P.R.; Borges, R.R.; Viana, R.L.; Szezech, J.D., Jr.; et al. Recurrence quantification analysis for the identification of burst phase synchronisation. Chaos Interdiscip. J. Nonlinear Sci. 2018, 28, 085701. [Google Scholar] [CrossRef]
  64. Santos, M.S.; Szezech, J.D., Jr.; Batista, A.M.; Caldas, I.L.; Viana, R.L.; Lopes, S.R. Recurrence quantification analysis of chimera states. Phys. Lett. A 2015, 379, 2188–2192. [Google Scholar] [CrossRef]
  65. Eckmann, J.P.; Kamphorst, S.O.; Ruelle, D. Recurrence plots of dynamical systems. Europhys. Lett. 1987, 4, 973. [Google Scholar] [CrossRef]
  66. Grabow, C.; Hill, S.M.; Grosskinsky, S.; Timme, M. Do small worlds synchronize fastest? Europhys. Lett. 2010, 90, 48002. [Google Scholar] [CrossRef] [Green Version]
  67. Budzinski, R.C.; Boaretto, B.R.R.; Prado, T.L.; Lopes, S.R. Synchronization domains in two coupled neural networks. Commun. Nonlinear Sci. Numer. Simul. 2019, 75, 140–151. [Google Scholar] [CrossRef]
  68. Galuzio, P.P.; Lopes, S.R.; Viana, R.L. Two-State On-Off Intermittency and the Onset of Turbulence in a Spatiotemporally Chaotic System. Phys. Rev. Lett. 2010, 105, 055001. [Google Scholar] [CrossRef]
  69. Shanahan, M. Metastable chimera states in community-structured oscillator networks. Chaos Interdiscip. J. Nonlinear Sci. 2010, 20, 013108. [Google Scholar] [CrossRef] [PubMed] [Green Version]
  70. Uhlhaas, P.J.; Singer, W. Neural synchrony in brain disorders: relevance for cognitive dysfunctions and pathophysiology. Neuron 2006, 52, 155–168. [Google Scholar] [CrossRef] [PubMed]
  71. Lasemidis, L.D.; Sackellares, J.C. Chaos Theory and Eilepsy. The Neuroscientist 1996, 2, 118–126. [Google Scholar] [CrossRef]
  72. Galvan, A.; Wichmann, T. Pathophysiology of parkinsonism. Clin. Neurophysiol. 2008, 119, 1459–1474. [Google Scholar] [CrossRef]
  73. Dinstein, I.; Pierce, K.; Eyler, L.; Solso, S.; Malach, R.; Behrmann, M.; Courchesne, E. Disrupted neural synchronization in toddlers with autism. Neuron 2011, 70, 1218–1225. [Google Scholar] [CrossRef] [PubMed]
  74. Aron, L.; Yankner, B.A. Neural synchronization in Alzheimer’s disease. Nature 2016, 540, 207–208. [Google Scholar] [CrossRef] [PubMed]
  75. Iaccarino, H.F.; Singer, A.C.; Martorell, A.J.; Rudenko, A.; Gao, F.; Gillingham, T.Z.; Mathys, H.; Seo, J.; Kritskiy, O.; Abdurrob, F.; et al. Gamma frequency entrainment attenuates amyloid load and modifies microglia. Nature 2016, 540, 230–235. [Google Scholar] [CrossRef] [PubMed] [Green Version]
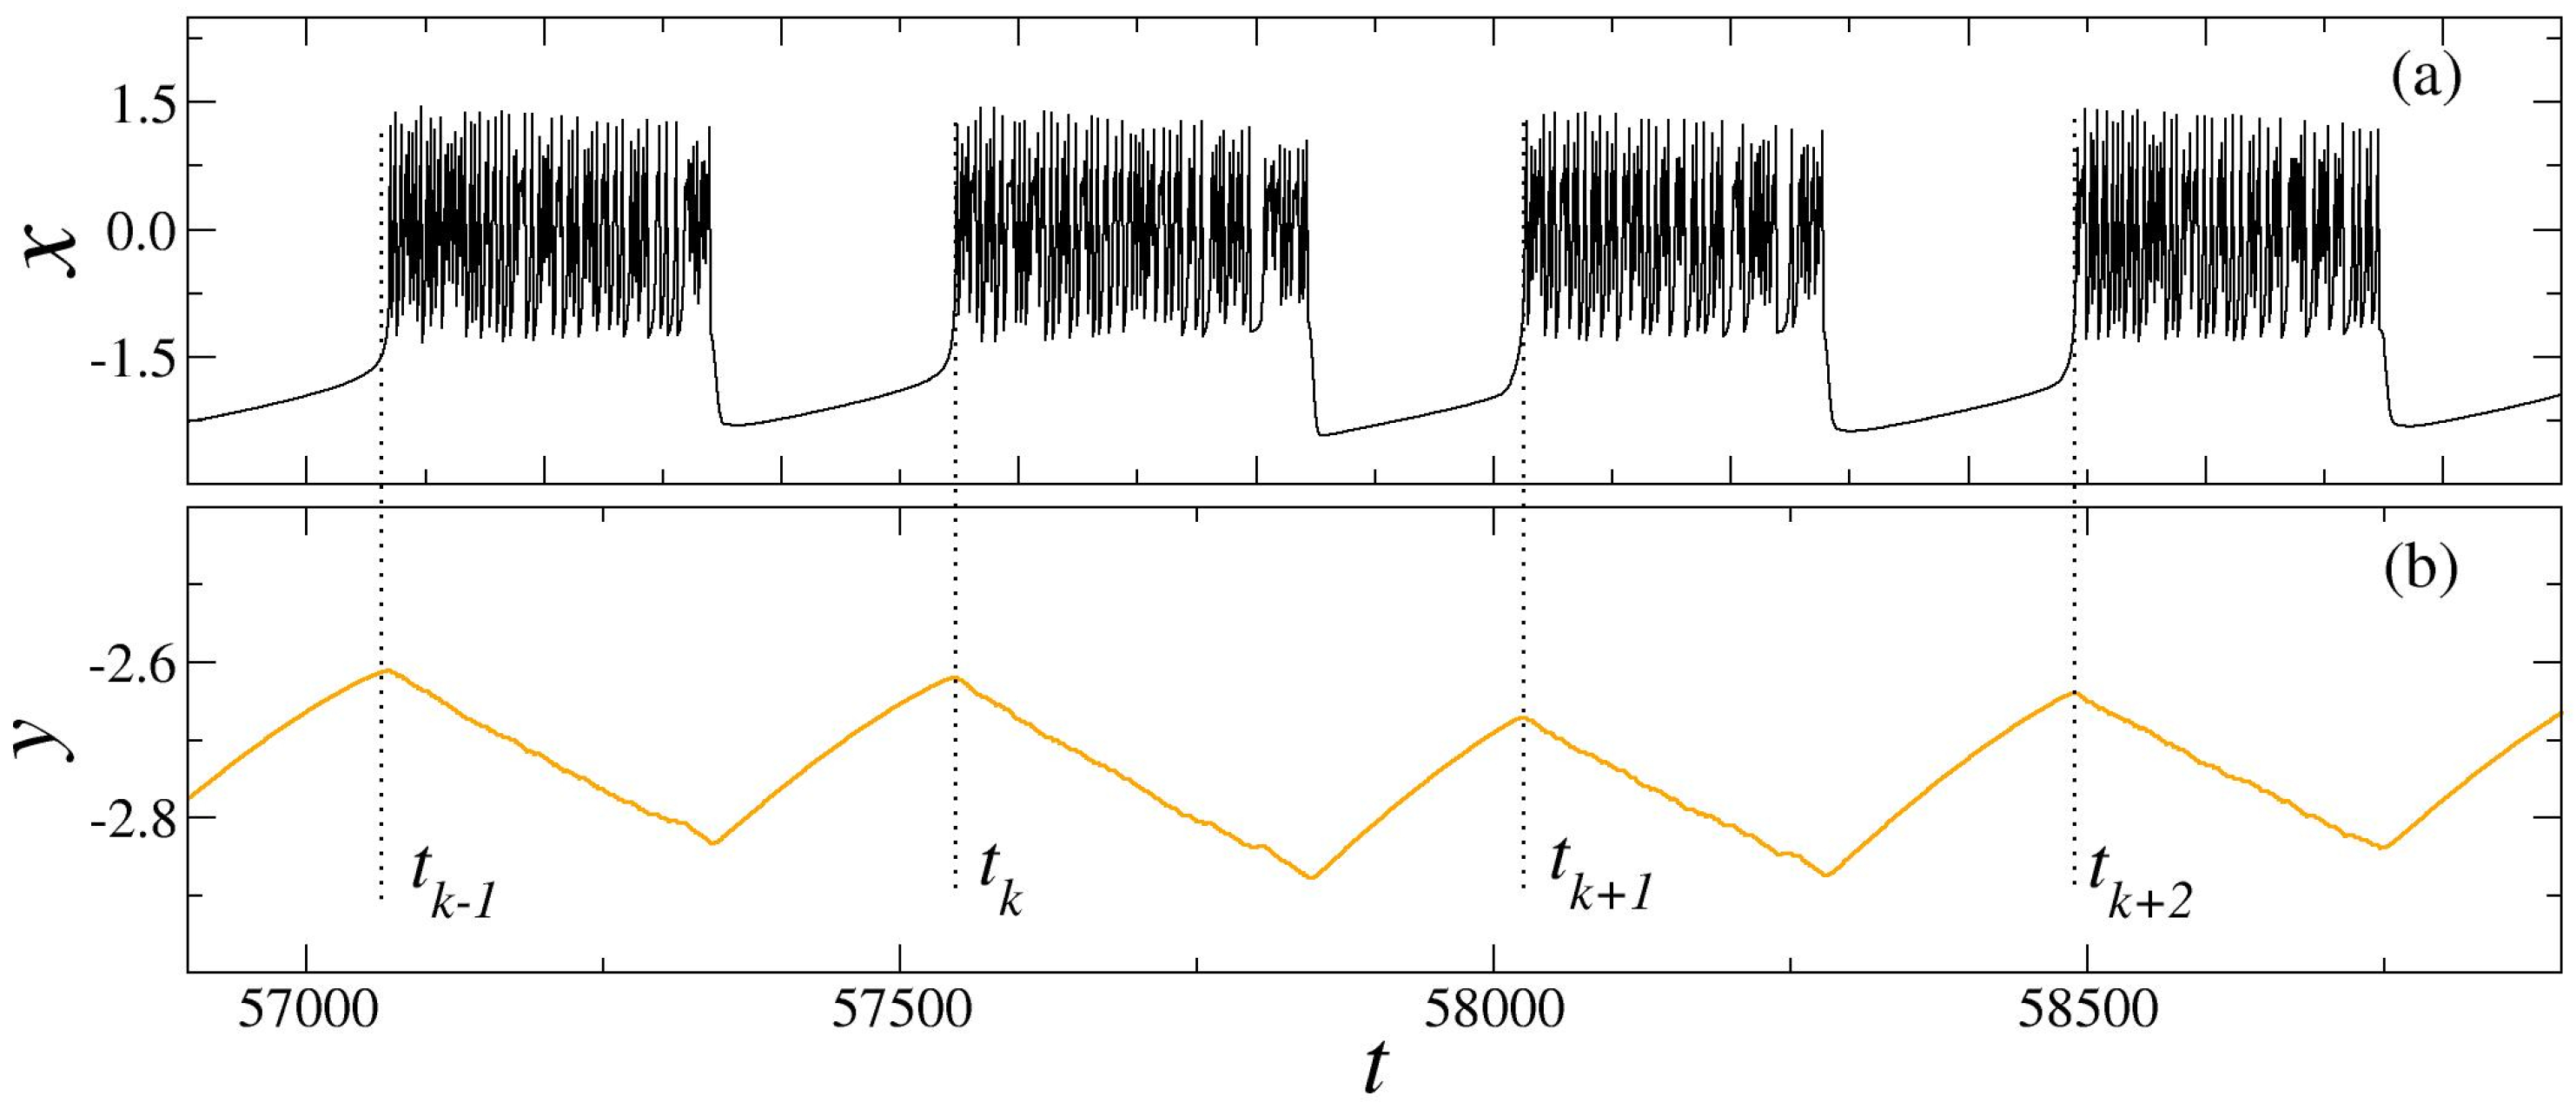
Figure 1. Dynamical behavior of an oscillator obtained through a Rulkov map. Here, panel (a) depicts the fast variable of the system (x), which can be understood as the membrane potential of the neuron. Panel (b) depicts the slow variable of the system (y) and is useful for evaluating the oscillator phase since y assumes a maximum at every burst start.
Mca 24 00042 g001
Figure 2. Representation of the networks used in this paper. Panel (a) depicts the small-world network with 1024 nodes and 4650 connections, and panel (b) the scale-free network with 1024 nodes and 4088 connections. The existence of hubs of connections is observed in the scale-free network, and the degree of connectivity decays in a power-law form, while in the small-world one the degree of connectivity is similar between nodes.
Mca 24 00042 g002
Figure 3. Panels (a) and (c) depict the mean value of the Kuramoto order parameter (〈R〉) as a function of the coupling strength (ε) for the scale-free and small-world networks, respectively. Panels (b) and (d) depict the mean value of the determinism (〈Δ〉) for the same scale-free and small-world networks. A clear transition to phase synchronized states is observed in both networks.
Mca 24 00042 g003
Figure 4. Spatial–temporal pattern of the membrane potential represented by the fast variable x for the scale-free network in panel (a) (ε = 0.002), panel (b) (ε = 0.005), and panel (c) (ε = 0.040) and for the small-world network in panel (d) (ε = 0.002), panel (e) (ε = 0.011), and panel (f) (ε = 0.040). In the phase synchronized states, horizontal lines, which are related to the bursting synchronization, are observed.
Mca 24 00042 g004
Figure 5. Mean field of the network described by Equation (4) for the scale-free network in panels (a), (b), and (c) and the small-world network in panels (d), (e), and (f). Here, the coupling values considered are the same as in Figure 4, where (a) and (d)—ε = 0.002, (b)—ε = 0.005, (c), and (f)—ε = 0.040 and (e)—ε = 0.011. The phase synchronized states (c) and (f) depict the higher amplitude of oscillations related to the bursting frequency.
Mca 24 00042 g005
Figure 6. Recurrence plot obtained from the mean field of the network through Equation (9) for an unsynchronized case (panel (a)) and a synchronized one (panel (b)) where diagonal structures on the RP are observed, which leads to a higher value of determinism (Δ) in panel (b) than in panel (a).
Mca 24 00042 g006
Figure 7. Normalized temporal standard deviation (σ), described by Equation (12), as a function of coupling strength for the scale-free network (panels (a) and (b)) and the small-world network (panels (c) and (d)). Here the time series of the Kuramoto order parameter (panels (a) and (c)) and the determinism time series (panels (b) and (d)) are considered. A higher value of σ indicates an intermittent behavior. The local maximum is observed in the transition region, indicating non-stationary transitions.
Mca 24 00042 g007
Figure 8. Examples of the determinism time series (Δ) evaluated from the mean field of the network for the scale-free network (panels (a), (b), (c), and (d)) and the small-world network (panels (e), (f), (g), and (h)). Here, panels (a) and (c) are representative of unsynchronized states (ε = 0.002), and panels (b), (c), (f), and (g) are representative of states at the transition region (ε = 0.0045, ε = 0.0050, ε = 0.0105 and ε = 0.011, respectively). At the transition region, it is observed that the system assumes different states of synchronization (different values of Δ).
Mca 24 00042 g008
Figure 9. Probability distribution functions (PDFs) from the determinism time series (Δ) depicted in Figure 8. The panels follow the same scheme as in Figure 8, where the first row refers to the scale-free network, and the second row refers to the small-world network. In the transition region, the distribution is not symmetric and indicates a non-stationary behavior; however, only in the small-world case is the existence of two states observed.
Mca 24 00042 g009