Article

A Comprehensive Photocatalysis Study of Promising Zirconia/Laser-Induced Graphene Nanocomposite for Wastewater Treatment-Based Methylene Blue Pollution

1
Al-Bilad Bank Scholarly Chair for Food Security in Saudi Arabia, Deanship of Scientific Research, the Vice Presidency for Graduate Studies and Scientific Research, King Faisal University, Al-Ahsa 31982, Saudi Arabia
2
Department of Physics, College of Science, King Faisal University, Al-Ahsa 31982, Saudi Arabia
3
Physics Department, Faculty of Science, Assiut University, Assiut 71516, Egypt
4
Physics Department, Faculty of Science, University of Tabuk, Tabuk 71491, Saudi Arabia
*
Authors to whom correspondence should be addressed.
Separations 2022, 9(8), 185; https://doi.org/10.3390/separations9080185
Submission received: 26 June 2022 / Revised: 18 July 2022 / Accepted: 20 July 2022 / Published: 22 July 2022

Abstract

:
In this paper, the photocatalytic effect of zirconia/laser-induced graphene on the degradation of methylene blue was comprehensively studied. The average particle size measured by HRTEM is 6 nm for both ZrO2 and ZrO2/G10 samples, which explains the high-quality TEM imaging of isolated squared sections of cubic particles. The weight percentages of Zr, O, and C elements using EDX were 72.16, 18.56, and 9.28, respectively. These results confirm the formation of binary composites. Moreover, Raman scattering exhibited that the spectrum of pure ZrO2 was difficult to be detected due to the high luminescence. However, ZrO2 vibration modes were detected for ZrO2-graphene nanocomposites at 1012, 615, 246, and 150 cm−1. A shift of the D- and G-bands of graphene were observed, where D-peak and G-peak were observed at 1370 and 1575 cm−1 for ZrO2/5G and, 1361 and 1565 cm−1 for ZrO2/10G, respectively. The shift is ascribed to the incorporation of graphene into the surface of the oxide material. Compared to ZrO2, the newly fabricated ZrO2-graphene nanocomposites have the advantage of increased photocatalytic effects. An adsorbent concentration of 5 and 10 mg·L−1 at room temperature over 240 min was observed to be suitable experimental conditions. The kinetic results indicate that the practical results obtained are well expressed by the first-order kinetic model at different concentrations. In addition, the results showed that the addition of graphene led to a significant degradation process increase. The results also showed the significant effect of the investigated ZrO2-graphene nanocomposites on the decomposition of methylene blue cation. The decomposition of cationic pollutants showed a synergistic effect of the ZrO2-graphene nanocomposites on wastewater treatment.

1. Introduction

Zirconia (ZrO2) is an attractive material to scientists because of its great technological importance. ZrO2 is characterized by high hardness, stability, microbial, and high corrosion resistance [1]. It is a p-type wide-gap semiconductor material, characterized by the availability of oxygen vacancies on its surface. This material is used in many applications such as gas sensors [2], solid oxide fuel cells, and nitrogen oxides [3]. Depending on several factors including the preparation method, ZrO2 shows a bandgap ranging from 3 to 5 eV and this wide gap makes ZrO2 a promising photocatalyst for hydrogen production in hydrolysis [4,5]. Graphene, an atomic-thin two-dimensional carbon material, has attracted enormous interest in the scientific community due to its exceptional electronic, electrical, and mechanical properties [6]. It can be considered a ‘final’ RO membrane because this membrane is a strong, thin, and chemically resistant layer. Moreover, graphene exhibited a chlorine tolerance, which is an advantage in preventing contamination of the membrane without decomposition [7,8].
After showing these unique properties of each ZrO2 and graphene separately, we thought to manufacture and characterize ZrO2 and ZrO2-graphene with different contents-(ZrO2/G5) and (ZrO2/G10). We magnify the characteristics of one of them. Therefore, we used this mixture of graphene oxide and ZrO2 for the degradation of organic species. An example of these organic dyes and in widespread use is methylene blue cation (MB). Photocatalytic studies of nanocomposites on the decomposition of methylene blue cation (MB) have been examined in detail because water contaminated with various pollutants, such as heavy metals and dyes, have negative effects on human health [9]. The influence of different morphologies of ZnO on the photocatalytic activity was performed on water-wasted MB. These different morphologies showed the geometry of one-dimensional nanostructures that controls the photocatalytic activity of ZnO [10]. Moreover, previous results [11] showed that the composite can selectively adsorb MB molecules from binary mixtures of MB/MO or MB/RhB, and its adsorption capacity is enhanced as compared with the magnetic activated carbon (MAC). Their dye adsorption and photocatalytic properties of the composite were examined by studying the decolorization of model dyes MB, methyl orange (MO), rhodamine B (RhB), and mixture solutions.
In the work, graphene mixed ZrO2 nanocomposites are prepared by the chemical precipitation reaction technique and milling method with specific weight percentages. It is used to study the effect of graphene on the photocatalysis performance of ZrO2. The structure of nanocomposite is investigated by high transmission electron microscopy (HRTEM), energy dispersive X-ray analysis (EDX), and confocal Raman spectroscopy. At various dye concentrations, the prepared ZrO2 and ZrO2 with different content of graphene were applied as a catalyst for removing methylene blue (MB) with different concentrations from wastewater by photocatalysis method. Furthermore, a concise comparison of the catalytic effectiveness in the present work with other publications related to ZrO2 or graphene prepared by various techniques and used as a catalyst for dye removal was presented.

2. Materials and Methods

2.1. Materials Preparation

Zirconium oxide nanoparticles were prepared via chemical precipitation. For this purpose, 1.0 M of ZrCl4 and 4.0 M of NaOH were dissolved in the distilled water according to the following chemical equation:
ZrCl4 (aq) + NaOH (aq) 4NaCl(s) + Zr(OH)4 (aq)
The white Zr(OH)4 samples were precipitated. The precipitates were washed about in double-distilled water and separated by centrifugation. Then, they were dried at 100 °C for 5 h in a thermostat drier. Finally, ZrO2 was extracted.
The graphene nanopowder was prepared by using the CO2 laser machine. A CO2 laser machine with a maximum power of 40 W and a maximum speed of 400 mm/s was used. Firstly, DuPont Kapton Polyimide Film (TapeCase, Elk Grove Village, IL, USA) of 170 µm (5.0 mil) in thickness was well cleaned. The sheet was placed on the laser machine and exposed to a power of 7.5 W at speed of 40 mm/s. The laser beam was applied to a large area of the polyimide film, and a large quantity (in mg) of graphene powder was obtained. Scheme 1 shows the steps for preparing graphene powder by using a CO2 laser machine and preparing the ZrO2-graphene composites. The graphene powder was then mixed with the oxide materials in specific weight percentages, such as 5.0 and 10% of graphene. The mixture was well-milled for 5 min in mortar, so that the color of the mixture was changed to a light black color. The product was subjected to the sintering process in an electric furnace at 400 °C for one hour. The ZrO2-graphene nanocomposites were mentioned in the whole manuscript as ZrO2/G5 and ZrO2/G10. These ZrO2/G5 and ZrO2/G10 symbols stand for ZrO2 doped with 5 wt.% and 10 wt.% of graphene, respectively.

2.2. Characterizations

For the high transmission electronic microscopy (HRTEM) measurement, the sample was sonicated for 10 min, then 5 µL of the dispersed solution was dried on a carbon-coated copper grid. The equipment (JEOL, JEM-2100F, Tokyo, Japan) that works with 200 kV was used for HRTEM. The elemental composition was analyzed by the EDX technique attached to the TEM system.
The products were investigated by a confocal Raman spectroscopy (Lab RAM- HR800) connected with a charge-coupled detector (CCD). The excitation light of HeNe with 633 nm-wavelength and 20 mW-output power was used. For Raman spectrum measurements, a configuration of backscattering at room temperature with a 0.8 cm−1 spectral resolution was used.
According to our previous research [12,13], the catalytic study was taken to the test in the following way: A solution of 1 L of methylene blue (MB), C16H18ClN3S, was prepared and then dilute to prepare two concentrations of 5 mg/L and 10 mg/L of MB dye. A fixed quantity of ZrO2 and ZrO2 with different content of graphene of 2 mg was employed. The solution was shifted to a UV irradiation. The MB dye concentration in the solution was determined at room temperature with a Jenway 6300 UV-visible spectrophotometer at 613 nm of wavelength.

3. Results and Discussion

3.1. Structural Elemental Analysis

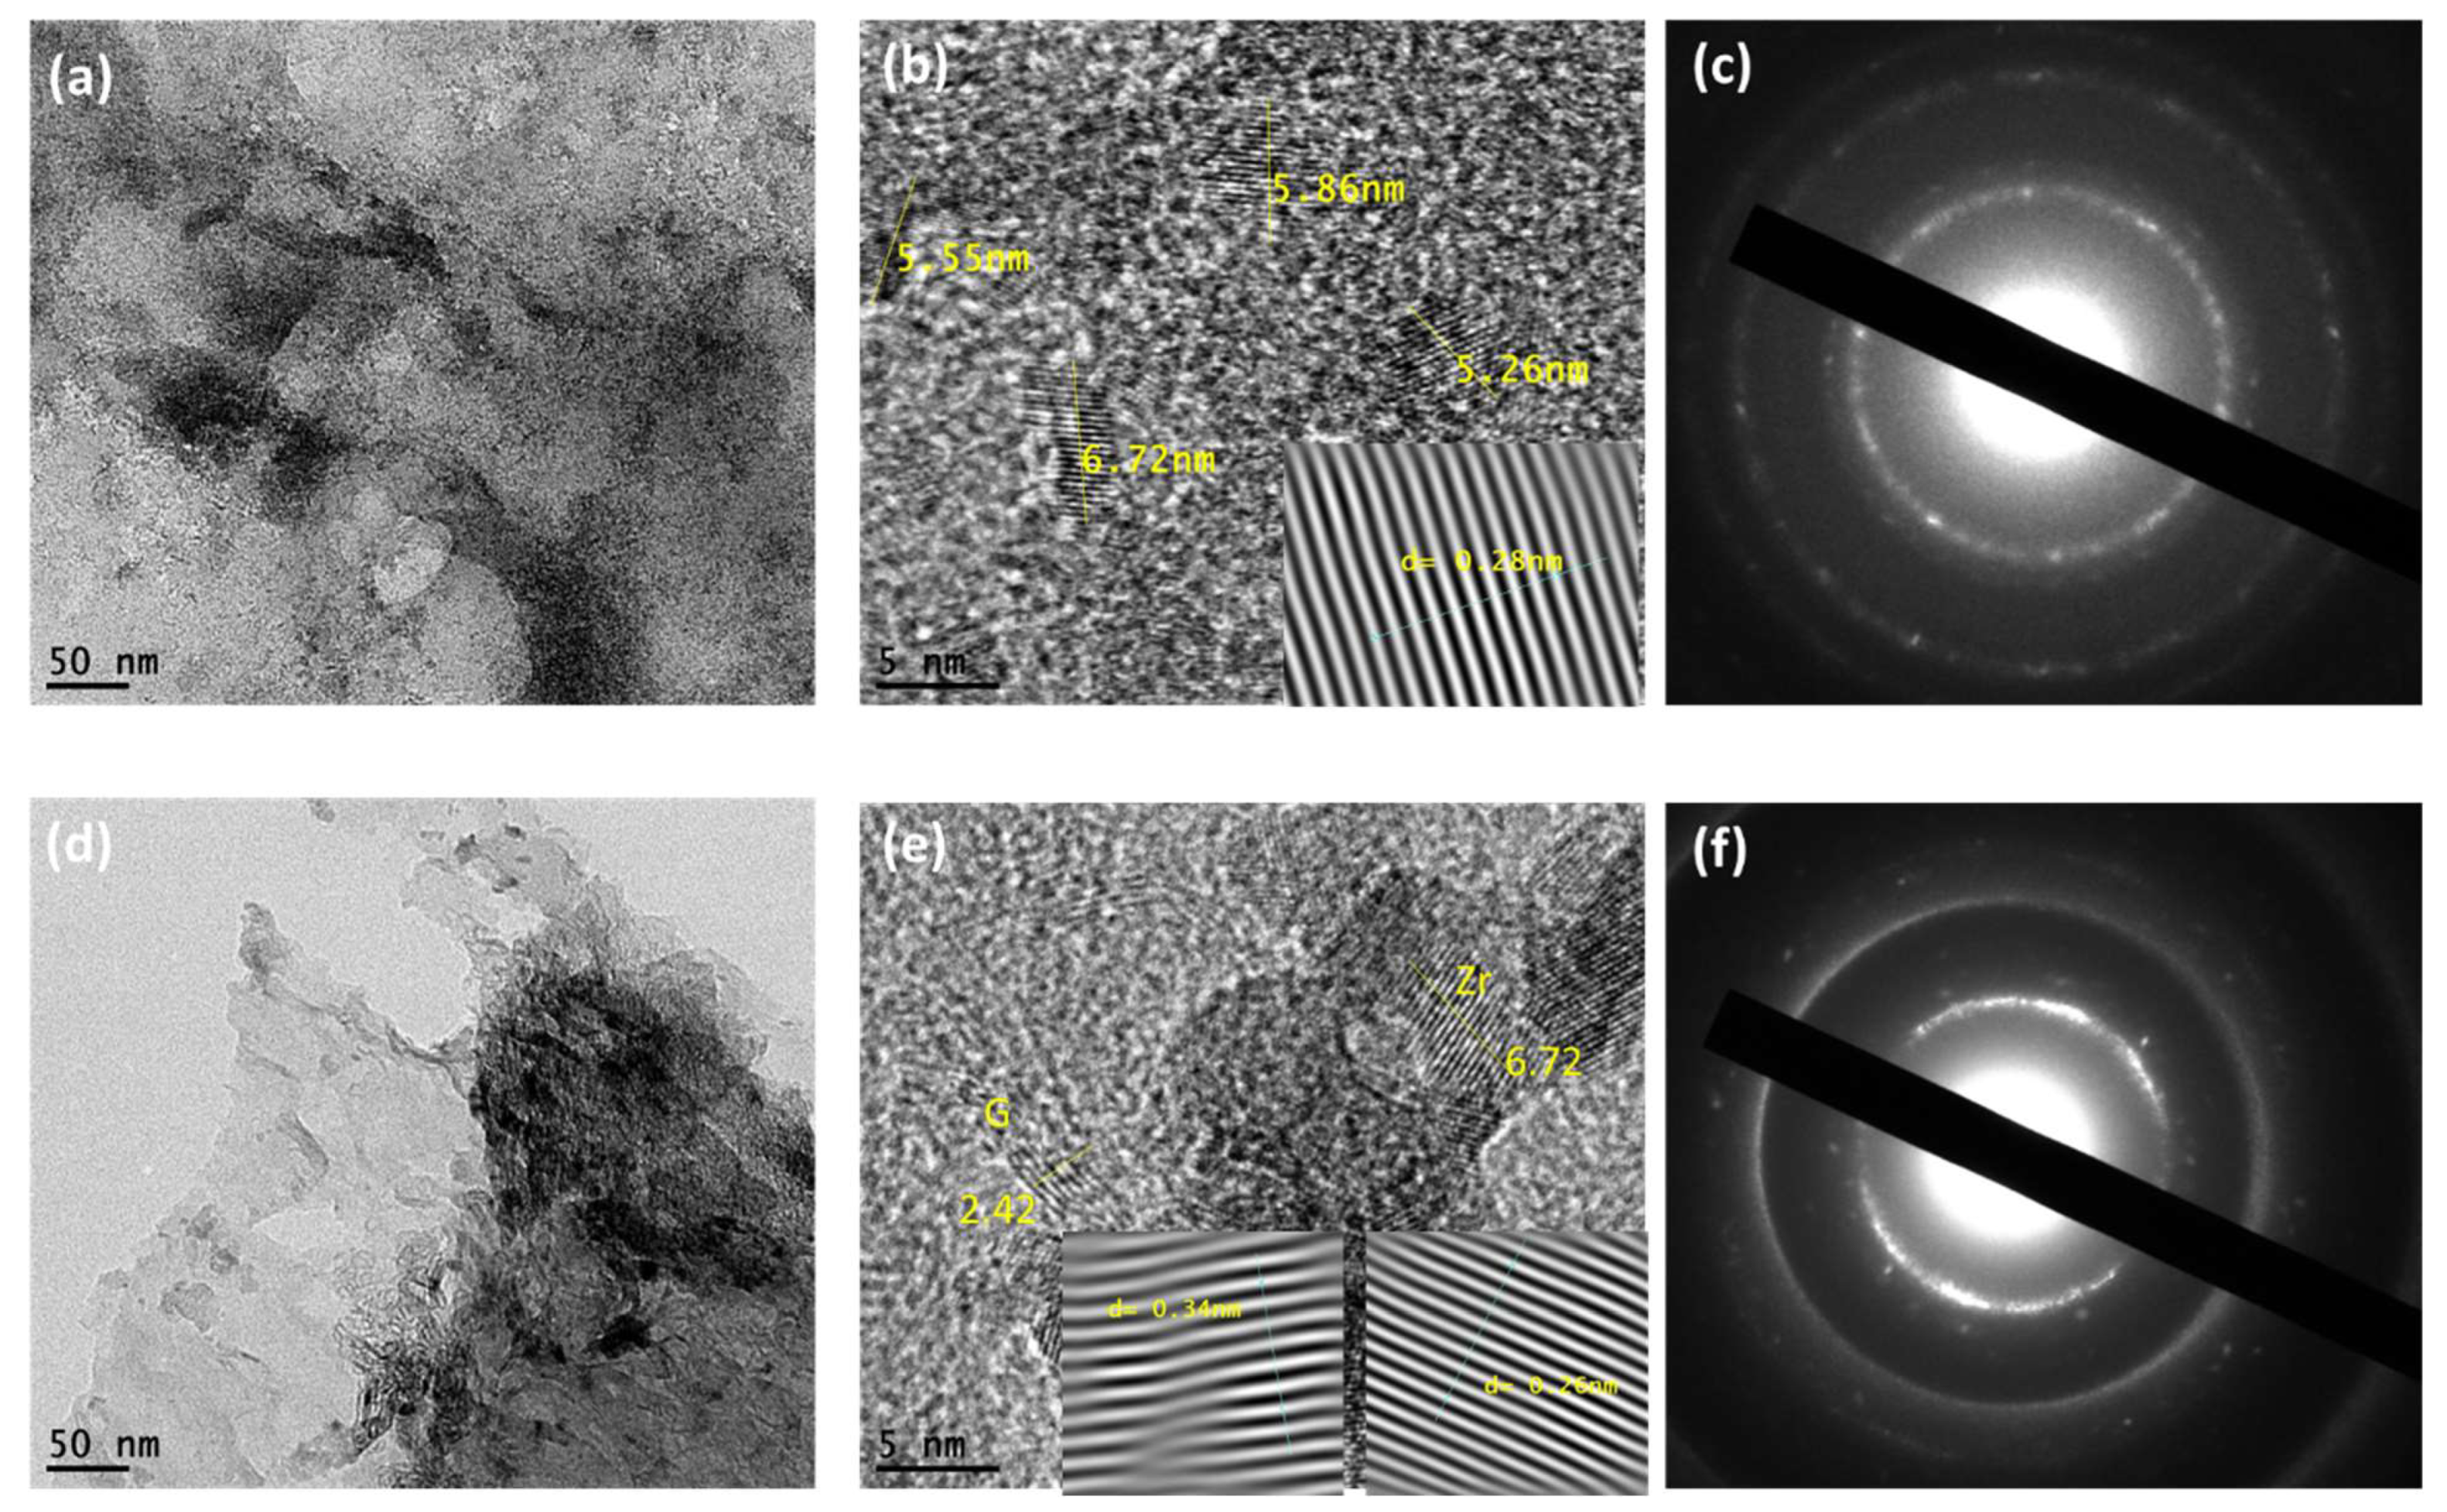
Figure 1 shows the HRTEM, lattice images, and SAED for ZrO2 and ZrO2/G10 samples. The average particle size is 6 nm for both ZrO2 and ZrO2/G10 samples. It explains the high-quality TEM imaging of isolated squared sections of cubic particles. As shown in Figure 1a,b, the micrographs obtained for ZrO2 NPS display particle coalescences having surfaces exposing crystal fringes spaced with 0.28 nm. This coalescence is the same as ZrO2 [14], which diagnoses the exposure of the loosely packed (101) facet of the tetragonal lattice [14]. On the other hand, as in Figure 1d,e, as the graphene is added to ZrO2, the coalescences have surfaces exposing crystal fringes spaced with 0.34 nm. This increase in crystal fringes comes from adding graphene to the ZrO2 samples. Moreover, fringe patterns showed two lattices corresponding to ZrO2, and graphene, which is confirmed in the complicated SAED patterns.
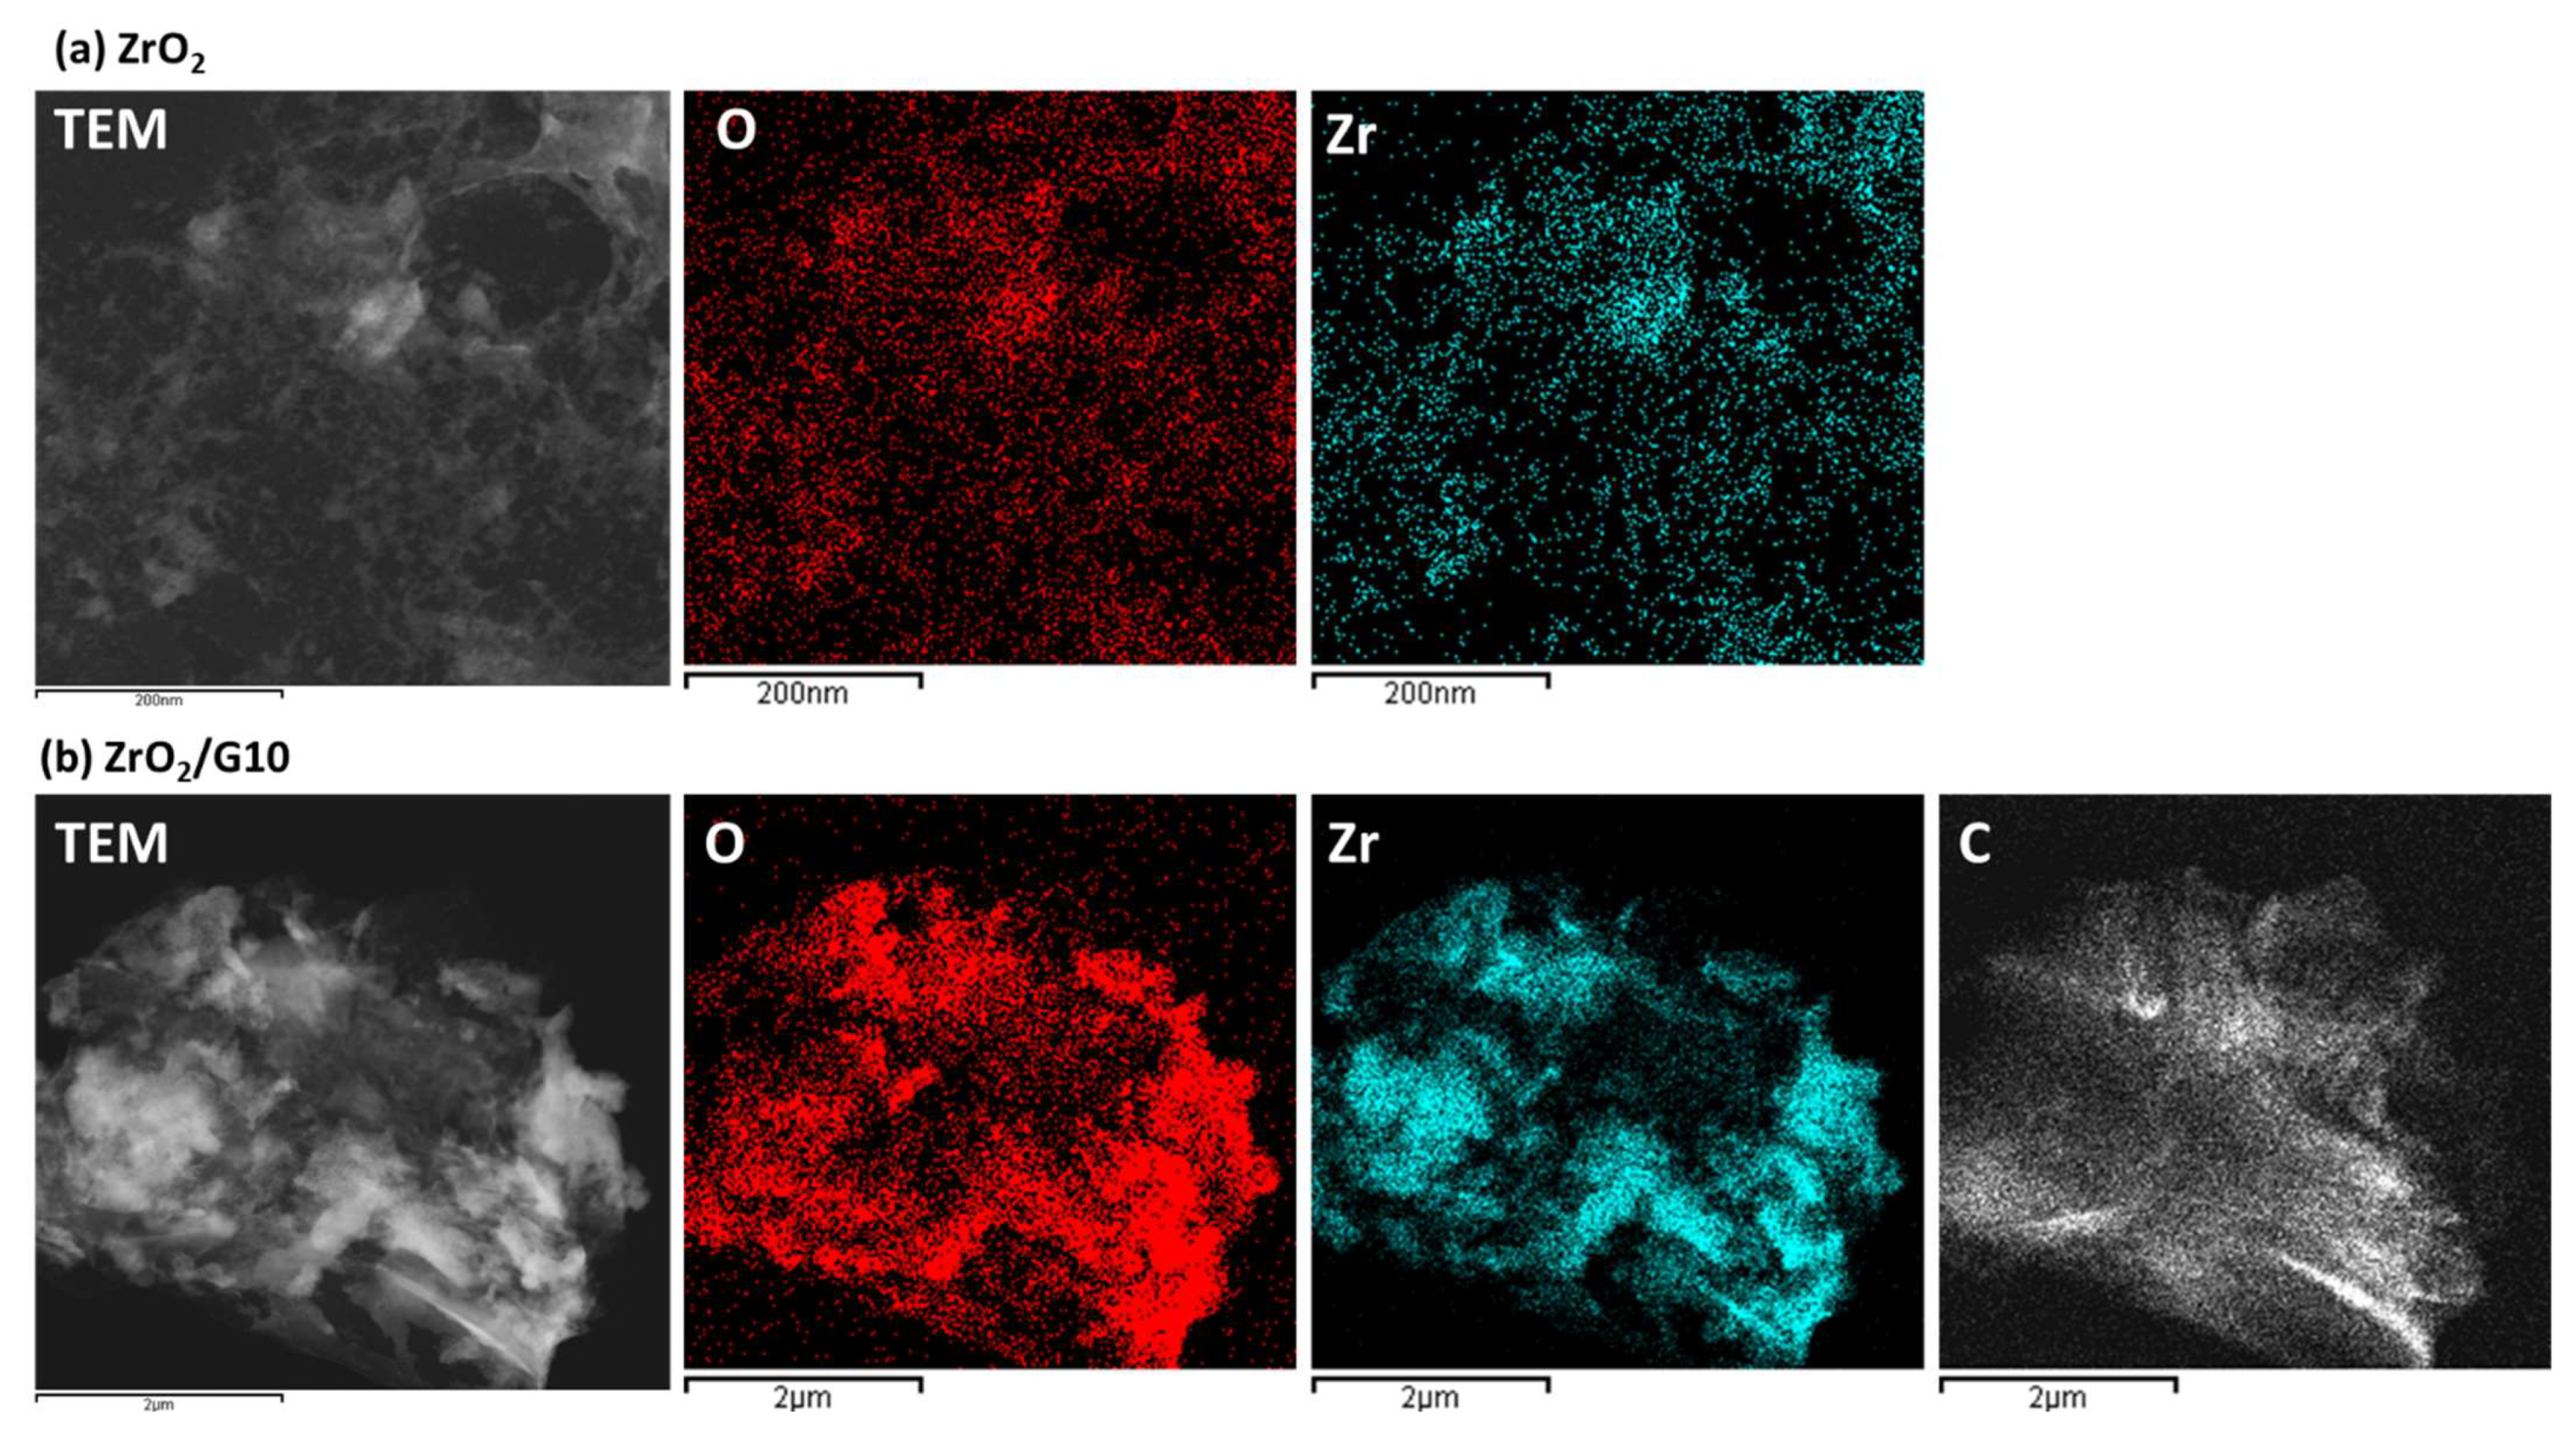
The selected area electron diffraction (SAED) pattern exhibited a mixture of crystallographic structures with tetragonal and monoclinic ZrO2 as a major and minor phase [15], respectively (Figure 1c,f). A series of spots were observable next to these rings that were related to the monoclinic phase of ZrO2 in agreement with the PDF card 88–2390 (Figure 1c). From the spot of fringe patterns, the contact boundaries between the two compounds could be concluded, confirming the heterojunction connection for the composite (Figure 1f). Moreover, Figure 2 illustrates the EDX mapping for oxygen, zirconium, and carbon for ZrO2, and ZrO2/G10 samples. Figure 2a shows the qualitative distribution of Zr and O elements on a 200 nm scale of ZrO2. The Zr and O are widely distributed and not aggregated inside the composite. It is observed that the O level is higher than Zr, as shown later in EXD spectra. On the other hand, Figure 2b confirmed the good distribution for all elements of Zr, O, and C for the binary nanocomposite, confirming the connections between the compounds.
Figure 3 observes an elemental examination of the ZrO2, and ZrO2/G10 samples nanoparticles, in which the peaks of Zr and O are evident. By quantitative analysis, the formation and composition of ZrO2 nano-crystalline particles were confirmed, this analysis showed that Zr and O are the only primary types present in the sample except for the appearance of Cu, which is originally in the used grid, which indicates the high purity and the absence of any impurities in the sample. The compositional elements of Zr, O, and C calculated from EXD spectra are listed in Table 1. One can see the Cu peak in the chart which has come from the used grid; therefore, it was subtracted and listed as zero in Table 1. The weight percentages of Zr and O were 69.39% and 30.61% in the sample ZrO2 samples.
On the other hand, regarding the ZrO2/G10, the EDX spectrum is shown in Figure 3b. The X-ray energies of Zr, O, and C are indicated on the charts. The element weight percentages of the compound were also calculated and listed in Table 1. The weight percentages of Zr, O, and C elements were 72.16, 18.56, and 9.28, respectively. The result confirms the formation of binary composites as intended in this study.

3.2. Raman Characterizations

Figure 4 indicates the Raman spectra of the bare ZrO2 and ZrO2-graphene nanocomposites of ZrO2/5G and ZrO2/10G. As it is known that Raman spectroscopy is a surface investigation tool and is sensitive to the degrees of crystallinity and the disorder of the materials [16,17]. Figure 4 exhibited that the spectra of pure ZrO2 were difficult to be detected by using a 633 nm laser as well as by using a blue laser of 433 nm (not shown here). This was described due to the high photoluminescence of pure ZrO2, as shown in the black curve. This wide-gap ZrO2 exposes extreme wideband photoluminescence around 490 nm ascribed to the high oxygen vacancies, which are perhaps the source of the PL emission [18,19]. However, for the sample prepared with graphene partial, Raman spectra indicated both ZrO2 and graphene bands as well. It is expected that the luminescent phenomenon of ZrO2 was quenched by graphene materials. For ZrO2/5G, vibration modes were observed at 1012, 615, 246, and 150 cm−1 [19,20]. Same vibration modes were recorded for ZrO2/10G, except 150 cm−1, which disappeared and a new band was observed at 140 cm−1. The graphene material can be qualitatively characterized by Raman measurements. The crystalline graphite is shown by the presence of two strong peaks in the Raman spectrum named G at 1580 and G’ at 2700 cm−1, where the G band is a first-order Raman-allowed feature originating from the zone center (phonon-wavevector q = 0), corresponding to the in-plane optical phonon modes. Graphene demonstrates three peaks described in its surface defects, crystalline graphite, and multi-layer formation.
These peaks were designated to a wavenumber of 1330, 1595, and 2645 cm−1, respectively. The G-band is assigned to the intra-bond of sp2 pairs hybridized carbons combined to E2g symmetry, while the D-band is assigned to A1g symmetry of breathing mode owing to the disordering [21]. From Figure 4, a shift of the D- and G-bands for both samples was observed, where D-peak and G-peak were observed at 1370 and 1575 cm−1 for ZrO2/5G and 1361 and 1565 cm−1 for ZrO2/10G, respectively. The shift may be due to the incorporation of graphene into the matrix of the oxide material. In the present samples, the G-band intensity is higher than that of the D-band, which indicates the high crystallinity of the fabricated graphene. The ratio of intensities of D to G peaks expresses the crystallinity-induced graphene [22], as listed in Table 2. The ratio of G’ to G intensity indicates the multilayer carbons formed here [23,24,25]. ZrO2/10G shows a little high crystallinity compared to the ZrO2/5G sample. This can be seen in the increase of the layer number of the former compared to the latter, where the ratio of G’ to G is 0.19 for ZrO2/10G compared to 0.45 for ZrO2/5G.

3.3. Photocatalytic Degradation Studies

3.3.1. Photocatalytic Degradation Calculations

It is well known that the concentration of dye degradation is directly proportional to the optical absorption values at a given wavelength. Therefore, a calibration curve was performed for the relationship between the absorbance and concentration of the methylene blue dye at the maximum absorbance wavelength. Consequently, the concentrations have been measured with different exposed UV light times. The ln(C/Co) relation as a function of the irradiation time, t, can be calculated using the following equation [10]:
ln ( C t C o ) = k K t + K C o
where Co, Ct is the primary dye concentration and the remaining concentration after the exposure to irradiation light for a while, t. k is the constant of the first-order reaction rate, and K is the constant of the degradation equilibrium at UV light.
The quantity ( q t in mg/L) of adsorbed dye at an instant time is then evaluated using [26]:
q t = ( C 0 C t ) m V
where C0 is in mg/L, Ct is the concentration at time t in mg/L, m is the mass of adsorbent in mg, and V is the volume of the solution in L.

3.3.2. Photocatalytic Degradation of MB Pollution

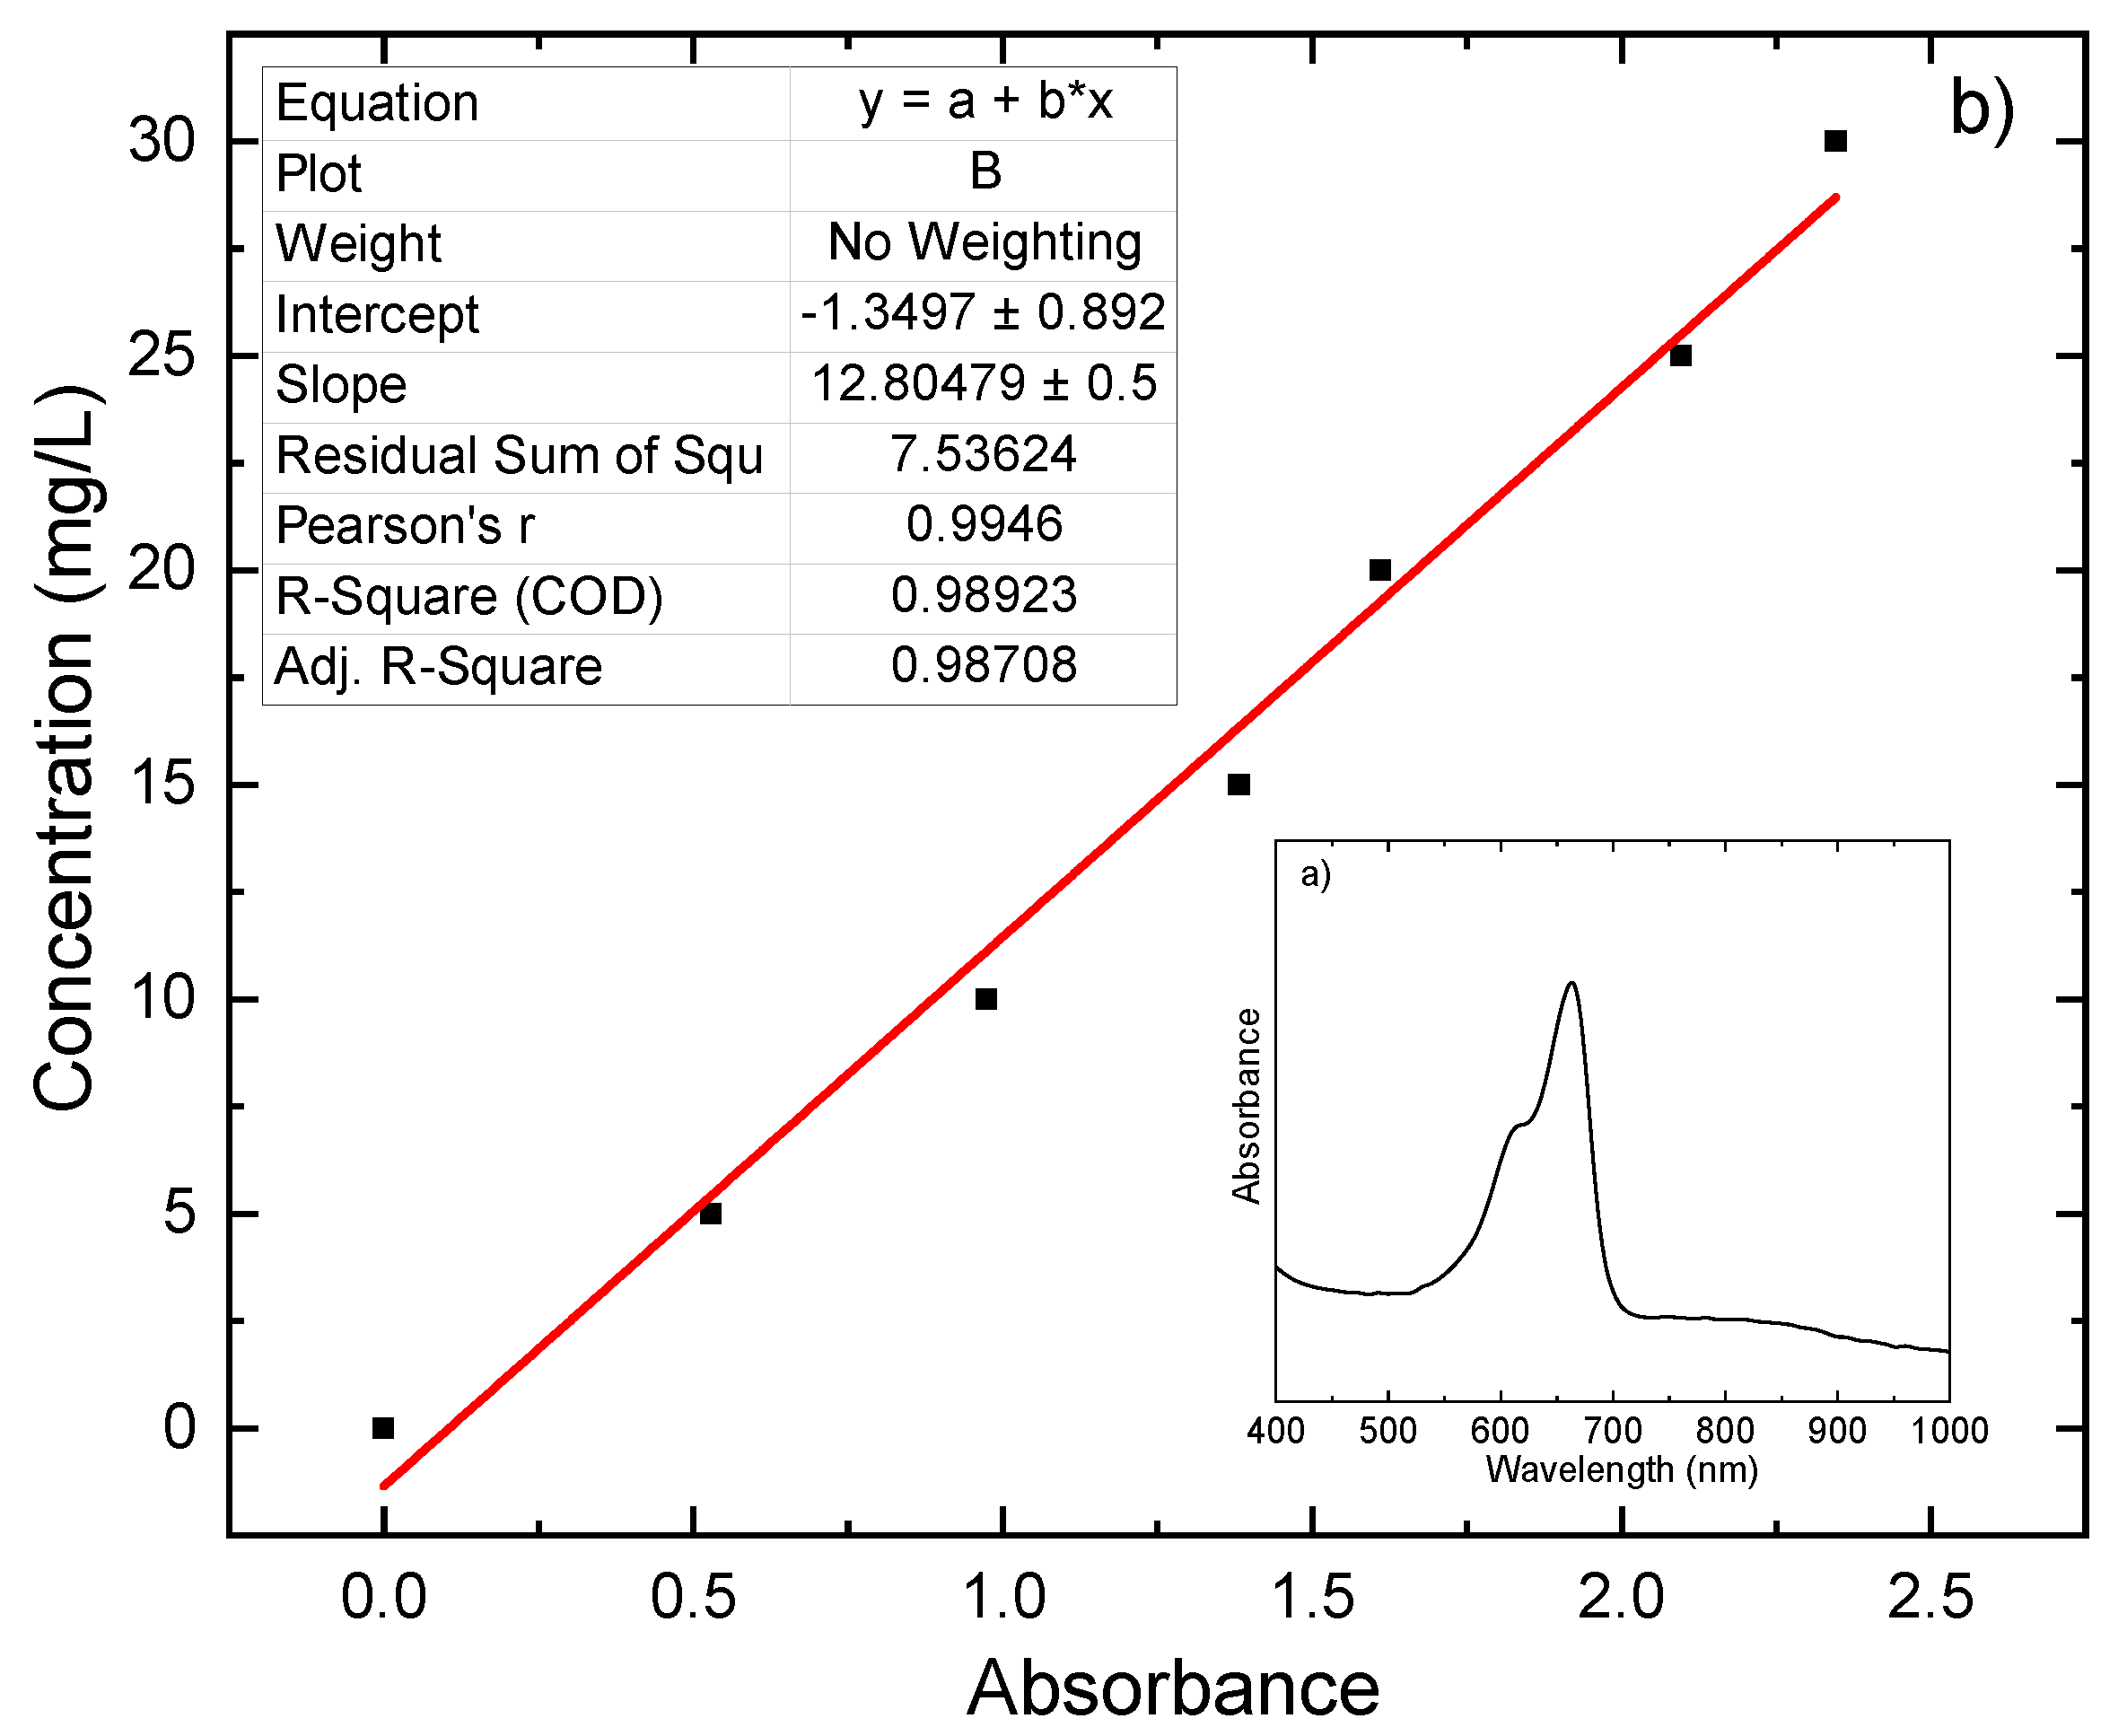
The absorbance of MB dye in water solution was illustrated in the following Figure 5a, which has a main peak at 660 nm. The experiment could be conducted using measuring the absorbance, but for more accuracy, it was performed using the concentration. It is well-known that the concentration of dye is directly proportional to the optical absorption values at a given wavelength. For this purpose, a primary experiment was conducted to find the correct and direct relationship between concentration and absorption of this specific dye. Therefore, several concentrations of this dye (0–30 mg/L) were prepared, then, the absorption was measured at this concentration. Figure 5b illustrated the relationship between these different concentrations of MB and the absorbance measured at that concentration. It was found, as expected, that it has a direct relationship with the equation of a straight line as it is in the figure, but the fitting straight line does not pass through the origin and its slope is not unity as the following equation y = 12.8 x 1.3479 . Therefore, a calibration curve was used for the relationship between the absorbance and concentration of the MB dye at the maximum absorbance wavelength and should be used during the measurement. Finally, during the experiment, the curve is called on the software and the concentration is measured directly at each irradiation time.
As mentioned before, the distinctive properties of these nanocomposites, including high degradation, qualify them in the category of competent catalysts. ZrO2-graphene nanocomposites, in particular, with their broad bandgap and high excitation binding energy, are promising materials for the degradation of organic dye pollutants [4]. Figure 6a,b display the dye degradation efficiency spectra of 5.0 mg/L and 10.0 mg/L of MB solutions using 2.0 mg of ZrO2 or ZrO2-graphene nanoparticles with two contents of graphene as catalysts at different exposed irradiation time of UV light. It can be seen that the efficiency increases with exposed irradiation UV light. On the other hand, it is more effective with 10% graphene from 30 to 70% than increasing the graphene contents from 5% to 10% for both concentrations of 5.0 mg/L and 10.0 mg/L of MB solutions.
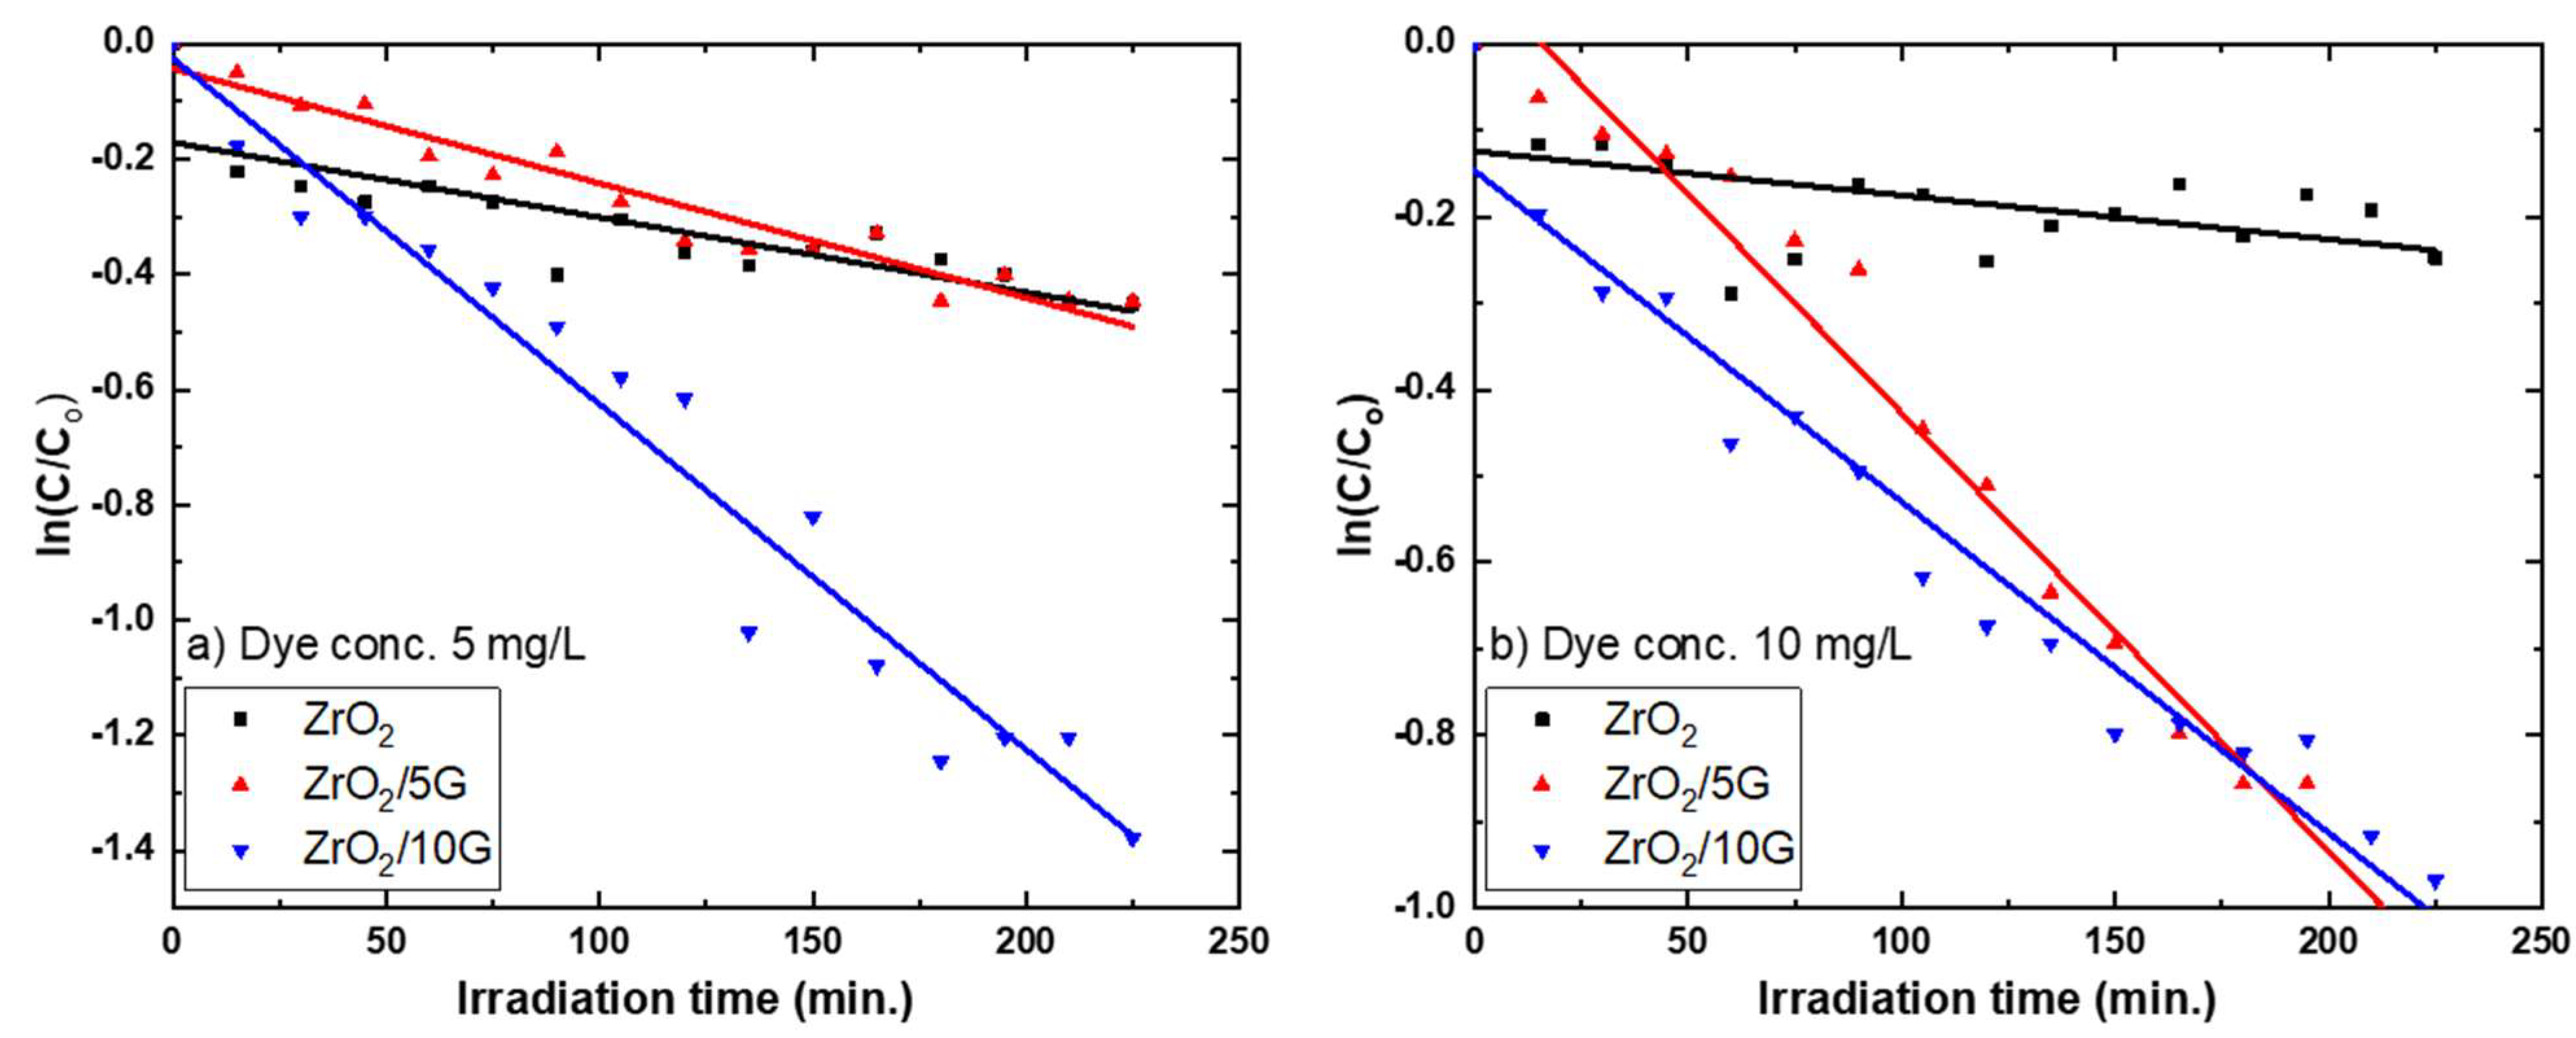
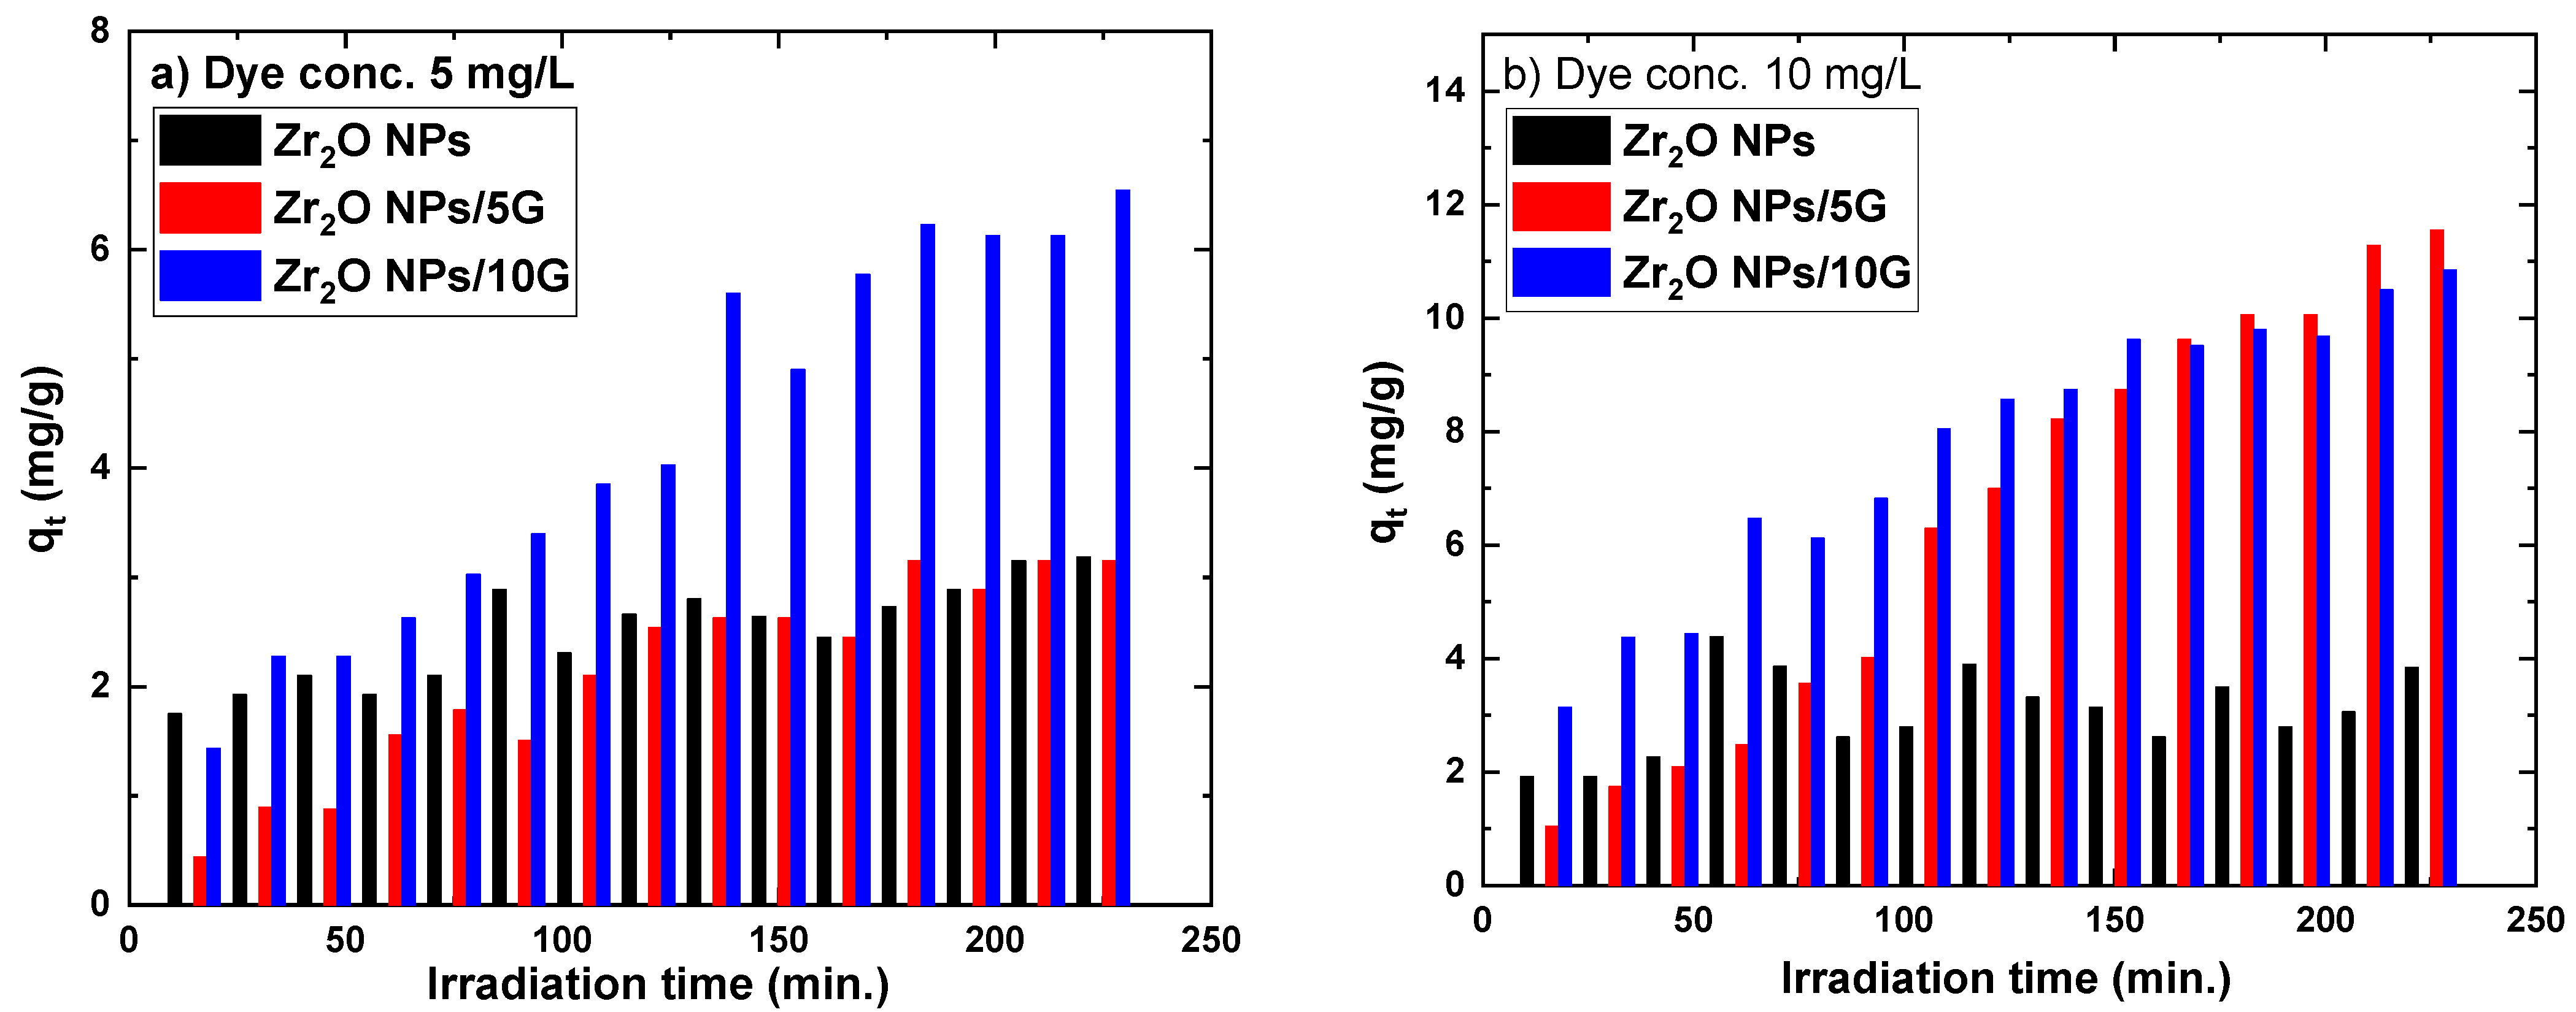
The semi-logarithmic relation of the MB concentration as a function of the irradiation time results in a straight line using Equation (2), as it is shown in Figure 7a,b for both MB concentrations. The degradation rate constant (k) and the degradation equilibrium constant (K) can be calculated from this relationship [10,27]. Both k and K constants were calculated and listed in Table 3 and Table 4. They were found to be dependent on the irradiation of UV light as well as the graphene contents for both MB concentrations of 5.0 mg/L and 10.0 mg/L. Figure 8 indicates the degradation capacity dependence on the time of irradiation by using Equation (3) for both 5.0 mg/L and 10.0 mg/L of MB concentrations. An improvement of the degradation capacity with the increase in the time was noticed, which is similar to the same behavior of the degradation capacity with the photolysis efficiency curve with the increase in the UV irradiation time as shown in Figure 8. Moreover, the content of 10% of graphene has a higher degradation capacity than ZrO2 and ZrO2/5% graphene for both MB concentrations.

3.3.3. Mechanism of Catalysis

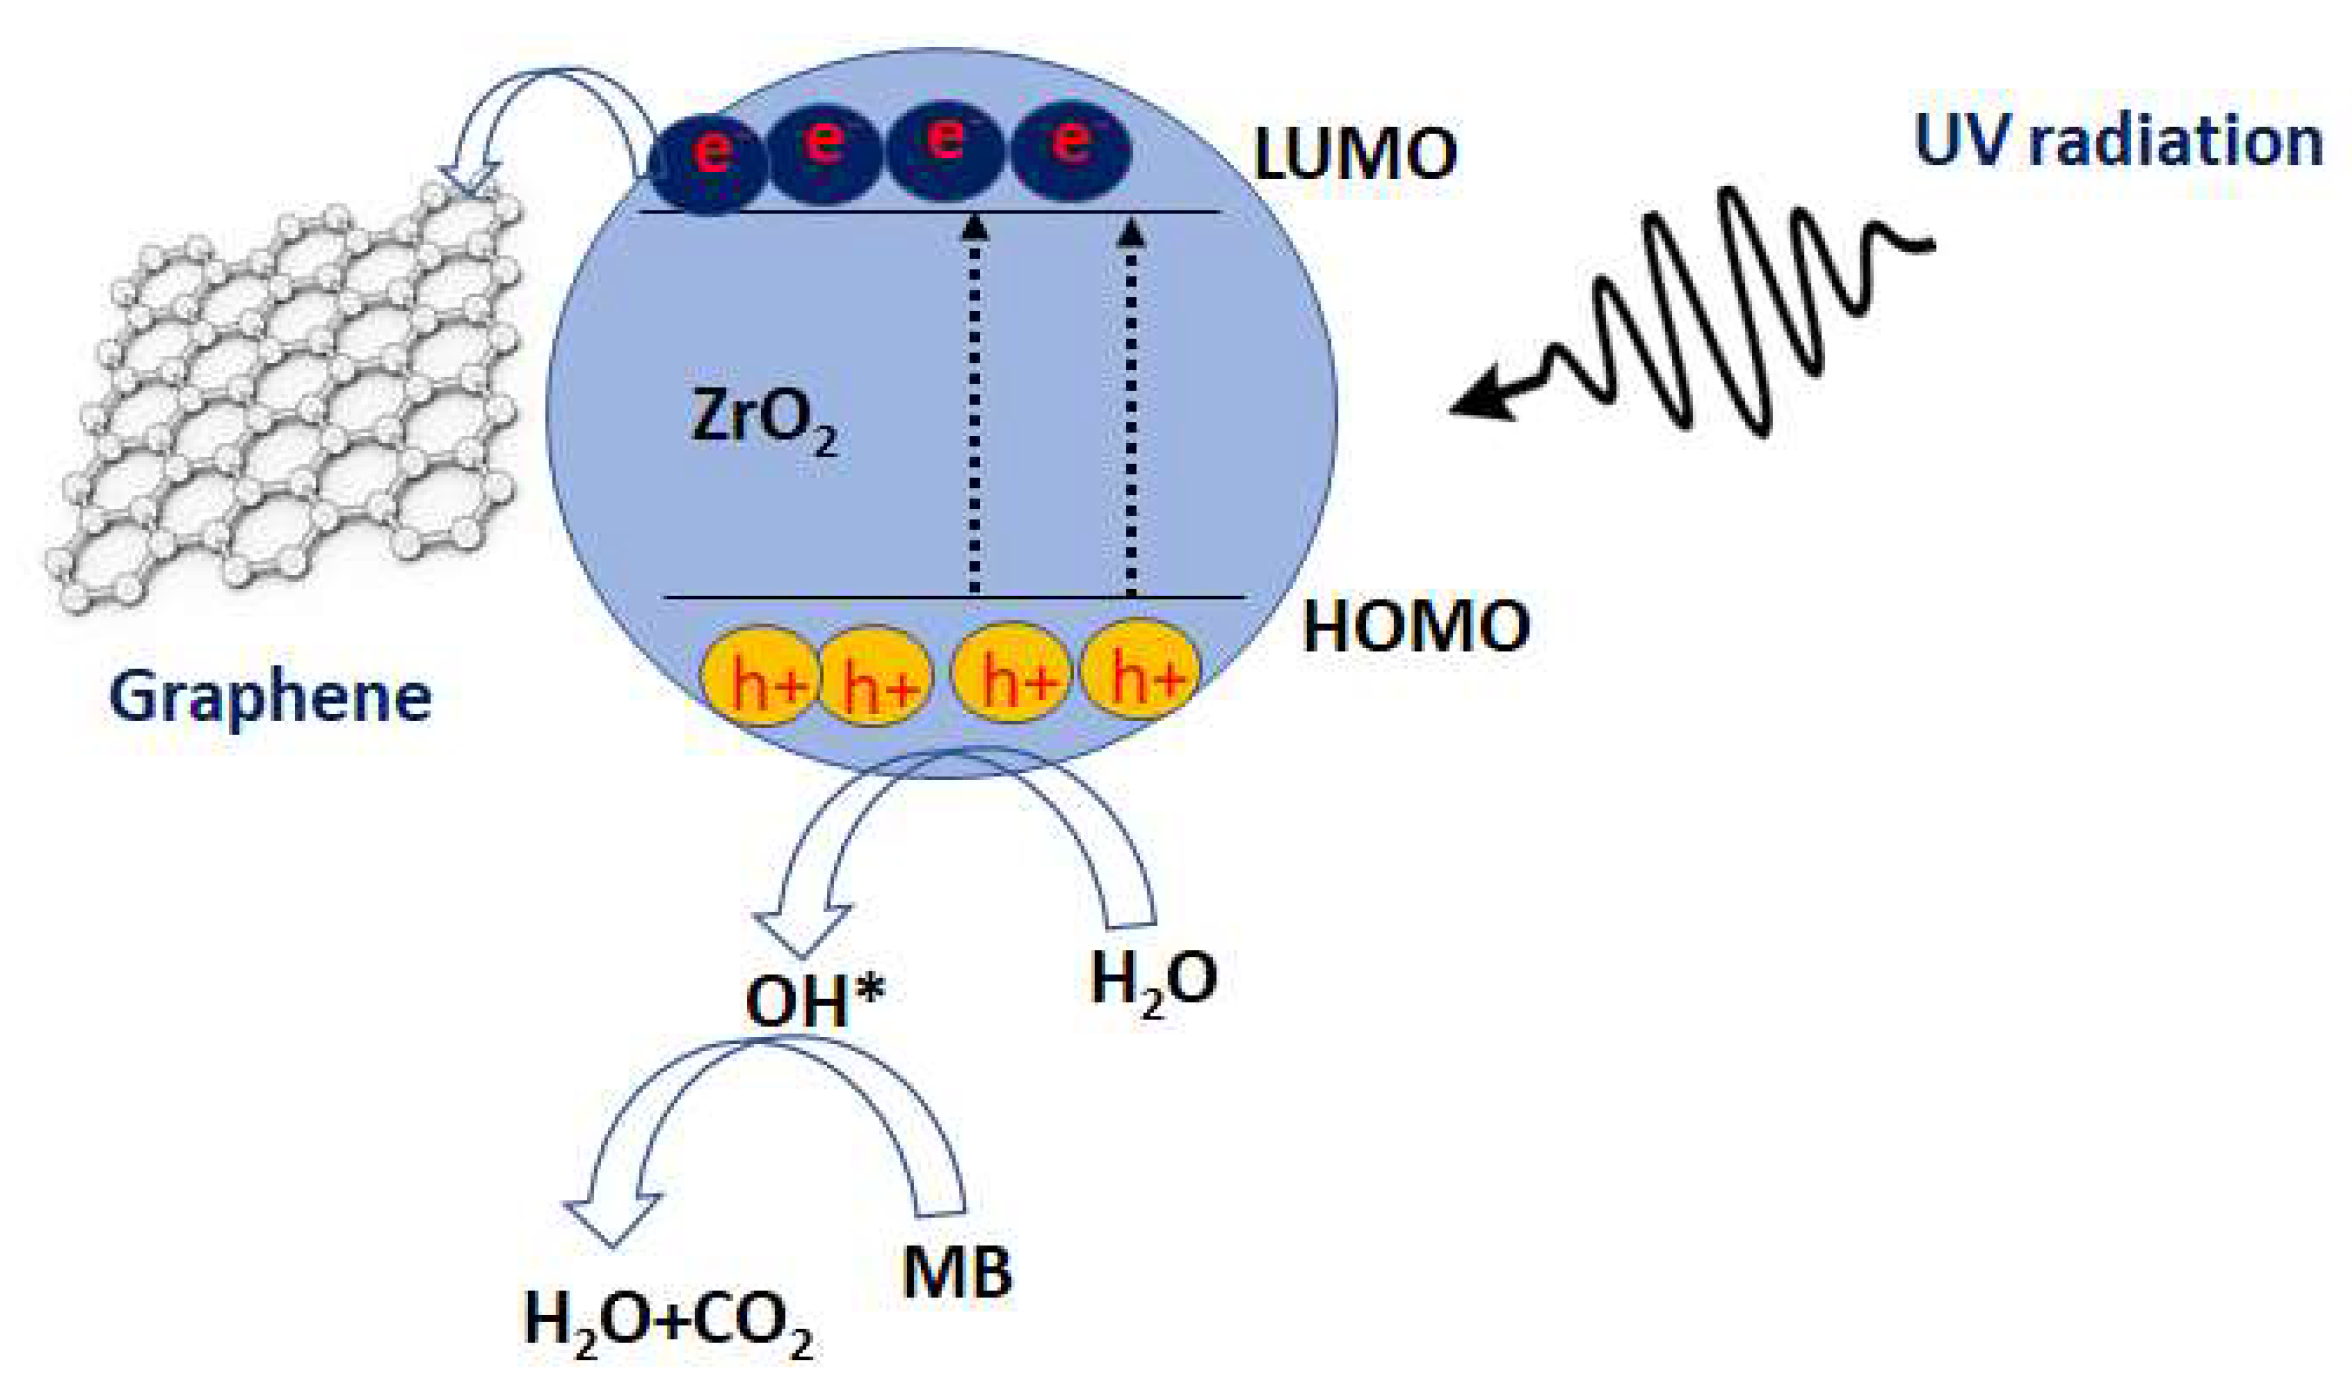
A typical catalytic technique for the degradation of MB dyes by zirconia-graphene nanocomposites under visible light irradiation was presented in Scheme 2. Based on previous research [28], the surface of graphene can receive valence electrons traveling from the high conduction band (CB) of ZrO2, and these electrons react with oxygen to produce super anion radicals (O2−) and OH* radicals, which leads to the formation of oxidation molecules. These molecules cause the oxidation of organic matter [4]. The catalytic mechanism can be divided into three distinct steps, which are as follows:
(i)
Electron/hole pair production: when a photon with energy () greater than or equal to its bandgap energy falls on the ZrO2 surface, an electron from VB in ZrO2 will be photoexcited to CB, leaving positively charged holes in the VB, as follows:
composite + h ν e + h +
(ii)
Hydroxyl radicals production: In this step, this electron (e) and hole (h+) in the CB and VB of ZrO2 will move to the catalyst surface and react with oxygen molecules and hydroxyl group to yield superoxide radicals of O2− and hydroxyl radicals of OH* based on the following reaction:
e + O 2 O 2   a n d   h + + O H O H
(iii)
The degradation of the MB dye: In this step, the hydroxyl radicals and superoxide anion radicals formed degrade the MB dye molecules by breaking the N = N bond and other bonds. According to the results of a catalytic experiment, ZrO2 nanoparticles can lead to the degradation of MB dye.

3.4. Comparison of the Catalytic Degradation of MB Dye

In this section, a comparison of the photocatalytic decay of MB in the existence of different nanomaterials with the current study is demonstrated. Previous studies of graphene consider it to be an “ultimate” RO membrane, as it is considered to be strong, thin, and chemically resistant [7]. There has been great interest in the manufacture and use of graphene oxide nanocomposites for use in environmental remediation by decomposing toxic organic pollutants, heavy metals, as well as antibacterial applications. In the case of Ti-S-500 nanoparticles samples at MB concentrations of 2 × 10⁻⁵ M, the degradation reaches 44% after irradiation at 90 min at direct sunbeams [29]. On the other hand, for TiO2-Fe3O4-bentonite nanoparticles for MB concentrations of 30 mg/L at UV irradiation, the degradation reaches 90% [30]. However, in the present samples, if the time limit is 240 min, at UV light for ZrO2/G10 for MB concentration of 5 mg/L, the degradation is 80%. A comparison of the catalytic degradation of MB dye for various materials is shown in Table 5. The result reported here has shown a superior behavior among the published materials.

4. Conclusions

In summary, a comprehensive study of the photocatalysis effect of ZrO2-graphene nanocomposites on the degradation of MB was deeply investigated. The mixed composites were fabricated by a simple method based on laser-induced graphene. Different contents of graphene mixed with ZrO2 have been examined. HRTEM images show that the average particle size is 6 nm for both ZrO2 and ZrO2/G10 samples. The Zr and O are widely distributed and not aggregated inside the composite as the EDX mapping has shown. Raman scattering exhibited that the spectrum of pure ZrO2 was difficult to be detected due to the high luminescence. However, ZrO2 vibration modes were detected for ZrO2/graphene composites at 1012, 615, 246, and 150 cm−1. A shift of the D- and G-bands for both samples was observed, where D-peak and G-peak were observed at 1370 and 1575 cm−1 for ZrO2/5G and, 1361 and 1565 cm−1 for ZrO2/10G, respectively. The shift is ascribed to the incorporation of graphene into the matrix of the oxide material. Photocatalytic effects on methylene blue have been determined on these ZrO2 and ZrO2-graphene nanocomposites. Two concentrations of methylene blue of 5 and 10 mg/L show different degradation values depending on the irradiation time. The degradation percent shows 80% and 60% corresponding to dye concentrations of 5.0 and 10.0 mgL−1. Kinetic models of pseudo-first-order, second-order, and intra-particle diffusion were applied to explain the experimental results. Moreover, pseudo-first-order was more applicable for the observed experimental data. The decomposition of cationic methylene blue showed a synergistic effect of the ZrO2-graphene nanocomposites on wastewater treatment.

Author Contributions

Conceptualization, N.M.S. and M.R.; methodology, M.R., N.M.S. and C.A.; software, N.M.S.; validation, C.A.; formal analysis, M.R., O.S. and A.A.; investigation, M.R.; resources, N.M.S.; data curation, N.M.S. and C.A.; writing—original draft preparation, M.R.; writing—review and editing, N.M.S., O.S. and A.A. supervision, N.M.S.; project administration, N.M.S.; funding acquisition, N.M.S. All authors have read and agreed to the published version of the manuscript.

Funding

This work was supported by “Al Bilad Bank Scholarly Chair for Food Security in Saudi Arabia”, the Deanship of Scientific Research, Vice Presidency for Graduate Studies and Scientific Research, King Faisal University, Saudi Arabia [Grant No. CHAIR68].

Institutional Review Board Statement

Not applicable.

Informed Consent Statement

Not applicable.

Data Availability Statement

On request.

Conflicts of Interest

The authors declare no conflict of interest.

References

  1. Keiteb, A.S.; Saion, E.; Zakaria, A.; Soltani, N. Structural and optical properties of zirconia nanoparticles by thermal treatment synthesis. J. Nanomater. 2016, 2016, 1913609. [Google Scholar] [CrossRef] [Green Version]
  2. Subbarao, E.C.; Maiti, H.S. Science and technology of zirconia. Adv. Ceram. 1981, 3, 1. [Google Scholar]
  3. Park, S.; Vohs, J.M.; Gorte, R.J. Direct oxidation of hydrocarbons in a solid-oxide fuel cell. Nature 2000, 404, 265–267. [Google Scholar] [CrossRef]
  4. El-Shafai, N.M.; El-Khouly, M.E.; El-Kemary, M.; Ramadan, M.S.; Masoud, M.S. Graphene oxide–metal oxide nanocomposites: Fabrication, characterization and removal of cationic rhodamine B dye. RSC Adv. 2018, 8, 13323–13332. [Google Scholar] [CrossRef] [Green Version]
  5. Emeline, A.; Kataeva, G.V.; Litke, A.S.; Rudakova, A.V.; Ryabchuk, V.K.; Serpone, N. Spectroscopic and photoluminescence studies of a wide band gap insulating material: Powdered and colloidal ZrO2 sols. Langmuir 1998, 14, 5011–5022. [Google Scholar] [CrossRef]
  6. Khan, M.; Tahir, M.N.; Syed, F.A. Graphene based metal and metal oxide nanocomposites: Synthesis, properties and their applications. J. Mater. Chem. A 2015, 3, 18753–18808. [Google Scholar] [CrossRef] [Green Version]
  7. Homaeigohar, S.; Elbahri, M. Graphene membranes for water desalination. NPG Asia Mater. 2017, 9, e427. [Google Scholar] [CrossRef] [Green Version]
  8. Cohen-Tanugi, D.; Grossman, J.C. Nanoporous graphene as a reverse osmosis membrane: Recent insights from theory and simulation. Desalination 2015, 366, 59–70. [Google Scholar] [CrossRef] [Green Version]
  9. Singh, J.; Verma, V.; Kumar, R.; Sharma, S.; Kumar, R. Effect of structural and thermal disorder on the optical band gap energy of Cr2O3 nanoparticles. Mater. Res. Express 2019, 6, 85039. [Google Scholar] [CrossRef]
  10. Rashad, M.; Shaalan, N.M.; Abd-Elnaiem, A.M. Degradation enhancement of methylene blue on ZnO nanocombs synthesized by thermal evaporation technique. Desalin. Water Treat. 2016, 57, 26267–26273. [Google Scholar] [CrossRef]
  11. Taghdiri, M. Selective Adsorption and Photocatalytic Degradation of Dyes Using Polyoxometalate Hybrid Supported on Magnetic Activated Carbon Nanoparticles under Sunlight, Visible, and UV Irradiation. Int. J. Photoenergy 2017, 2017, 8575096. [Google Scholar] [CrossRef] [Green Version]
  12. Rashad, M.; L-Aoh, H.A.A. Promising adsorption studies of bromophenol blue using copper oxide nanoparticles. Desalin. Water Treat. 2019, 139, 360–368. [Google Scholar] [CrossRef]
  13. Rashad, M.; Al-Ghamdi, S.A.; Alzahrani, A.O.M.; Al-Tabaa, K.; Al-Osemi, S.; Al-Atawi, O.; Al-Anzi, N.; Issa, S.A.M.; Abd-Elnaiem, A.M. Zinc oxide nanoparticles for adsorption of potassium permanganate from wastewater using shaking method. Desalin. Water Treat. 2021, 229, 227–234. [Google Scholar] [CrossRef]
  14. Bumajdad, A.; Nazeer, A.A.; al Sagheer, F.; Nahar, S. Controlled Synthesis of ZrO2 Nanoparticles with Tailored Size, Morphology and Crystal Phases via Organic/Inorganic Hybrid Films. Sci. Rep. 2018, 8, 1–9. [Google Scholar] [CrossRef] [Green Version]
  15. Colbea, C.; Avram, D.; Cojocaru, B.; Negrea, R.; Ghica, C.; Kessler, V.G.; Seisenbaeva, G.A.; Parvulescu, V.; Tiseanu, C. Full tetragonal phase stabilization in ZrO2 nanoparticles using wet impregnation: Interplay of host structure, dopant concentration and sensitivity of characterization technique. Nanomaterials 2018, 8, 988. [Google Scholar] [CrossRef] [Green Version]
  16. Azammi, A.M.N.; Ilyas, R.A.; Sapuan, S.M.; Ibrahim, R.; Atikah, M.S.N.; Asrofi, M.; Atiqah, A. Characterization studies of biopolymeric matrix and cellulose fibres based composites related to functionalized fibre-matrix interface. In Interfaces in Particle and Fibre Reinforced Composites; Elsevier: Amsterdam, The Netherlands, 2020; pp. 29–93. [Google Scholar]
  17. Inam, A.; Brydson, R.; Edmonds, D.V. Raman spectroscopy study of the crystallinity of graphite formed in an experimental free-machining steel. Mater. Charact. 2020, 163, 110264. [Google Scholar] [CrossRef]
  18. Bettinali, C.; Ferraresso, G.; Manconi, J.W. Thermoluminescence of ZrO2. J. Chem. Phys. 1969, 50, 3957–3961. [Google Scholar] [CrossRef]
  19. Puust, L.; Kiisk, V.; Utt, K.; Mändar, H.; Sildos, I. Afterglow and thermoluminescence of ZrO2 nanopowders. Cent. Eur. J. Phys. 2014, 12, 415–420. [Google Scholar] [CrossRef]
  20. Rani, S.; Aggarwal, M.; Kumar, M.; Sharma, S.; Kumar, D. Removal of methylene blue and rhodamine B from water by zirconium oxide/graphene. Water Sci. 2016, 30, 51–60. [Google Scholar] [CrossRef] [Green Version]
  21. Ferrari, A.C.; Robertson, J. Interpretation of Raman spectra of disordered and amorphous carbon. Phys. Rev. B 2000, 61, 14095–14107. [Google Scholar] [CrossRef] [Green Version]
  22. Lucchese, M.M.; Stavale, F.; Ferreira, E.H.M.; Vilani, C.; Moutinho, M.V.O.; Capaz, R.B.; Achete, C.A.; Jorio, A. Quantifying ion-induced defects and Raman relaxation length in graphene. Carbon 2010, 48, 1592–1597. [Google Scholar] [CrossRef]
  23. Ferrari, A.C. Raman spectroscopy of graphene and graphite: Disorder, electron–phonon coupling, doping and nonadiabatic effects. Solid State Commun. 2007, 143, 47–57. [Google Scholar] [CrossRef]
  24. Jorio, A.; Saito, R. Raman spectroscopy for carbon nanotube applications. J. Appl. Phys. 2021, 129, 21102. [Google Scholar] [CrossRef]
  25. Ferrari, A.C.; Meyer, J.C.; Scardaci, V.; Casiraghi, C.; Lazzeri, M.; Mauri, F.; Piscanec, S.; Jiang, D.; Novoselov, K.S.; Roth, S.; et al. Raman spectrum of graphene and graphene layers. Phys. Rev. Lett. 2006, 97, 187401. [Google Scholar] [CrossRef] [Green Version]
  26. Rashad, M. Performance efficiency and kinetic studies of water purification using ZnO and MgO nanoparticles for potassium permanganate. Opt. Quantum Electron. 2019, 51, 291. [Google Scholar] [CrossRef]
  27. Yan, H.; Hou, J.; Fu, Z.; Yang, B.; Yang, P.; Liu, K.; Wen, M.; Chen, Y.; Fu, S.; Li, F. Growth and photocatalytic properties of one-dimensional ZnO nanostructures prepared by thermal evaporation. Mater. Res. Bull. 2009, 44, 1954–1958. [Google Scholar] [CrossRef]
  28. Aziz, A.; Ali, N.; Khan, A.; Bilal, M.; Malik, S.; Ali, N.; Khan, H. Chitosan-zinc sulfide nanoparticles, characterization and their photocatalytic degradation efficiency for azo dyes. Int. J. Biol. Macromol. 2020, 153, 502–512. [Google Scholar] [CrossRef]
  29. Kundu, A.; Mondal, A. Photodegradation of methylene blue under direct sunbeams by synthesized anatase titania nanoparticles. SN Appl. Sci. 2019, 1, 1–17. [Google Scholar] [CrossRef] [Green Version]
  30. Chen, W.; Xiao, H.; Xu, H.; Ding, T.; Gu, Y. Photodegradation of Methylene Blue by TiO2-Fe3O4-Bentonite Magnetic Nanocomposite. Int. J. Photoenergy 2015, 2015, 591428. [Google Scholar] [CrossRef] [Green Version]
  31. Vig, A.S.; Gupta, A.; Pandey, O.P. Efficient photodegradation of methylene blue (MB) under solar radiation by ZrC nanoparticles. Adv. Powder Technol. 2018, 29, 2231–2242. [Google Scholar] [CrossRef]
  32. Yin, X.; Liu, L.; Ai, F. Enhanced Photocatalytic Degradation of Methylene Blue by WO3 Nanoparticles Under NIR Light Irradiation. Front. Chem. 2021, 9, 1–9. [Google Scholar] [CrossRef] [PubMed]
Scheme 1. Steps for preparing graphene powder by using a CO2 laser machine and preparing the ZrO2-graphene composites.
Separations 09 00185 sch001
Figure 1. HRTEM, lattice images, and SAED for (ac) ZrO2, and (df) ZrO2/G10 samples.
Separations 09 00185 g001
Figure 2. EDX mapping for oxygen, zirconium, and carbon for: (a) ZrO2, and (b) ZrO2/G10 samples.
Separations 09 00185 g002
Figure 3. EDX charts for elemental analysis for: (a) ZrO2 and (b) ZrO2/G10 samples.
Separations 09 00185 g003
Figure 4. Raman spectra for the ZrO2, ZrO2/5G, and ZrO2/10G nanoparticles.
Separations 09 00185 g004
Figure 5. (a) The absorbance of MB dye in water solution, (b) Concentration vs. absorbance calibration curve for MB dye in water solution.
Separations 09 00185 g005
Figure 6. Photocatalytic degradation of methylene blue (MB) on ZrO2, ZrO2/G5, and ZrO2/G10 for both concentrations of MB of: (a) 5.0 and (b) 10.0 mg/L.
Separations 09 00185 g006
Figure 7. Semi-logarithmic graph of methylene blue (MB) concentration vs. irradiation time in the presence of ZrO2, ZrO2 /G5, and ZrO2 /G10 for both concentrations of MB of: (a) 5 and (b) 10 mg/L.
Separations 09 00185 g007
Figure 8. Effect of the contact time on the degradation capacity of methylene blue (MB) concentration vs. irradiation time in the presence of ZrO2, ZrO2/G5, and ZrO2/G10 for both concentrations of MB of: (a) 5.0 and (b) 10.0 mg/L.
Separations 09 00185 g008
Scheme 2. The proposed mechanism for the photodegradation of cationic dye by metal oxide-graphene.
Separations 09 00185 sch002
Table 1. Compositional elements of Zr, O, and C calculated from EXD spectra.
Element ZrO2ZrO2/G10
wt.%at.%wt.%at.%
Zr69.3928.4572.1629.08
O30.6171.5518.5642.55
C009.2828.37
Table 2. Experimental Raman ratio of intensities of D to G peaks expresses the crystallinity-induced graphene.
SampleID/GIG’/G
ZrO2--
ZrO2/5G0.870.45
ZrO2/10G0.840.19
Table 3. First-order reaction rate constants (k) and the degradation equilibrium constant (K), and experimental qe values for the 5 mg/L MB degradation on ZrO2, ZrO2/5G, and ZrO2/10G at 303 K.
MB 5 mg/L
qe(exp)kK
ZrO23.180.0390.034
ZrO2/5G3.150.2280.009
ZrO2/10G6.551.1350.005
Table 4. First-order reaction rate constants (k) and the degradation equilibrium constant (K), and experimental qe values for the 10 mg/L MB degradation on ZrO2, ZrO2/5G, and ZrO2/10G at 303 K.
MB 10 mg/L
qe(exp)kK
ZrO23.3250.020.025
ZrO2/5G11.030.320.016
ZrO2/10G10.680.130.029
Table 5. The degradation efficiency of MB using ZrO2, ZrO2/G5, and ZrO2/G10 in this study was compared to previously published work.
SamplesMB Concentration (mg/L)Degradation (%)IrradiationTime (min)Ref.
Ti-S-500 NPs2 × 10−5 M44direct sunbeams90 min[29]
Ti-D-500 NPs37
Ti-500 NPs27
ZrC NPs 80UV5 h[31]
WO3 NPs10 mg/L55NIR light50 min[32]
43UV
ZnO at 0.15 Torr1 × 10−6 M81sun simulator90 min[10]
ZnO at 0.30 Torr80
ZnO at 0.70 Torr65
ZnO at 1.00 Torr56
TiO2-Fe3O4- bentonite NPs30 mg/L90UV90 min[30]
ZrO2 NPs5 mg/L30UV240 minCurrent work
ZrO2/G5 NPs30
ZrO2/G10 NPs80
ZrO2 NPs10 mg/L20
ZrO2/G5 NPs60
ZrO2/G10 NPs60
Publisher’s Note: MDPI stays neutral with regard to jurisdictional claims in published maps and institutional affiliations.