Article

Development of a Methodology to Adapt an Equilibrium Buffer/Wash Applied to the Purification of hGPN2 Protein Expressed in Escherichia coli Using an IMAC Immobilized Metal Affinity Chromatography System

by
Jorge Juárez-Lucero
1,
María del Rayo Guevara-Villa
2,*,
Anabel Sánchez-Sánchez
1,
Raquel Díaz-Hernández
1 and
Leopoldo Altamirano-Robles
1,*
1
Instituto Nacional de Astrofísica, Óptica y Electrónica, Tonantzintla, Puebla 72840, Mexico
2
Laboratorio de Adsorción y Cromatografía, Centro de Química del Instituto de Ciencias de la Benemérita Universidad Autónoma de Puebla, Puebla 72000, Mexico
*
Authors to whom correspondence should be addressed.
Separations 2022, 9(7), 164; https://doi.org/10.3390/separations9070164
Submission received: 18 May 2022 / Revised: 24 June 2022 / Accepted: 24 June 2022 / Published: 28 June 2022

Abstract

:
Protein purification is a complex and non-standardized process; the fact that proteins have different structural types making it difficult to create a standard methodology to obtain them in a pure, soluble, and homogeneous form. The present study shows the selective development of a buffer suitable for proteins of interest that allows high concentrations of hGPN2 protein to be obtained with low polydispersion and high homogeneity and purity. By taking the different reagents used in the construction of different buffers as a basis and performing purifications using different additives in different concentrations to determine the optimal amounts, the developed process helps to minimize the bonds, maintain solubility, release the proteins present in inclusion bodies, and provide an adequate environment for obtaining high concentrations of pure protein. GPN proteins are of unknown function, have not been purified in high concentrations, and have been found as part of the RNA polymerase assembly; if they are not expressed, the cell dies, and overexpression of certain GPN proteins has been linked to decreased survival in patients with invasive ductal carcinoma breast cancer types ER+ and HER2+. The results of the present study show that the use of the buffer developed for recombinant hGPN2 protein expressed in Escherichia coli could be manipulated in order to isolate the protein in a totally pure form and without the use of protease inhibitor tablets. The resulting homogeneity and low polydispersion was corroborated by studies carried out using dynamic dispersion analysis. Thanks to these properties, it can be used for crystallography or structural genomics studies.

1. Introduction

The function of proteins is closely related to their structure [1,2]. Due to their many diverse functions, the structure of proteins varies a great deal, and there is thus no standard protein separation and purification method that can be applied to all protein variants. Achieving a pure protein requires the use of different separation techniques, which can be used sequentially to achieve the required purity [3].
Buffers are solutions that allow a protein’s conformation, solubility, and stability to be maintained during the experiment [4]. An unsuitable buffer can precipitate the protein, disable its function with poor homogenization, or provide incomplete extraction of membrane proteins [5].
If it is desirable to maintain the protein’s activity, it is necessary to work in very cold conditions in order to avoid the sample being degraded by proteases [5]. In addition, it is necessary to avoid heat-generating processes such as sonication [5,6]. The sonication method allows the tissue sample to be released by homogenizing it; however, this has the drawback of generating a large amount of heat, and it is thus necessary to use small pulses followed by cooling intervals in order not to denature the sample or activate proteases that can degrade it [5].
Once the sample is released, it is necessary to keep it inside the buffer, as this includes detergents that prevent its precipitation [5,7,8]. To prevent protein aggregation and control solubility, the use of salts, such as NaCl or KCl at concentrations of 100 mM to 150 mM, is recommended, while the use of reducing agents such as DTT can help to maintain the active state of the protein [5,7].
A list of the buffers most commonly employed during the protein purification process is presented by [5]; these reagents and their uses include Tris-HCl to maintain pH, NaCl to maintain solubility, NP40 or Triton X-100 to solubilize insoluble proteins, SDS [5,7,9] to solubilize insoluble proteins, CHAPS [10] to break protein–protein interactions, urea [7] to break non-covalent interactions and denature proteins, EDTA to reduce oxidative damage and inhibit metalloproteases, glycerol [7,9] to stabilize the buffer, DTT [7,9] to remove disulfide bonds and denature proteins, 2-Mercaptoethanol [7,9] to remove disulfide bonds and denature proteins, and protease inhibitor tablets [7,11] to inhibit proteolysis of the sample.
RIPA buffer is most commonly employed to increase concentration and preserve protein conformation; it includes 150 mM NaCl, 0.1% SDS, 1% NP-40 or Triton X-100, 1 mM EDTA, 50 mM Tris-HCl, and 1% sodium deoxycholate at pH 7.4 to 7.8, and includes a protease inhibitor tablet [5,8].
However, the use of different buffers does not guarantee that the protein will be pure and active. Different buffers have been searched for and suggested for obtaining higher proteins purity; however, due to the many different possible structures there is no guarantee that a sample will have the required purity for each desired experiment [12].
The most common technique used to purify recombinant proteins bound to molecules with affinity to a chelating metal covalently linked to a matrix on a column, such as histidine-enriched proteins, is nickel immobilized metal affinity chromatography, or IMAC [13,14]. Only a small amount of proteins can be purified by the IMAC system without having to perform prior modifications [15]. When the expression system used is Escherichia coli bacteria, then the recombinant proteins produced are expected to be stored inside exclusion bodies [16]; several different techniques can be applied to release them in the purification process [17,18,19]. For contaminant removal, the IMAC system requires the use of an imidazole gradient to ultimately elute the protein of interest [20] along with the use of various buffers to search for pure protein, with no guarantee of success [21,22,23]. If impurities remain present after this treatment, the use of other separation columns is necessary [3].
In order to minimize costs and avoid the use of other chromatographic columns in the purification process, aggregates are used within the buffer. Sacket [24] used L-glutamic acid monosodium salt monohydrate (GluNa) to replace KCl and increase the ionic strength. At high concentrations, this can allow certain proteins to be stabilized [25], and several authors have used it together with arginine to solubilize proteins and decrease their production within inclusion bodies [26,27,28]. However, the use of arginine at high concentrations prevents the protein from binding to nickel, and protein interaction increases in the column when the concentration of arginine decreases [29]. GTPases are very important proteins responsible for releasing energy from guanosine triphosphate; they perform switch functions in cell signaling pathways and are employed for therapeutic use in cancer diagnosis. Furthermore, their mutation causes pancreatic cancer and they have been used with nanoparticles in breast cancer treatment [30,31,32,33]. GPN proteins are small proteins of unknown function which are localized in the RNA polymerase assembly; if they are not expressed, then the cell dies, while their overexpression has been linked to decreased survival in patients with invasive ductal carcinoma breast cancer types ER+ and HER2+ [22,32,33,34,35,36,37,38,39].
The present study shows the development of a buffer capable of achieving high concentrations of hGPN2 protein in a pure, homogeneous, and low-polydispersity form through IMAC immobilized metal affinity chromatography. Contaminants arising from expressing the recombinant protein in E. coli bacteria are removed using different additives in the buffer to manipulate ionic strength, pH, disulfide bonds, and chelating agents.

2. Materials and Methods

2.1. Construction of the Expression Vector for hGPN2

Genes encoding the human GPN2 protein (hGPN2) were obtained from the human cDNA library Open Biosystems, cloned together with a group of six histidines (hexahistidines) into the vector pET28-DL3, and inserted into E. coli bacteria following the methodology proposed by Gonzalez [40].

2.2. Preparation of the His-Bind Column

A mixture of 100 µL of resin from a Novagen His-Bind kit, 25 µL of nickel sulfate, and 175 µL of 100 mM Tris-HCl buffer with 100 mM KCl maintaining a pH of 8.2 was prepared and placed inside an Eppendorf tube that was kept in rotation for 15 min to equilibrate the sample. After the established time, the Eppendorf tube was washed using 10 mL of the same buffer and was used as a column to retain the recombinant protein.

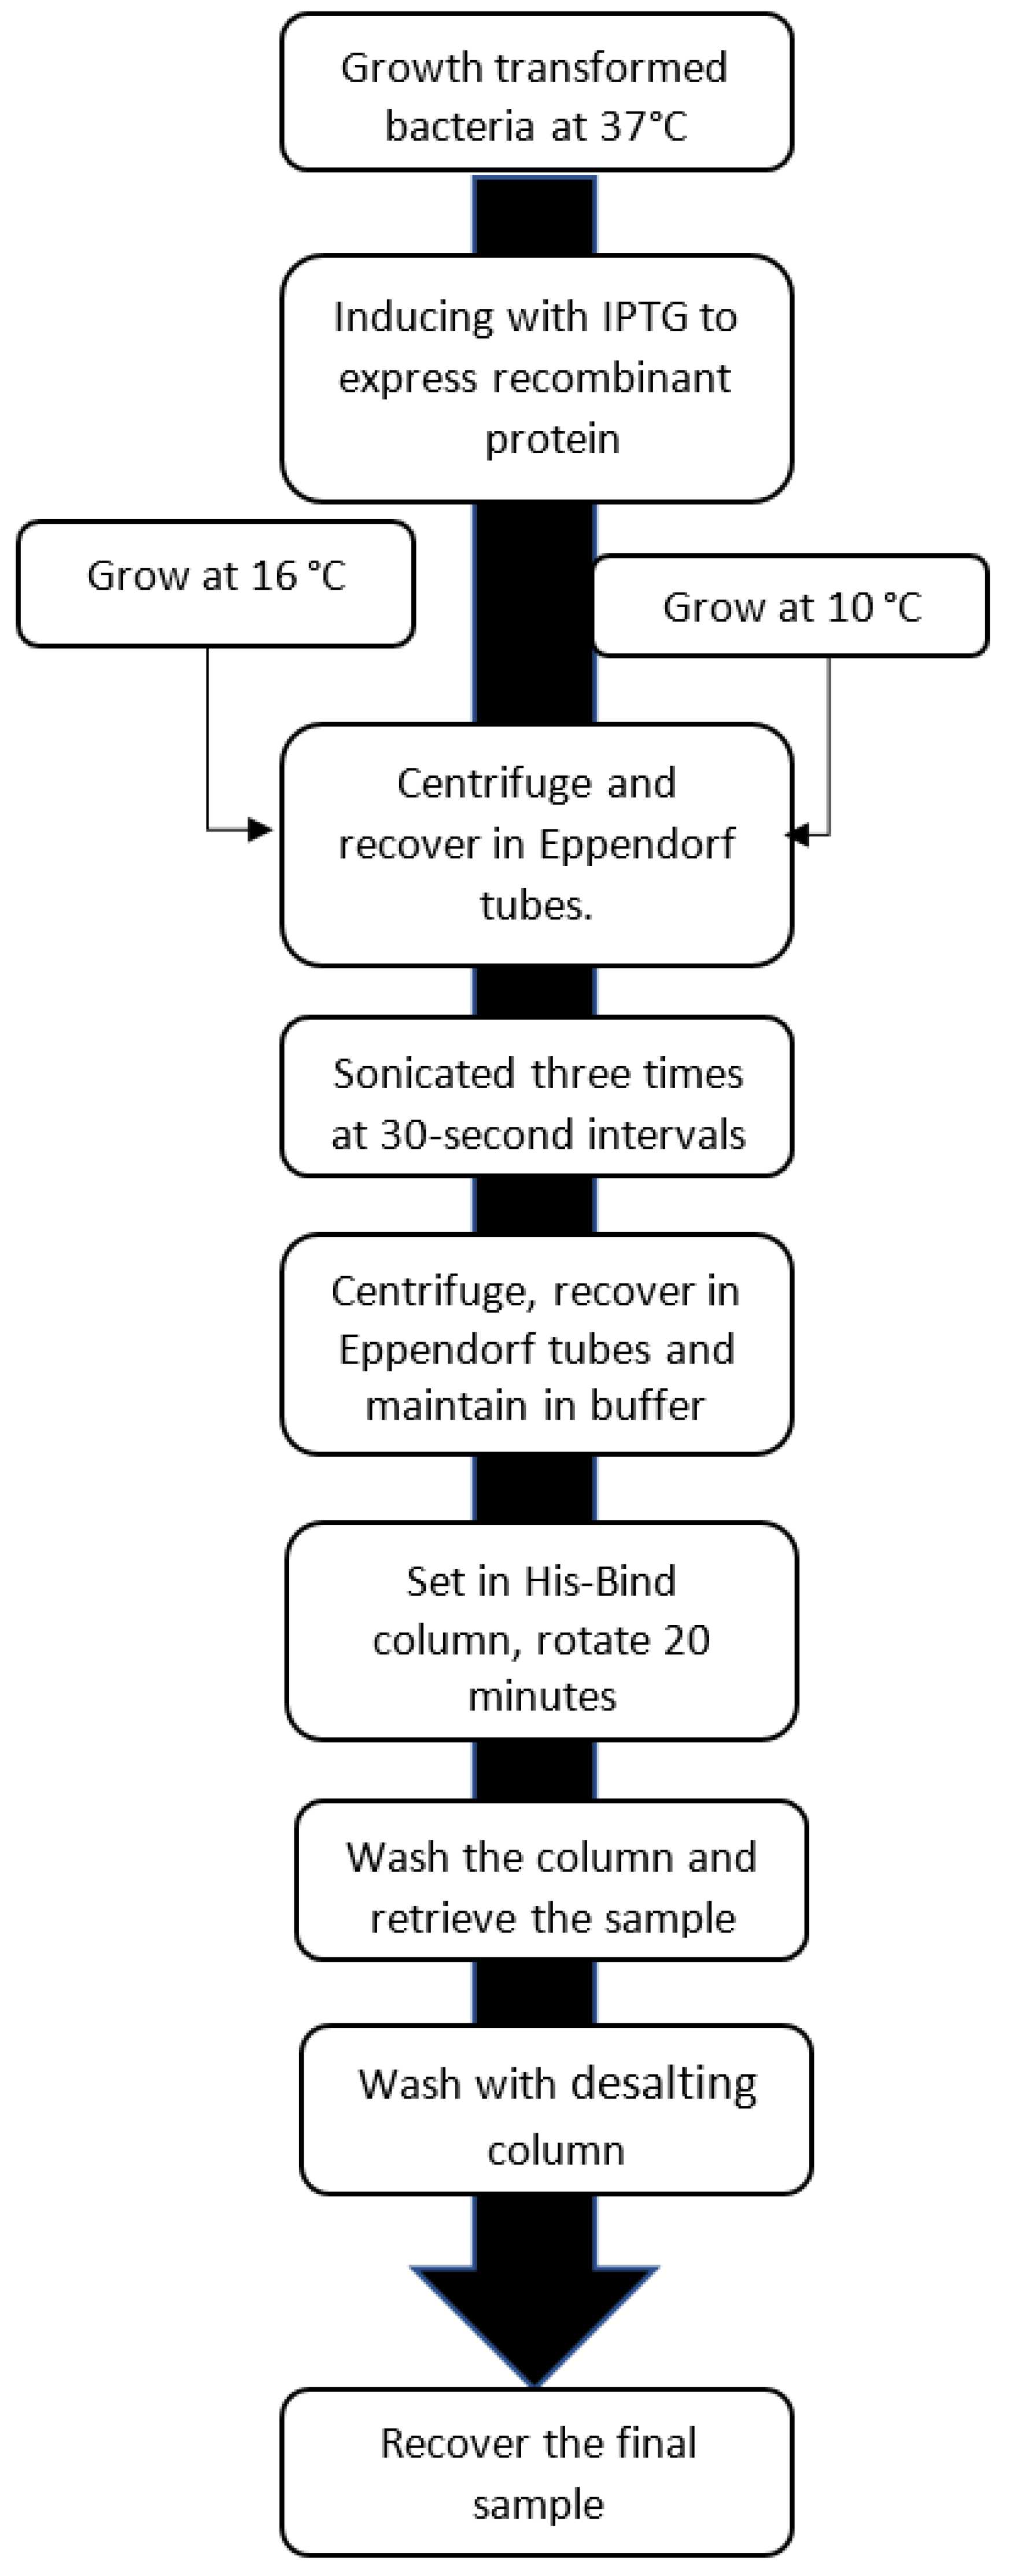
2.3. Expression of hGPN2 Protein and Growth at Different Temperatures

The E. coli (DL3) bacterial strain transformed with the hGPN2 protein gene expression vector was maintained at 37 °C for growth inside a 1-liter flask with 600 mL of LB culture medium at 100 µM/mL Kanamycin. Growth was carried out in the exponential phase, as this when the growth rate of the bacteria is at its maximum and can be used to obtain the greatest possible amount of recombinant protein. Recombinant protein expression was induced by adding Isopropyl ß-D-1-thiogalactopyranoside (IPTG) at a concentration of 200 µM. Two culture samples were taken and left to grow for 24 h. The first, coded as MG16C, was kept at a temperature of 16 °C, and the second one, coded as MG10C, at 10 °C. After 24 h, the MG16C and MG10C cell cultures were centrifuged in Eppendorf tubes at a temperature of 4 °C at 13,000 rpm for 15 min and the pellets were resuspended in 1 mL of their respective buffers at pH 8.2. The solutions were sonicated three times with 30-s pulses followed by 30 s resting on ice with salt and acetone. They were then centrifuged at 4 °C at 13,000 rpm for 15 min.
The supernatants were placed in the 100 µL of resin of the previously prepared His-Bind column and equilibrated with nickel. The samples were then mixed and allowed to rotate for 20 min. At the end of the rotation period the columns were washed with 10 mL of their respective buffers at pH 8.2 and finally eluted with the same buffer, adding 300 mM imidazole to separate the recombinant protein from the columns. Finally, the samples were passed through a 10 mL Thermo Scientific 6K MWCO desalting column to remove salts, then separated, using 10% SDS-PAGE electrophoresis with the Coomasie blue staining technique (see process in the diagram of Figure 1).

2.4. Protein Expression with NaCl

Five buffers were prepared with 50, 100, 500, 1000, and 2000 mM NaCl added to 100 mM Tris-HCl at pH 8.2. These were used as buffers to perform hGPN2 protein expression with the MG10C sample, following the procedure described above and summarized in Figure 1 to create protein expression with different NaCl concentrations.
Using Bradford’s analysis, the concentration obtained from the total extracted proteins in each of the samples treated with the different prepared buffers was calculated.

2.5. Protein Purification of Recombinant Protein with TRIS

Four buffers were prepared by modifying the Tris concentration to 50, 100, 150, and 200 mM with 100 mM NaCl maintaining a pH of 8.2; these were then used in the process of hGPN2 protein purification with sample MG10C.

2.6. Protein Purification of Recombinant Protein with EDTA

Three different samples were prepared using the concentrations of 100, 200, and 400 µM EDTA and added to 100 mM Tris-HCl, 100 mM NaCl buffer at pH 8.2, then used for the hGPN2 protein purification process using sample MG10C.

2.7. Protein Purification of Recombinant Protein with DTT

Six buffer solutions based on 100 mM Tris-HCl, 100 mM NaCl at pH 8.2 were prepared with 10, 20, 40, 60, 80, and 100 µM DTT in each buffer and used for the process of hGPN2 protein purification using sample MG10C.

2.8. Protein Purification of Recombinant Protein with Amino Acids

The hGPN2 protein purification procedure was repeated using the MG10C sample using ten solutions in ten buffers based on 100 mM Tris-HCl and 100 NaCl at pH 8.2, with the following concentrations: (1) 25 mM Sodium Glutamate, (2) 50 mM Sodium Glutamate, (3) 100 mM Sodium Glutamate, (4) 200 mM Sodium Glutamate, (5) 300 mM Sodium Glutamate, (6) 50 mM Arginine, (7) 50 mM Lysine, (8) 100 mM Lysine, (9) 200 mM Lysine, (10) 100 mM Lysine, 100 mM Sodium Glutamate.

2.9. Purification with Final Buffer

The hGPN2 protein purification process was performed with the MG10C sample using a buffer developed with 100 mM Tris-HCl, 5% glycerol, 0.2% Triton X-100, 100 mM NaCl, 100 mM lysine, 100 mM Sodium Glutamate, 400 µM EDTA, and 100 µM DTT using the IMAC system described above.

2.10. Quantification of the hGPN2 Protein

Protein concentration was quantified using the Bio-Rad Bradford protein assay kit (Bio-Rad Bradford protein assay) according to the supplier’s specifications. Measurements were performed using an absorbance of 595 nm.

2.11. Dynamic light Scattering Analysis

Dynamic scattering experiments were performed on a Malvern Nano S instrument (Malvern, Ltd.) equipped with NIBS (Non-Invasive Back Scattering) laser technology at a wavelength of 663 nm with a Peltier temperature controller. The protein solution was filtered through an Anotop® syringe filter with a pore size of 0.02 µm (Whatman, GE) prior to measurements. The hydrodynamic radius (Rh) was calculated using the included Zeta Sizer software.

3. Results

3.1. Construction of the Expression Vector for hGPN2 and Expression Assay

In order to verify that the vector construct was able to express the hGPN2 protein within E. coli bacteria, 1 mL was sampled before induction with IPTG (Figure 2 lane 3) and 1 mL after induction (Figure 2 lane 2), then separated using 10% SDS-PAGE electrophoresis and revealed using the Coomasie blue staining technique. The gel in Figure 2, lane 2 indicates that hGPN2 protein expression with a molecular weight of approximately 34 KDa between 25 and 37 KDa was obtained, which is the predicted value for its molecular weight.

3.2. His-Bind Column Preparation

Twenty-eight tubes containing 100 µL of resin and 25 µL of nickel sulfate were stored under refrigeration at 4 °C to be used as IMAC columns during the process of hGPN2 protein purification and growth at different temperatures with each of the buffers mentioned in the methodology.

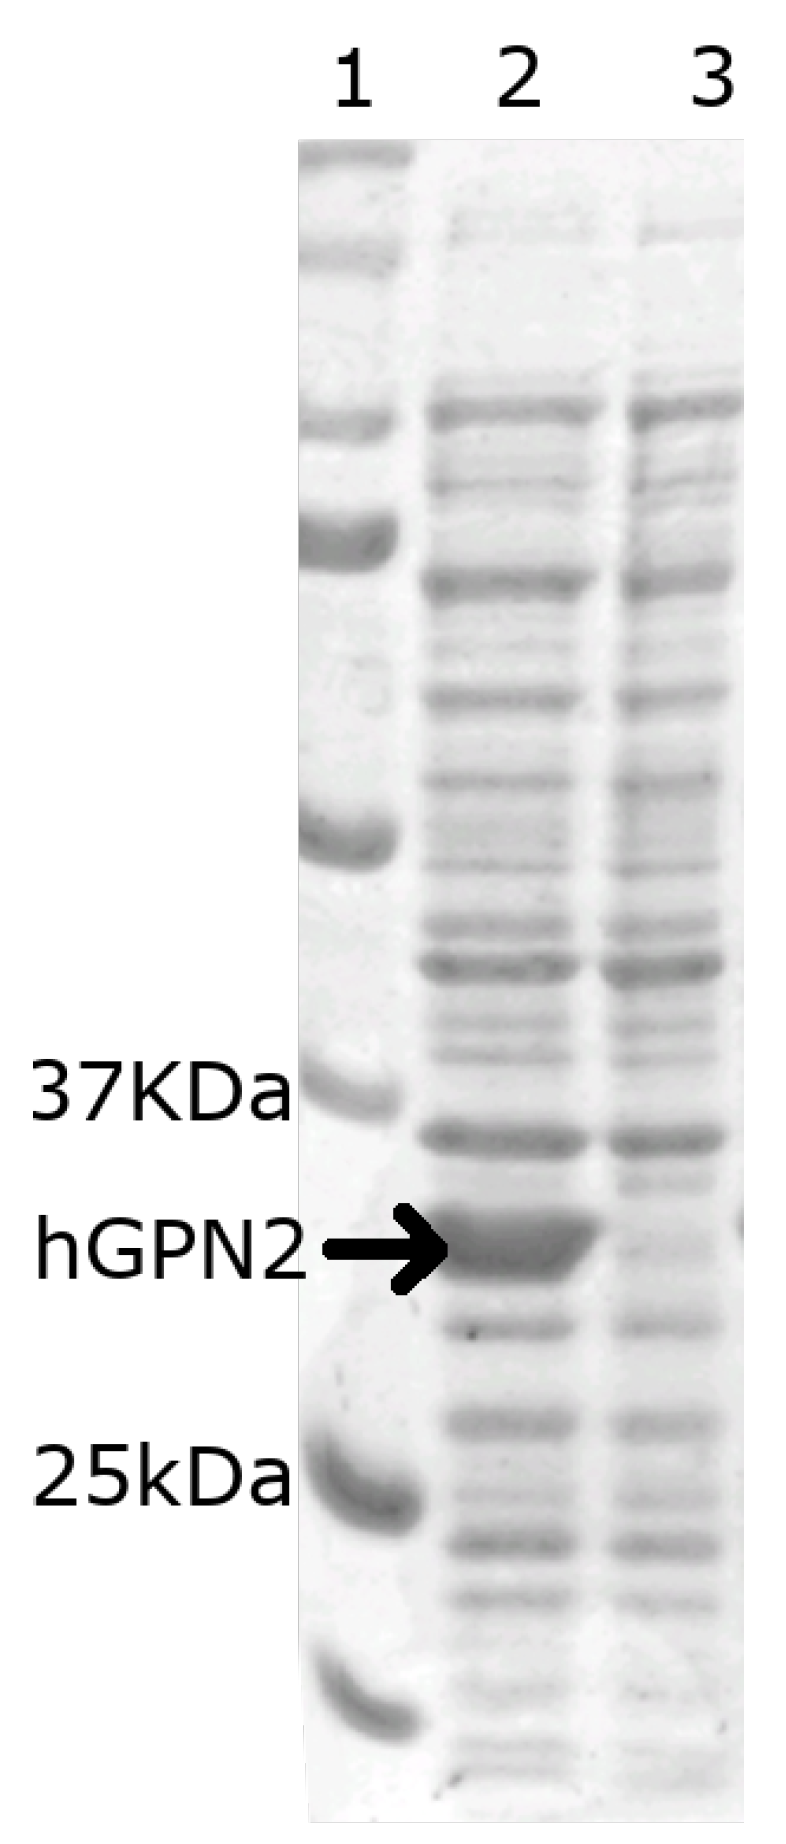
3.3. hGPN2 Protein Expression and Growth at Different Temperatures

After induction with IPTG, two growth processes were carried out at different temperatures (Figure 3): the sample with the bacteria was placed in an Eppendorf tube and centrifuged for 15 min at 4 °C; the Eppendorf tube was inserted into a Branson Ultrasonics™ Sonifier™ SFX250/SFX550 Cell Disruptor-type sonicator, where it was pulsed for 30 seconds; and the tube was removed from the sonicator and cooled for 30 s on ice with salt and acetone in order to ensure that the temperature did not exceed 4 °C, preserving the inactive proteases and proteins in their native state and preventing the degradation of the latter by the activation of the former, thereby avoiding the use of protease inhibitor tablets. This process was repeated twice in order to guarantee the rupture of the whole pellet and the release of the recombinant protein from the bacteria together with the contaminating proteins. The sample was centrifuged again for 15 min at 4 °C, the supernatant was separated from the pellet, and separation was performed by 10% SDS-PAGE electrophoresis and revealed by Coomasie staining. Figure 3A shows that in the growth process at 16 °C (MG16C), the recombinant protein remained in the pellet, and was not found in the soluble fraction. When growth was performed with the temperature decreased to 10 °C (MG10C), the amount of hGPN2 protein in the pellet decreased, appearing instead in the soluble part contained in the supernatant (see Figure 3B, lane 2). Thus, analysis of the cell lysate and the culture medium showed the maximum expression of recombinant protein at 24 h of growth after induction while maintaining a temperature of 10 °C, meaning that the MG10C sample was able to obtain recombinant protein in a soluble form.

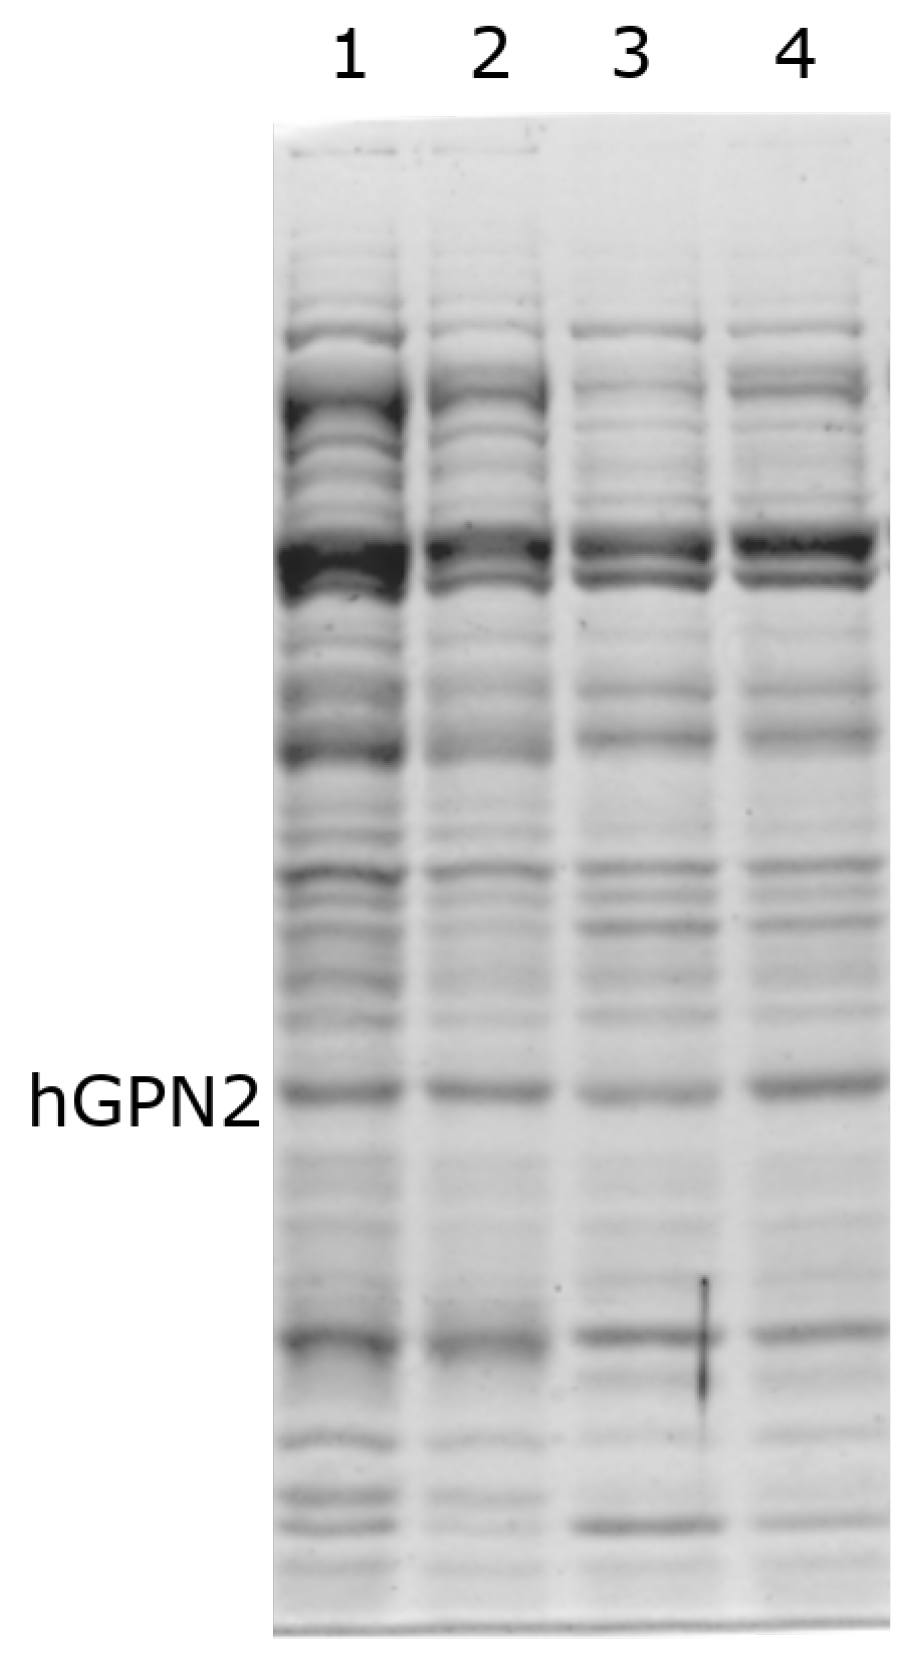
3.4. Protein Purification of Recombinant Protein with NaCl

In order to determine the salt concentration at which a higher concentration of the total extract proteins including the recombinant hGPN2 protein (sample MG10C) appears, protein purification of recombinant protein was performed with different concentrations of NaCl (see Table 1) added to 100 mM Tris-HCl buffer at pH 8.2. Subsequently, Bradford’s analysis was performed at each of the different concentrations, obtaining the solubility data shown in Table 1.
The effect of protein purification of recombinant protein performed on the obtained solubilities indicated that the maximum degree of solubility was obtained when using the buffer with 100 mM Tris-HCl and 100 mM NaCl. When using higher concentrations, the solubility decreased; at concentrations higher than 2000 mM NaCl, the content of the recombinant protein and the total extract precipitates, and is no longer maintained in the soluble fraction.

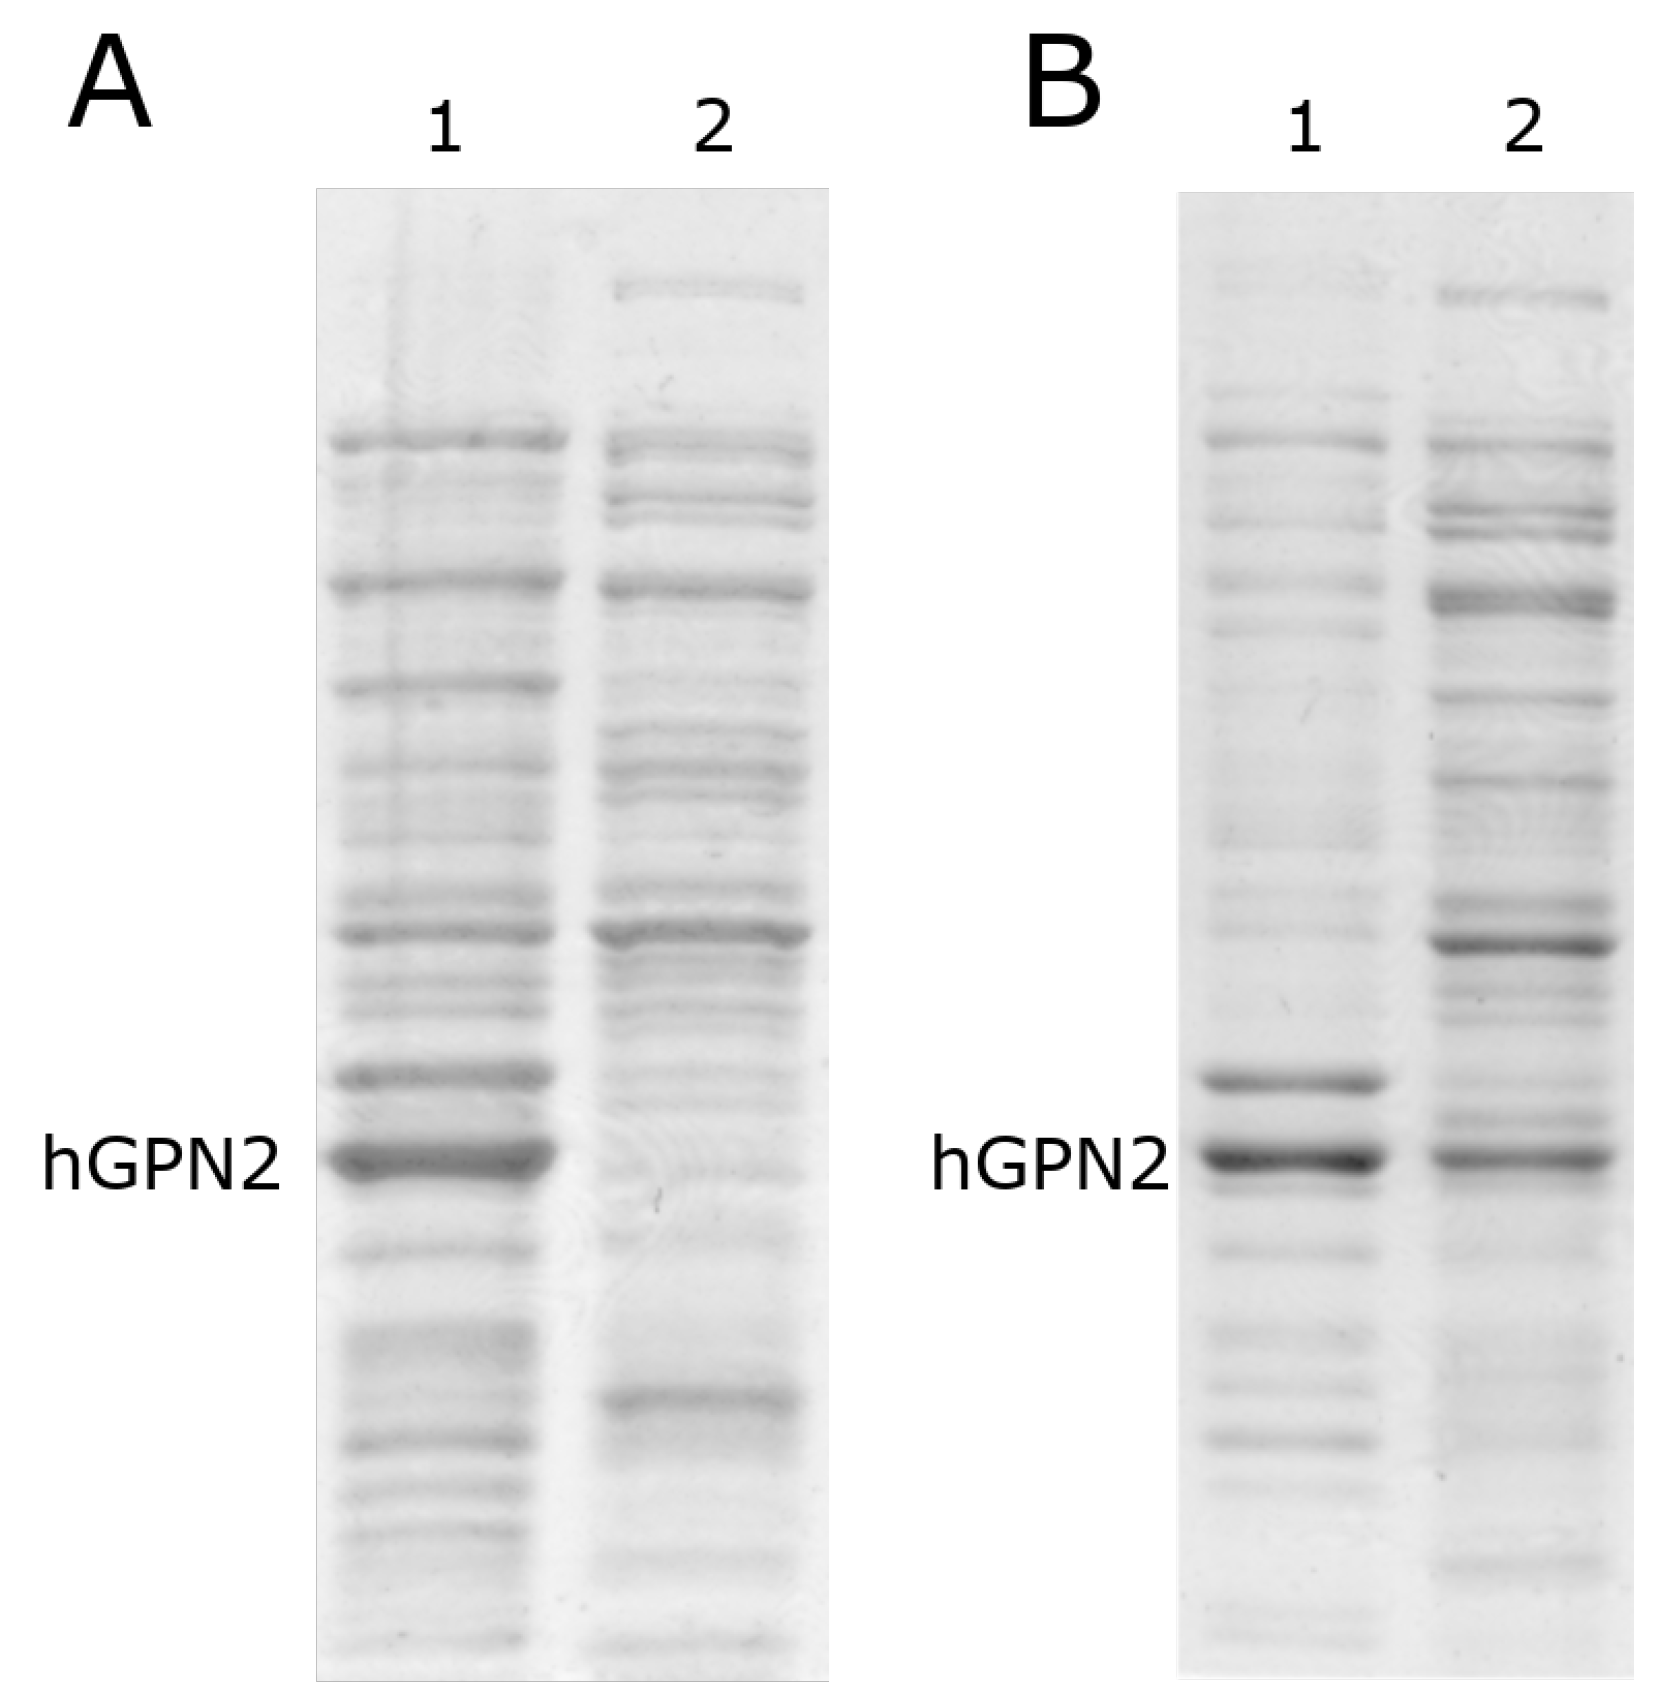
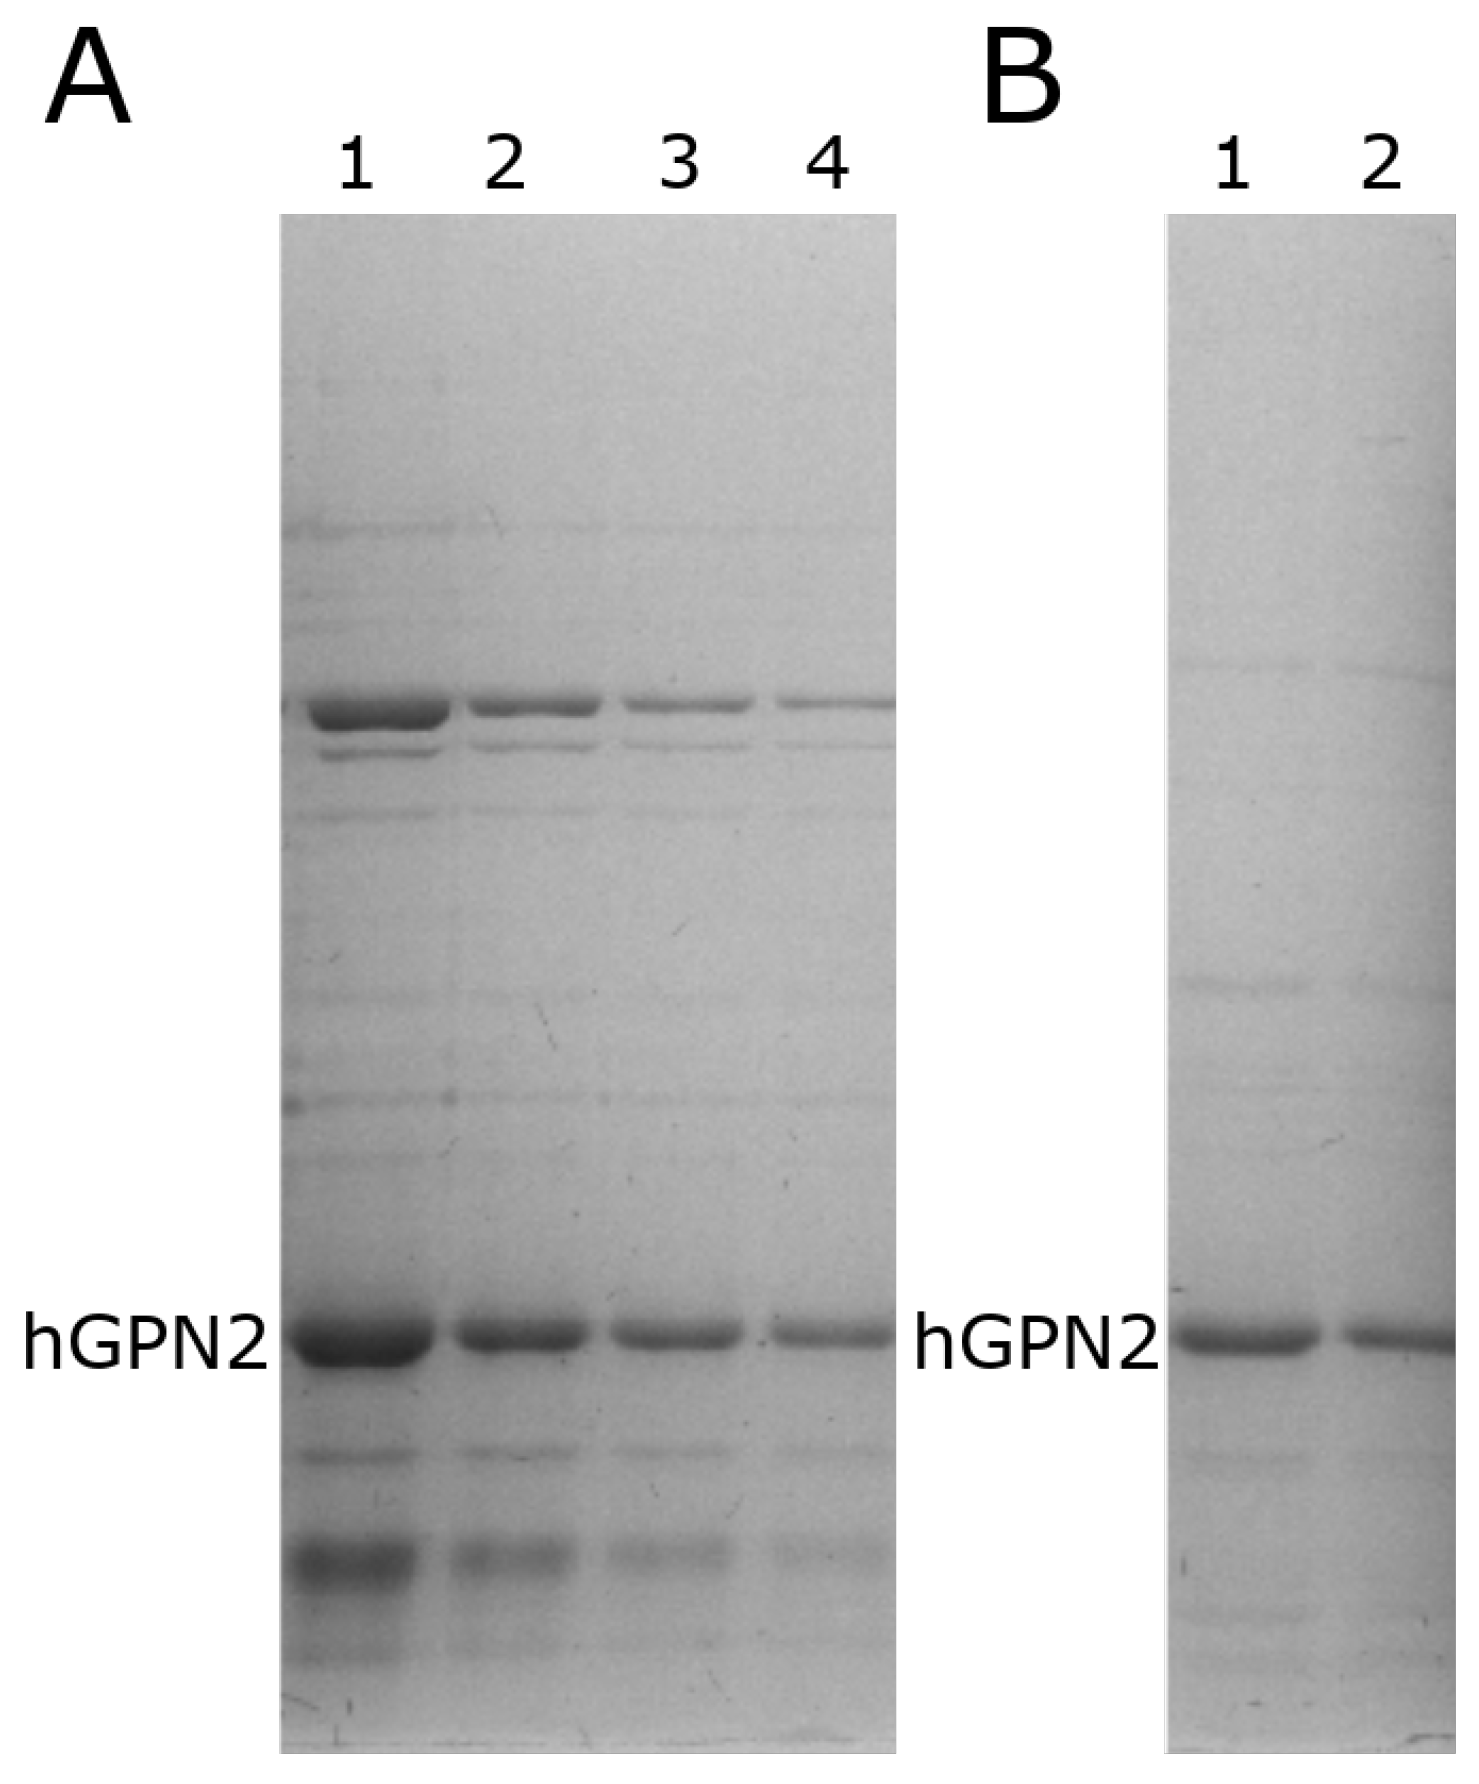
3.5. Protein Purification of Recombinant Protein with TRIS

To measure the effect of TRIS, the concentration of 100 mM NaCl was fixed, as previous studies have shown that the maximum solubility is achieved at this concentration. Therefore, only TRIS concentrations were varied when searching for an effect on purification, which was then verified using SDS-PAGE gels. In the process of protein purification of recombinant protein with Tris, it was observed when purifying hGPN2 protein from the MG10C sample that concentrations lower than 100 mM (Figure 4, lane 1) conserved high values of contaminants (represented by bands with greater thickness) compared to the bands obtained in subsequent experiments. When using values higher than 100 mM (Figure 4, lanes 2–4), there was no variat in the amount of proteins maintaining the same values in the cell extract analyzed. Our results indicate that Tris-HCl has no significant effect on the elimination of impurities, and at a concentration of 100 mM NaCl the minimum amount of Tris-HCl required to maintain the pH and slightly decrease the quantity of contaminants without presenting a reduction in the size of the band corresponding to hGPN2 is 100 mM.

3.6. Protein Purification of Recombinant Protein with EDTA

Three MG10C samples were prepared to purify the recombinant hGPN2 protein. Figure 5 shows how the use of 400 µM EDTA reduces the quantity of contaminants present during purification (Figure 5, lane 3). Lower values (100 and 200 µM) do not reduce the amount of contaminants, as the bands showing the amount of unwanted proteins are thicker (Figure 5, lanes 1–2). These results suggest that the use of 400 µM EDTA favors the removal of contaminants, although without completely eliminating them.

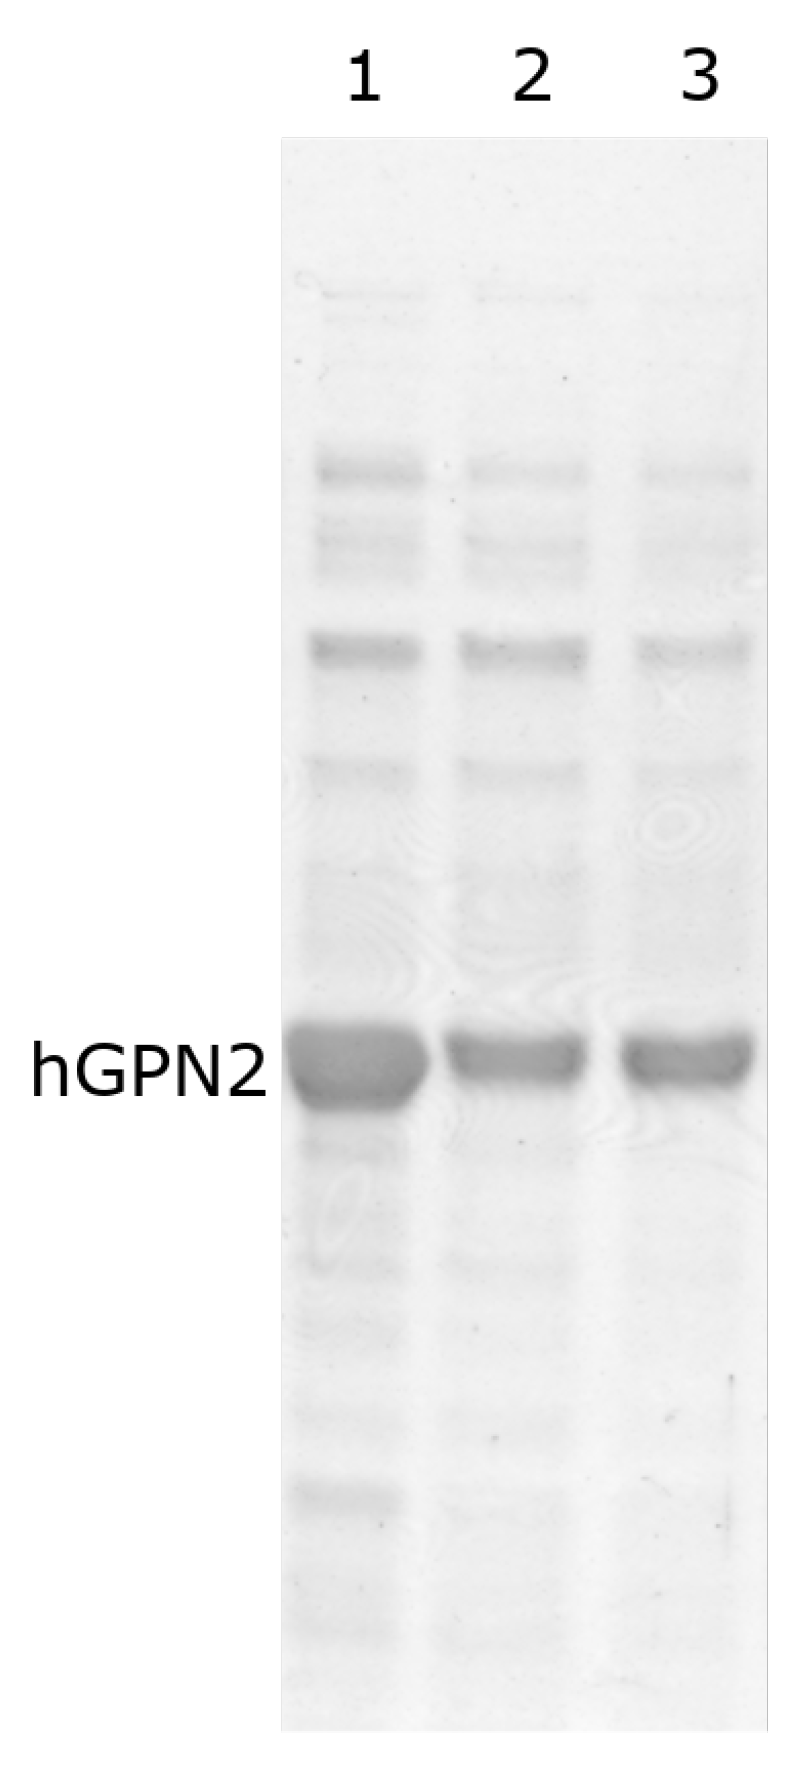
3.7. Protein Purification of Recombinant Protein with DTT

When performing protein purification of recombinant protein with DTT using the MG10C sample to purify the recombinant hGPN2 protein using 100 mM Tris-HCl and 100 mM NaCl buffer, it was found that the contaminants decreased as the DTT concentration increased (Figure 6A, lanes 1–4). When using values less than or equal to 60 µM (Figure 6 lane 4), unwanted proteins were noticed at the top and bottom of the band corresponding to hGPN2, and these decreased in concentration as the amount of DTT used increased. For values of 80 µM and 100 µM (Figure 6B, lanes 1 and 2, respectively) the contaminants were significantly reduced. With 100 µM of DTT added to the buffer (Figure 6B, lane 2) a concentration of 2 mg of hGPN2 protein was obtained in pure form as measured by Bradford analysis.

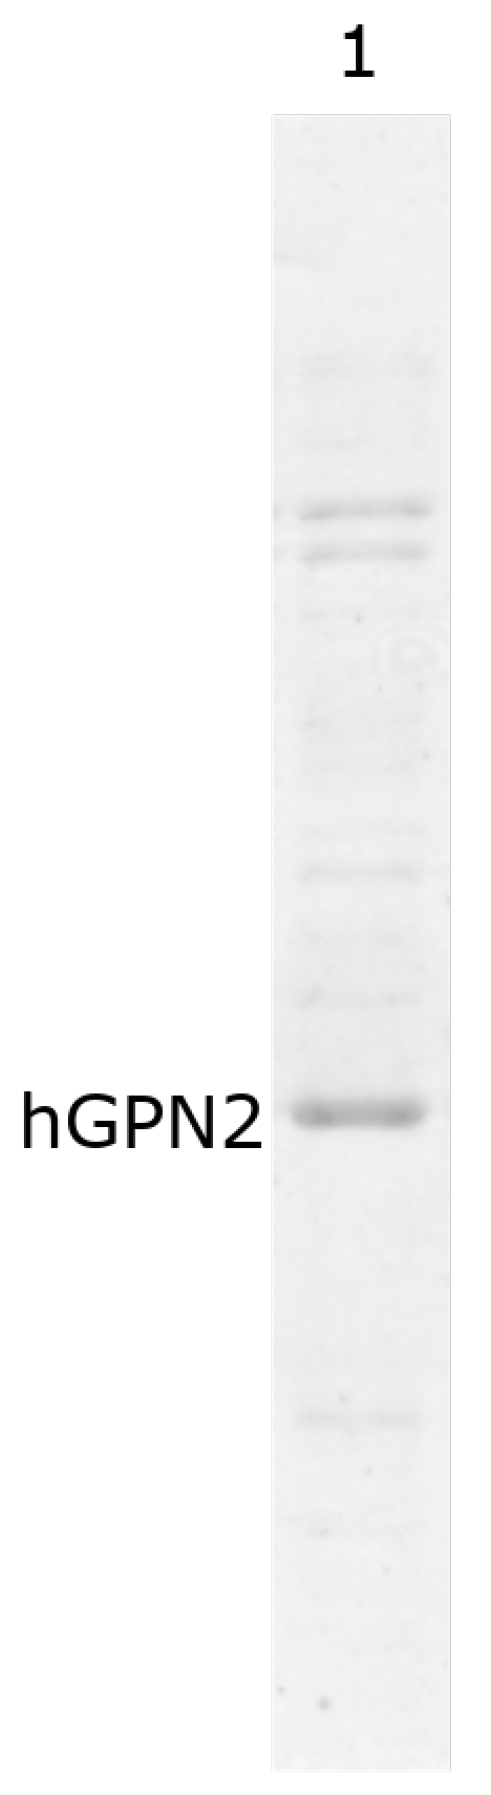
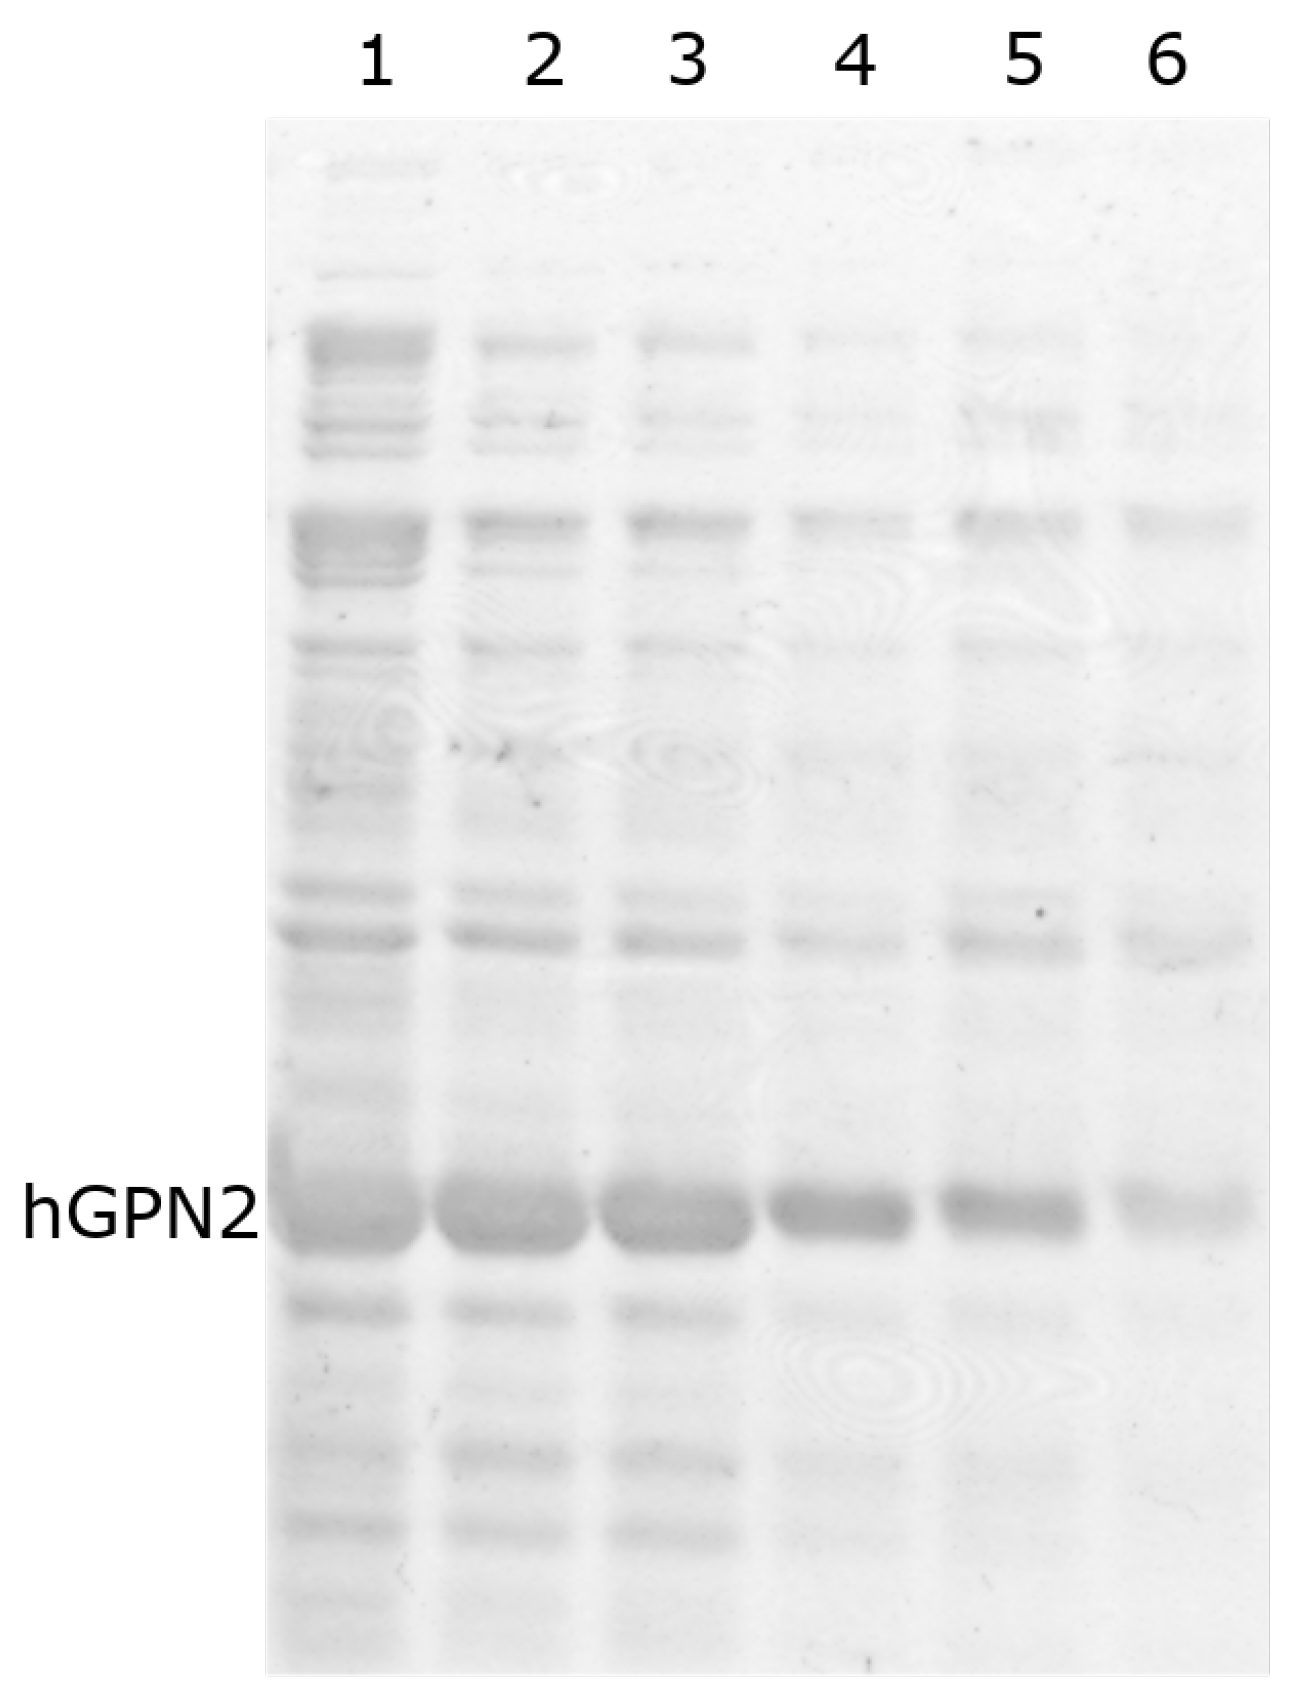
3.8. Purification with Amino Acids

The study evaluating the ten proposed buffers was carried out with the MG10C sample. The buffer containing 100 mM Tris-HCl and 100 mM NaCl at pH 8.2 with different concentrations of sodium glutamate showed a decrease in impurities as the concentration of sodium glutamate increased (Figure 7, lanes 1–5). However, the amount of recombinant hGPN2 protein decreased as well, as can be seen by the reduction in the size of the band corresponding to the protein. After reaching 100 mM sodium glutamate (Figure 7, lane 3) and exceeding this concentration, a reduction in the band corresponding to the protein of interest could be observed, while the impurities no longer showed any decrease, maintaining the same contaminants at concentrations of 100, 200, and 300 mM of the salt (Figure 7, lanes 3–5).
When sodium glutamate was replaced by the amino acid arginine at 50 mM (Figure 7, lane 6), the same effect on the decrease in impurities was achieved as with glutamate at 100 mM. However, the hGPN2 protein again suffered a reduction in band size, implying a decrease in the amount of protein within the sample analyzed with this buffer.
Subsequently, the same buffer was used and sodium glutamate was replaced by the amino acid lysine at concentrations of 50, 100, and 200 mM (Figure 8, lanes 1–3). By increasing the concentration of the amino acid, a reduction in the contaminants located in the lower part of the hGPN2 protein was observed, i.e., the impurities with a molecular weight lower than that of the protein of interest were reduced. However, the expressed recombinant protein suffered a reduction in the size of its band as well. When the concentration used was higher than 100 mM lysine (Figure 8, lane 2), the results obtained in terms if the elimination of impurities were not improved, as the same concentrations were maintained with both 200 mM and 100 mM of the amino acid (Figure 8, lanes 2–3).
Based on the previous results, a new buffer was prepared with 100 mM Tris-HCl, 100 mM NaCl, 100 mM Sodium Glutamate, and 100 mM Lysine and maintained at a pH of 8.2, achieving a significant reduction in the contaminants present at the time of protein purification using the MG10C sample (Figure 9, lane 1). The lower molecular weight proteins present were almost completely eliminated. The proteins with higher molecular weight, although reduced, presented two bands that could not be reduced completely (Figure 9).

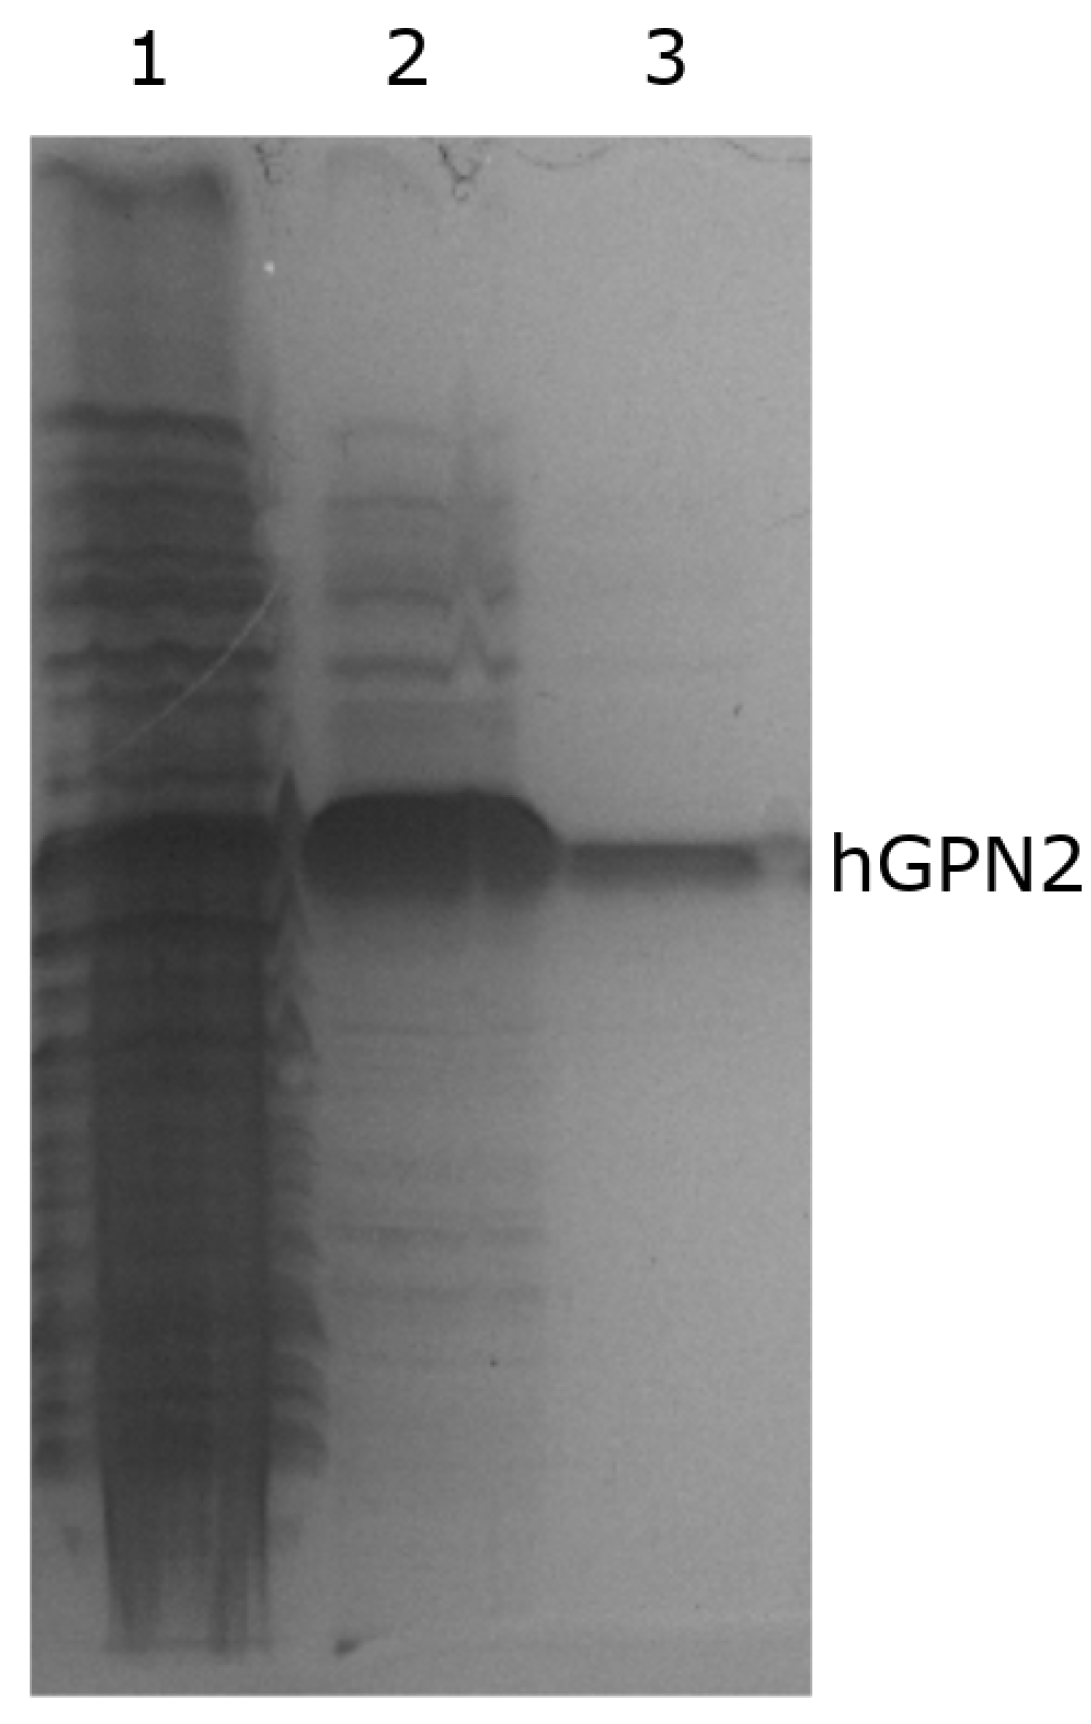
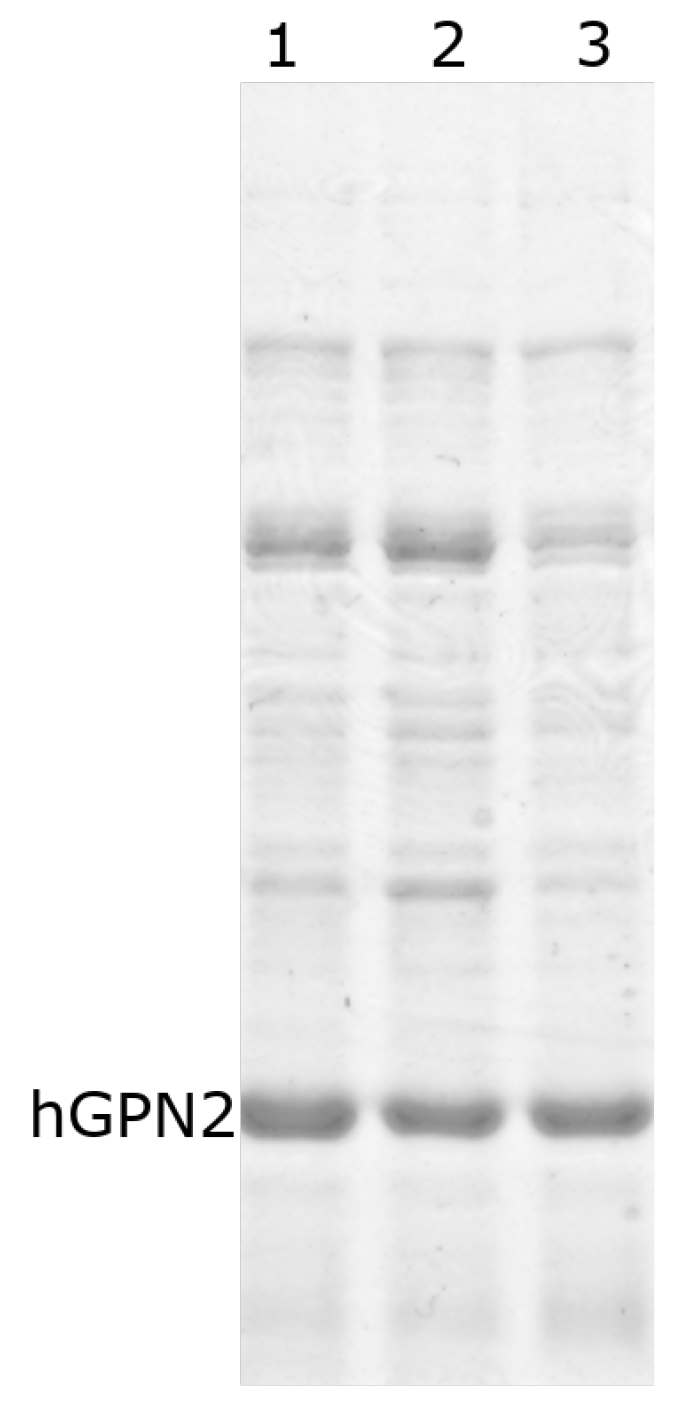
3.9. Purification with Final Buffer

Purification of hGPN2 protein was performed using the MG10C sample with the final buffer consisting of 100 mM Tris-HCl, 5% glycerol, 0.2% Triton X-100, 100 mM NaCl, 400 µM EDTA, and 100 µM DTT at pH 8.2. The obtained results are shown in Figure 10. This set of additives completely eliminated the contaminants; the eliminated impurities are shown in Figure 10, lane 1. As there were no more bands in the lower or upper part of the hGPN2 protein, it was ultrafiltrated using a 0.5 mL Amicon® Ultra following the manufacturer’s instructions. As trace amounts of contaminants were remained (Figure 10, lane 2), the sample was returned to the IMAC column to be rotated for 20 min, the column was washed, and the protein was recovered after passing it through the desalting column, obtaining a concentration of 30 mg of completely pure hGPN2 protein as measured by Bradford analysis (Figure 10, lane 3).

3.10. Quantification of the hGPN2 Protein

Quantifications to determine protein concentrations were performed using a Bradford Protein Assay kit from Bio-Rad according to the manufacturer’s specifications. This methodology reported that the maximum concentration of purified hGPN2 protein obtained using the final buffer was 30 mg of protein (Figure 10, lane 3).

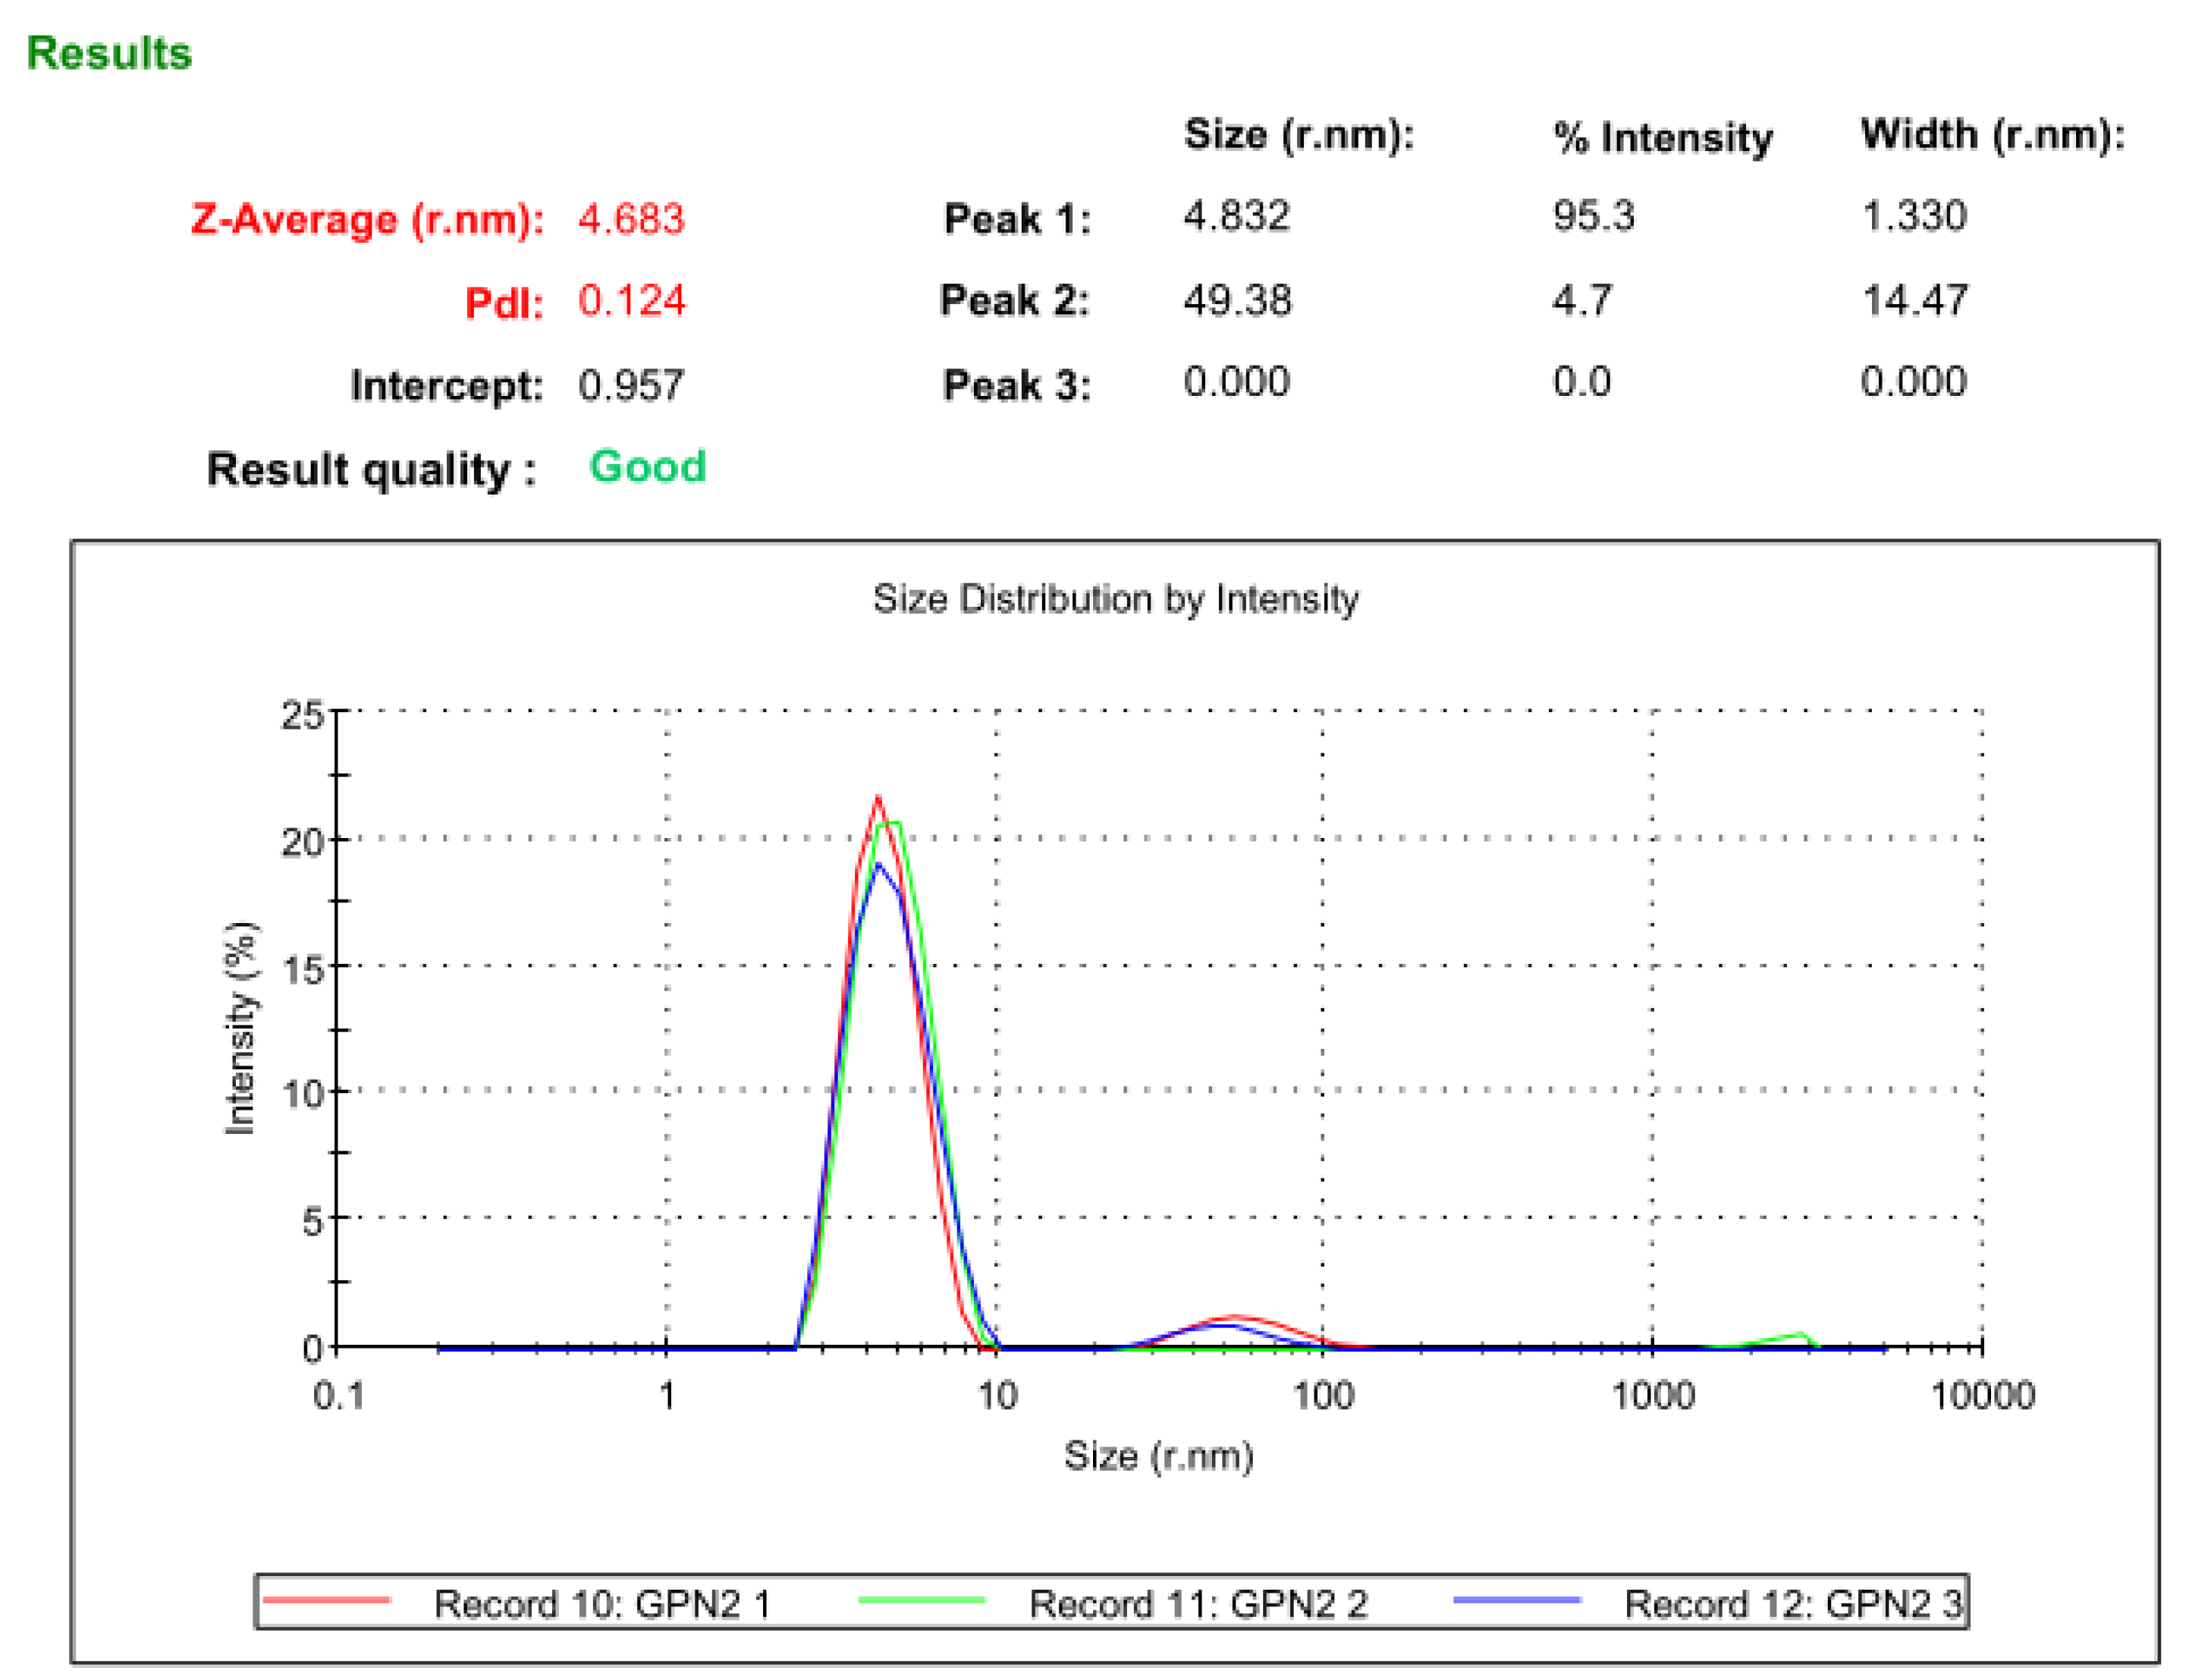
3.11. Dynamic Light Scattering Analysis

The completely pure hGPN2 protein at a concentration of 30 mg was analyzed with Malvern Nano S Dynamic Light Scattering equipment in order to determine the hydrodynamic size of the protein and polydispersity of the protein population as well as to monitor the aggregation phenomenon of the hGPN2 protein. The dynamic scattering study showed that the protein of interest has a diameter of 9.366 nm and a hydrodynamic radius of 4.683 nm, indicating that the protein is not completely globular and that certain regions are outside the hydrodynamic radius. The polydispersion achieved following the methodology proposed in this article provided a value of 0.124, indicating that the hGPN2 protein is monodisperse, homogeneous, and can be used for crystallography or structural genomics studies (see Figure 11).

4. Discussion

A methodology was developed to adapt the buffer to achieve the purification of the recombinant protein hGPN2 expressed in E. coli bacteria. The method used here is based on the effect of the different additives used to influence the bonds and solubility of both the contaminants and the protein itself.
The first factor we analyzed was the growth temperature required to obtain the protein of interest in a soluble form. Our results indicate that in order to obtain hGPN2 in the soluble fraction, it is necessary to grow it at 10 °C after induction with IPTG.
The second point we considered was the solubility of the protein of interest in the initial buffer, which was based on Tris-HCl at a concentration of 100 mM maintained at a pH of 8.2. Protein purification of recombinant protein was performed using NaCl to increase the solubility of the whole cell extract, indicating that the highest amount of protein in its soluble form was obtained at a concentration of 100 mM NaCl.
Having determined the value of the salt concentration that provides the highest soluble fraction, variations were made in the same Tris-HCl buffer in order to identify its effect on the elimination of contaminants. We determined that no decrease of impurities was achieved with 100 mM Tris-HCl, and in consequence the buffer for the subsequent experiments used 100 mM Tris-HCl and 100 mM NaCl, as this was the concentration that resulted in the lowest amount of contaminants and the highest amount of hGPN2.
Subsequently, protein purification was performed with EDTA to reduce oxidative damage and inhibit metalloproteases in order to prevent them from denaturing the protein. Its effect on the elimination of impurities was observed and the results showed that using 400 µM EDTA reduced the thickness certain protein bands that were considered contaminants while maintaining the same concentration of hGPN2. The concentrations used were reduced, as in large quantities it releases nickel from the column, preventing the realization of IMAC chromatography.
Protein purification using DTT was performed in order to maintain the active state of the protein and eliminate disulfide bonds corresponding to contaminant proteins bound on the protein of interest. We measured its effect on the elimination of contaminants; the values used were small in order to avoid denaturation of the hGPN2. Our results indicate that the use of 100 µM favored the elimination of contaminants, and that the hGPN2 protein could be obtained in a pure form at a concentration of 2 mg of protein.
We sought to determine the effect that different amino acids have on the purification process of the recombinant protein. The use of sodium glutamate had the effect of increasing the ionic strength of the sample, stabilizing the recombinant protein, and decreasing its production within inclusion bodies. Arginine was used because of its similar properties to glutamate. However, the study performed with arginine indicated that it does not significantly reduce contaminants, instead decreasing the amount of hGPN2 within the sample and removing it. A similar effect on contaminant removal was achieved using 100 mM sodium glutamate. In order to find a replacement for arginine, the amino acid lysine was used, as it has the same charge and is less polar than arginine. By using this amino acid at a concentration of 100 mM, the amount of impurities was reduced and a greater amount of the recombinant protein was conserved compared to when using arginine.
When purification was performed using only 100 mM Tris-HCl, 100 mM NaCl, 100 mM Lysine, and 100 mM Sodium Glutamate at pH 8.2, a considerable amount of contaminants were eliminated while maintaining two protein bands that were preserved, and the protein purification step using DTT could be eliminated. This suggests that these proteins are bound by disulfide bonds on the hGPN2 protein, and can therefore be eliminated using DTT or 2-Mercaptoethanol, depending on the resin used to perform affinity chromatography with immobilized metals.
After carrying out all of the proposed protein purification methods, it was concluded that the ideal buffer to obtain hGPN2 protein in pure form and at high concentrations was composed of 100 mM Tris-HCl, 5% glycerol, Triton X-100 at 0.2%, 100 mM NaCl, 400 µM EDTA, and 100 µM DTT at pH 8.2.
Glycerol was added to promote the stability of the buffer and Triton X-100 to prevent precipitation, solubilize insoluble proteins, and release proteins present within inclusion bodies.
Native proteases are responsible for degrading any non-native proteins or proteins that are considered foreign to the bacteria, and are activated in any purification process that increases the temperature. The cell lysis method used here increases the temperature to the point of activating the proteases, degrading the recombinant protein being purified. In order to avoid this, a protease inhibitor tablet was used during each purification, and it was necessary to work in cold conditions for as short a time as possible to avoid both protease activation and denaturation of the protein. In the performed experiments, the yield was 2 mg of the purified recombinant protein when using protease inhibitor tablets; this was improved with the proposed methodology, which does not require the use of the tablets, reaching a higher protein concentration of 30 mg.
Protein purification was previously performed with a simple buffer based on 100 mM Tris-HCl and 100 mM NaCl and the results obtained by this process indicated a sample with contaminants, as verified by SDS-PAGE gel. Subsequently, study was carried out with DLS by passing the sample through the filter with a pore size of 0.02 µm; these results showed a non-pure sample with high polydispersion and with different aggregates that could not be removed with the use of the filter. On the other hand, when the proposed methodology was applied, most of the aggregates were removed and the sample was found to be pure, homogeneous, and with low polydispersion.
The DLS studies showed a second peak, which is an aggregate in minor amounts that could not be removed during the purification process; however, this does not affect the amount of final concentration obtained from the pure protein. If the protein is concentrated, the small amounts of this aggregate can be visualized by means of SDS-PAGE gel verification. We do not know whether this aggregation is reversible; however, when the protein was refrigerated at 4 °C for storage and DLS measurements were repeated three months later, the samples retained the same concentration and remained stable as a function of time.
Finally, in a previous study of structural genomics, the protein was purified in order to carry out X-ray crystallography studies and to obtain its three-dimensional structure, revealing its structure and folding. The sequence of the protein is as follows:
MAGAAPTTAFGQAVTGPPGSGKTTYCLGMSEFLRALGRRV
AVVNLDPANEGLPYECAVDVGELVGLGDVMDALRLGPNGG
LLYCMEYLEANLDWLRAKLDPLRGHYFLFDCPGQVELCTH
HGALRSIFSQMAQWDLRLTAVHLVDSHYCTDPAKFISVLC
TSLATMLHVELPHINLLSKMDLIEHYGKLAFNLDYYTEVL
DLSYLLDHLASDPFFRHYRQLNEKLVQLIEDYSLVSFIPL
NIQDKESIQRVLQAVDKANGYCFRAQEQRSLEAMMSAAMG
ADFHFSSTLGIQEKYLAPSNQSVEQEAMQL
The isoelectric point of the protein is at 4.8960, thus, we used a pH of 8.2 to ensure that it remained active, following the protocol explained in [40]. The molecular weight of the protein is 34,560.65 g/mol, or 34 KD, and it contains 310 amino acids.
The maximum amount of pure protein obtained was 30 mg, with no precipitation observed, indicating that there is a possibility of achieving even higher concentrations.
The yield is closely linked to the proposed method. Experiments were performed with different buffers where a maximum concentration of only 2 mg of pure protein was reached, and DLS analysis indicated that this pure sample was not homogeneous and maintained high polydispersity. When employing the proposed methodology, on the other hand, a high yield was achieved with high concentrations of protein in a pure and homogeneous form with little polydispersion.

5. Conclusions

Our results show that the use of the proposed buffer created for recombinant hGPN2 protein expressed in E. coli obtained the protein of interest in an entirely pure form and without the need for protease inhibitor tablets. The resulting protein was homogeneous and had low polydispersity at a concentration of 30 mg, as corroborated by dynamic dispersion analysis, and can therefore be used for crystallography or structural genomics studies.

6. Patents

A patent application has been submitted for approval with the Mexican patent office (IMPI).

Author Contributions

Conceptualization, J.J.-L. and M.d.R.G.-V.; methodology, J.J.-L. and M.d.R.G.-V.; software, J.J.-L. and R.D.-H.; validation, J.J.-L. and A.S.-S.; formal analysis, J.J.-L. and L.A.-R.; writing—original draft preparation, J.J.-L., M.d.R.G.-V., A.S.-S., R.D.-H. and L.A.-R.; writing—review and editing, J.J.-L. and L.A.-R. All authors have read and agreed to the published version of the manuscript.

Funding

This research was funded by PRODEP, grant number, ID 91914, of the program for the incorporation of new full-time professors and strengthening of academic groups https://dgesui.ses.sep.gob.mx/PTC/, accessed on 17 May 2022.

Data Availability Statement

Not applicable.

Acknowledgments

We thank Nuria Sánchez Puig of the Institute of Chemistry of the National Autonomous University of Mexico for the dynamic light scattering (DLS) studies on the hGPN2 protein, and the Benemérita Universidad Autónoma de Puebla for the use of their facilities for this project.

Conflicts of Interest

The authors declare no conflict of interest.

References

  1. Berezovsky, I.N.; Guarnera, E.; Zheng, Z. Basic units of protein structure, folding, and function. Prog. Biophys. Mol. Biol. 2017, 128, 85–99. [Google Scholar] [CrossRef] [PubMed]
  2. Kumar, R.; Feltrup, T.M.; Kukreja, R.V.; Patel, K.B.; Cai, S.; Singh, B.R. Evolutionary Features in the Structure and Function of Bacterial Toxins. Toxins 2019, 11, 15. [Google Scholar] [CrossRef] [PubMed] [Green Version]
  3. GE Healthcare. ÄKTAdesign Purification. Retrieved from Method Handbook. Available online: https://kirschner.med.harvard.edu/files/protocols/GE_AKTApurificationdesign.pdf (accessed on 26 October 2021).
  4. Ghosh, R.; Gilda, J.E.; Gomes, A.V. The necessity of and strategies for improving confidence in the accuracy of western blots. Exp. Rev. Proteom. 2014, 11, 549–560. [Google Scholar] [CrossRef] [PubMed] [Green Version]
  5. Mishra, M.; Tiwari, S.; Gomes, A.V. Protein purification and analysis: Next generation Western blotting techniques. Exp. Rev. Proteom. 2017, 11, 1037–1053. [Google Scholar] [CrossRef] [PubMed]
  6. Cui, Z.; Hwang, S.M.; Gomes, A.V. Identification of the immunoproteasome as a novel regulator of skeletal muscle differentiation. Mol. Cell. Biol. 2014, 34, 96–109. [Google Scholar] [CrossRef] [PubMed] [Green Version]
  7. Bass, J.J.; Wilkinson, D.J.; Rankin, D.; Phillips, B.E.; Szewczyk, N.J.; Smith, K.; Atherton, P.J. An overview of technical considerations for Western blotting applications to physiological research. Scand J. Med. Sci. Sport. 2017, 27, 4–25. [Google Scholar] [CrossRef] [Green Version]
  8. Janes, K.A. An analysis of critical factors for quantitative immunoblotting. Sci. Signal 2015, 8, 371. [Google Scholar] [CrossRef] [Green Version]
  9. Wu, H.; de Gannes, M.K.; Luchetti, G.; Pilsner, J.R. Rapid method for the isolation of mammalian sperm DNA. BioTechniques 2015, 58, 293–300. [Google Scholar] [CrossRef] [Green Version]
  10. Calbiochem. Detergents. Retrieved from A Guide to the Properties and Uses of Detergents in Biology and Biochemistry. Available online: http://wolfson.huji.ac.il/purification/PDF/detergents/CALBIOCHEM-DetergentsIV.pdf (accessed on 26 October 2021).
  11. Taylor, S.C.; Posch, A. The design of a quantitative western blot experiment. Biomed Res. Int. 2014, 2014, 361590. [Google Scholar] [CrossRef]
  12. Jancarik, J.; Pufan, R.; Hong, C.; Kim, S.H.; Kim, R. Optimum solubility (OS) screening: An efficient method to optimize buffer conditions for homogeneity and crystallization of proteins. Acta Crystallogr. D Bio. Crystallogr. 2004, 60, 1670–1673. [Google Scholar] [CrossRef]
  13. Gutiérrez, R.; Martin del Valle, E.; Galán, M. Immobilized Metal-Ion Affinity Chromatography: Status and Trends. Sep. Purif. Rev. 2007, 36, 71–111. [Google Scholar] [CrossRef]
  14. Ruprecht, B.; Koch, H.; Medard, G.; Mundt, M.; Kuster, B.; Lemeer, S. Comprehensive and reproducible phosphopeptide enrichment using iron immobilized metal ion affinity chromatography (Fe-IMAC) columns. Mol. Cell. Proteom. 2015, 14, 205–215. [Google Scholar] [CrossRef] [PubMed] [Green Version]
  15. Tishchenko, K.; Hodrova, B.; Simunek, J.; Bleha, M. Nickel and copper complexes of a chelatind methacrylate sorbent in the purification of chitinases and specific immunoglobulin G1 by immobilized metal ion affinity chromatography. J. Chromatogr. A. 2003, 983, 125–132. [Google Scholar] [CrossRef]
  16. Rosano, G.L.; Ceccarelli, E.A. Recombinant protein expression in E. coli: Advances and challenges. Front. Microbiol. 2014, 5, 172. [Google Scholar] [CrossRef] [PubMed] [Green Version]
  17. Singh, S.M.; Panda, A.K. Solubilization and refolding of bacterial inclusion body proteins. J. Biosci. Bioeng. 2005, 99, 303–310. [Google Scholar] [CrossRef] [Green Version]
  18. Tsumoto, K.; Ejima, D.; Kumagai, I.; Arakawa, T. Practical considerations in refolding proteins from inclusion bodies. Protein Expres. Purif. 2003, 28, 1–8. [Google Scholar] [CrossRef]
  19. Gräslund, S.; Nordlund, P.; Weigelt, J.; Hallberg, B.M.; Bray, J.; Gileadi, O. Protein production and purification. Nat. Methods 2008, 5, 135–146. [Google Scholar]
  20. Garber-Porekar, V.; Menart, V. Perspectives of immobilized-metal affinity chromatography. J. Biochem. Biophys. 2001, 49, 335–360. [Google Scholar] [CrossRef]
  21. Cramer, P.; Armache, K.J.; Baumli, S.; Benkert, S.; Brueckner, F.; Buchen, C.; Vannini, A. Structure of eukaryotic RNA polymerases. Annu. Rev. Biophys. 2008, 37, 337–352. [Google Scholar] [CrossRef] [Green Version]
  22. Niesser, J.; Wagner, F.R.; Kostrewa, D.; Muhlbacher, W.; Cramer, P. Structure of GPN-Loop GTPase Npa3 and implications for RNA polymerase II assembly. Mol. Cell. Biol. 2015, 49, 820–831. [Google Scholar] [CrossRef] [Green Version]
  23. Baugh, E.H.; Lyskov, S.; Weitzner, B.D.; Gray, J.J. Real-Time PyMOL Visualization for Rosetta and PyRosetta. PLoS ONE 2011, 6, e21931. [Google Scholar] [CrossRef] [PubMed] [Green Version]
  24. Sacket, O. Rapid purification of tubulin from tissue and tissue culture cells using solid-phase ion exchange. Anal. Biochem. 1995, 228, 343–348. [Google Scholar] [CrossRef]
  25. Arakawa, T.; Timasheff, S.N. The mechanism of action of Na glutamate, lysine HCl, and piperazine-N, N’-bis (2-ethanesulfonic acid) in the stabilization of tubulin and microtubule formation. J. Biol. Chem. 1984, 259, 4979–4986. [Google Scholar] [CrossRef]
  26. Golovanov, A.P.; Hautbergue, G.M.; Wilson, S.A.; Lian, L.Y. A simple method for improving protein solubility and Long-Term Stability. J. Am. Chem. Soc. 2004, 126, 8933–8939. [Google Scholar] [CrossRef] [PubMed]
  27. Blobel, J.; Brath, U.; Bernadó, P.; Diehl, C.; Ballester, L.; Sornosa, A.; Pons, M. Protein loop compaction and the origin of the effect of arginine and glutamic acid mixtures on solubility, stability and transient oligomerization of proteins. Eur. Biophys. J. 2011, 40, 1327–1338. [Google Scholar] [CrossRef] [Green Version]
  28. Shukla, D.; Trout, B. Understanding the synergistic effect of arginine and glutamic acid mixtures on protein solubility. J. Phys. Chem. B. 2011, 115, 11831–11839. [Google Scholar] [CrossRef]
  29. Abe, R.; Kudou, M.; Tanaka, Y.; Arakawa, T.; Tsumoto, K. Immobilized metal affinity chromatography in the presence of arginine. Biochem. Biophys. Res. Commun. 2009, 381, 306–310. [Google Scholar] [CrossRef]
  30. Braga, V. Signaling by small GTPases at Cell-Cell Junctions: Protein interactions building control and networks. Cold Spring Harb. Perspect. Biol. 2018, 10, a028746. [Google Scholar] [CrossRef] [Green Version]
  31. Feiguelman, G.; Fu, Y.; Yalovsky, S. ROP GTPases structure-function and signaling pathways. Plant Physiolpogy 2018, 176, 57–79. [Google Scholar] [CrossRef]
  32. Song, S.; Cong, W.; Zhou, S.; Shi, Y.; Dai, W.; Zhang, H.; Wang, X.; He, B.; Zhang, Q. Small GTPases: Structure, biologica function, and its interactions with nanoparticles. Asian J. Pharm. Sci. 2019, 14, 30–39. [Google Scholar] [CrossRef]
  33. Wang, X.; Wang, J.; Chen, F.; Zhong, Z.; Qi, L. Detection of K-ras gene mutations in feces by magnetic nanoprobe in patients with pancreatic cancer: A preliminary study. Exp. Ther. Med. 2018, 15, 527–531. [Google Scholar] [CrossRef] [PubMed]
  34. Lara-Chacón, B.; Guerrero-Rodríguez, S.L.; Ramírez-Hernández, K.J.; Robledo-Rivera, A.Y.; Velasco, M.A.; Sánchez-Olea, R.; Calera, M.R. Gpn3 Is Essential for Cell Proliferation of Breast Cancer Cells Independent of Their Malignancy Degree. Technol. Cancer Res. Treat. 2019, 1–11. [Google Scholar] [CrossRef] [PubMed] [Green Version]
  35. Gras, S.; Chaumont, V.; Fernandez, B.; Carpentier, P.; Charrier-Savournin, F.; Schmitt, S.; Pineau, C.; Flament, D.; Hecker, A.; Forterre, P.; et al. Structural insights into a new homodimeric self-activated GTPase family. EMBO Rep. 2007, 8, 569–575. [Google Scholar] [CrossRef] [Green Version]
  36. Minaker, S.; Filiatrault, M.; Ben-Aroya, S.; Hieter, P.; Stirling, P. Biogenesis of RNA Polymerases II and III Requires the Conserved GPN Small GTPases in Saccharomyces cerevisiae. Genetics 2013, 193, 853–864. [Google Scholar] [CrossRef] [PubMed] [Green Version]
  37. Forget, D.; Lacombe, A.; Cloutier, P.; Al-Khoury, R.; Bouchard, A.; Lavall´ee-Adam, M.; Coulombe, B. The protein interaction network of the human transcription machinery reveals a role for the conserved GTPase RPAP4/hGPN1 and microtubule assembly in nuclear import and biogenesis of RNA polymerase II. Mol. Cell Proteom. 2010, 9, 2827–2839. [Google Scholar] [CrossRef] [PubMed] [Green Version]
  38. Boulon, S.; Pradet-Balade, B.; Verheggen, C.; Molle, D.; Boireau, S.; Georgieva, M.; Bertrand, E. HSP90 and its R2TP/Prefoldin-like cochaperone are involved in the cytoplasmic assembly of RNA polymerase II. Mol. Cell. 2010, 39, 912–924. [Google Scholar] [CrossRef] [Green Version]
  39. Zeng, F.; Hua, Y.; Liu, X.; Liu, S.; Lao, K.; Zhang, Z.; Kong, D. Gpn2 and Rba50 Directly participate in the assembly of the Rpb3 subcomplex in the biogenesis of RNA polymerase II. Mol. Cell. Biol. 2018, 38, e00091-18. [Google Scholar] [CrossRef] [Green Version]
  40. González-González, R.; Guerra-Moreno, J.A.; Cristóbal-Mondragón, G.R.; Romero, V.; Peña-Gómez, S.G.; Montero-Morán, G.M.; Lara-González, S.; Hernández-Arana, A.; Fernández-Velasco, D.A.; Calera, M.R.; et al. Human Gpn1 purified from bacteria binds guanine nucleotides and hydrolyzes GTP as a protein dimer stabilized by its C-terminal tail. Protein Expr. Purif. 2017, 132, 85–96. [Google Scholar] [CrossRef]
Figure 1. Flow chart of the procedure used to obtain the final sample. Source: Authors’ elaboration.
Separations 09 00164 g001
Figure 2. SDS-PAGE analysis of the recombinant protein: Lane 1, protein molecular weight marker; Lane 2, recombinant hGPN2 protein expressed in E. coli; Lane 3, total protein extract of E. coli without expression of hGPN2 protein.
Separations 09 00164 g002
Figure 3. hGPN2 protein expression assay. (A) Lane 1, pellet; lane 2, supernatant without hGPN2 expressed, growth at 16 degrees Celsius. (B) Lane 1, pellet; lane 2 supernatant with hGPN2 expressed in the soluble fraction, growth at 10 degrees Celsius.
Separations 09 00164 g003
Figure 4. Purification of recombinant hGPN2 protein in buffers: 50 mM Tris-HCl, 100 mM NaCl (lane 1); 100 mM Tris-HCl, 100 mM NaCl (lane 2); 150 mM Tris-HCl, 100 mM NaCl (lane 3); 200 mM Tris-HCl, 100 mM NaCl (lane 4).
Separations 09 00164 g004
Figure 5. hGPN2 protein expression using 100 mM Tris-HCl buffer, 100 mM NaCl, maintaining pH at 8.2, and EDTA concentrations of 100 µM (lane 1), 200 µM (lane 2), and 400 µM (lane 3).
Separations 09 00164 g005
Figure 6. hGPN2 recombinant protein expression: (A) 10 µM (lane 1), 20 µM (lane 2), 40 µM (lane 3), 60 µM (lane 4); (B) 80 µM (lane 1), 100 µM (lane 2).
Separations 09 00164 g006
Figure 7. hGPN2 recombinant protein purification using 100 mM Tris-HCl and 100 mM NaCl buffer maintained at pH 8.2 with Sodium Glutamate at the following concentrations: 25 mM (lane 1), 50 mM (lane 2), 100 mM (lane 3), 200 mM (lane 4), and 300 mM (lane 5). For lane 6, sodium glutamate was replaced by 50 mM arginine.
Separations 09 00164 g007
Figure 8. hGPN2 protein purification using 100 mM Tris-HCl and 100 mM NaCl buffer with the addition of the amino acid lysine at the following concentrations: 50 mM (lane 1), 100 mM (lane 2), 200 mM (lane 3).
Separations 09 00164 g008
Figure 9. hGPN2 protein purification using 100 mM Tris-HCl, 100 mM NaCl, 100 mM Lysine, and 100 mM Sodium Glutamate buffer at pH 8.2.
Separations 09 00164 g009
Figure 10. Purification of recombinant hGPN2 protein: contaminating proteins (lane 1); pure protein concentrated to 500 µl (lane 2); pure protein at a concentration of 30 mg of protein (lane 3).
Separations 09 00164 g010
Figure 11. Dynamic light scattering analysis of hGPN2 protein in pure and soluble form at a concentration of 30 mg.
Separations 09 00164 g011
Table 1. Different concentrations of salts added to five buffers and the solubility obtained in each of the samples as measured by Bradford analysis.
Salt Concentration (Molar)Solubility µg/mL
00
50447
100464
500358
1000308
200018
Publisher’s Note: MDPI stays neutral with regard to jurisdictional claims in published maps and institutional affiliations.

