
Accurate Flow Regime Classification and Void Fraction Measurement in Two-Phase Flowmeters Using Frequency-Domain Feature Extraction and Neural Networks

.png)
 ,
,  and
and
Abstract
:1. Introduction
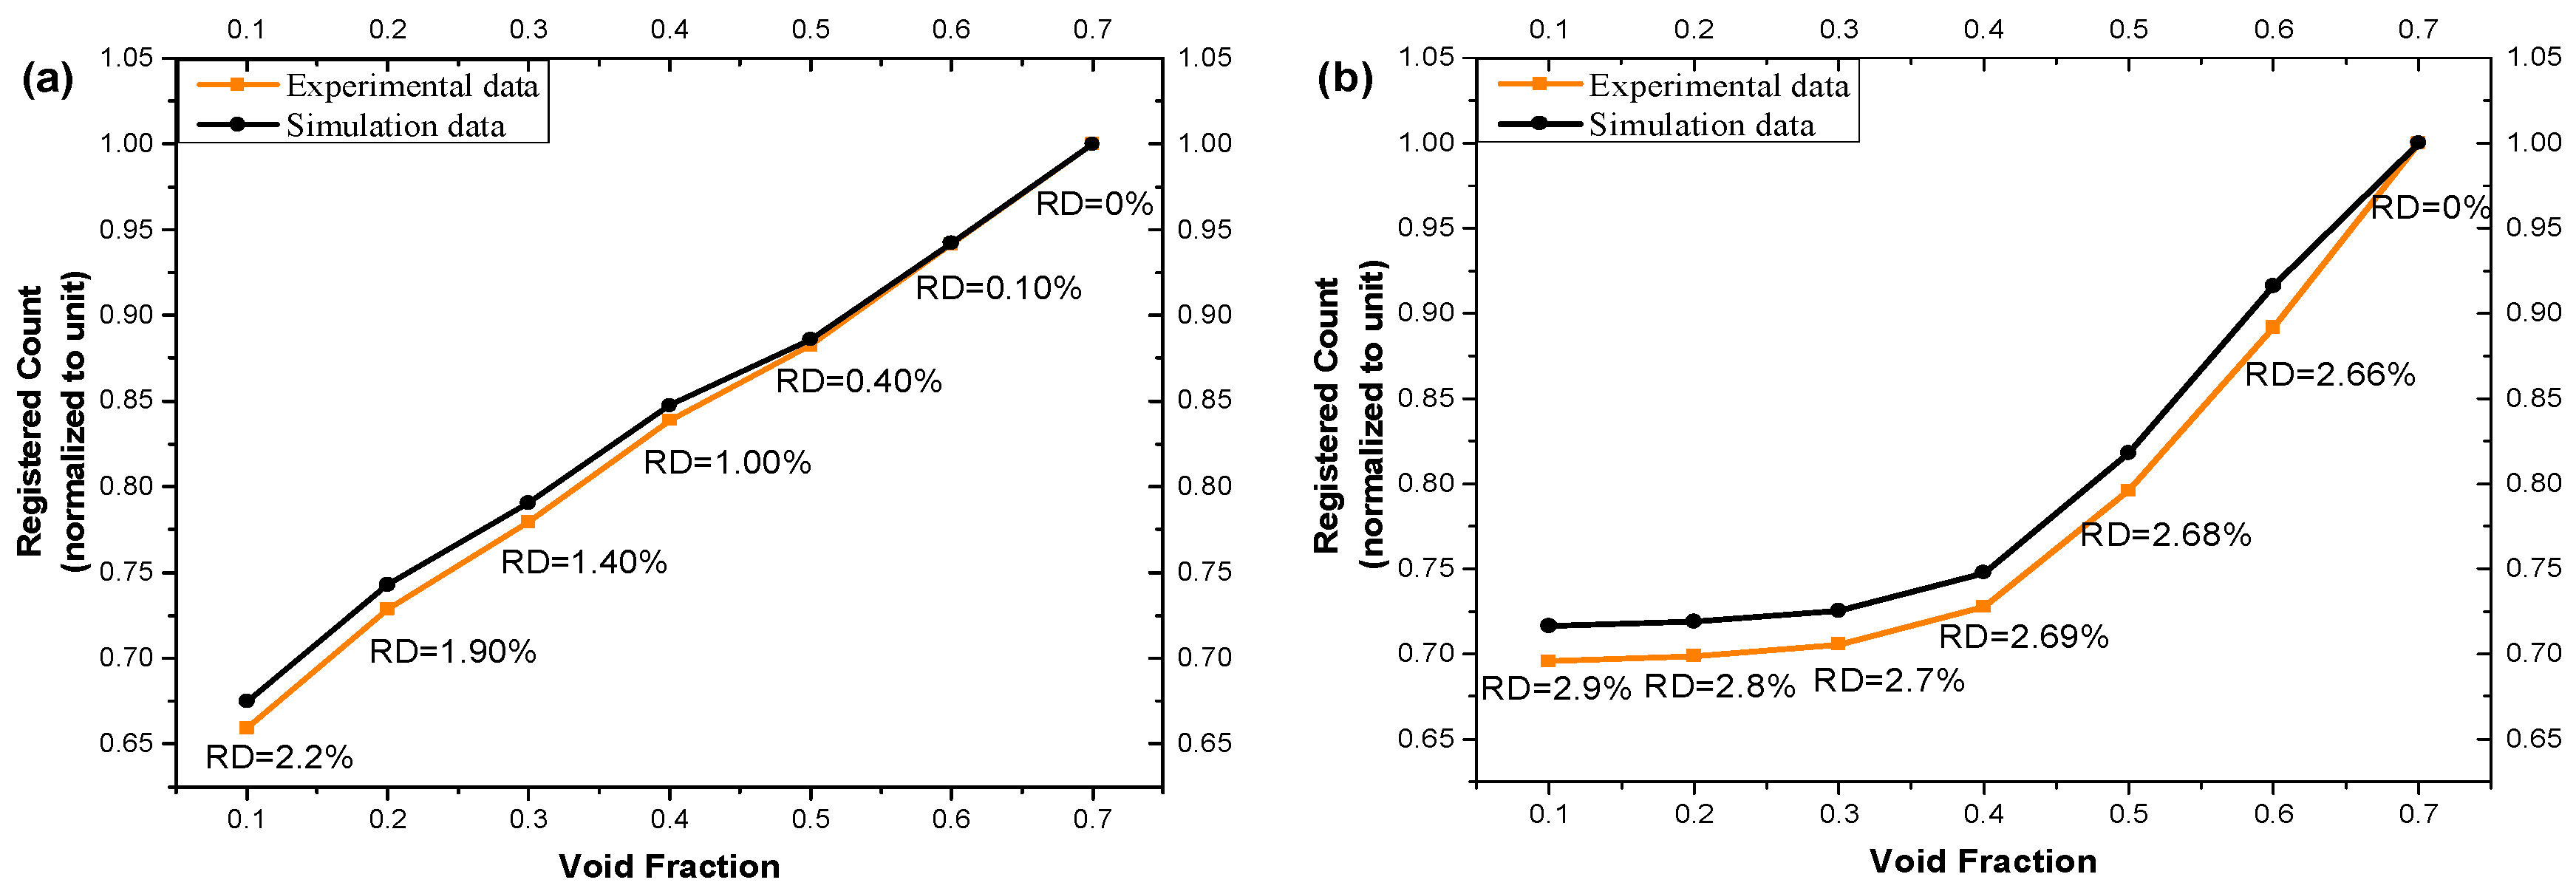
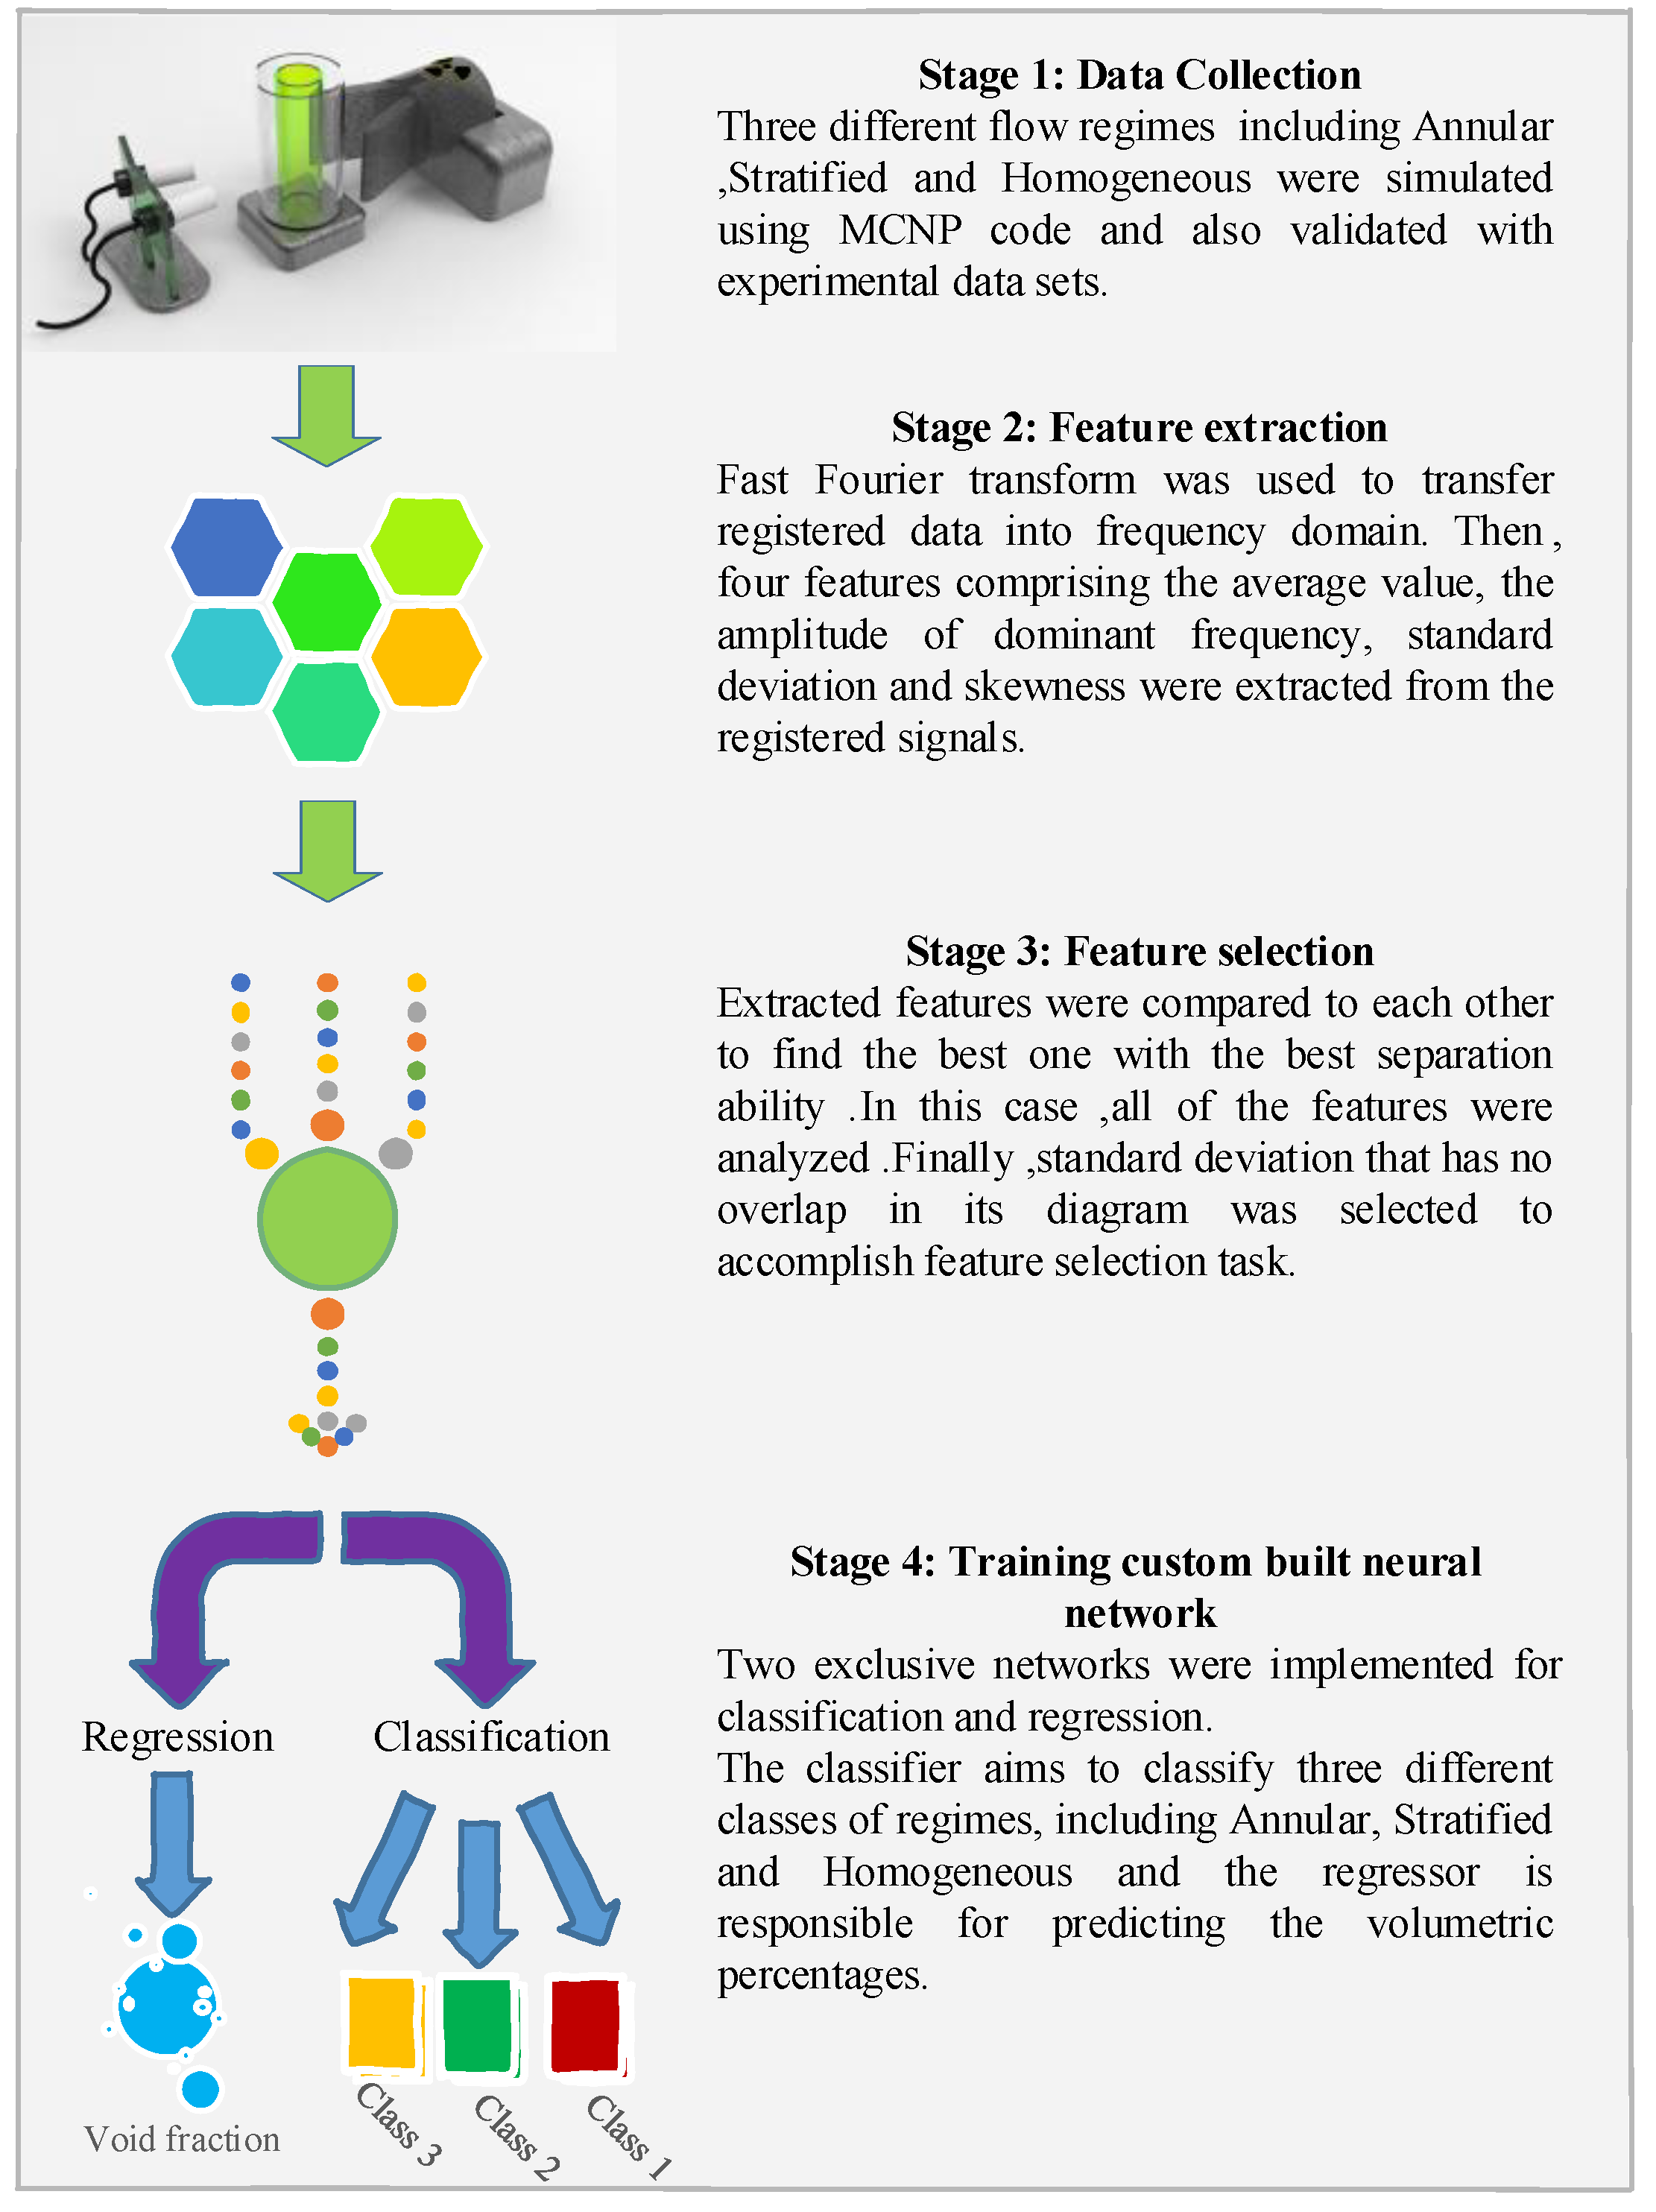
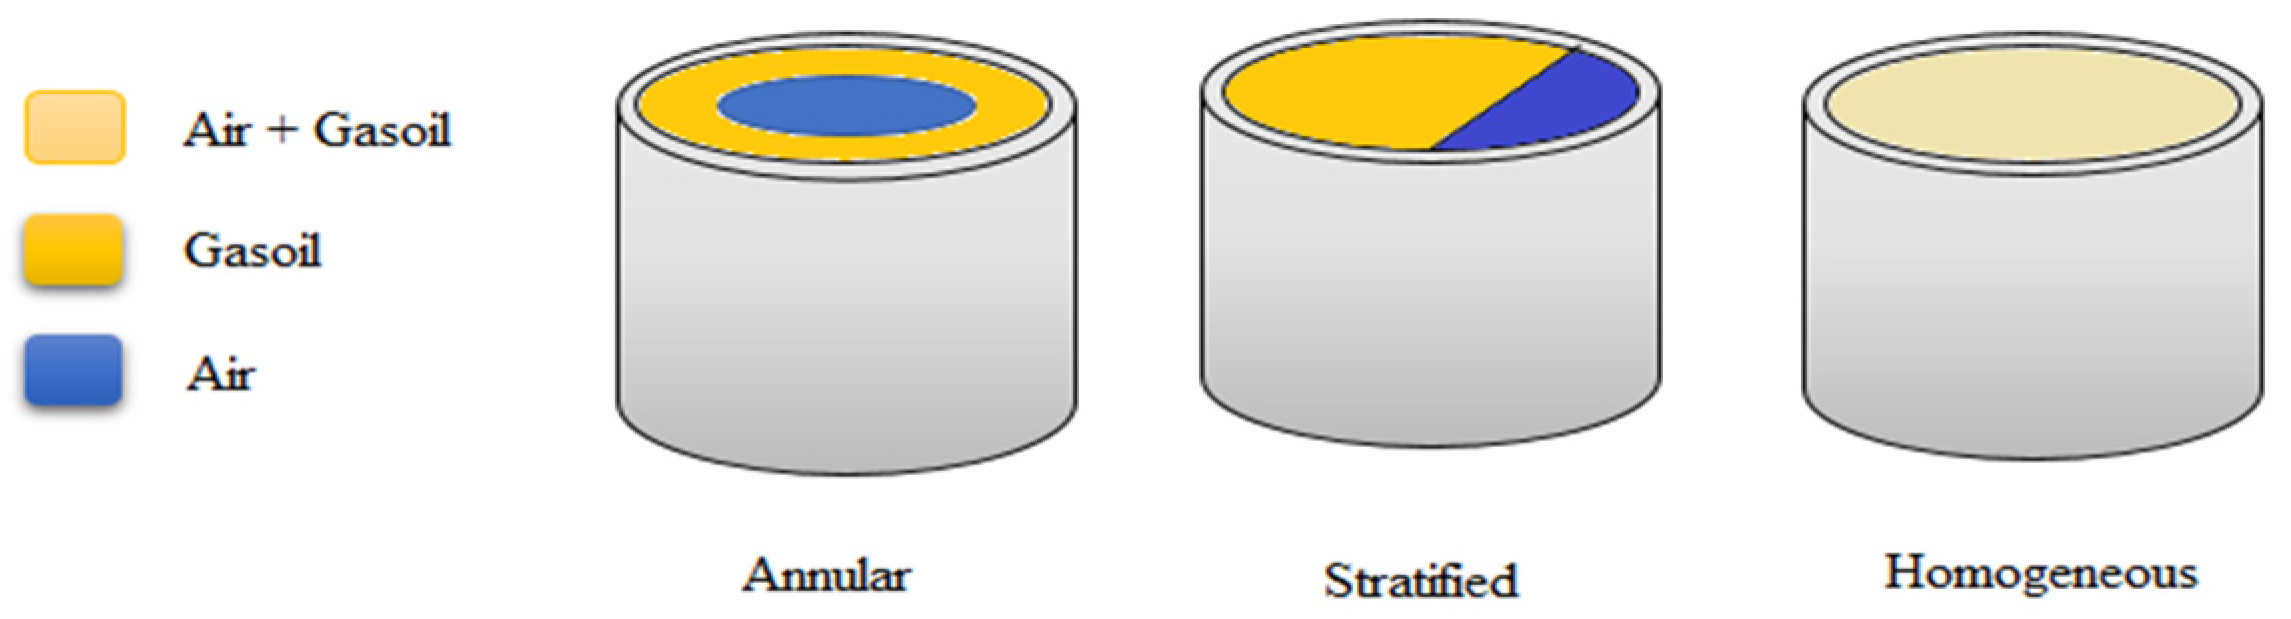
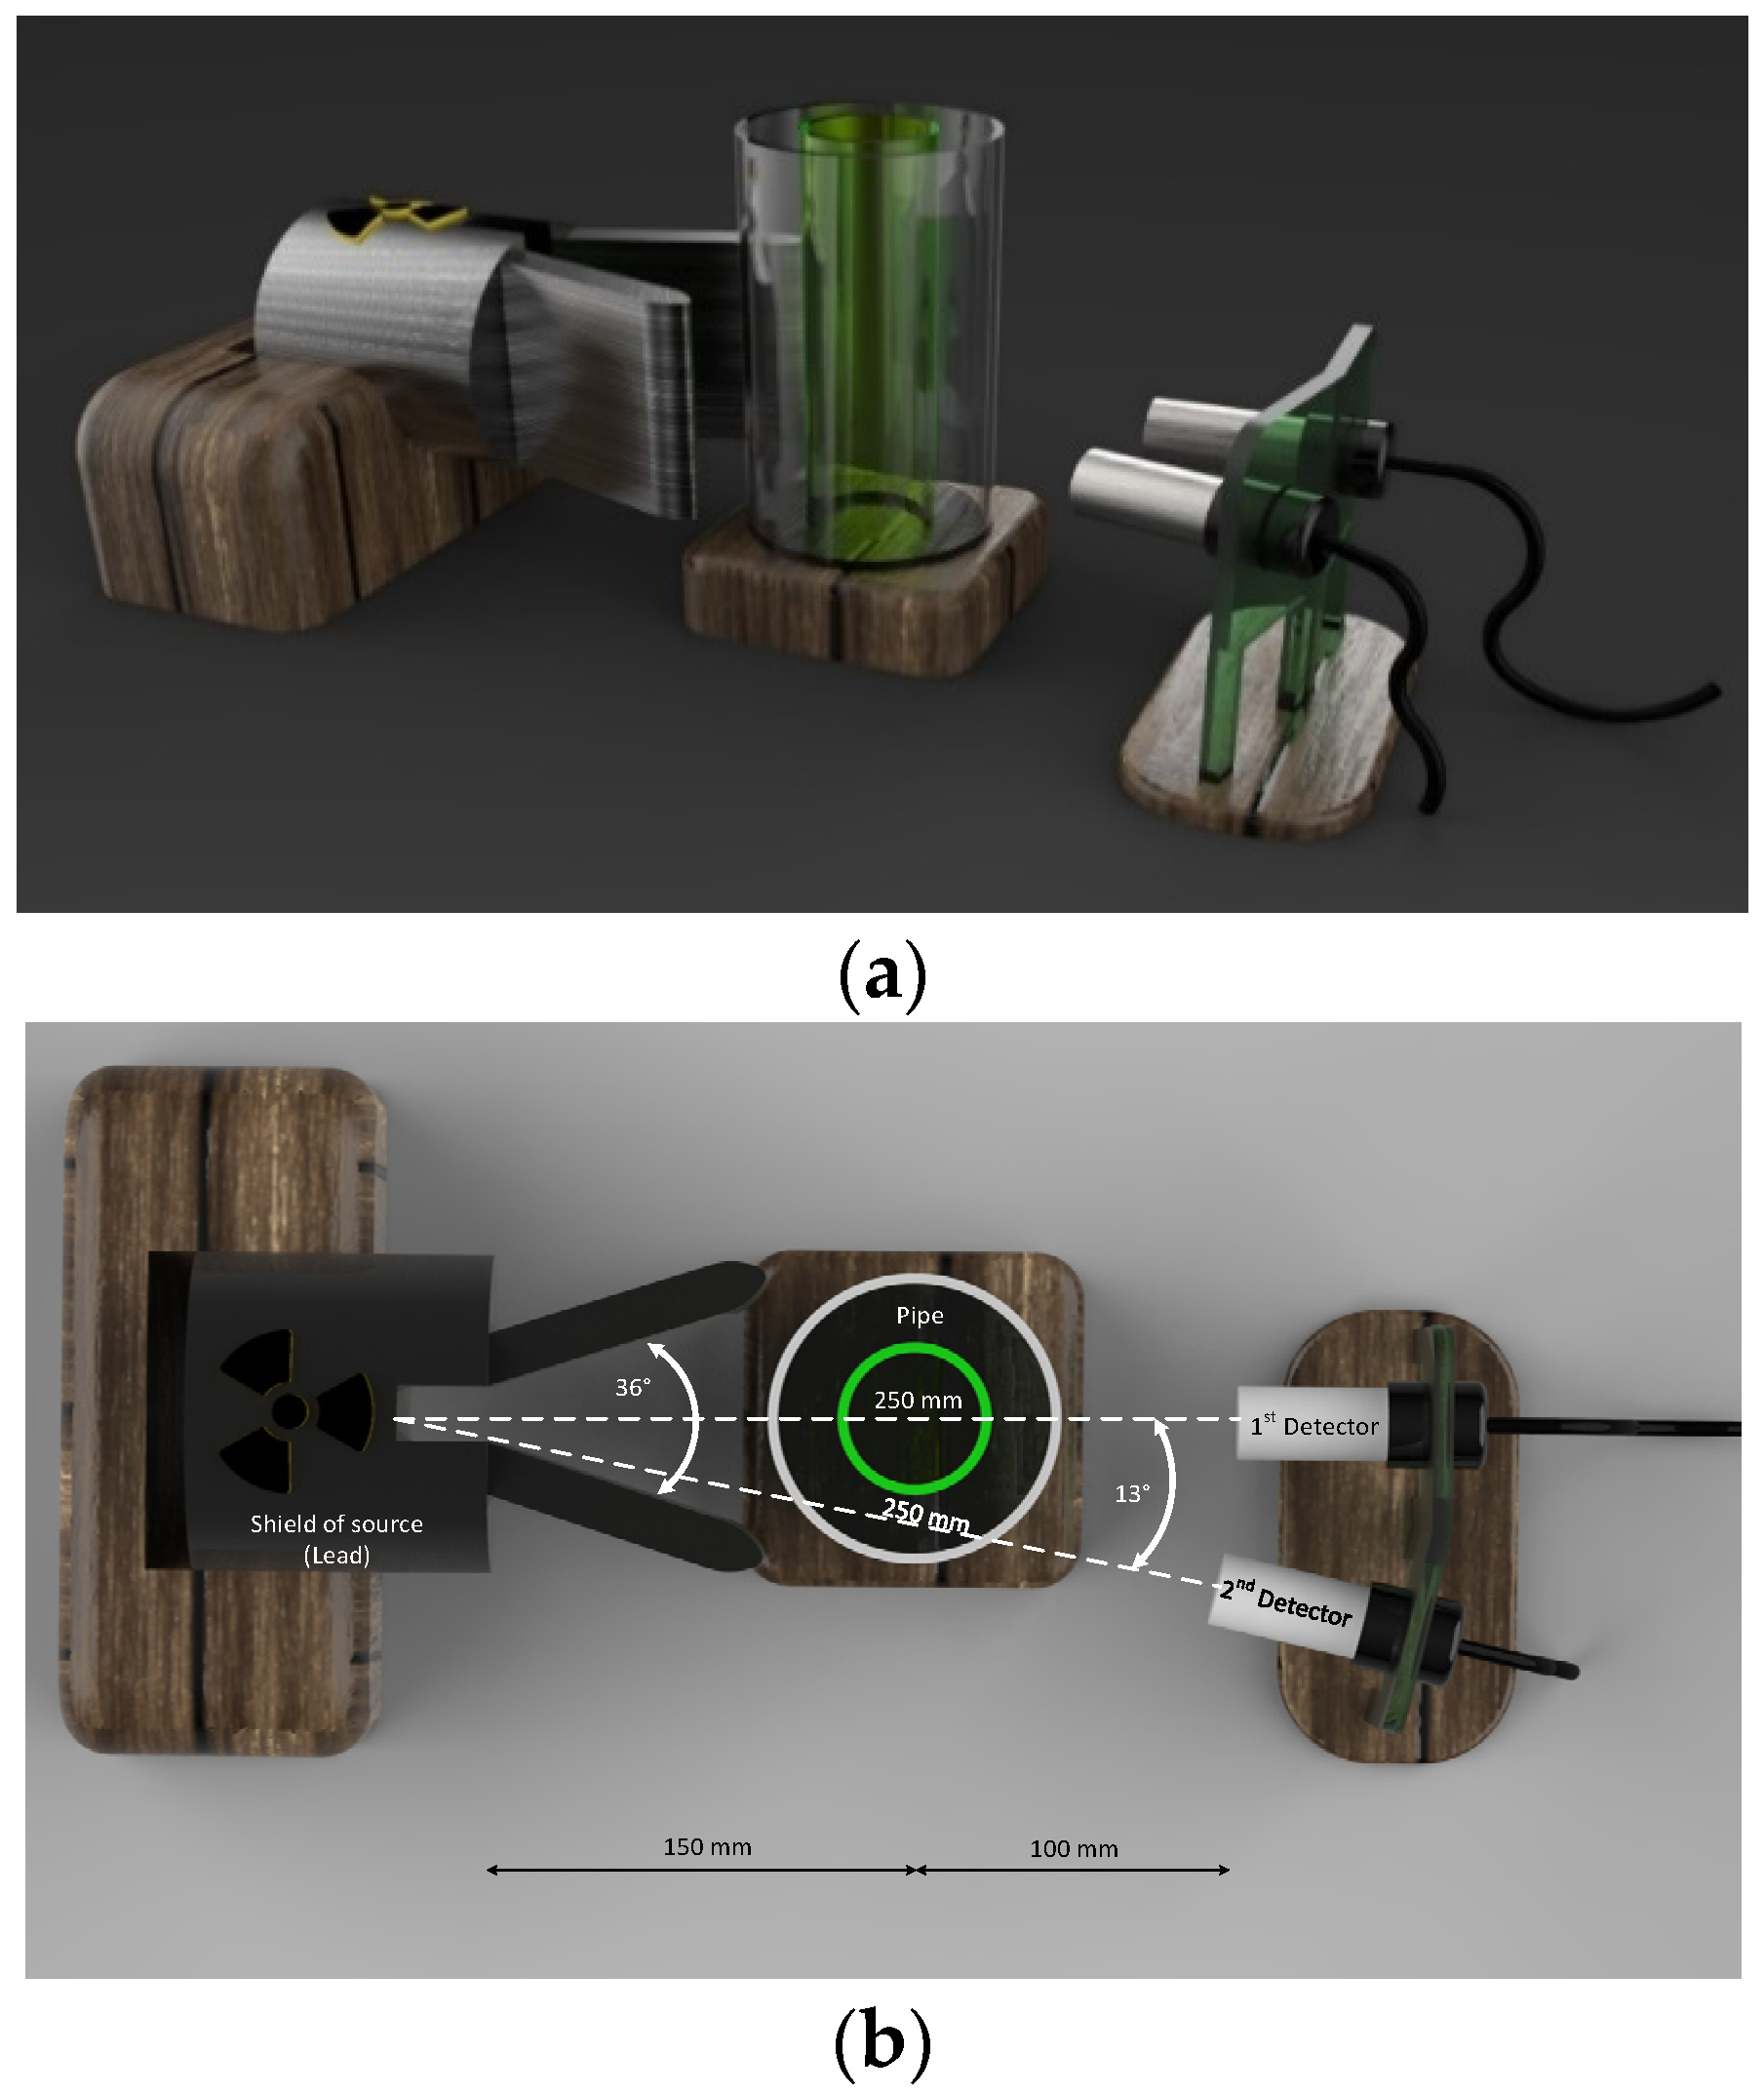
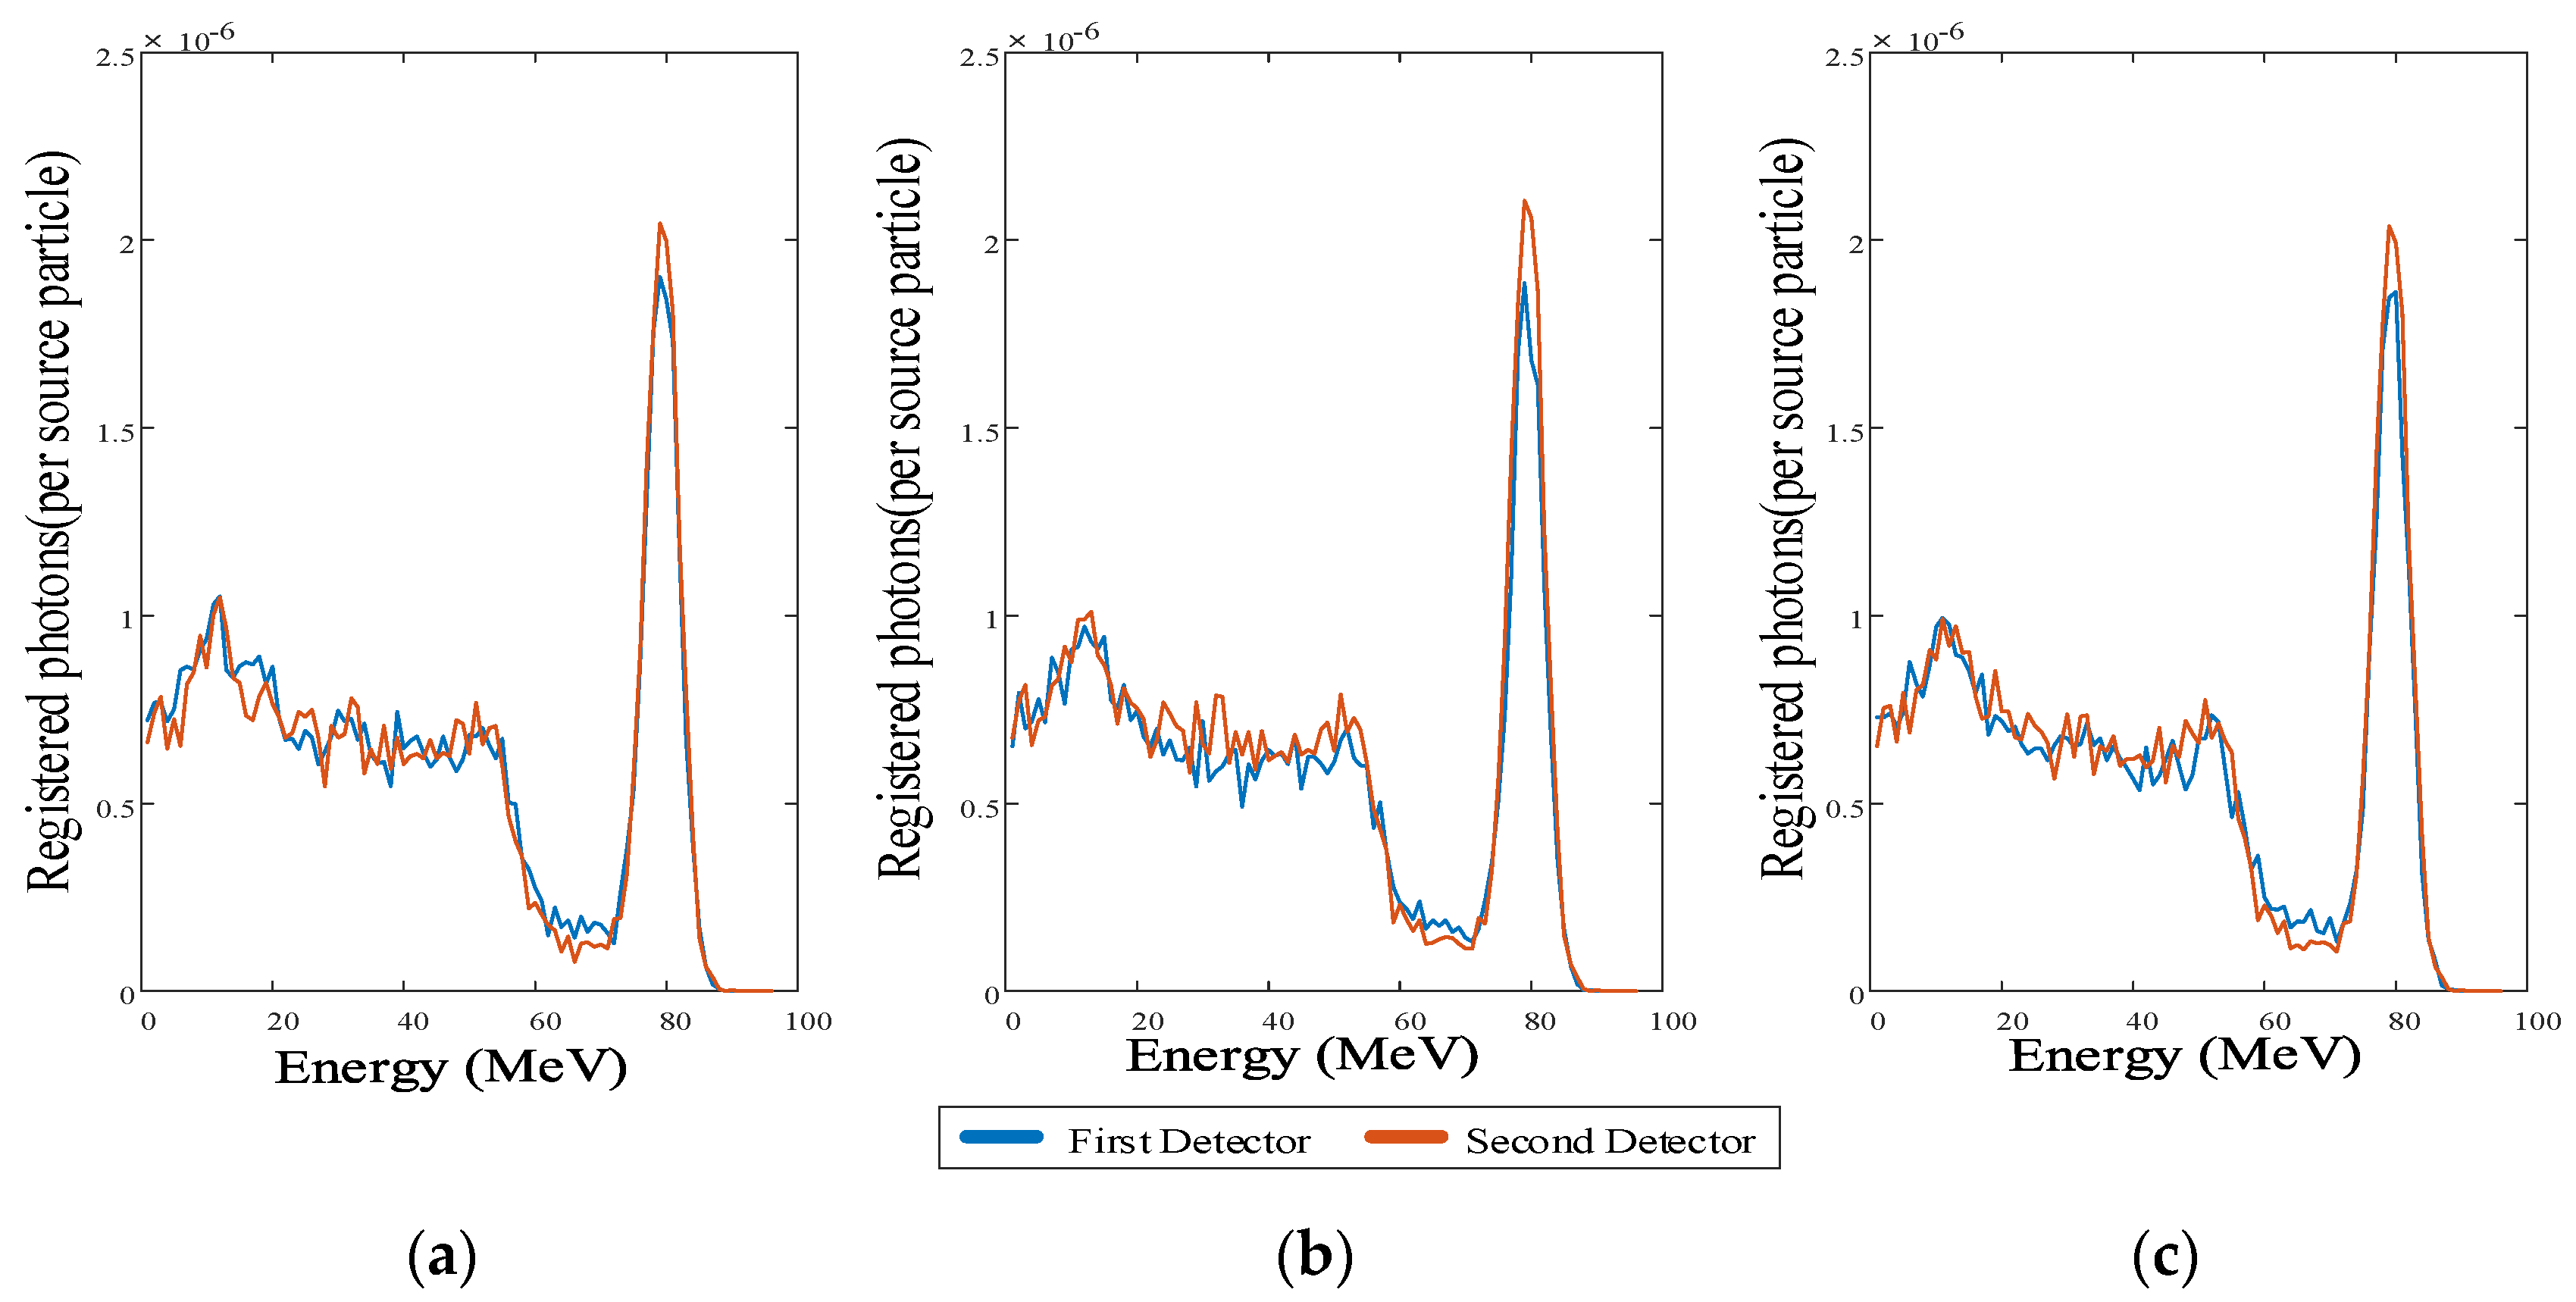
2. Simulation Procedure
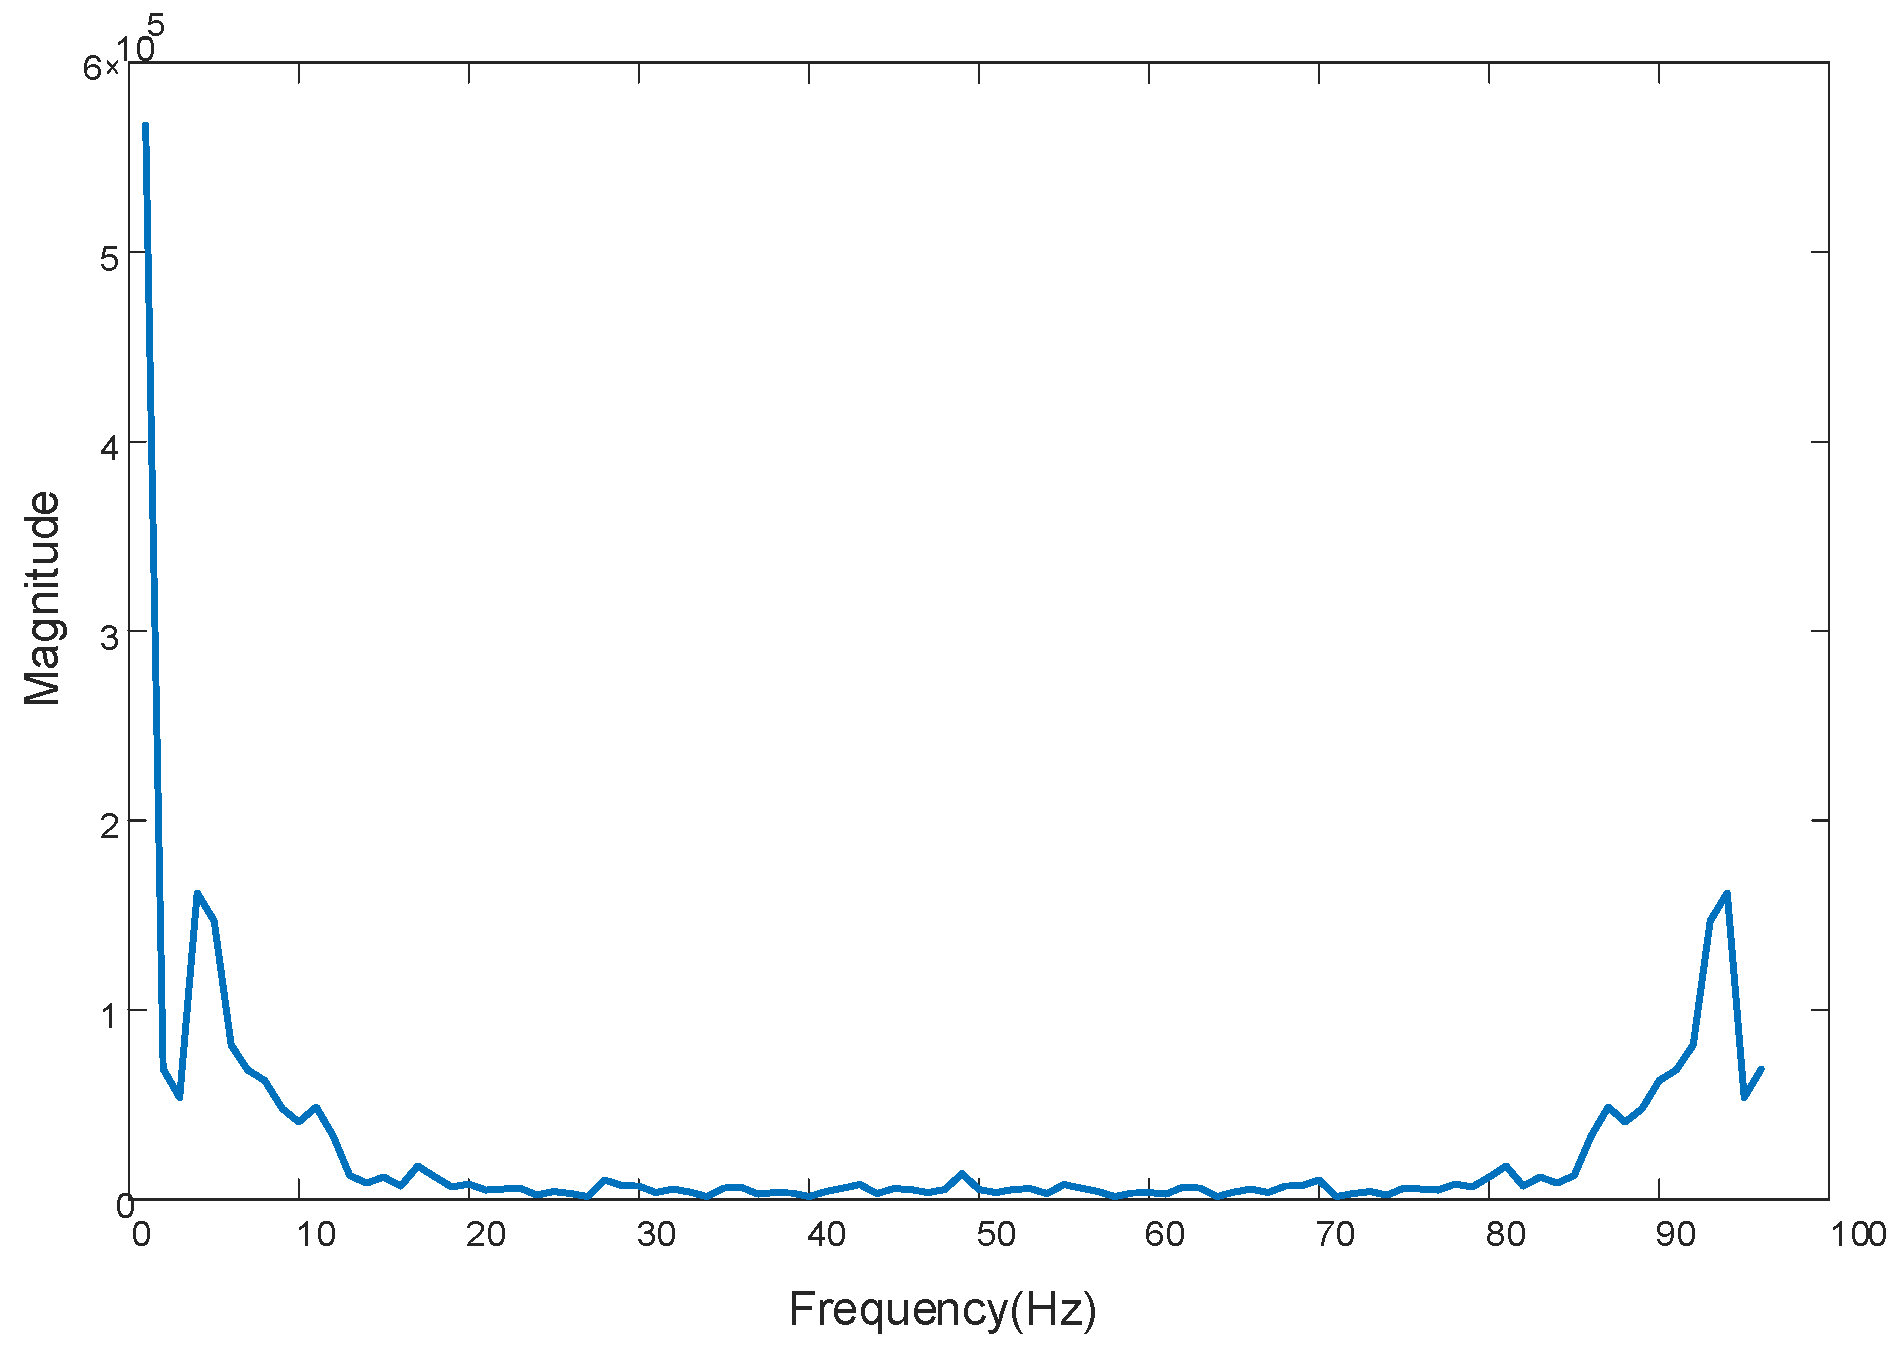
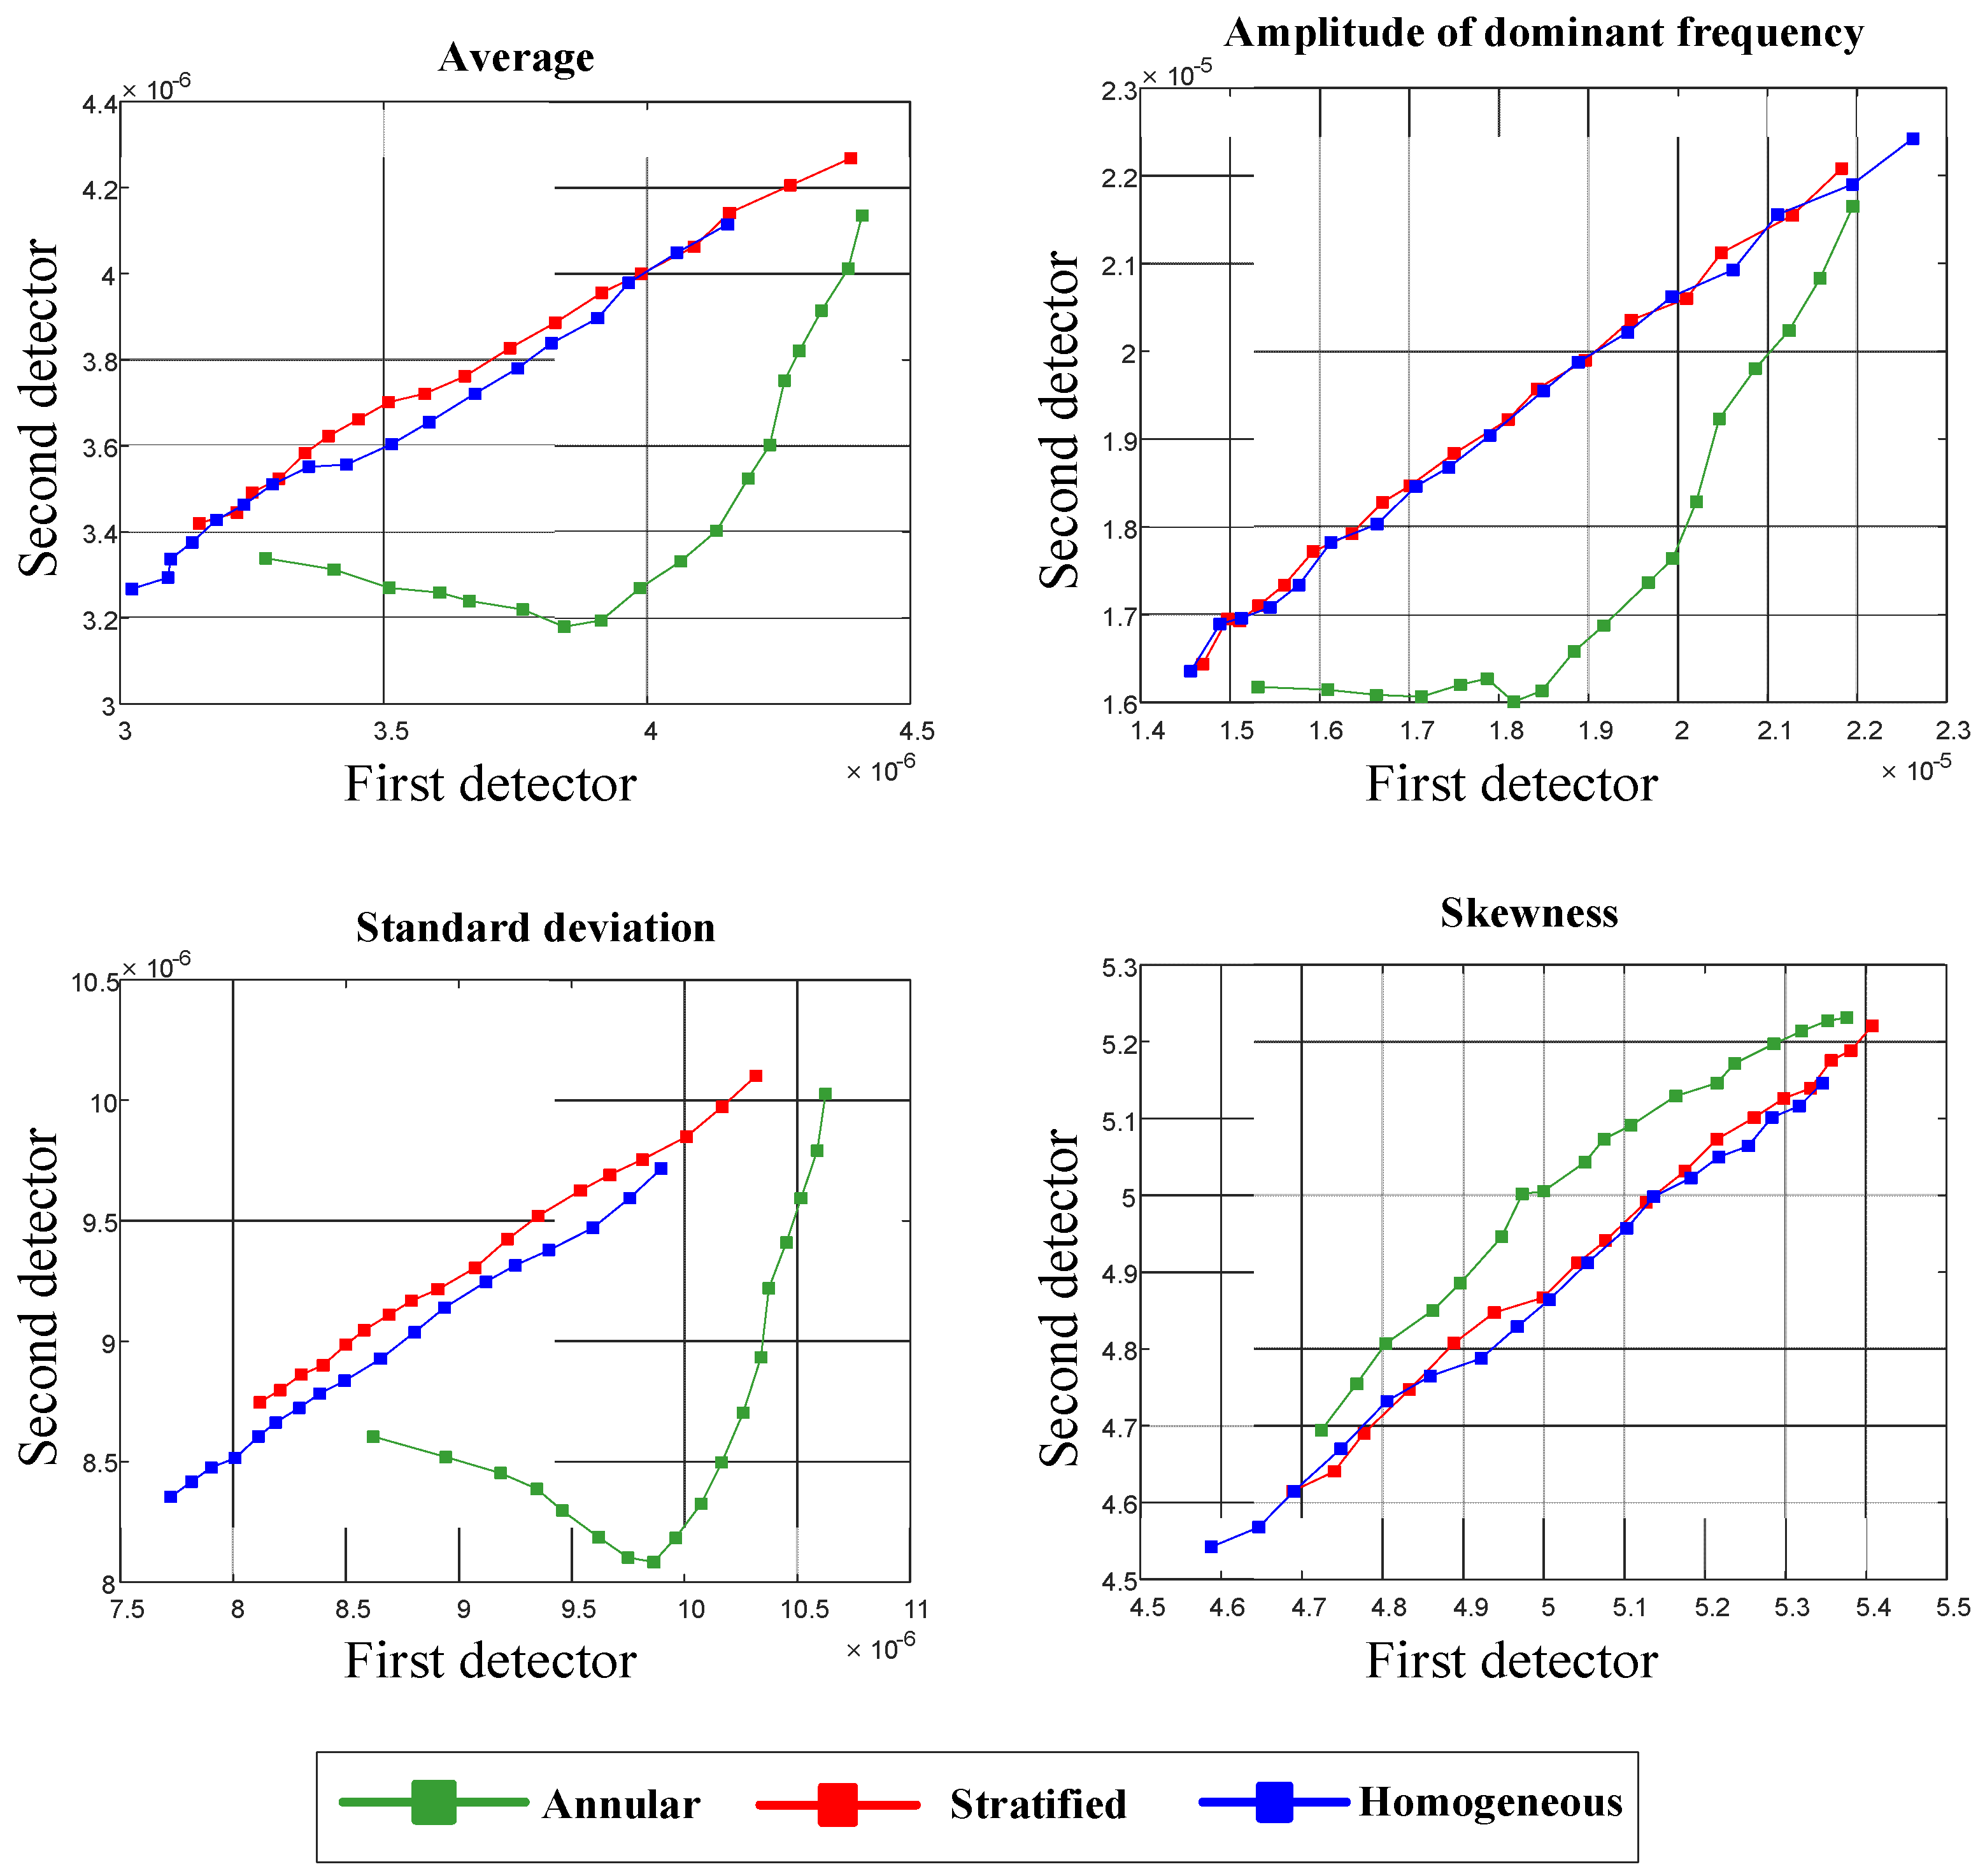
3. Feature Extraction
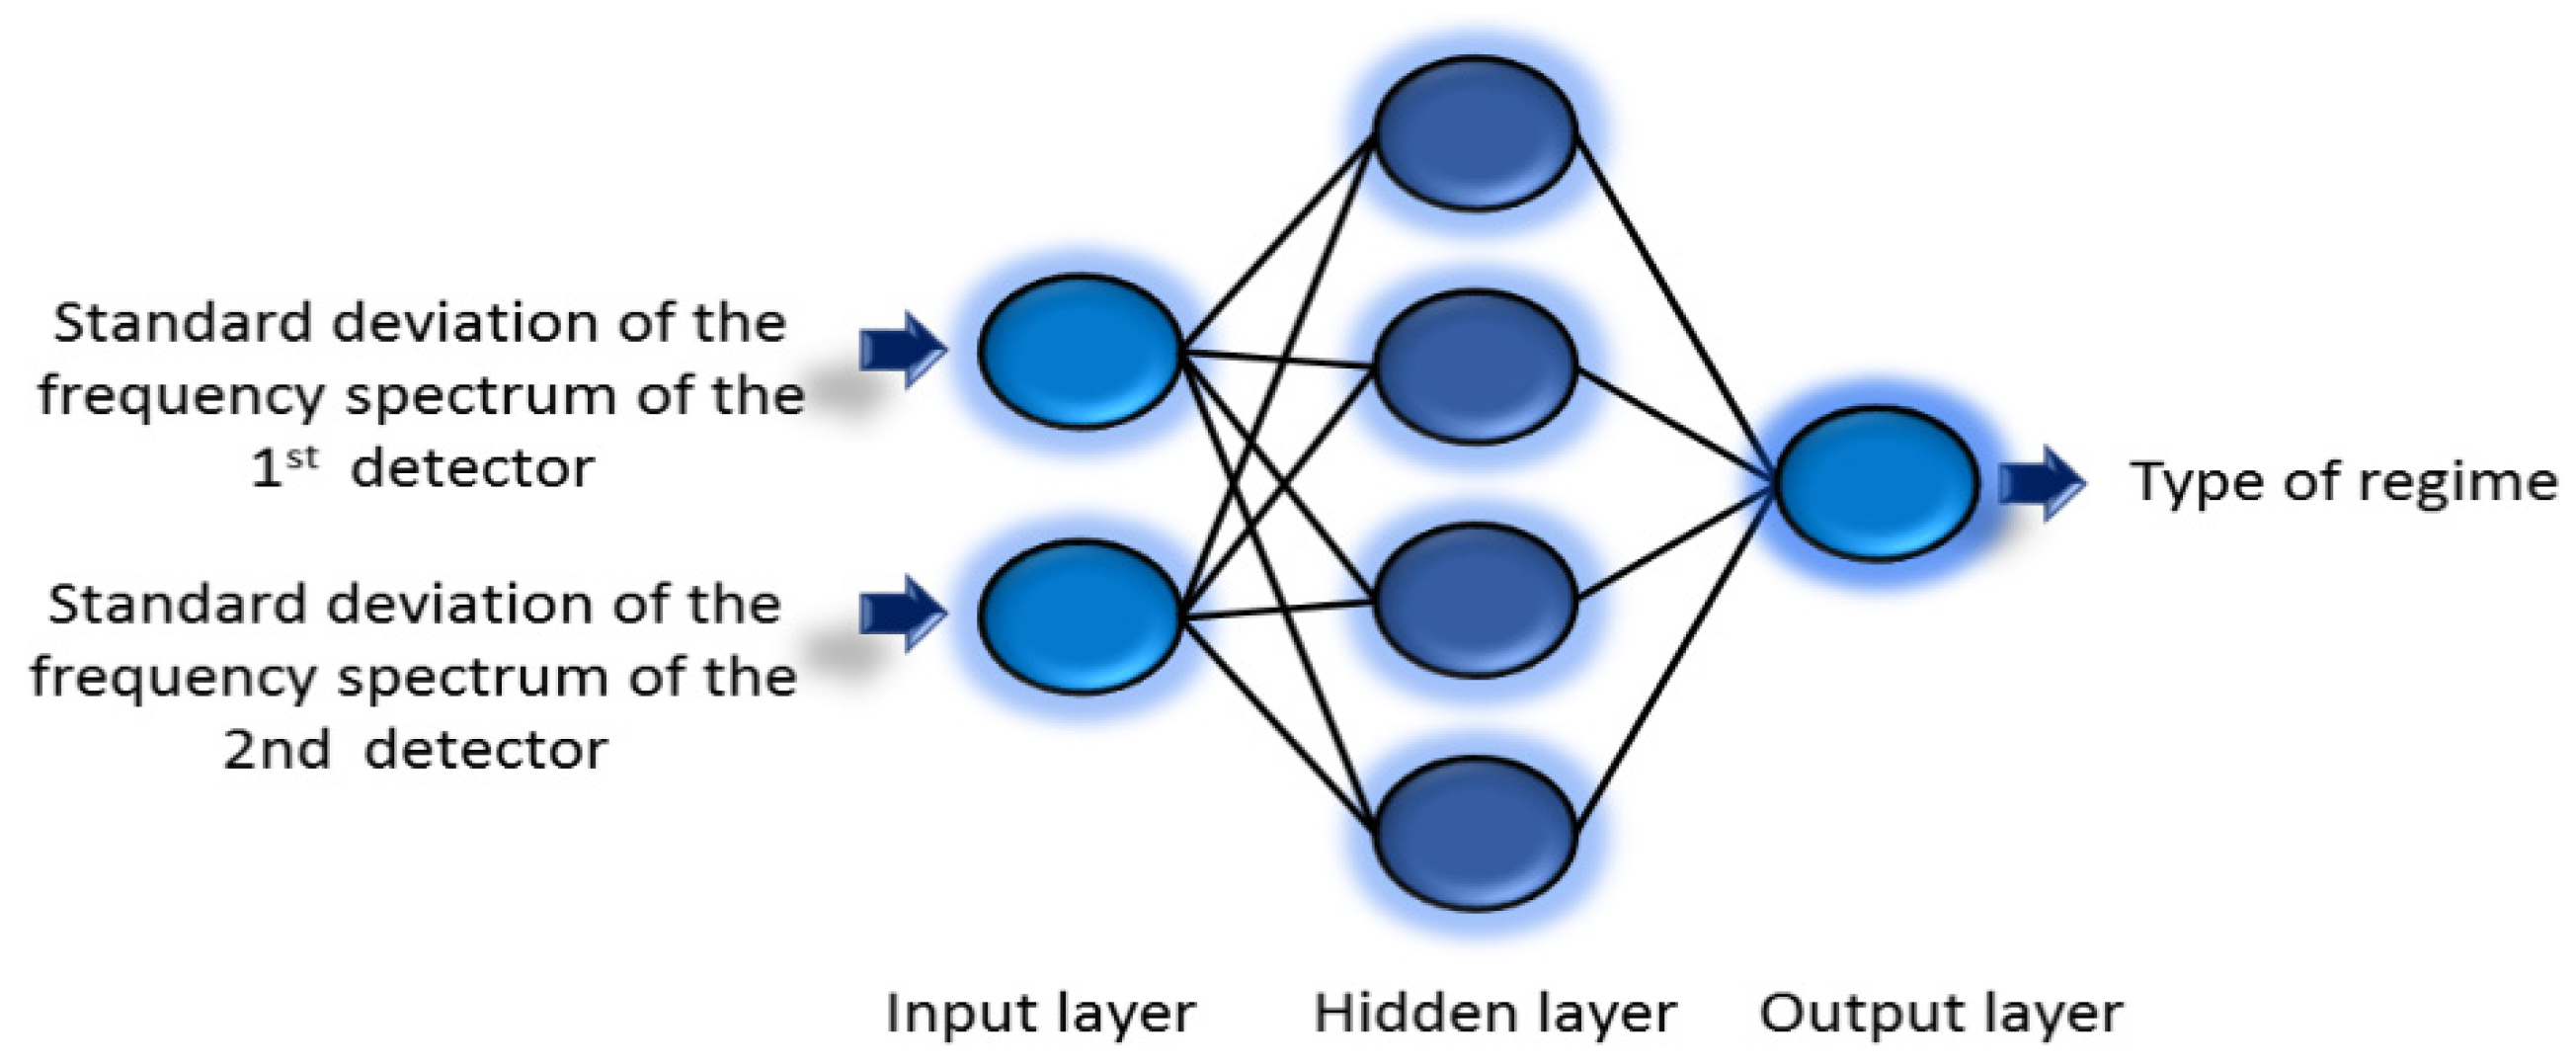
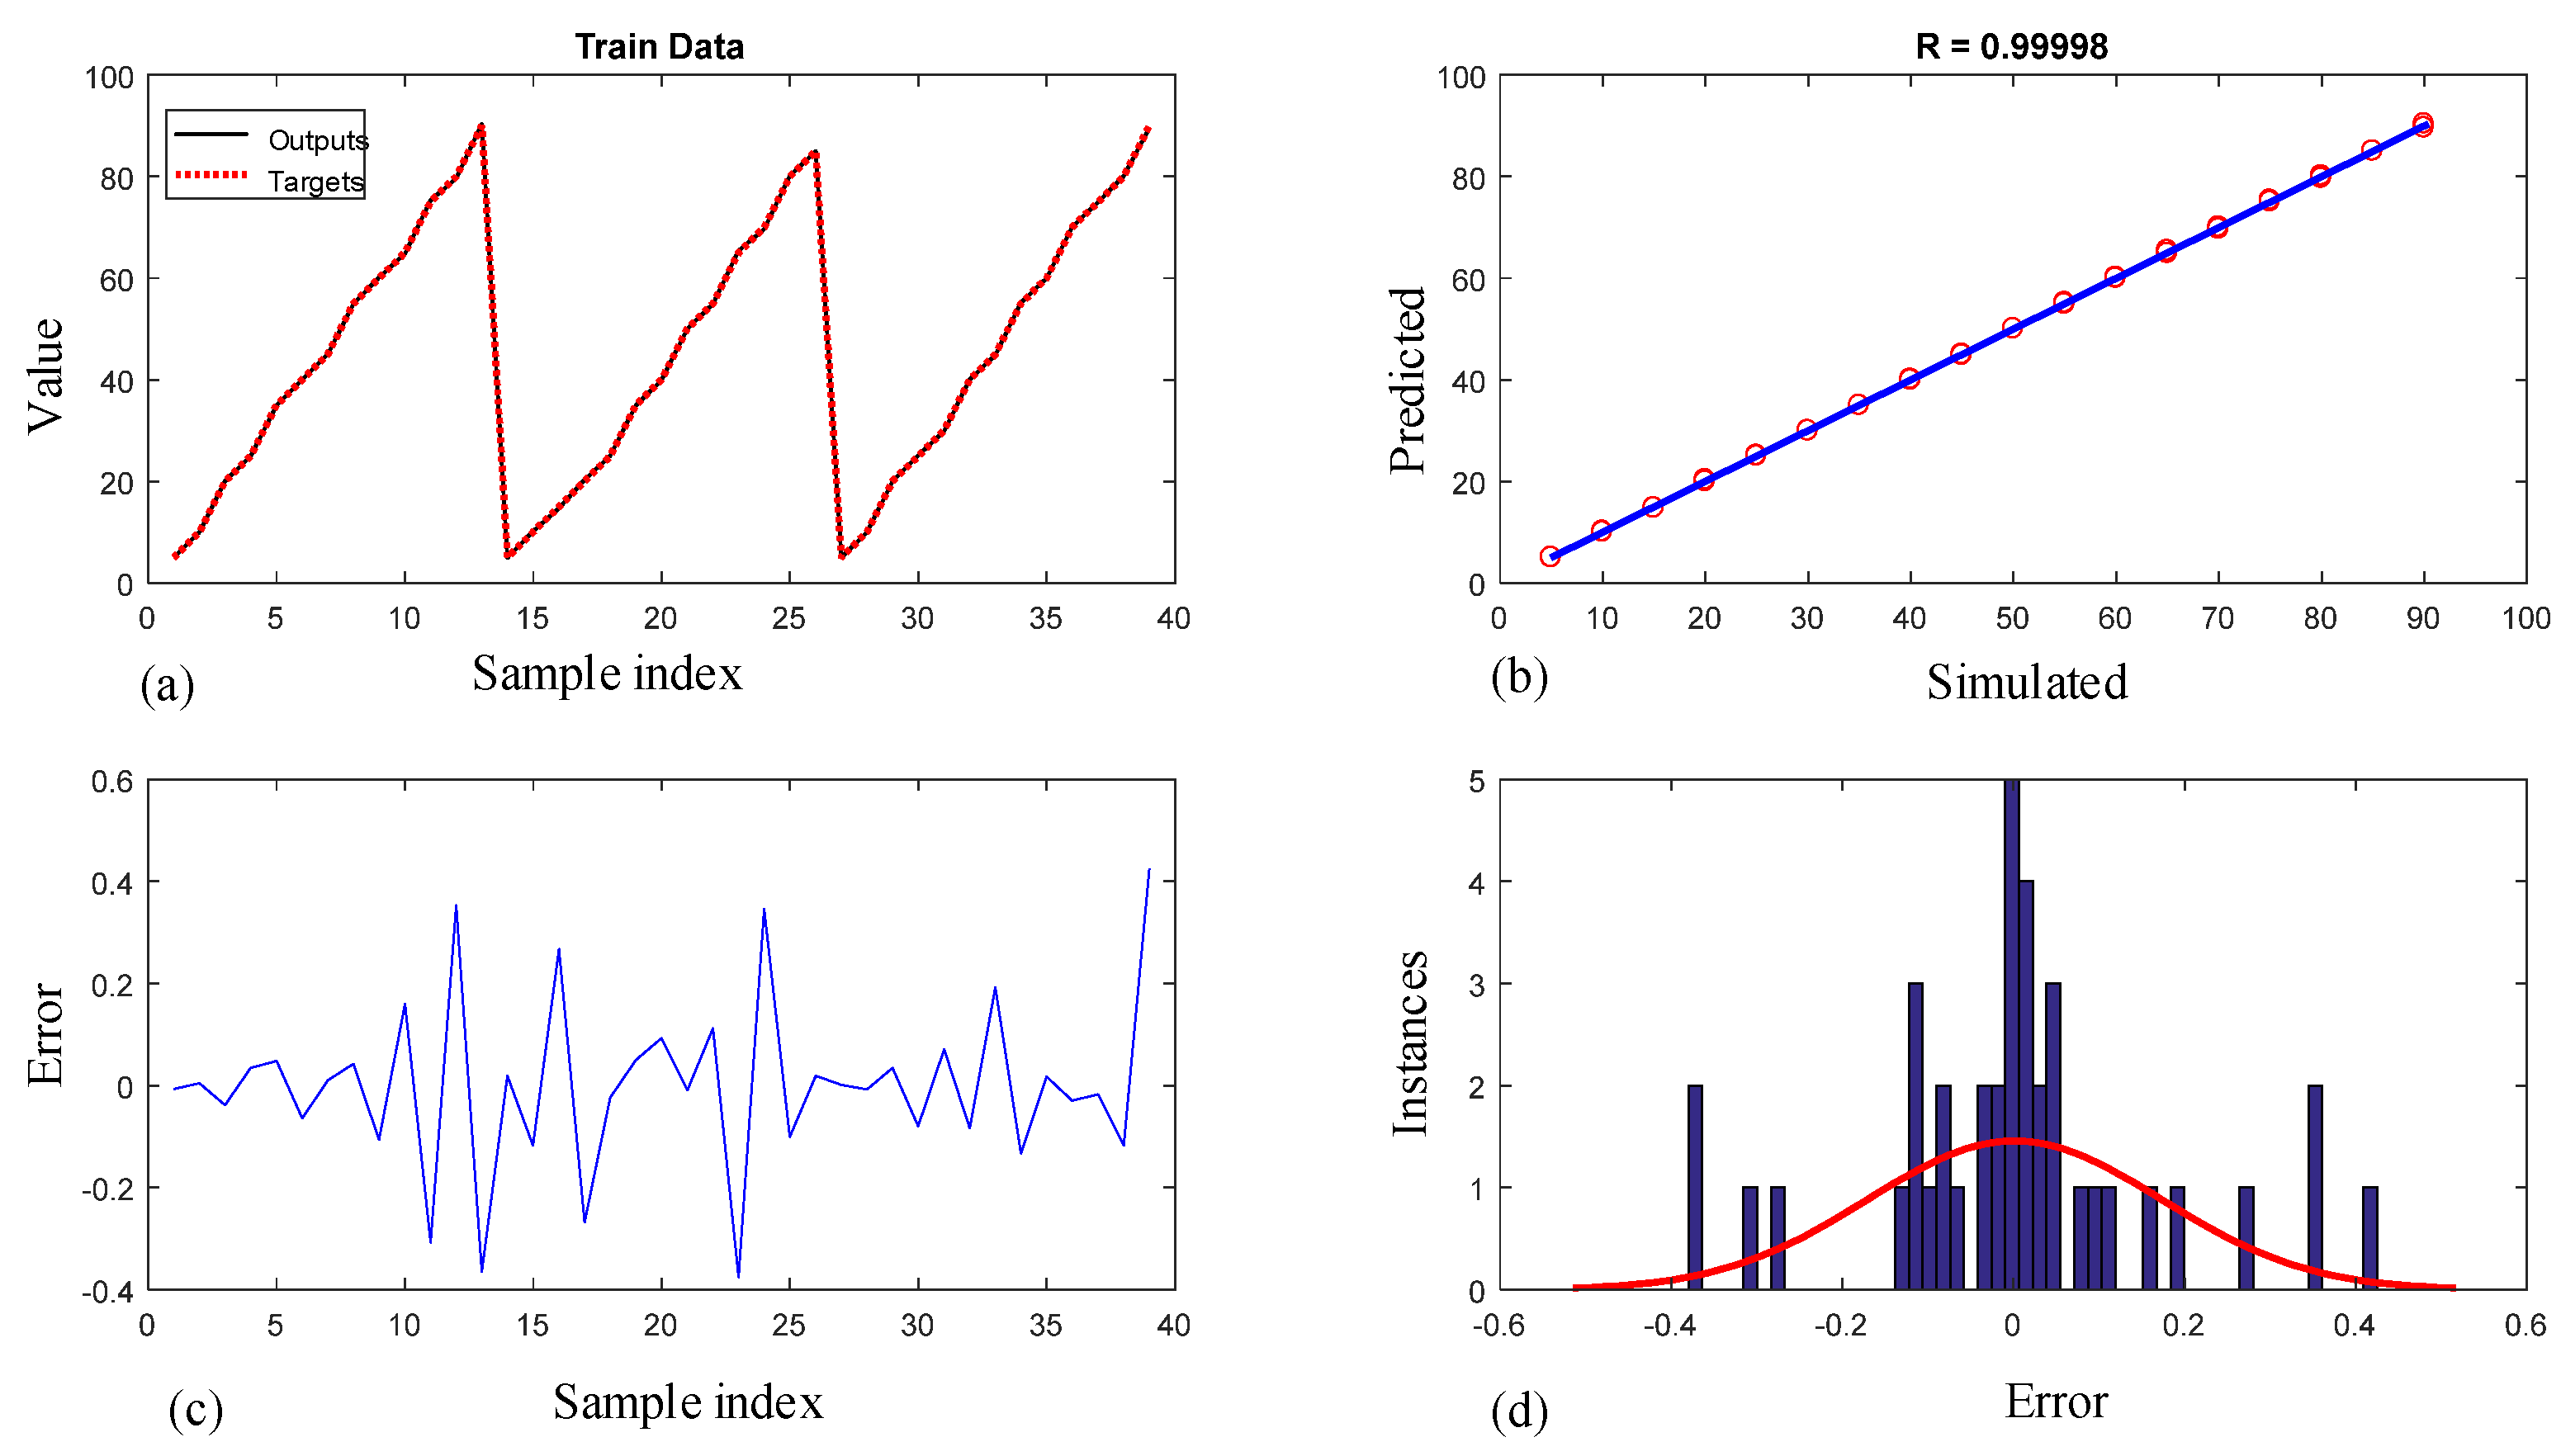
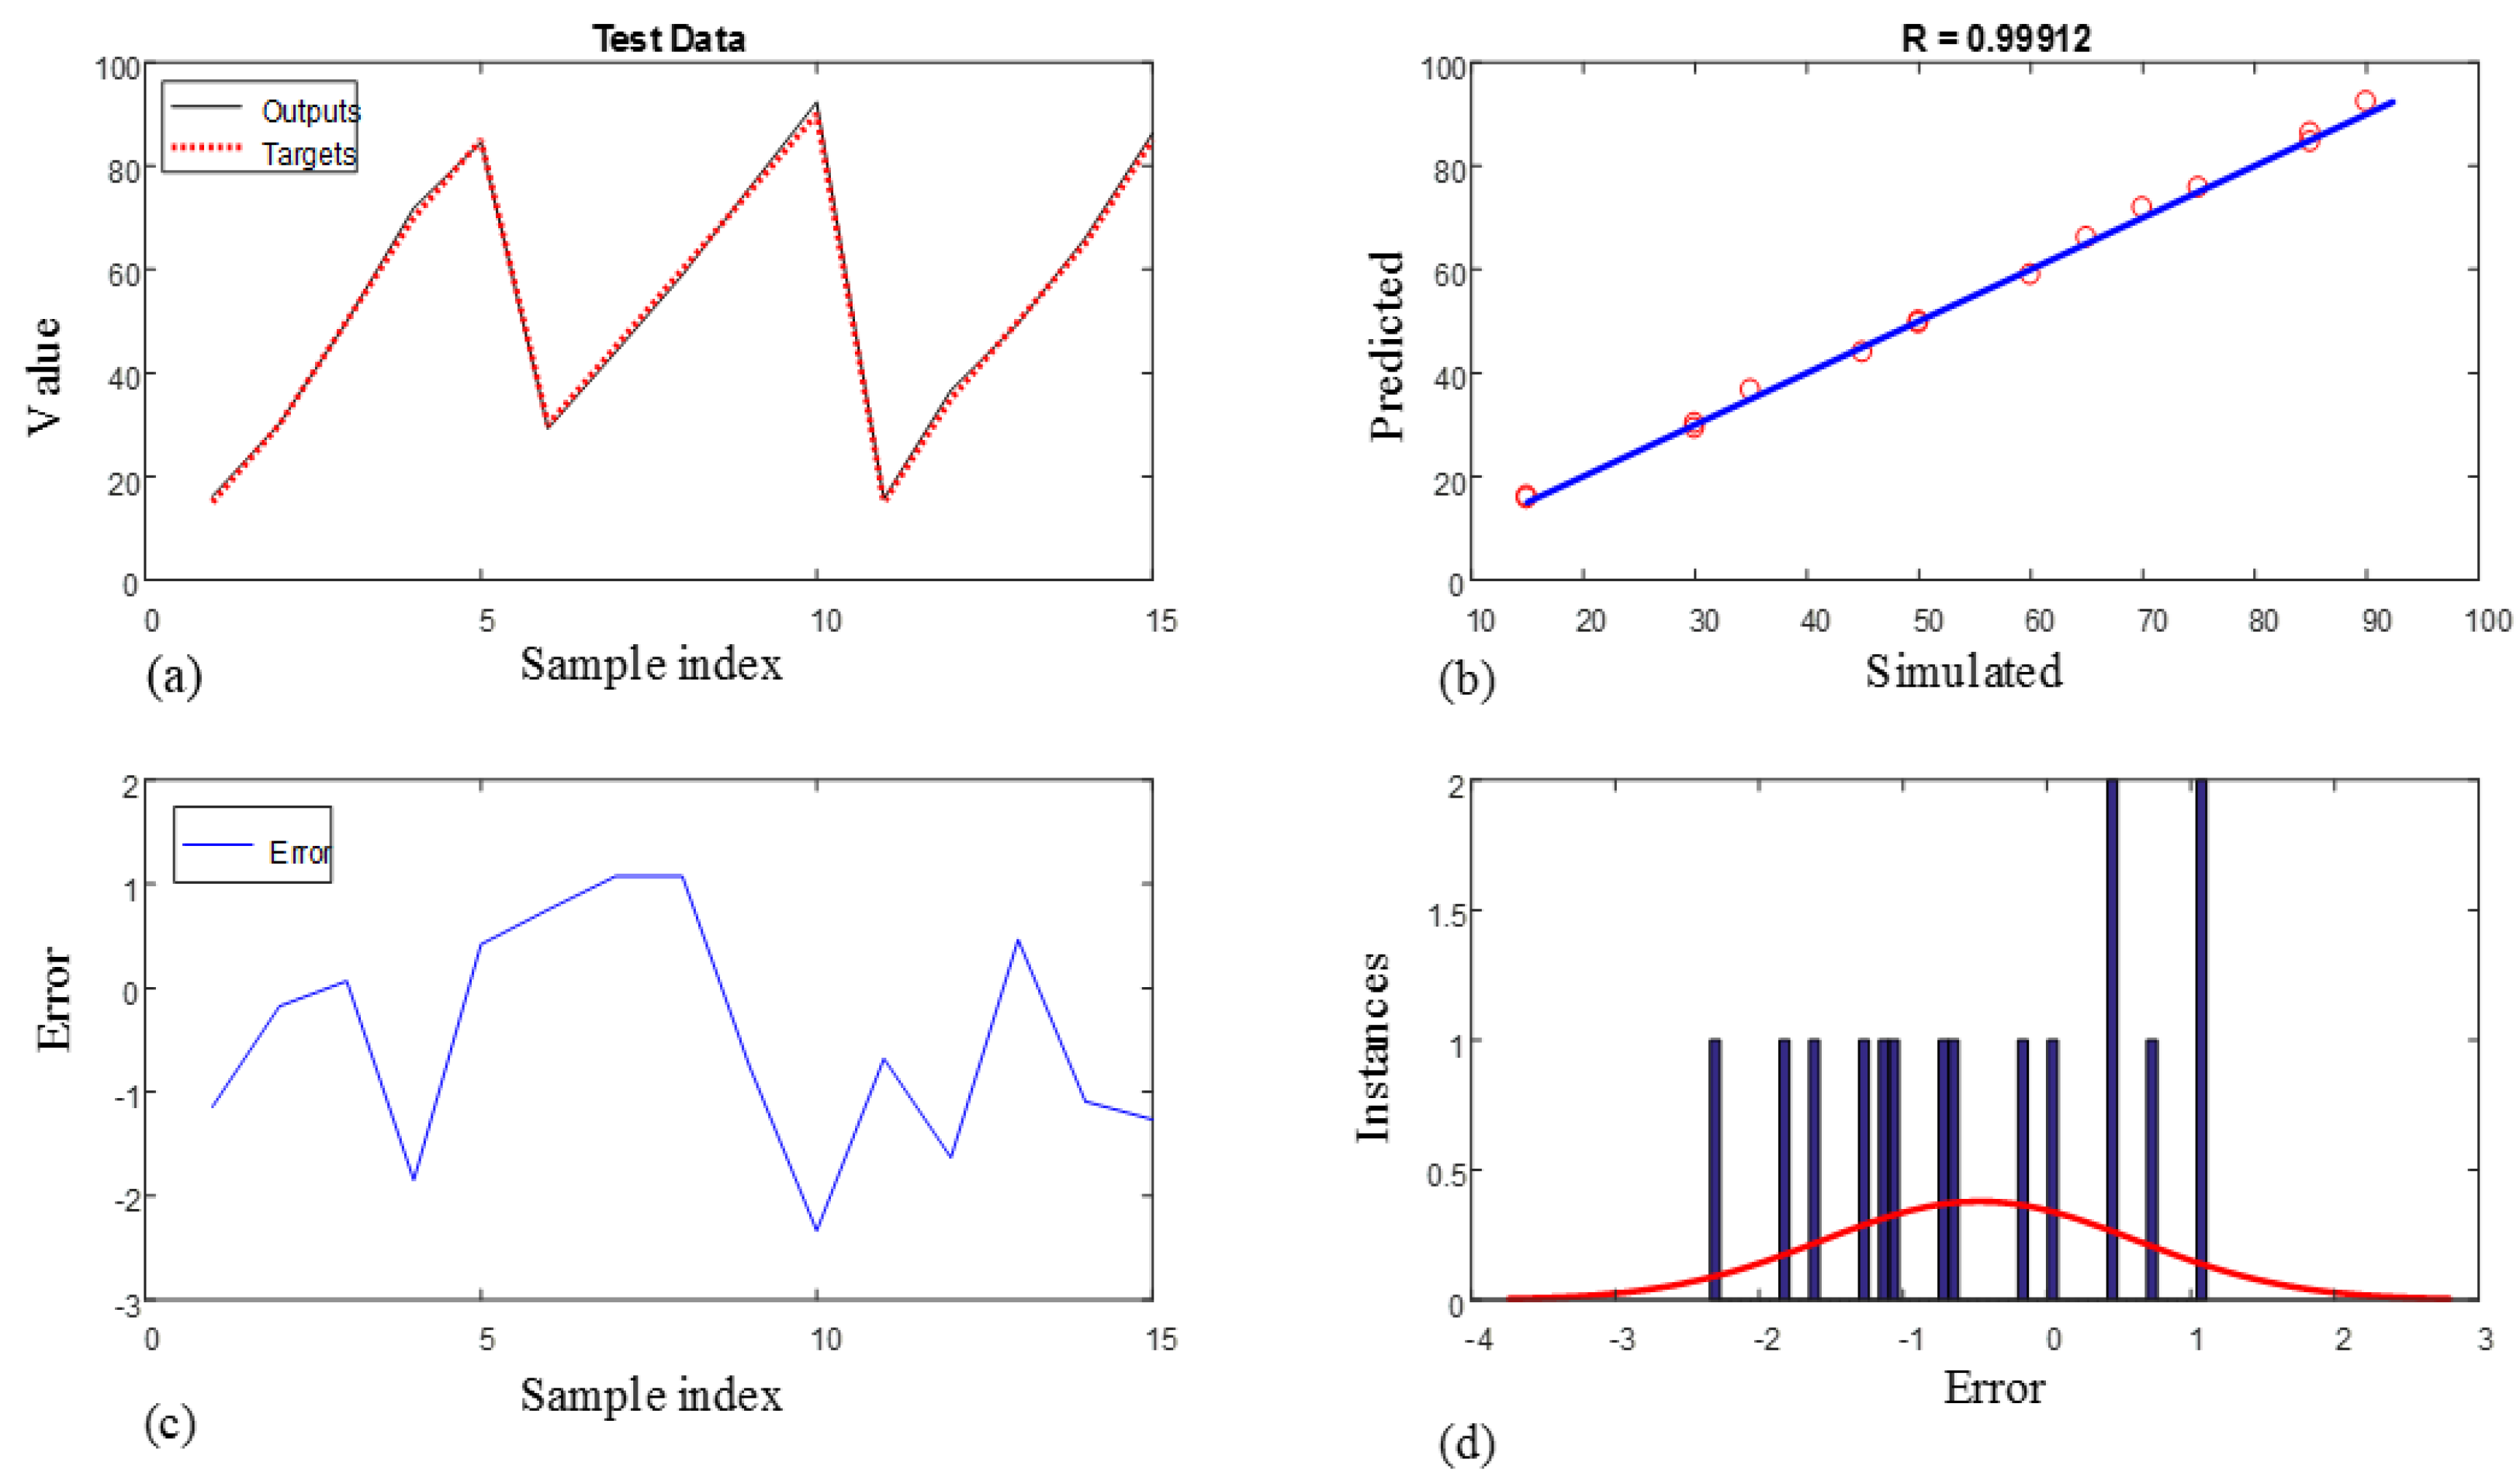
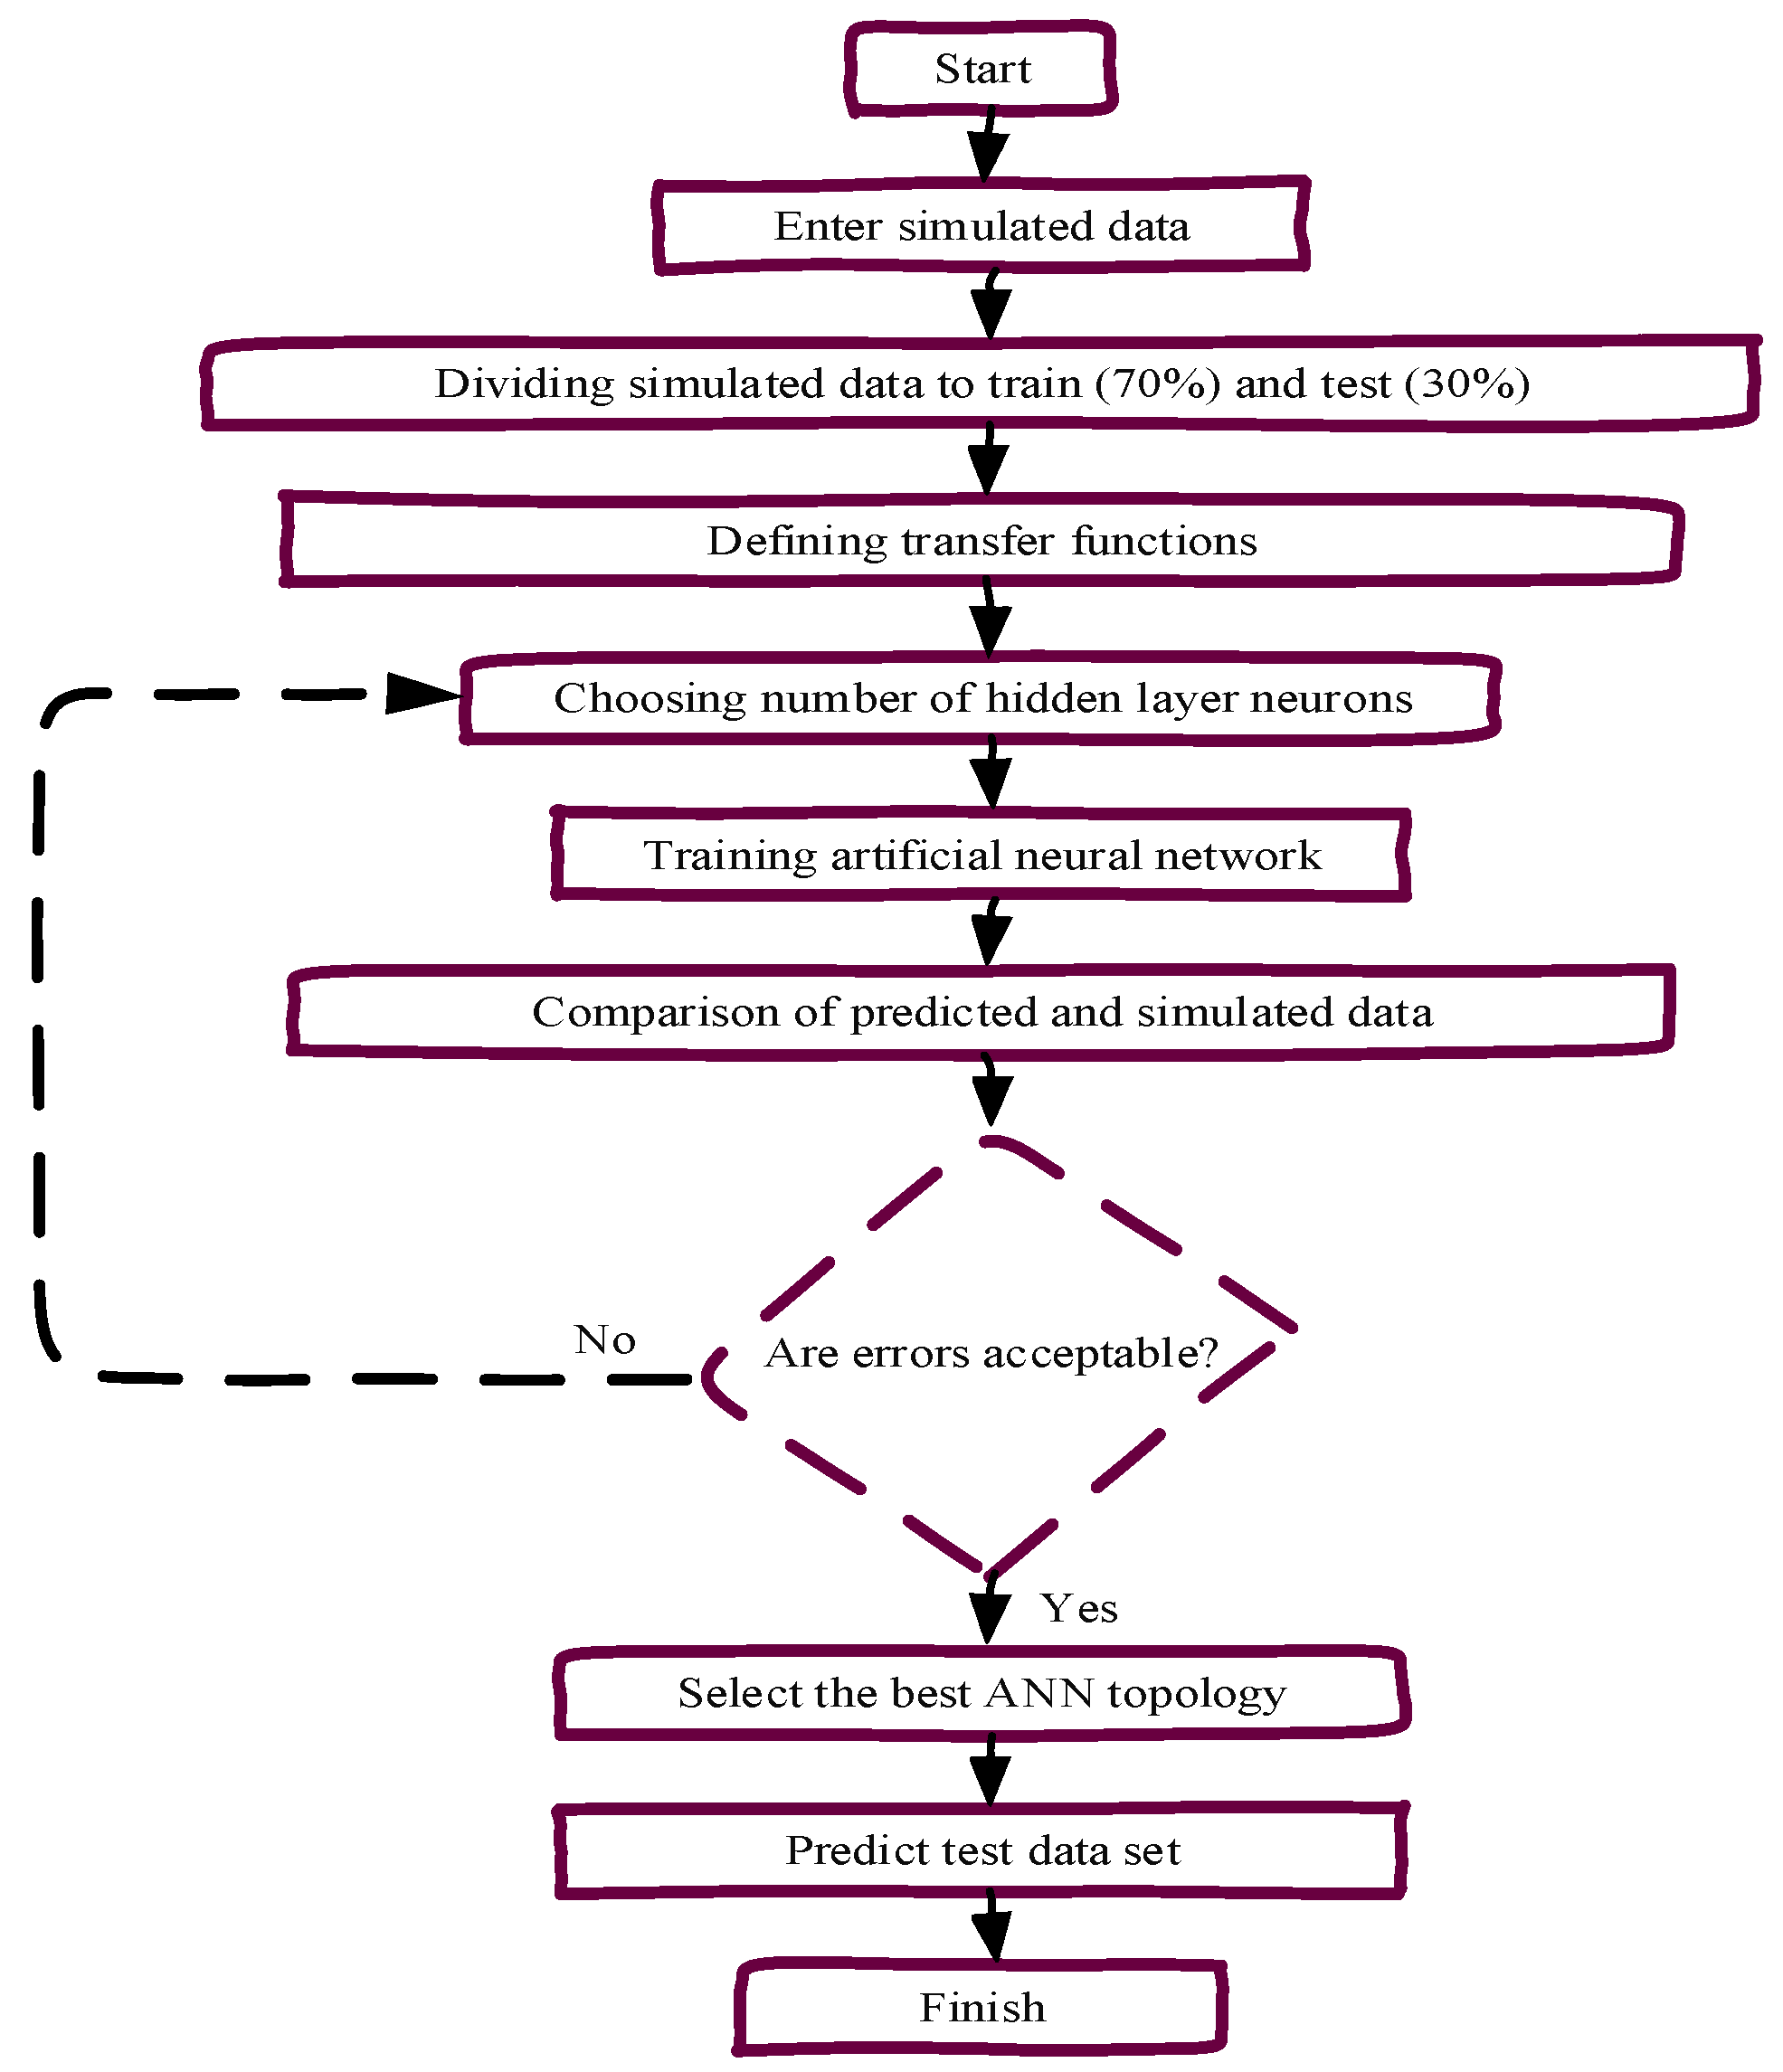
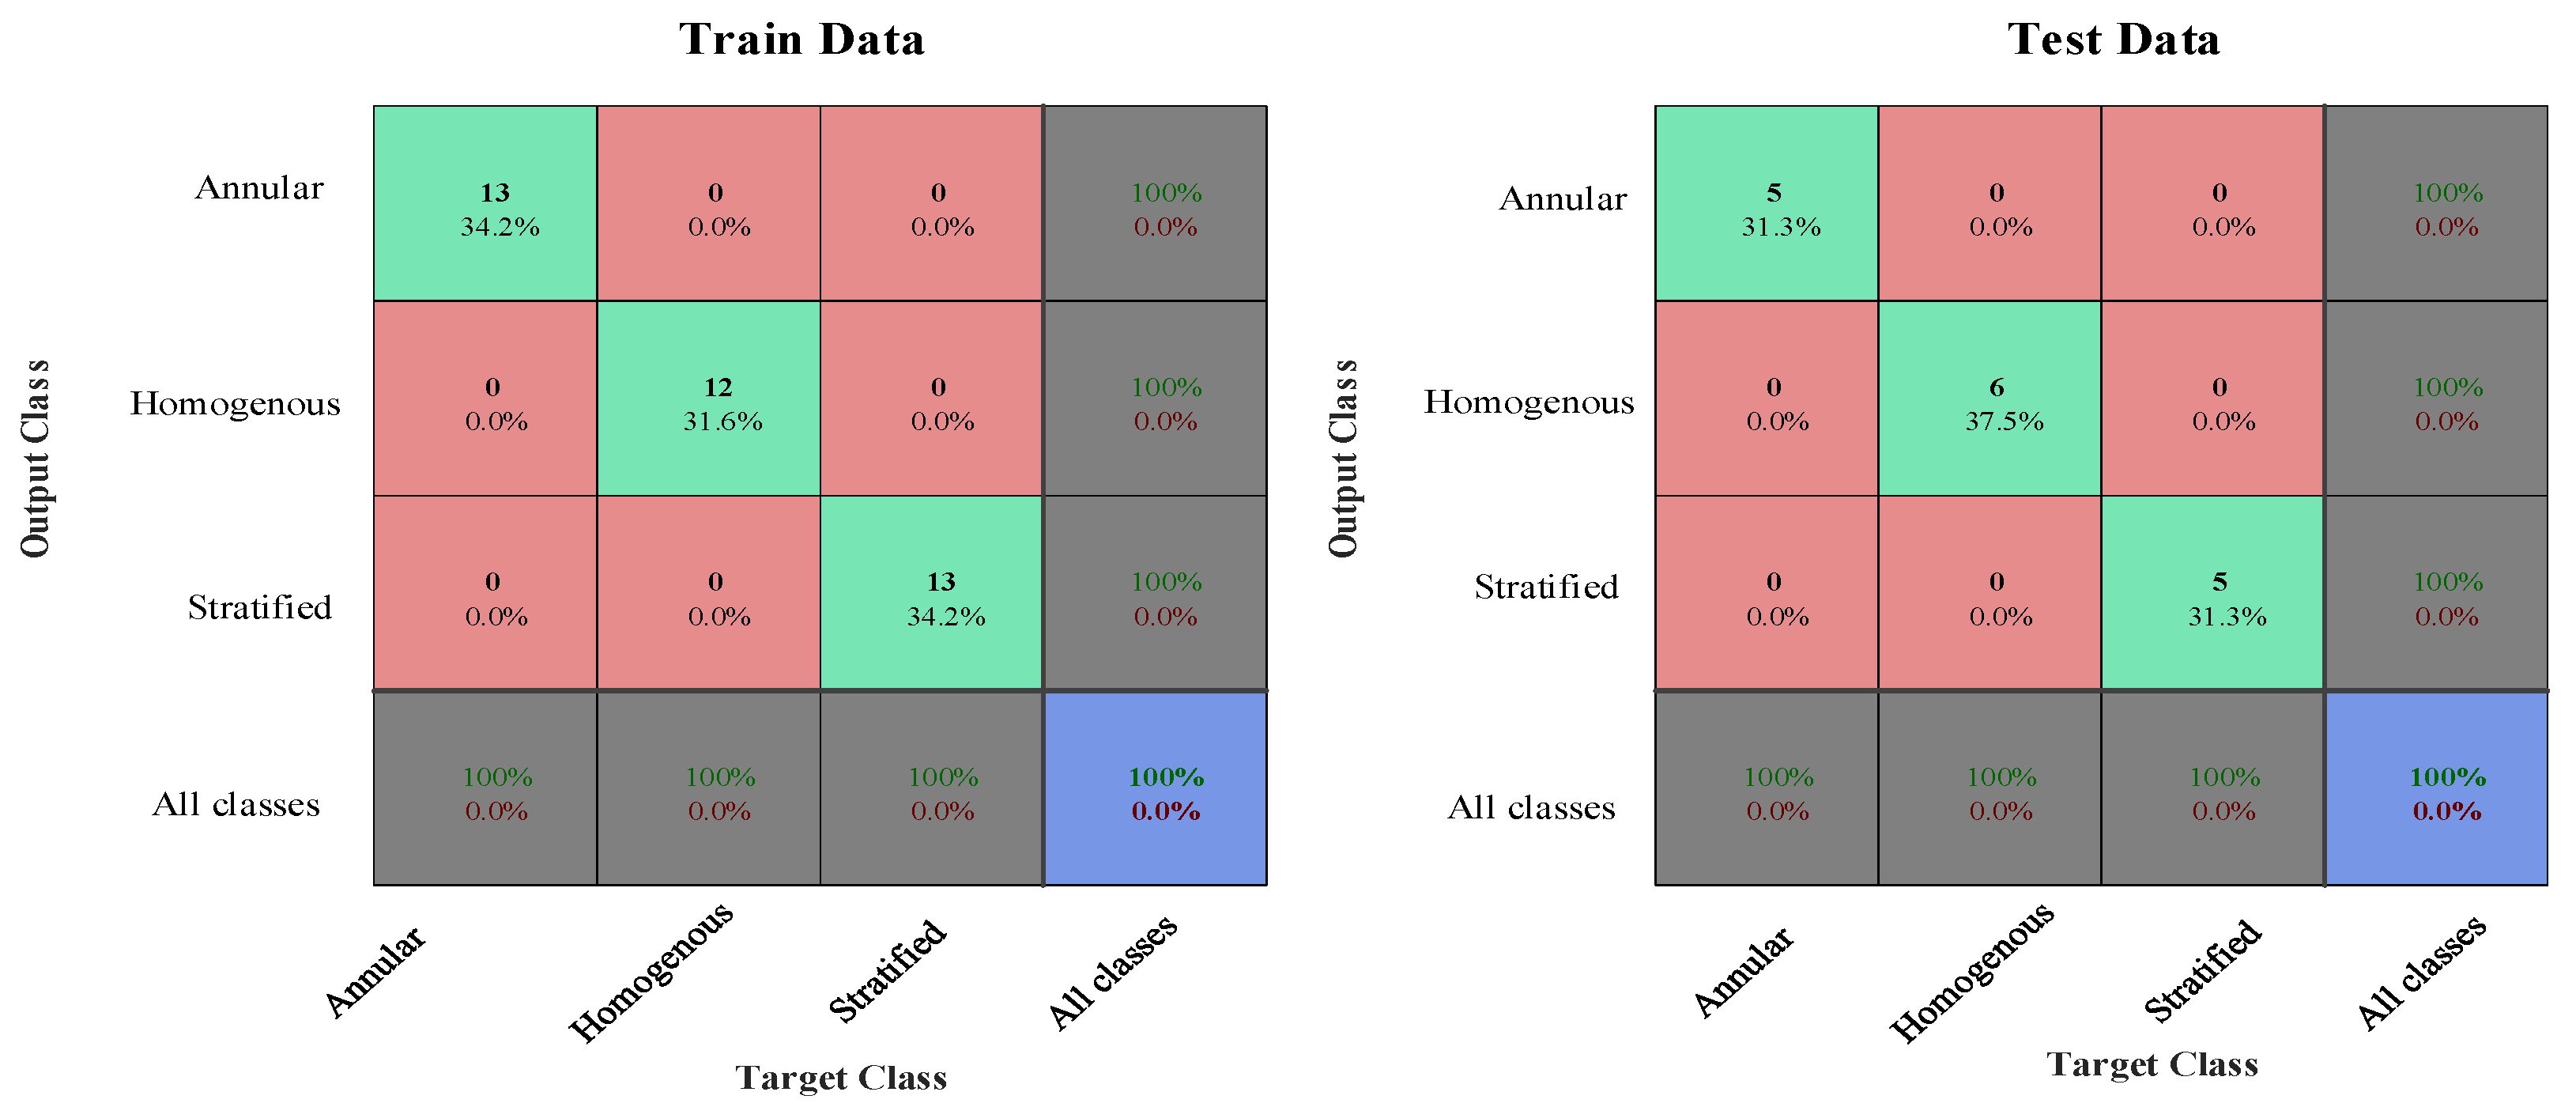
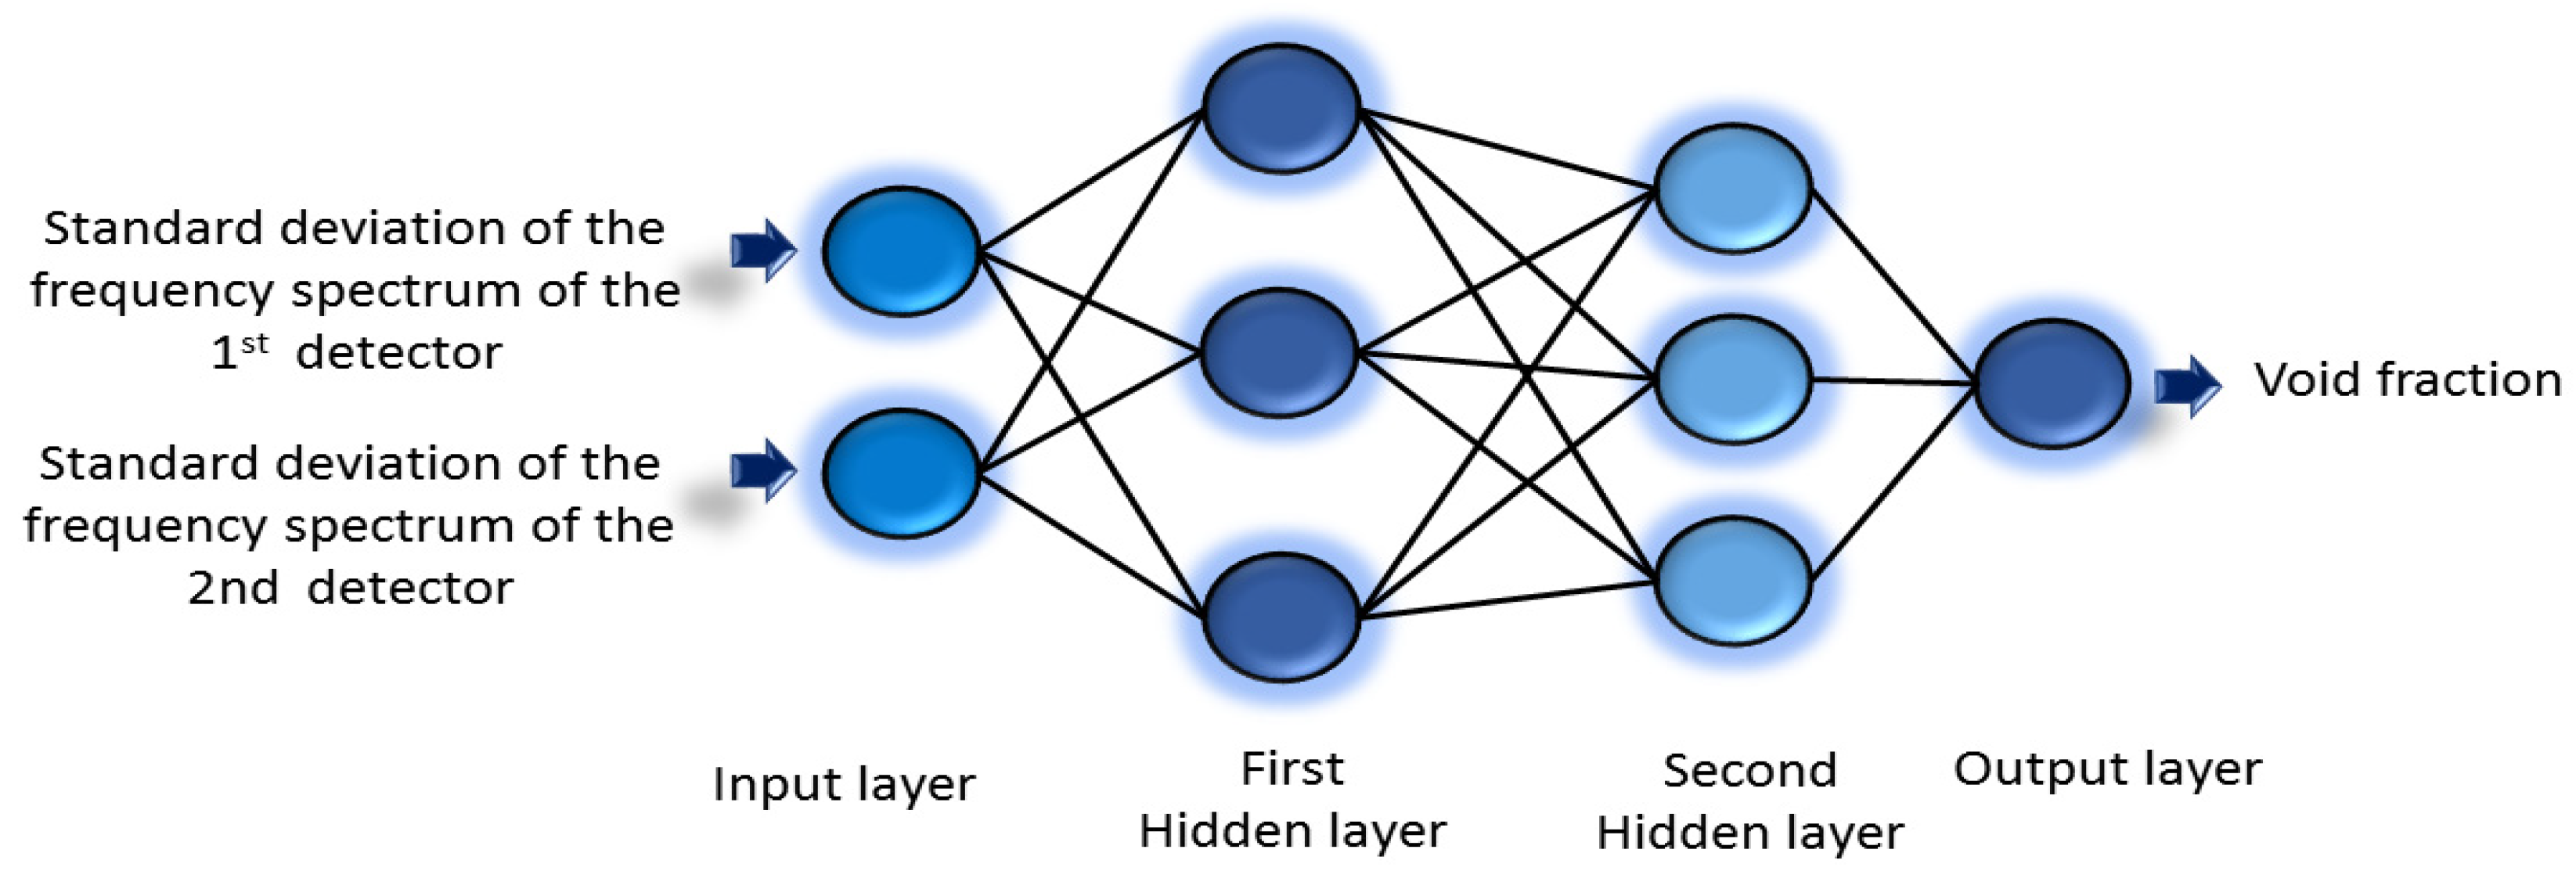
4. Artificial Neural Network
5. Conclusions
Author Contributions
Funding
Institutional Review Board Statement
Informed Consent Statement
Data Availability Statement
Conflicts of Interest
References
- Nazemi, E.; Roshani, G.H.; Feghhi, S.A.H.; Setayeshi, S.; Zadeh, E.E.; Fatehi, A. Optimization of a method for identifying the flow regime and measuring void fraction in a broad beam gamma-ray attenuation technique. Int. J. Hydrogen Energy 2016, 41, 7438–7444. [Google Scholar] [CrossRef]
- Roshani, G.; Nazemi, E.; Feghhi, S. Investigation of using 60 Co source and one detector for determining the flow regime and void fraction in gas–liquid two-phase flows. Flow Meas. Instrum. 2016, 50, 73–79. [Google Scholar] [CrossRef]
- Hanus, R.; Zych, M.; Petryka, L.; Jaszczur, M.; Hanus, P. Signals features extraction in liquid-gas flow measurements using gamma densitometry. Part 1: Time domain. In EPJ Web of Conferences; EDP Sciences: Ulys, France, 2016; Volume 114, p. 02035. [Google Scholar]
- Alamoudi, M.; Sattari, M.A.; Balubaid, M.; Eftekhari-Zadeh, E.; Nazemi, E.; Taylan, O.; Kalmoun, E.M. Application of Gamma Attenuation Technique and Artificial Intelligence to Detect Scale Thickness in Pipelines in Which Two-Phase Flows with Different Flow Regimes and Void Fractions Exist. Symmetry 2021, 13, 1198. [Google Scholar] [CrossRef]
- Åbro, E.; Johansen, G.A. Improved void fraction determination by means of multibeam gamma-ray attenuation measurements. Flow Meas. Instrum. 1999, 10, 99–108. [Google Scholar] [CrossRef]
- Jing, C.G.; Bai, Q. Flow regime identification of gas/liquid two phase flow in vertical pipe using RBF neural networks. In Proceedings of the Chinese Control and Decision Conference (CCDC), Guilin, China, 17–19 June 2009. [Google Scholar]
- Faghihi, R.; Nematollahi, M.; Erfaninia, A.; Adineh, M. Void fraction measurement in modeled two-phase flow inside a vertical pipe by using polyethylene phantoms. Int. J. Hydrogen Energy 2015, 40, 15206–15212. [Google Scholar] [CrossRef]
- Nazemi, E.; Feghhi, S.A.H.; Roshani, G.H.; Peyvandi, R.G.; Setayeshi, S. Precise Void Fraction Measurement in Two-phase Flows Independent of the Flow Regime Using Gamma-ray Attenuation. Nucl. Eng. Technol. 2016, 48, 64–71. [Google Scholar] [CrossRef] [Green Version]
- Nazemi, E.; Feghhi, S.A.H.; Roshani, G.H.; Setayeshi, S.; Peyvandi, R.G. A radiation-based hydrocarbon two-phase flow meter for estimating of phase fraction independent of liquid phase density in stratified regime. Flow Meas. Instrum. 2015, 46, 25–32. [Google Scholar] [CrossRef]
- Roshani, G.H.; Muhammad Ali, P.J.; Mohammed, S.; Hanus, R.; Abdulkareem, L.; Alanezi, A.A.; Nazemi, E.; Eftek-hari-Zadeh, E.; Kalmoun, E.M. Feasibility Study of Using X-ray Tube and GMDH for Measuring Volume Fractions of Annu-lar and Stratified Regimes in Three-Phase Flows. Symmetry 2021, 13, 613. [Google Scholar] [CrossRef]
- Salgado, W.L.; Dam, R.S.; Teixeira, T.P.; Conti, C.C.; Salgado, C.M. Application of artificial intelligence in scale thickness prediction on offshore petroleum using a gamma-ray densitometer. Radiat. Phys. Chem. 2020, 168, 108549. [Google Scholar] [CrossRef]
- Salgado, C.M.; Brandao, L.E.; Schirru, R.; Pereira, C.M.; da Silva, A.X.; Ramos, R. Prediction of volume fractions in three-phase flows using nuclear technique and artificial neural network. Appl. Radiat. Isot. 2009, 67, 1812–1818. [Google Scholar] [CrossRef]
- Salgado, C.M.; Dam, R.S.F.; Salgado, W.L.; Werneck, R.R.A.; Pereira, C.M.N.A.; Schirru, R. The comparison of different multilayer perceptron and General Regression Neural Networks for volume fraction prediction using MCNPX code. Appl. Radiat. Isot. 2020, 162, 109170. [Google Scholar] [CrossRef] [PubMed]
- de Freitas Dam, R.S.; Salgado, W.L.; Affonso, R.R.W.; Schirru, R.; Salgado, C.M. Optimization of radioactive particle tracking methodology in a single-phase flow using MCNP6 code and artificial intelligence methods. Flow Meas. Instrum. 2020, 78, 101862. [Google Scholar]
- Sattari, M.A.; Roshani, G.H.; Hanus, R.; Nazemi, E. Applicability of time-domain feature extraction methods and artificial intelligence in two-phase flow meters based on gamma-ray absorption technique. Measurement 2021, 168, 108474. [Google Scholar] [CrossRef]
- Roshani, M.; Phan, G.; Roshani, G.H.; Hanus, R.; Nazemi, B.; Corniani, E.; Nazemi, E. Combination of X-ray tube and GMDH neural network as a nondestructive and potential technique for measuring characteristics of gas-oil–water three phase flows. Measurement 2021, 168, 108427. [Google Scholar] [CrossRef]
- Hosseini, S.; Taylan, O.; Abusurrah, M.; Akilan, T.; Nazemi, E.; Eftekhari-Zadeh, E.; Bano, F.; Roshani, G.H. Application of Wavelet Feature Extraction and Artificial Neural Networks for Improving the Performance of Gas–Liquid Two-phase Flow Meters Used in Oil and Petrochemical Industries. Polymers 2021, 13, 3647. [Google Scholar] [CrossRef]
- Roshani, M.; Phan, G.; Faraj, R.H.; Phan, N.H.; Roshani, G.H.; Nazemi, B.; Corniani, E.; Nazemi, E. Proposing a gamma radiation based intelligent system for simultaneous analyzing and detecting type and amount of petroleum by-products. Nucl. Eng. Technol. 2020, 53, 1277–1283. [Google Scholar] [CrossRef]
- Phinyomark, A.; Limsakul, C.; Phukpattaranont, P. EMG feature extraction for tolerance of white Gaussian noise. In Proceedings of the International Workshop and Symposium Science Technology, Nong Khai, Thailand, 15–16 December 2008; pp. 178–183. [Google Scholar]
- Lalbakhsh, A.; Mohamadpour, G.; Roshani, S.; Ami, M.; Roshani, S.; Sayem, A.S.; Alibakhshikenari, M.; Koziel, S. Design of a compact planar transmission line for miniaturized rat-race coupler with harmonics suppression. IEEE Access 2021, 9, 129207–129217. [Google Scholar] [CrossRef]
- Roshani, S.; Roshani, S. A compact coupler design using meandered line compact microstrip resonant cell (MLCMRC) and bended lines. Wirel. Netw. 2021, 27, 677–684. [Google Scholar] [CrossRef]
- Shukla, N.K.; Mayet, A.M.; Vats, A.; Aggarwal, M.; Raja, R.K.; Verma, R.; Muqeet, M.A. High speed integrated RF–VLC data communication system: Performance constraints and capacity considerations. Phys. Commun. 2021, 50, 101492. [Google Scholar] [CrossRef]
- Hookari, M.; Roshani, S.; Roshani, S. High-efficiency balanced power amplifier using miniaturized harmonics suppressed coupler. Int. J. RF Microw. Comput.-Aided Eng. 2020, 30, e22252. [Google Scholar] [CrossRef]
- Mayet, A.M.; Hussain, A.M.; Hussain, M.M. Three-terminal nanoelectromechanical switch based on tungsten nitride—an amorphous metallic material. Nanotechnology 2015, 27, 035202. [Google Scholar] [CrossRef] [PubMed]
- Lotfi, S.; Roshani, S.; Roshani, S.; Gilan, M.S. Wilkinson power divider with band-pass filtering response and harmonics suppression using open and short stubs. Frequenz 2020, 74, 169–176. [Google Scholar] [CrossRef]
- Mayet, A.; Hussain, M.M. Amorphous WNx Metal for Accelerometers and Gyroscope. In Proceedings of the MRS Fall Meeting 2014, Boston, MA, USA, 30 November–5 December 2014. [Google Scholar]
- Jamshidi, M.; Siahkamari, H.; Roshani, S.; Roshani, S. A compact Gysel power divider design using U-shaped and T-shaped resonators with harmonics suppression. Electromagnetics 2019, 39, 491–504. [Google Scholar] [CrossRef]
- Mayet, C.; Smith, E.; Hussain, M.M. Energy reversible switching from amorphous metal based nanoelectromechanical switch, in Nanotechnology (IEEE-NANO). In Proceedings of the 13th IEEE Conference, Vietri sul Mare, Italy, 5–8 August 2013; pp. 366–369. [Google Scholar]
- Roshani, S.; Roshani, S. Two-section impedance transformer design and modeling for power amplifier applications. Appl. Comput. Electromagn. Soc. J. 2017, 32, 1042–1047. [Google Scholar]
- Khaibullina, K.S.; Sagirova, L.R.; Sandyga, M.S. Substantiation and selection of an inhibitor for preventing the formation of asphalt-resin-paraffin deposits. Substanciação e seleção de um inibidor para evitar a formação de depósitos de asfalto-resina-parafina. Period. Tche Quim. 2020, 17, 541–551. [Google Scholar]
- Jamshidi, M.B.; Roshani, S.; Talla, J.; Roshani, S.; Peroutka, Z. Size reduction and performance improvement of a microstrip Wilkinson power divider using a hybrid design technique. Sci. Rep. 2021, 11, 7773. [Google Scholar] [CrossRef]
- Mayet, A.; Smith, C.; Hussain, M.M. Amorphous metal based nanoelectromechanical switch. In Proceedings of the 2013 Saudi International Electronics, Communications and Photonics Conference, Riyadh, Saudi Arabia, 27–30 April 2013; pp. 1–5. [Google Scholar]
- Hookari, M.; Roshani, S.; Roshani, S. Design of a low pass filter using rhombus-shaped resonators with an analytical LC equivalent circuit. Turk. J. Electr. Eng. Comput. Sci. 2020, 28, 865–874. [Google Scholar] [CrossRef]
- Khaibullina, K.S.; Korobov, G.Y.; Lekomtsev, A.V. Development of an asphalt-resin-paraffin deposits inhibitor and substantiation of the technological parameters of its injection into the bottom-hole formation zone. Desenvolvimento de um inibidor de depósito de asfalto-resinaparafina e subscantiação dos parâmetros tecnológicos de sua injeção na zona de formação de furo inferior. Period. Tche Quim. 2020, 17, 769–781. [Google Scholar]
- Pirasteh, A.; Roshani, S.; Roshani, S. Design of a miniaturized class F power amplifier using capacitor loaded transmission lines. Frequenz 2020, 74, 145–152. [Google Scholar] [CrossRef]
- Tikhomirova, E.A.; Sagirova, L.R.; Khaibullina, K.S. A review on methods of oil saturation modelling using IRAP RMS. IOP Conf. Ser. Earth Environ. Sci. 2019, 378, 012075. [Google Scholar] [CrossRef]
- Roshani, S.; Dehghani, K.; Roshani, S. A lowpass filter design using curved and fountain shaped resonators. Frequenz 2019, 73, 267–272. [Google Scholar] [CrossRef]
- Khaibullina, K. Technology to remove asphaltene, resin and paraffin deposits in wells using organic solvents. In Proceedings of the SPE Annual Technical Conference and Exhibition, Dubai, Saudi Arabia, 26 September 2016. [Google Scholar] [CrossRef]
- Roshani, S.; Roshani, S. Design of a compact LPF and a miniaturized Wilkinson power divider using aperiodic stubs with harmonic suppression for wireless applications. Wirel. Netw. 2020, 26, 1493–1501. [Google Scholar] [CrossRef]
- Xie, T.; Ghiaasiaan, S.M.; Karrila, S. Artificial neural network approach for flow regime classification in gass-liquid-fiber flows based on frequency domain analysis of pressure signal. Chem. Eng. Sci. 2004, 59, 2241–2251. [Google Scholar] [CrossRef]
- Hanus, R.; Zych, M.; Kusy, M.; Jaszczur, M.; Petryka, L. Identification of liquid-gas flow regime in a pipeline using gamma-ray absorption technique and computational intelligence methods. Flow Meas. Instrum. 2018, 60, 17–23. [Google Scholar] [CrossRef]
- Roshani, G.H.; Feghhi, S.A.H.; Mahmoudi-Aznaveh, A.; Nazemi, E.; Adineh-Vand, A. Precise volume fraction prediction in oil–water–gas multiphase flows by means of gamma-ray attenuation and artificial neural networks using one detector. Measurement 2014, 51, 34–41. [Google Scholar] [CrossRef]
- Hosseini, S.; Roshani, G.; Setayeshi, S. Precise gamma based two-phase flow meter using frequency feature extraction and only one detector. Flow Meas. Instrum. 2020, 72, 101693. [Google Scholar] [CrossRef]
- Bahiraei, M.; Mazaheri, N.; Hosseini, S. Neural network modeling of thermo-hydraulic attributes and entropy generation of an ecofriendly nanofluid flow inside tubes equipped with novel rotary coaxial double-twisted tape. Powder Technol. 2020, 369, 162–175. [Google Scholar] [CrossRef]
- Tingting, Y.; Junqian, W.; Lintai, W.; Yong, X. Three-stage network for age estimation. CAAI Trans. Intell. Technol. 2019, 4, 122–126. [Google Scholar] [CrossRef]
- Ding, R.; Dai, L.; Li, G.; Liu, H. TDD-net: A tiny defect detection network for printed circuit boards. CAAI Trans. Intell. Technol. 2019, 4, 110–116. [Google Scholar] [CrossRef]
- Salgado, C.; Brandão, L.; Conti, C.; Salgado, W. Density prediction for petroleum and derivatives by gamma-ray attenuation and artificial neural networks. Appl. Radiat. Isot. 2016, 116, 143–149. [Google Scholar] [CrossRef]
- Bahiraei, M.; Foong, L.K.; Hosseini, S.; Mazaheri, N. Predicting heat transfer rate of a ribbed triple-tube heat exchanger working with nanofluid using neural network enhanced by advanced optimization algorithms. Powder Technol. 2020, 381, 459–476. [Google Scholar] [CrossRef]
- Bahiraei, M.; Foong, L.K.; Hosseini, S.; Mazaheri, N. Neural network combined with nature-inspired algorithms to estimate overall heat transfer coefficient of a ribbed triple-tube heat exchanger operating with a hybrid nanofluid. Measurement 2021, 174, 108967. [Google Scholar] [CrossRef]
- Rad, M.Y.; Shahbandegan, S. An Intelligent Algorithm for Mapping of Applications on Parallel Reconfigurable Systems. In Proceedings of the 2020 6th Iranian Conference on Signal Processing and Intelligent Systems (ICSPIS), Sadjad, Iran, 23 December 2020; pp. 1–6. [Google Scholar]
- Mayet, A.M.; Salama, A.S.; Alizadeh, S.M.; Nesic, S.; Guerrero, J.W.G.; Eftekhari-Zadeh, E.; Nazemi, E.; Iliyasu, A.M. Applying Data Mining and Artificial Intelligence Techniques for High Precision Measuring of the Two-Phase Flow’s Characteristics Independent of the Pipe’s Scale Layer. Electronics 2022, 11, 459. [Google Scholar] [CrossRef]
- Eftekhari-Zadeh, E.; Bensalama, A.S.; Roshani, G.H.; Salama, A.S.; Spielmann, C.; Iliyasu, A.M. Enhanced Gamma-Ray Attenuation-Based Detection System Using an Artificial Neural Network. Photonics 2022, 9, 382. [Google Scholar] [CrossRef]
- Hosseini, S.; Setayeshi, S.; Roshani, G.H.; Zahedi, A.; Shama, F. Increasing efficiency of two-phase flowmeters using frequency feature extraction and neural network in detector output spectrum. J. Model. Eng. 2021, 19, 47–57. [Google Scholar]
- Mayet, A.M.; Alizadeh, S.M.; Kakarash, Z.A.; Al-Qahtani, A.A.; Alanazi, A.K.; Alhashimi, H.H.; Eftekhari-Zadeh, E.; Nazemi, E. Introducing a Precise System for Determining Volume Percentages Independent of Scale Thickness and Type of Flow Regime. Mathematics 2022, 10, 1770. [Google Scholar] [CrossRef]
- Roshani, S.; Jamshidi, M.B.; Mohebi, F.; Roshani, S. Design and modeling of a compact power divider with squared resonators using artificial intelligence. Wirel. Pers. Commun. 2021, 117, 2085–2096. [Google Scholar] [CrossRef]
- Mayet, A.M.; Alizadeh, S.M.; Nurgalieva, K.S.; Hanus, R.; Nazemi, E.; Narozhnyy, I.M. Extraction of Time-Domain Characteristics and Selection of Effective Features Using Correlation Analysis to Increase the Accuracy of Petroleum Fluid Monitoring Systems. Energies 2022, 15, 1986. [Google Scholar] [CrossRef]
- Roshani, S.; Azizian, J.; Roshani, S.; Jamshidi, M.; Parandin, F. Design of a miniaturized branch line microstrip coupler with a simple structure using artificial neural network. Frequenz 2022, 76, 255–263. [Google Scholar] [CrossRef]
- Alanazi, A.K.; Alizadeh, S.M.; Nurgalieva, K.S.; Nesic, S.; Grimaldo Guerrero, J.W.; Abo-Dief, H.M.; Eftekhari-Zadeh, E.; Nazemi, E.; Narozhnyy, I.M. Application of Neural Network and Time-Domain Feature Extraction Techniques for Determining Volumetric Percentages and the Type of Two Phase Flow Regimes Independent of Scale Layer Thickness. Appl. Sci. 2022, 12, 1336. [Google Scholar] [CrossRef]
- Roshani, G.; Hanus, R.; Khazaei, A.; Zych, M.; Nazemi, E.; Mosorov, V. Density and velocity determination for single-phase flow based on radiotracer technique and neural networks. Flow Meas. Instrum. 2018, 61, 9–14. [Google Scholar] [CrossRef]


| Input Layer | 2 Neurons |
| First hidden layer | 4 neurons |
| Output layer | 1 neuron |
| Epoch numbers | 250 |
| Activation function | Tansig |
| Input Layer | 2 Neurons |
| First hidden layer | 3 neurons |
| Second hidden layer | 3 neurons |
| Output layer | 1 neuron |
| Epoch numbers | 250 |
| Activation function | Tansig |
| Data | RMSE % | R2 |
|---|---|---|
| Training | 0.8697 | 0.9999 |
| Testing | 1.1527 | 0.9991 |
| Refs. | Technique | Predicted Volume Fractions (RMSE) |
|---|---|---|
| [8] Nazemi et al. | Total count | 2.12 |
| [15] Sattari et al. | Time-domain | 5.32 |
| [17] Hosseini et al. | Wavelet feature extraction | 1.92 |
| Current research | Frequency-domain | 1.1527 |
| Data Number | Flow Regime | Volume Fraction Percentages (Actual Values) | Void Fraction Percentages (Predicted by ANN) | Absolute Error between Simulated and Predicted Void Fractions |
|---|---|---|---|---|
| 1 | Annular | 5 | 5.00 | 0.00 |
| 2 | Annular | 10 | 9.99 | 0.00 |
| 3 | Annular | 20 | 20.03 | 0.03 |
| 4 | Annular | 25 | 24.96 | 0.03 |
| 5 | Annular | 35 | 34.95 | 0.04 |
| 6 | Annular | 40 | 40.06 | 0.06 |
| 7 | Annular | 45 | 44.99 | 0.00 |
| 8 | Annular | 55 | 54.95 | 0.04 |
| 9 | Annular | 60 | 60.10 | 0.10 |
| 10 | Annular | 65 | 64.84 | 0.15 |
| 11 | Annular | 75 | 75.30 | 0.30 |
| 12 | Annular | 80 | 79.64 | 0.35 |
| 13 | Annular | 90 | 90.36 | 0.36 |
| 14 | Stratified | 5 | 4.98 | 0.01 |
| 15 | Stratified | 10 | 10.11 | 0.11 |
| 16 | Stratified | 15 | 14.73 | 0.26 |
| 17 | Stratified | 20 | 20.26 | 0.26 |
| 18 | Stratified | 25 | 25.02 | 0.02 |
| 19 | Stratified | 35 | 34.95 | 0.04 |
| 20 | Stratified | 40 | 39.90 | 0.09 |
| 21 | Stratified | 50 | 50.00 | 0.00 |
| 22 | Stratified | 55 | 54.88 | 0.11 |
| 23 | Stratified | 65 | 65.37 | 0.37 |
| 24 | Stratified | 70 | 69.65 | 0.34 |
| 25 | Stratified | 80 | 80.10 | 0.10 |
| 26 | Stratified | 85 | 84.98 | 0.01 |
| 27 | Homogenous | 5 | 4.99 | 0.00 |
| 28 | Homogenous | 10 | 10.00 | 0.00 |
| 29 | Homogenous | 20 | 19.96 | 0.03 |
| 30 | Homogenous | 25 | 25.07 | 0.07 |
| 31 | Homogenous | 30 | 29.92 | 0.07 |
| 32 | Homogenous | 40 | 40.08 | 0.08 |
| 33 | Homogenous | 45 | 44.80 | 0.19 |
| 34 | Homogenous | 55 | 55.13 | 0.13 |
| 35 | Homogenous | 60 | 59.98 | 0.01 |
| 36 | Homogenous | 70 | 70.02 | 0.02 |
| 37 | Homogenous | 75 | 75.01 | 0.01 |
| 38 | Homogenous | 80 | 80.11 | 0.11 |
| 39 | Homogenous | 90 | 89.57 | 0.42 |
| Data Number | Flow Regime | Volume Fraction Percentages (Actual Values) | Void Fraction Percentages (Predicted by ANN) | Absolute Error between Simulated and Predicted Void Fractions |
|---|---|---|---|---|
| 1 | Annular | 15 | 14.91 | 0.09 |
| 2 | Annular | 30 | 30.63 | 0.63 |
| 3 | Annular | 50 | 48.84 | 1.16 |
| 4 | Annular | 70 | 71.65 | 1.65 |
| 5 | Annular | 85 | 83.28 | 1.72 |
| 6 | Stratified | 30 | 27.47 | 2.53 |
| 7 | Stratified | 45 | 45.94 | 0.94 |
| 8 | Stratified | 60 | 56.04 | 3.96 |
| 9 | Stratified | 75 | 76.94 | 1.94 |
| 10 | Stratified | 90 | 86.41 | 3.59 |
| 11 | Homogenous | 15 | 13.60 | 1.40 |
| 12 | Homogenous | 35 | 35.07 | 0.07 |
| 13 | Homogenous | 50 | 52.65 | 2.65 |
| 14 | Homogenous | 65 | 64.09 | 0.91 |
| 15 | Homogenous | 85 | 83.46 | 1.54 |
Publisher’s Note: MDPI stays neutral with regard to jurisdictional claims in published maps and institutional affiliations. |
© 2022 by the authors. Licensee MDPI, Basel, Switzerland. This article is an open access article distributed under the terms and conditions of the Creative Commons Attribution (CC BY) license (https://creativecommons.org/licenses/by/4.0/).
Share and Cite
Hosseini, S.; Iliyasu, A.M.; Akilan, T.; Salama, A.S.; Eftekhari-Zadeh, E.; Hirota, K. Accurate Flow Regime Classification and Void Fraction Measurement in Two-Phase Flowmeters Using Frequency-Domain Feature Extraction and Neural Networks. Separations 2022, 9, 160. https://doi.org/10.3390/separations9070160
Hosseini S, Iliyasu AM, Akilan T, Salama AS, Eftekhari-Zadeh E, Hirota K. Accurate Flow Regime Classification and Void Fraction Measurement in Two-Phase Flowmeters Using Frequency-Domain Feature Extraction and Neural Networks. Separations. 2022; 9(7):160. https://doi.org/10.3390/separations9070160
Chicago/Turabian StyleHosseini, Siavash, Abdullah M. Iliyasu, Thangarajah Akilan, Ahmed S. Salama, Ehsan Eftekhari-Zadeh, and Kaoru Hirota. 2022. "Accurate Flow Regime Classification and Void Fraction Measurement in Two-Phase Flowmeters Using Frequency-Domain Feature Extraction and Neural Networks" Separations 9, no. 7: 160. https://doi.org/10.3390/separations9070160
APA StyleHosseini, S., Iliyasu, A. M., Akilan, T., Salama, A. S., Eftekhari-Zadeh, E., & Hirota, K. (2022). Accurate Flow Regime Classification and Void Fraction Measurement in Two-Phase Flowmeters Using Frequency-Domain Feature Extraction and Neural Networks. Separations, 9(7), 160. https://doi.org/10.3390/separations9070160