Article

Modeling and Life Cycle Assessment of a Membrane Bioreactor–Membrane Distillation Wastewater Treatment System for Potable Reuse

1
Department of Chemical and Materials Engineering, University of Nevada, Reno, NV 89557, USA
2
Graduate Program of Hydrologic Sciences, University of Nevada, Reno, NV 89557, USA
3
Department of Civil and Environmental Engineering, University of Nevada, Reno, NV 89557, USA
*
Author to whom correspondence should be addressed.
Separations 2022, 9(6), 151; https://doi.org/10.3390/separations9060151
Submission received: 26 May 2022 / Revised: 9 June 2022 / Accepted: 10 June 2022 / Published: 13 June 2022
(This article belongs to the Special Issue Modeling, Simulation, and Optimization of Membrane Processes)

Abstract

:
Wastewater treatment for indirect potable reuse (IPR) is a possible approach to address water scarcity. In this study, a novel membrane bioreactor–membrane distillation (MBR-MD) system was evaluated to determine the environmental impacts of treatment compared to an existing IPR facility (“Baseline”). Physical and empirical models were used to obtain operational data for both systems and inform a life cycle inventory. Life cycle assessment (LCA) was used to compare the environmental impacts of each system. Results showed an average 53.7% reduction in environmental impacts for the MBR-MD system when waste heat is used to operate MD; however, without waste heat, the environmental impacts of MBR-MD are significantly higher, with average impacts ranging from 218% to 1400% greater than the Baseline, depending on the proportion of waste heat used. The results of this study demonstrate the effectiveness of the novel MBR-MD system for IPR and the reduced environmental impacts when waste heat is available to power MD.

1. Introduction

Water resource decline has become a global issue due to climate change, increasing populations, and other anthropogenic factors, with greater stress being placed on arid regions [1,2]. Global groundwater resources have experienced dramatic decline recently due to heavy withdrawals for farming, drinking water, and industrial use, and several major aquifers throughout the world are under extreme stress [1]. There has been a nearly 16-fold increase in populations experiencing water scarcity since the early 1900s [3], and there are currently 4 billion people experiencing water stress at least one month out of the year, and over 500 million people under chronic severe water stress [4].
This decline in available water resources and dramatic increase in global water stress has sparked a need for effective water resource management, with a major emphasis on reducing water consumption and implementing efficient potable and non-potable wastewater reuse schemes [5,6]. Recently, the treatment of municipal wastewater for indirect potable reuse (IPR) has gained increasing attention. Several cities have implemented tertiary wastewater treatment with advanced multibarrier processes (biological, chemical, and physical) such as micro/ultra/nano-filtration (MF, UF, and NF, respectively), advanced oxidation processes (AOP) by ultraviolet (UV) light, and reverse osmosis (RO) [7,8].
Membrane bioreactors (MBRs) are an increasingly popular secondary wastewater treatment method that may be suitable for potable reuse schemes. MBRs consist of a biological reactor (or a series of anaerobic, anoxic, and aerobic biological reactors with internal recycles) coupled with a submerged or side-stream MF/UF/NF membrane [9]. Whereas the biological treatment is effective at removing organic carbon, phosphorus, and ammonia [10], the membrane is effective against viruses and other macromolecules that may be present in the influent wastewater [11]. Compared to traditional secondary wastewater treatment methods such as conventional activated sludge (CAS), MBR systems exhibit higher removals of chemical oxygen demand (COD; 97%) [12,13], phosphate (PO43−; 98%) [14], total nitrogen (TN; 94%) [14], and total suspended solids (TSS; 99%) [13], which results in higher-quality effluent. Other benefits of MBRs over CAS include a smaller footprint [15] and less excess sludge production [16,17,18]. The main disadvantages of MBRs are membrane fouling and increased energy consumption [16,19]. Additionally, MBRs can be followed by post-treatment membrane processes such as reverse osmosis (RO) or membrane distillation (MD) to achieve higher-quality effluent. Although traditionally used for seawater desalination, MD has high average rejections for COD (98%) [20], PO43− (91%) [21], and TN (98%) [22]; MD post-treatment can result in high-quality effluent. Furthermore, the incorporation of MD with waste heat or solar thermal energy [23] makes it a more viable and energy-efficient alternative to RO.
Although the performance of MBR and MD for wastewater treatment and desalination, respectively, is well documented, information regarding the environmental impacts associated with these systems, especially for an MBR-MD hybrid system, is still limited. Life cycle assessment (LCA) is a method used to calculate the environmental impacts of a system over its entire life cycle, including construction, operation and maintenance, and materials manufacturing [24]. Previous studies have reported the low environmental impacts of MBRs compared to conventional wastewater treatment [25,26], with electricity consumption being the main contributor to impacts [27,28]. LCA studies of MD are more limited [29], though several studies have identified energy use as an important contributor to impacts when MD is used for the desalination of sweater [30,31]. In addition, the use of waste heat to operate MD can help alleviate impacts [30], though this potential reduction has not been formally studied.
The objective of this study was to develop analytical models for a novel MBR-MD system and an established IPR scheme (“Baseline”) consisting of conventional treatment, MF, RO, and UV-AOP processes. A life cycle inventory was developed using operational data obtained from physical and empirical models for each system, and an LCA was conducted to compare the environmental impacts of operating each system. In addition, the dependence of MD impacts on the utilization of waste heat was determined using reported literature values of MD energy consumption. The results of this study can help determine the environmental sustainability of different IPR treatment methods and assist in evaluating novel technologies for future applications.

2. Materials and Methods
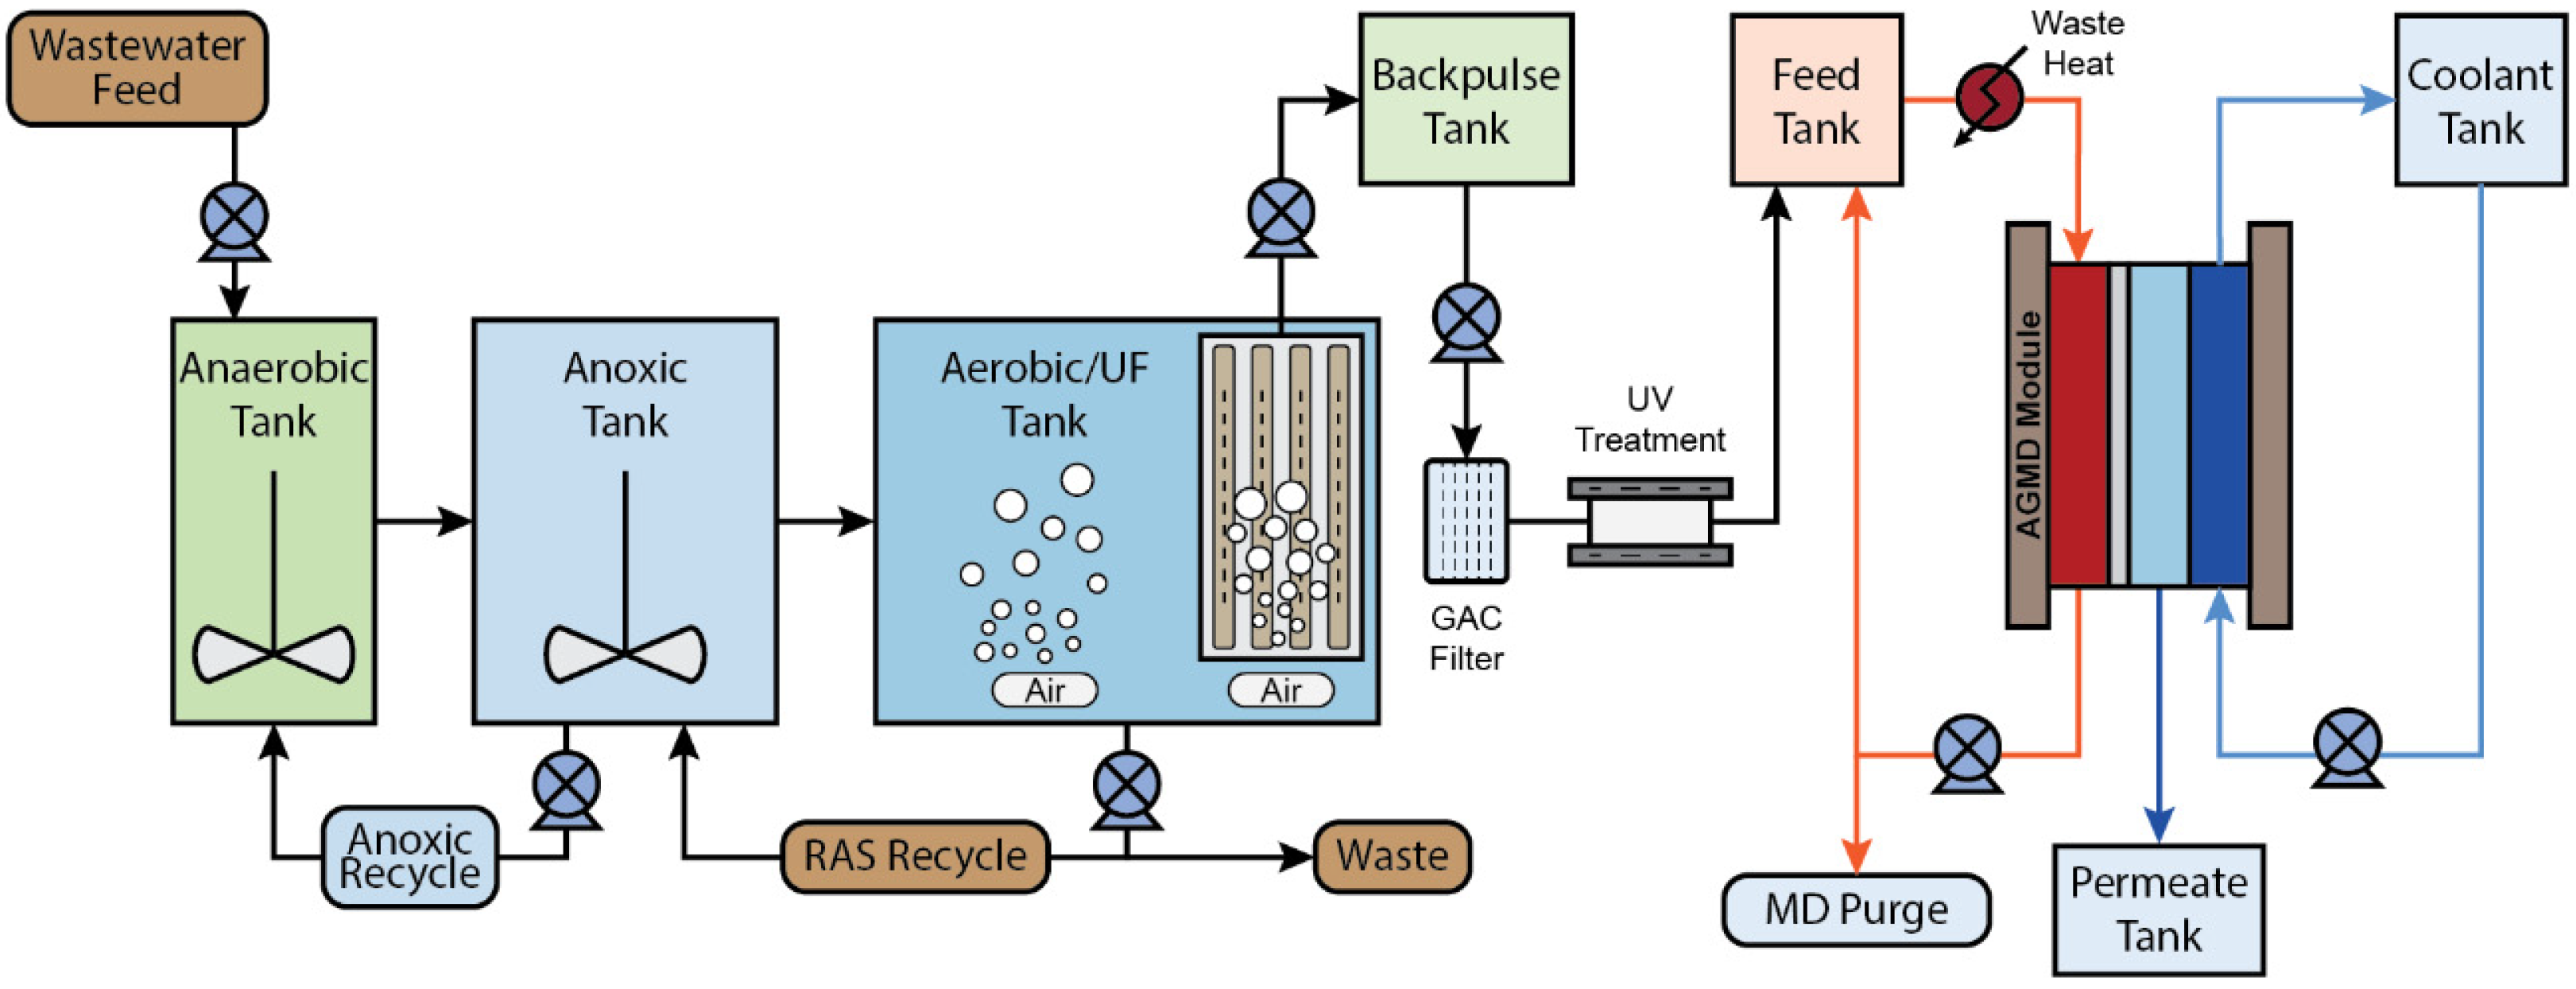
2.1. MBR-MD Process

The hybrid MBR-MD potable reuse process (Figure 1) is designed to treat medium-strength municipal wastewater (Table 1). The wastewater is pumped to the MBR at the anaerobic tank, and the effluent from the anaerobic tank passes to an anoxic tank where denitrification occurs. A portion of the sludge from the anoxic tank is then recirculated to the anaerobic tank (“Anoxic Recycle” in Figure 1). After being treated in the anoxic tank, the wastewater then moves to the aerobic tank for organic carbon removal, nitrification, and biological phosphorus uptake. A submerged UF membrane located in the aerobic tank rejects biomass and can aid in macromolecule and contaminant rejection. A mixed liquor/return activated sludge (RAS) recycle line recirculates nitrate to the anoxic zone for denitrification and helps maintains high biomass concentrations in the anoxic tank. The anoxic recycle recirculates biomass back to the anaerobic tank to assist with phosphorus removal. Excess sludge is wasted from the aerobic tank, sent through a belt filter press for dewatering, and then disposed of in a landfill.
Permeate through the UF passes through a granular activated carbon (GAC) filter to further remove organic carbon, and then through a low-pressure ultraviolet (UV) lamp system to remove bacteria/viruses. From the GAC/UV process, the water is sent to an air gap MD module where non-volatile organics are removed. An MD purge line recycles the concentrated MD feed solution back to the MD inlet or to disposal. The wastewater feed is heated prior to the MD system using waste heat, and the MD permeate, which is low in organic carbon and other water quality contaminants, is suitable for potable reuse standards.

2.2. MBR Modeling Process

The MBR modeling was performed primarily via the BioWin v.6.2 wastewater treatment modeling software (EnviroSim, Hamilton, ON, Canada). Inputs to the software included wastewater characteristics and flow, bioreactor volumes, recycle rates, and the required dissolved oxygen (DO) concentrations. Outputs from the software included effluent water quality, aeration energy demand, and sludge wasting. The BioWin model consisted of an anaerobic tank, an anoxic tank, an aerobic tank, and the UF module, with pumps and recycle loops included as shown in the process flow diagram (Figure 1). Energy demands for UV treatment, dewatering of the sludge waste, mixing, and pumping were calculated outside of BioWin and were determined from UV treatment system specifications, average literature values for the energy consumption of belt filter presses and bioreactor mixers, and Equation (1), respectively:
P s = Q ρ g Δ h 3.6 × 10 6 η + T M P × Q
where Ps is the total power consumed by the pump (kW), Q is the flow through the pump (m3/s), ρ is the fluid density (kg/m3), g is the gravitational constant (m/s2), ∆h is the pump differential head (m), η is the pump efficiency, and TMP is the transmembrane pressure (kPa) when the pump is connected to a UF or MF membrane. For each pump, a differential head of 1 m, an efficiency of 80%, and a fluid density equal to water (1000 kg/m3) were assumed. The TMP was dependent on the type of membrane and is tabulated in Tables S1 and S2. For the dewatering, UV treatment, and mixing energy consumption, values of 0.70 kWh per m3 of sludge [33], 0.055 kWh per m3 of treated water (determined from manufacturer specifications), and 0.055 kWh per m3 of treated water [34], respectively, were used. The UF membrane characteristics were based on the ZW 500 M membrane (SUEZ, Paramus, NJ, USA), and the UV characteristics were based on the S2Q-PA UV system (Viqua, Guelph, ON, Canada). Bioreactor dimensions, recycle rates, solids retention time (SRT), and DO concentrations were determined from [32] and are provided in Table S1. Influent wastewater quality parameters were modeled after a medium-strength municipal wastewater influent [32] and are shown in Table 1.

2.3. MD Modeling Process

The MD modeling process consisted of (1) a stepwise approach to determine the water flux across the MD membrane, the specific thermal energy consumption (STEC), and the pumping energy requirements; and (2) a bulk contaminant rejection model to predict the effluent quality from an MD module.
The stepwise modeling approach (Figure S1) was adopted from [35] to determine the output temperatures, heat flux, and water flux of the MD module. The thermophysical properties of saline and pure water were taken from [36] (Table S3). The STEC is defined as the amount of thermal energy required to produce a specified unit of volume of permeate (kWh/m3) and is used as an overall measure of the energy efficiency of the MD process. The STEC of the MD module (Equation (2)) was determined based on [37]:
S T E C = Q f e e d ρ f e e d c p , f e e d ( T f , i n T c , o u t ) 3.6 × 10 6 F p e r m
where Qfeed is the inlet feed flowrate (m3/day), ρfeed is the density of the inlet feed solution (kg/m3), cp,feed is the heat capacity of the inlet feed solution (J/kg-K), Tf,in is the temperature of the feed inlet (K), Tc,out is the temperature of the coolant outlet (K), and Fperm is the permeate production rate (L/h). The pumping energy for the MD system was determined using Equation (1) and the same values for the pump head and efficiency are outlined in Section 2.2.
The membrane characteristics used in the air gap MD model were based on a PURA-1 pilot system (Aquastill, Sittard, The Netherlands); membrane thickness, membrane pore size, membrane porosity, and membrane area are provided in Table S1. The MD module was operated in a counter-current flow regime, and the operating conditions for the MD model (Table S1) were based on [38], optimized to obtain a low STEC while still producing the desired amount of permeate to match the effluent flow from the MBR system. Due to the separation of the permeate and the coolant channels by an impermeable cooling plate in the MD configuration, seawater or other low-temperature process water can be used as a coolant, thus eliminating the need for additional energy consumption due to cooling [37]. For the MD modeling, it was assumed that process water at 20 °C was provided as a coolant; thus, the energy demands for the MD system were constrained to heating the MD feed and pumping the MD feed and coolant.
The bulk contaminant rejection model was developed from average literature values of the MD rejection of various contaminants present in the simulated wastewater feed (Table 2). A full list of the sources and rejection values are shown in Table S4. To determine the MD permeate water quality, the influent water quality concentrations to the MD system (UF permeate from the MBR) were multiplied by their respective average rejection values. The MD permeate was the final effluent from the MBR-MD system and was considered as the sole potable reuse stream.

2.4. Baseline Modeling Process

The Baseline system (Figure S2) was modeled after the Advanced Water Purification Facility (AWPF) developed by the Orange County Water District (OCWD) in Fountain Valley, California. This system is an advanced IPR scheme consisting of conventional wastewater treatment (primary clarifier followed by an aeration basin and secondary clarifier) conducted by the Orange County Sanitation District (OCSD), followed by MF, RO, and UV-AOP to produce high-quality water suitable for potable reuse. In 2019, the AWPF produced an average of 348,000 m3 of clean water per day. This effluent is sent to OCWD’s Groundwater Replenishment System (GWRS), where injection wells recharge several aquifers within the Orange County Groundwater Basin. To ensure a fair comparison between the two systems for the LCA, the same influent wastewater quality characteristics were used for the MBR-MD and Baseline systems (Table 1).
BioWin was used to model the conventional wastewater treatment and the WAVE v1.82 software (DuPont, Wilmington, DE, USA) was used to model the MF and RO systems. Inputs to the BioWin model were the influent wastewater quality and flow, clarifier and aeration tank volumes, DO concentration, chemical additions, and RAS recycle rate. The BioWin model consisted of a primary clarifier, an aerobic tank, and a secondary clarifier. Inputs to the WAVE model were the influent water quality and flow, RO recovery rate, RO and MF sizing, chemical additions, and membrane characteristics. The sizing of the primary clarifier, secondary clarifier, and aeration tank were calculated using Equations (3) and (4), respectively:
V c l = Q O R   h
V a e = S 0 Q V L
where Vcl is the volume of the clarifier (m3), Q is the influent wastewater flowrate (m3/day), OR is the overflow rate (m/day), h is the height of the clarifier (m), Vae is the volume of the aeration tank (m3), VL is the biochemical oxygen demand (BOD) loading rate (kg-BOD/m3/day), and S0 is the BOD concentration to the aerobic tank (kg/m3). The solids loading rate, clarifier height, and BOD loading rate were based on common values from [32] and are tabulated in Table S2. The BOD concentration to the aeration tank was assumed to be 250 mg/L and was based on the quality of the influent wastewater. The DO concentration in the aeration tank, SRT, and RAS rate were also based on common values for a conventional activated sludge process [32]. Ferric chloride (FeCl3) is used in the OCSD treatment process [39] and was therefore included in the BioWin model. The chemical concentration of FeCl3 in the BioWin model was determined from [40].
RO and MF recoveries specified in WAVE were based on OCWD operational values, and the RO membrane characteristics, amount of pressure vessels per element, and number of elements were taken from [7]. The MF membrane characteristics and sizing requirements were determined using standard values from the WAVE software that were then optimized to match the recovery of the MF system at OCWD. Chemical additions input to the WAVE software for the cleaning-in-place and backwashing of the RO and MF membranes were based on [7].
Combined outputs from both models included the aeration rate and energy consumption, MF and RO energy demand, effluent water quality, sludge wasting, RO concentrate flowrate, and total water production. Sludge was dewatered through belt filter presses and assumed to be landfilled for the Baseline. Although OCSD composts their excess sludge waste [39], the sludge waste disposal of the modeled Baseline was matched to that of the modeled MBR-MD system. Coastal conditions were assumed to dispose of the RO concentrate in an offshore location. The energy consumption for dewatering, pumping, and mixing for the conventional treatment process were calculated using the same methods as that of the MBR-MD system outlined in Section 2.3; the head and efficiency of each pump for the conventional treatment were kept identical to that of the MBR-MD system. To validate the Baseline model, operational data from OCWD/OCSD [7] and the 2019 GWRS Annual Report [41] were compared to the model outputs (energy consumption, effluent quality, waste, etc.) using the influent wastewater concentrations and flow to OCSD (Table S5).

2.5. Life Cycle Assessment

2.5.1. Goal and Scope

The goal of this LCA was to quantify the environmental impacts of a novel MBR-MD system and a conventional treatment system for indirect potable reuse of municipal wastewater. Output from the models described above were used to generate a life cycle inventory (LCI) and compare impacts from the MBR-MD and Baseline systems. The results of this study are intended to provide researchers and stakeholders with information on the sustainability of the MBR-MD system for indirect potable reuse relative to established technologies. In addition, areas of high impact within the MBR-MD treatment train were identified and mitigation strategies discussed. The LCA followed ISO 14040 [42] standards and was performed using SimaPro (PhD version 9.1.1.1). Because the function of each system was to produce water for indirect potable reuse applications, the functional unit was set to 1 m3 of product water from each system.

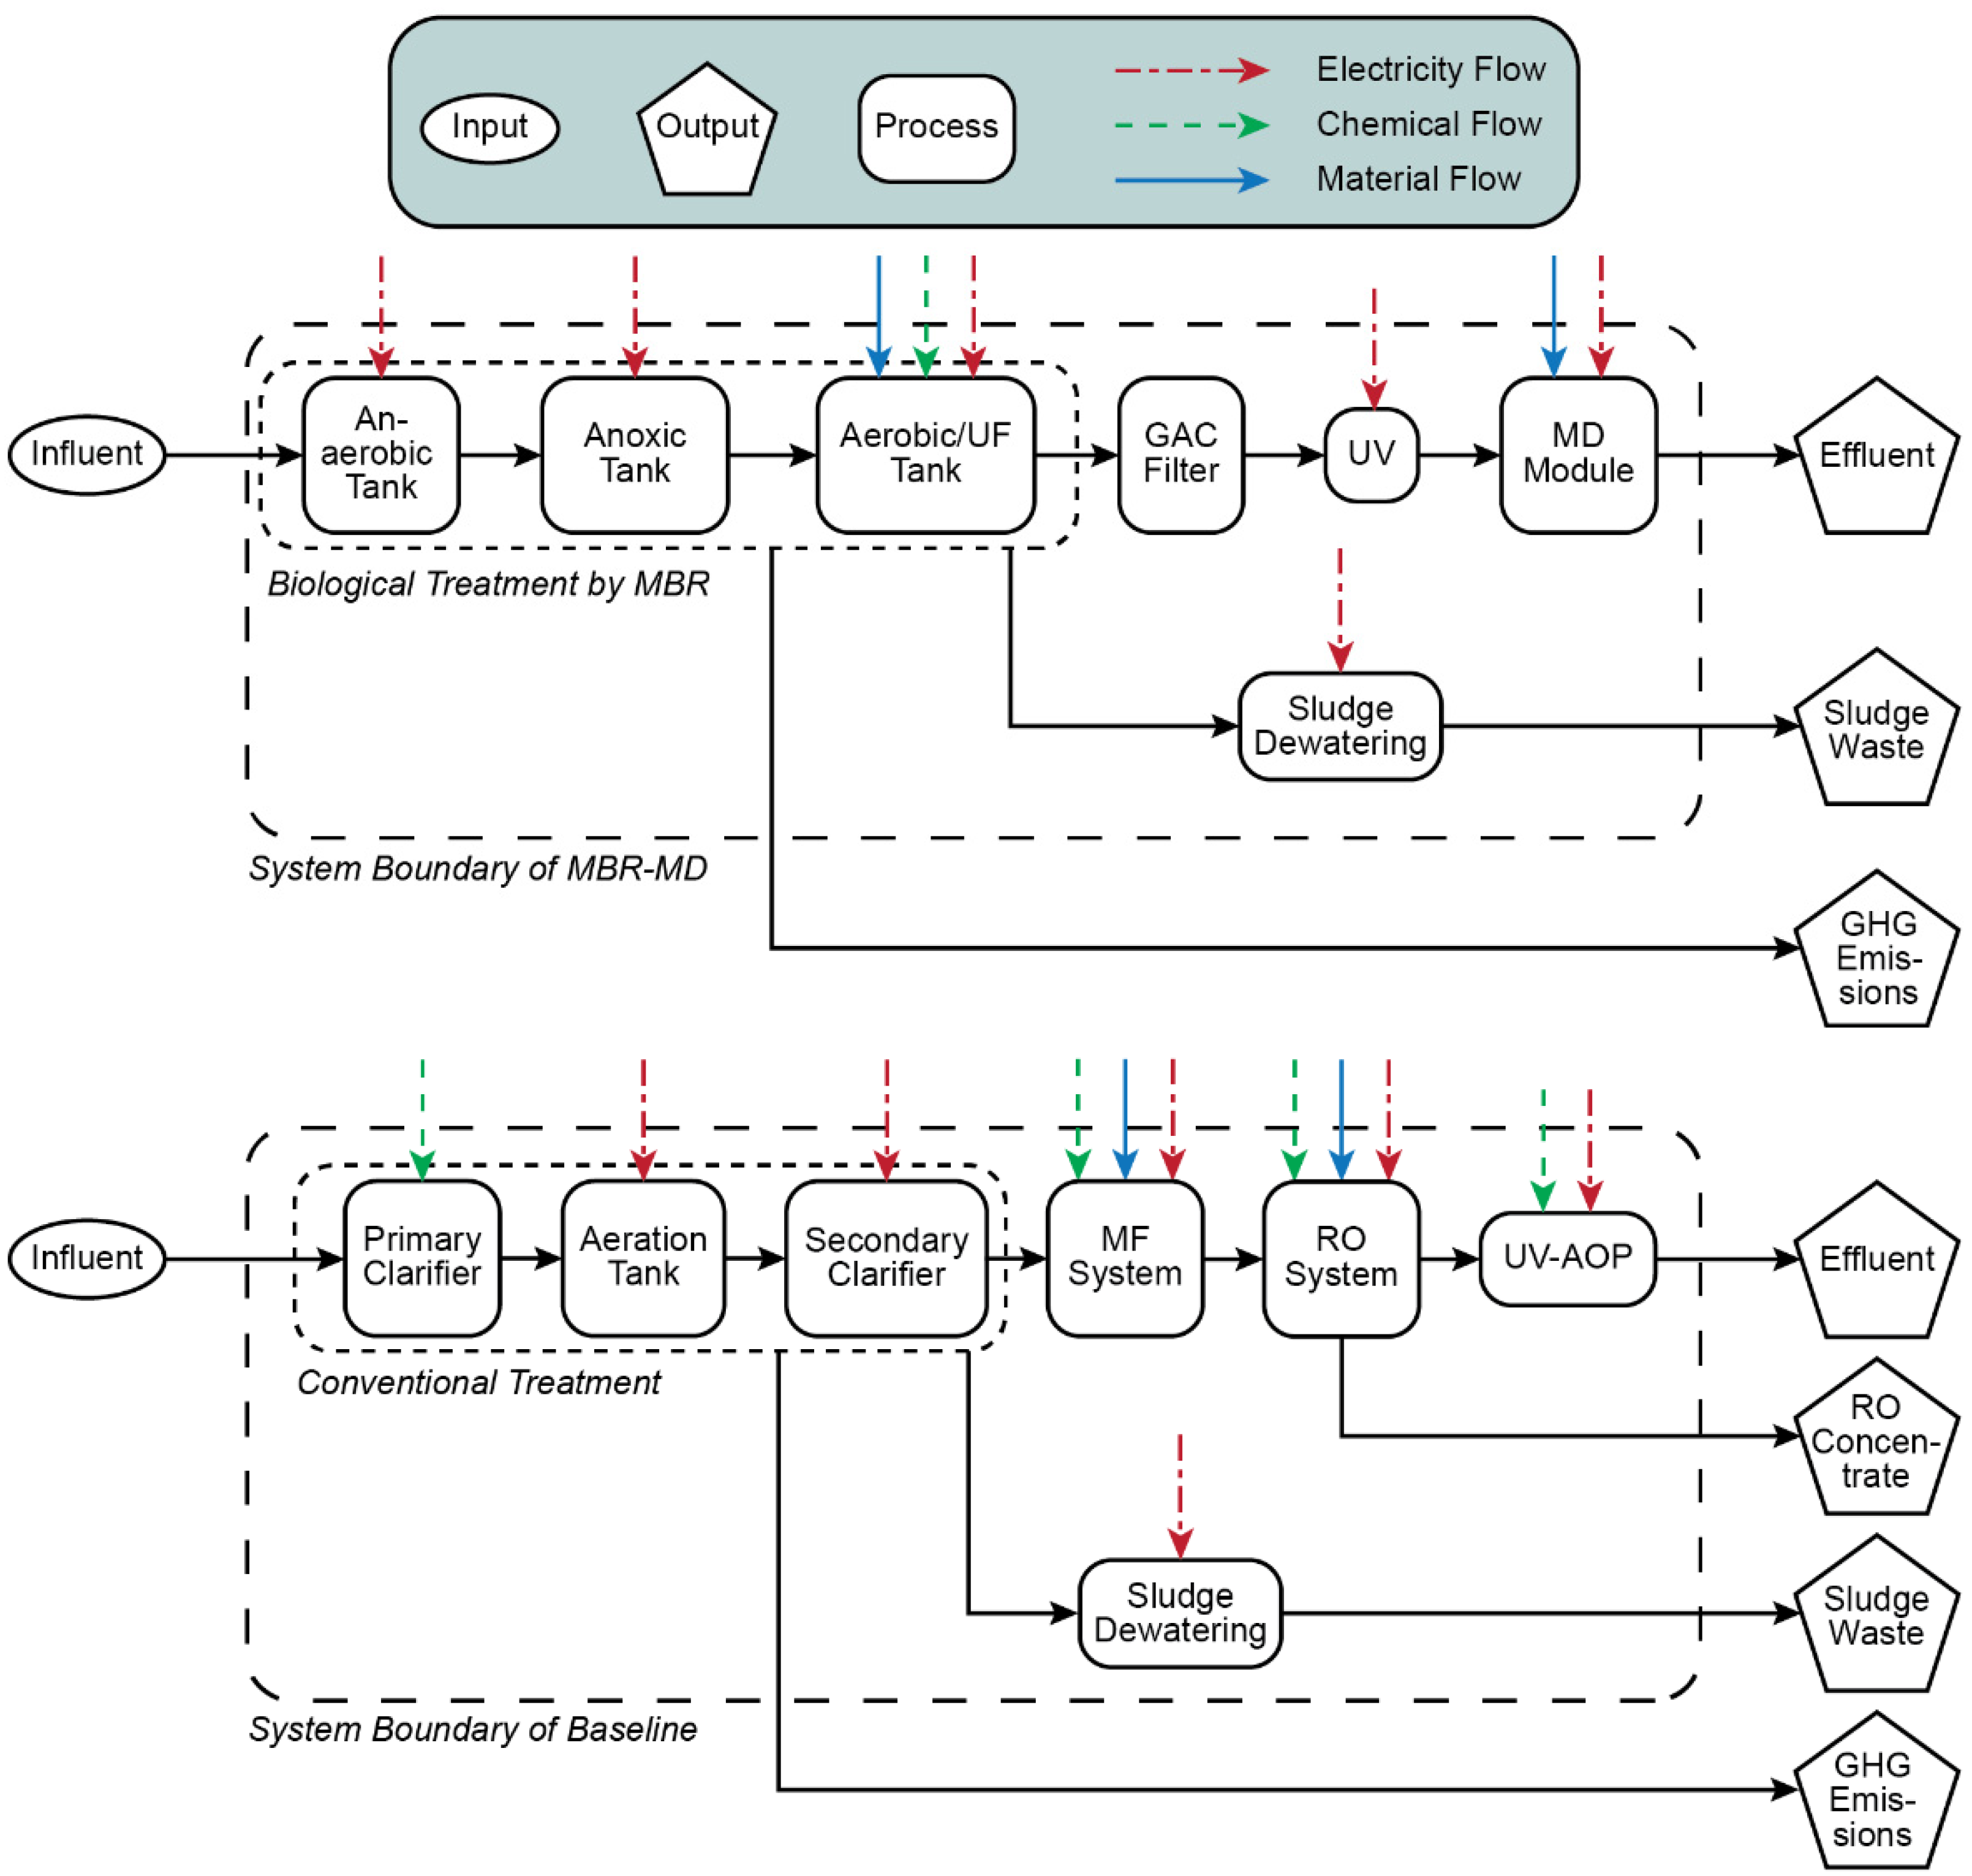
2.5.2. System Boundaries

The system boundaries for the MBR-MD and Baseline systems are shown in Figure 2; the inputs, outputs, different processes for each system, and the electricity, chemical, and material flows for each treatment process are depicted. The main flows to the MBR-MD system are electricity for each subsystem (MBR, UV, and MD), material flows for the MBR and MD membranes, and chemical flows for the cleaning of the MBR membrane. The outputs consist of direct GHG emissions (CH4 and N2O) from the biotreatment, sludge waste, and the effluent discharge. For the Baseline, the conventional treatment includes chemical additions and electricity for aeration, while the MF, RO, and UV-AOP systems have material flows for the membranes and UV lamps. The outputs for the Baseline consist of the RO concentrate, direct GHG emissions, sludge waste, and the effluent discharge.
It was assumed that the direct CH4 and N2O emissions from the biotreatment were completely discharged into the atmosphere, rather than utilizing any GHG-capturing technologies. It was also assumed that the treated effluent from both the Baseline and MBR-MD systems was discharged to groundwater for IPR. The materials acquisition, construction, and decommissioning of the plants were excluded from the system boundaries to focus solely on the operation of the two systems.

2.5.3. Life Cycle Inventory

The detailed life cycle inventories (LCI) for both the MBR-MD and Baseline systems are provided in Table 3.
The study period for the LCA was 1 year to neglect any effects of maintenance or repair and to focus solely on the environmental impacts due to system operations. The MF, UF, and RO membranes were replaced at a rate of 1/10th of the total membranes per year due to their 10-year lifespan [43,44]. The MD membranes were replaced at a rate of 1/5th of the total membranes per year due to their 5-year lifespan, as used in other LCA studies [30]. Membrane modules for UF, MF, and RO were based on available processes in the ecoinvent database. The MD modules were based on inventory data presented in [30].
Electricity production was modeled using the energy mix in the US portion of the Western Electricity Coordinating Council (WECC) in the ecoinvent database. The amount of grid electricity used for the MD system was varied to account for different amounts of waste heat available to heat the feed stream; different LCA scenarios were run according to the MD grid electricity consumption (Table S6). Due to the small scale of the MBR-MD system, it was assumed that the system could be located close to a power plant that would supply the needed waste heat. This assumption is in line with the literature, as several different studies have investigated the performance and feasibility of MD operated with power plant or natural gas compressor station waste heat streams [45,46,47,48]. For this study, literature values for waste heat available at power plants were scaled to the effluent flow of OCWD to demonstrate that adequate waste heat can be reasonably obtained to operate MBR-MD in a hypothetical full-scale system.
The waste sludge’s disposal to landfill and chemical additions were input to the LCA using the ecoinvent v3.8 and US Life Cycle Inventory databases [49,50]. Both the MBR-MD and Baseline system use biological treatment to treat the influent wastewater; thus, the sludge compositions for both systems were assumed to be equivalent. Direct GHG emissions from the biotreatment for both the Baseline and MBR-MD processes were calculated using specific emissions factors for methane (CH4) and nitrous oxide (N2O) from wastewater treatment. These emissions factors, defined as the amount of CH4 or N2O produced from the concentration of COD or Total Kjeldahl Nitrogen (TKN) in the influent, respectively, were determined from average literature values and are tabulated in Table S7. Although these emission factors may vary slightly depending on the different biological processes and operating conditions in the wastewater treatment facility [51], due to the similarity in the biological treatment by the MBR-MD and Baseline systems, these differences were considered negligible. Equations (5) and (6) were used to calculate the CH4 and N2O mass flowrates, respectively:
m C H 4 = E F C H 4 × C O D i n f .
m N 2 O = E F N 2 O × T K N i n f .
where m C H 4 and m N 2 O are the mass flowrates (kg/day) of CH4 and N2O, respectively, and E F C H 4 and E F N 2 O are the CH4 and N2O emissions factors (% of COD influent (CODinf); % of TKN influent (TKNinf)), respectively.

2.5.4. Impact Assessment Method

The ReCiPe midpoint (E) assessment method [52] was used for the life cycle impact assessment (LCIA). A total of 18 environmental impact categories were studied: global warming (GW), stratospheric ozone depletion (SOD), ionizing radiation (IR), ozone formation—human health (OFHH), fine particulate matter formation (FPMF), ozone formation—terrestrial ecosystems (OFTE), terrestrial acidification (TA), freshwater eutrophication (FEP), marine eutrophication (MEP), terrestrial ecotoxicity (TET), freshwater ecotoxicity, marine ecotoxicity (MET), human carcinogenic toxicity (HCT), human non-carcinogenic toxicity (HNCT), land use (LU), mineral resource scarcity (MRS), fossil resource scarcity (FRS), and water consumption (WC). The total environmental impacts of each item listed in Table 3 were organized into their respective class (chemicals, air emissions, water emissions, sludge disposal, membranes, and electricity), and then each class was analyzed for their respective contributions to each impact.

2.5.5. Uncertainty Analysis

An uncertainty analysis was conducted for the LCA using Monte Carlo simulation in SimaPro (PhD version 9.1.1.1) to determine uncertainty ranges in the impact category data based on changes in the LCI. Inventory values were varied by ±10% using uniform distributions for 1000 iterations in the simulation. The uncertainty range associated with each impact category is based on a 95% confidence interval, and the standard deviation of each distribution is reported with impact category data.

3. Results and Discussion

3.1. MBR-MD and Baseline Modeling

The final effluent water quality results and percent removal values for both systems were found to be similar (Figure 3), though the MBR-MD system achieves slightly lower effluent concentrations of COD, NH4–N, PO4–P, and TN compared to the Baseline. Percent removals are similar for both systems, with the MBR-MD system having generally higher efficiencies than the Baseline except for TON and TOC. Both systems meet water quality contaminant permits specified by OCWD as well as general wastewater discharge requirements for the parameters listed [32,41]. Modeling results for the pumping energy demand, aeration energy demand, and sludge wasting, along with dewatering, recycle, effluent, RO concentrate, and air flow rates for the MBR-MD and Baseline systems are provided in Tables S8 and S9, respectively.
The MBR-MD’s generally better effluent quality is likely due to slightly higher contaminant rejections for MD over RO [53,54] and the higher effluent quality obtained by MBRs compared to CAS. It is also possible that the MD contaminant rejections used (Table S4) were overestimated, as many of the rejection values were obtained from single-component or simple feed solution efforts. Compared to operational data from OCWD, the modeled effluent is marginally lower in ammonia and TOC while exhibiting slightly higher concentrations for phosphate, TN, and TON [41]. These slight discrepancies could be due to the model’s idealized nature and the subsequent exclusion of operational failures or issues such as MF/RO membrane fouling or scaling, pump malfunctions, or other equipment failures.
Based on the MBR-MD modeling results (Table S8) and LCI (Table 3), the heat required for MD has the highest energy demands, followed by the biological/membrane aeration and pumping. When 100% grid electricity (MBR-100) is used for MD heating, the total MBR-MD energy use is 175 kWh/m3, significantly higher than the 1.87 kWh/m3 required by the Baseline. However, if only waste heat is used for the MD heating (thus 0% grid electricity; MBR-MD-0) the available the MBR-MD system requires 0.837 kWh/m3, significantly less than the Baseline. For the MBR biological treatment, aeration of the aerobic tank and UF membranes requires 0.52 kWh/m3 of electricity and accounts for 62% of the non-MD heating energy demand, which is similar to that observed by others [34,55]. Accounting for the aeration, mixing, dewatering, and pumping processes, the total energy demand for the MBR is 0.60 kWh/m3, consistent with several other studies investigating the total energy consumption of MBR systems [34,56,57,58].
The STEC for the MD module was 174 kWh/m3 for the flowrates and specifications outlined in Table S1. STEC values of 90 to 300 kWh/m3 have been reported for MD, depending on operating conditions (flowrates, operating type (counter- or co-current), and feed/coolant temperatures) and membrane characteristics [37,59,60,61]. The feed/coolant flowrates and temperatures for the MD unit modeled in this study were optimized to obtain the lowest STEC possible while still producing the desired amount of permeate.
From the Baseline modeling results (Table S9) and LCI (Table 3), RO has the highest energy demand at 1.08 kWh/m3. Compared to the RO energy consumption of 0.46 kWh/m3 at OCWD [7], the modeled RO system is nearly twice as high (Table 3). Drinking water applications of RO can achieve SECs of around 0.6 kWh/m3 [62], while traditional desalination applications of RO exhibit much higher electricity consumption values of 2 to 5 kWh/m3 [63]. This discrepancy between the modeled and operational RO SEC values is likely due to the optimization and energy-efficient operation of the RO system by OCWD. Additionally, the RO model in WAVE was not optimized to obtain a lower SEC because it was necessary to keep the RO membrane and sizing inputs in WAVE equivalent to the OCWD system.
The next-highest energy demand for the Baseline system was the conventional treatment process, with a total SEC of 0.442 kWh/m3 (Table S9). Typical values for wastewater treatment energy consumption are 0.3 to 0.8 kWh/m3 [58,64,65], with larger wastewater treatment plants having lower SECs compared to smaller plants due to economy of scale [66]. Aeration is often considered the largest contributor to the electricity consumption in wastewater treatment plants, with values ranging from 50 to 80% of the total electricity consumption [67,68]. The total aeration energy consumption for the modeled conventional treatment process was 0.403 kWh/m3, or 91% of the total energy consumption, which is similar to other studies. A possible reason for the large aeration energy demand is the high DO concentration in the modeled aeration tank. Common DO concentrations for wastewater treatment vary from 2.0 to 4.0 mg/L, with higher DO concentrations generally providing increased nitrification rates and, thus, higher-quality effluent [17]. A high DO concentration was used in the model to ensure a higher-quality effluent for potable reuse of the effluent at the expense of higher aeration energy demand.
Although several MBR systems have reported lower energy consumption values compared to conventional treatment systems at <0.4 kWh/m3 [55,69], it is generally recognized that MBR systems have higher SECs compared to CAS or other traditional wastewater treatment processes due to the added aeration and pumping for the membranes [58]. Thus, the lower observed total aeration energy demand for the conventional treatment (0.403 kWh/m3) compared to the MBR (0.520 kWh/m3) was expected, and is similar to other reported values [34,58,67,68].
The total pumping energy for the conventional treatment process was 0.0094 kWh/m3 or 0.50% of the total energy demand. Previous studies have estimated pumping to be within 9 to 15% of the total wastewater treatment plant energy demand [64,70,71]. This discrepancy between the reported literature values and the modeled conventional treatment pumping energy demand could be due to the small pumping head values (1 m) or above-average pump efficiencies (80%) used in Equation (1). The pumping energy demand for the MBR (0.049 kWh/m3) was about 5-times greater than the conventional treatment process. This value is significantly higher due to the higher mixed liquor/RAS recycle rate in the MBR (300% of influent), as well as the added anoxic to anaerobic recycle rate in the MBR (200% of influent).
For the Baseline system, the MF module had a total energy consumption of 0.26 kWh/m3 (Table S9), which is slightly higher than the 0.23 kWh/m3 MF energy consumption from OCWD operational data [7]. This small discrepancy is likely due to the optimization and energy-efficient operation of the MF system by OCWD, similar to the discrepancies in the modeled and existing RO systems. Additionally, the MF sizing and other operational parameters were determined using default values in WAVE that could impact the total energy consumption. The MF membranes used in WAVE were also based on matching the MF recovery to that of OCWD; using different MF membranes in the modeling process could have impacted the total energy consumption as well. Previous studies have estimated the average energy consumption of MF/UF systems to be around 0.2 kWh/m3 [62], which is in agreement with operational and modeled data from OCWD and WAVE, respectively.
Similar to the MBR, sludge wasting from the conventional treatment process is dependent on the SRT. Typical SRTs for conventional activated sludge are 3 to 15 days, in line with the modeled conventional treatment process SRT [17]. Sludge wasting values for the modeled system would, therefore, be similar to wastewater treatment plants with an equivalent SRT. Compared to the MBR-MD system, the Baseline has much higher scaled sludge waste (0.198 kg compared to 0.331 kg, respectively, Table 3) due to the lower SRT of the Baseline system compared to MBR-MD (6 and 12 days, respectively), as well as the additional solids from the primary clarifier in the conventional treatment process. Compared to CAS, MBR systems have demonstrated less excess sludge waste [15,16,17,18,19]; therefore, the modeled systems fall within the ranges in the literature. The energy consumption from sludge dewatering is less for the MBR-MD system compared to the Baseline (0.027 and 0.03 kWh/m3, respectively, Tables S8 and S9) due to lower volumetric and mass flowrates of the sludge. Scaled values for the direct gas emissions from the conventional treatment process were also significantly higher compared to the MBR listed in Table 3 (0.463 kg compared to 0.328 kg, respectively; see Table 3).

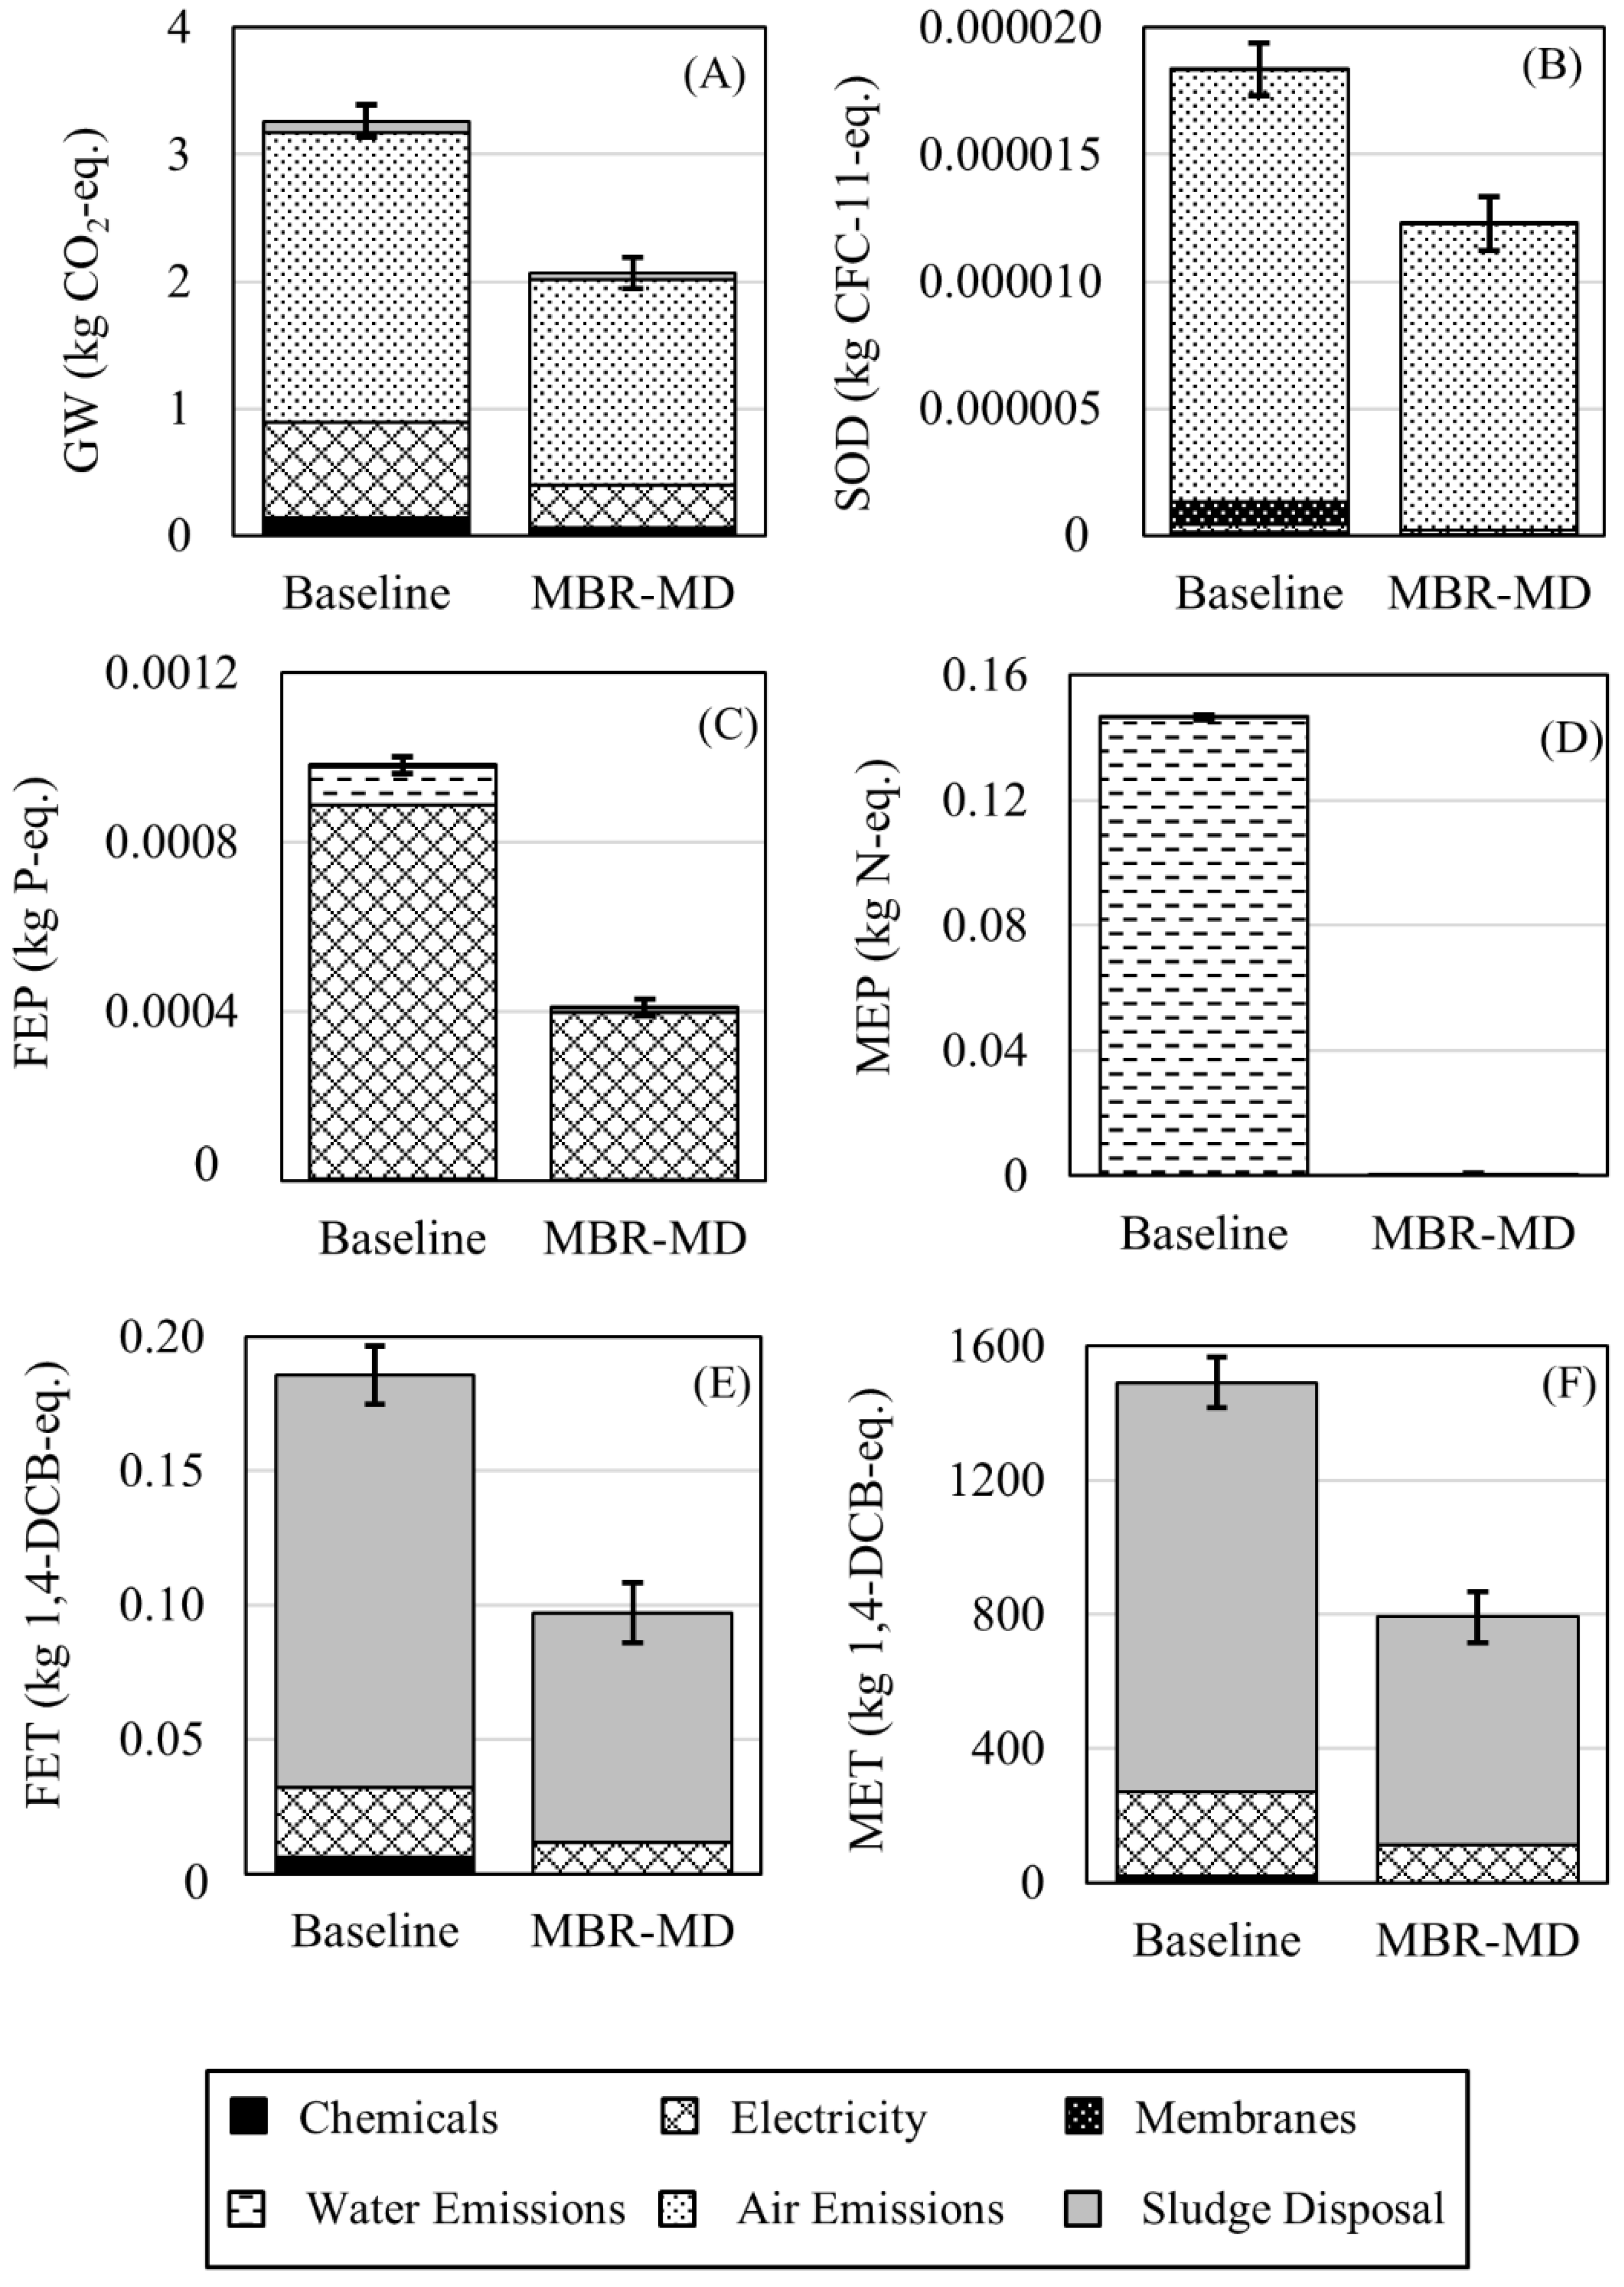
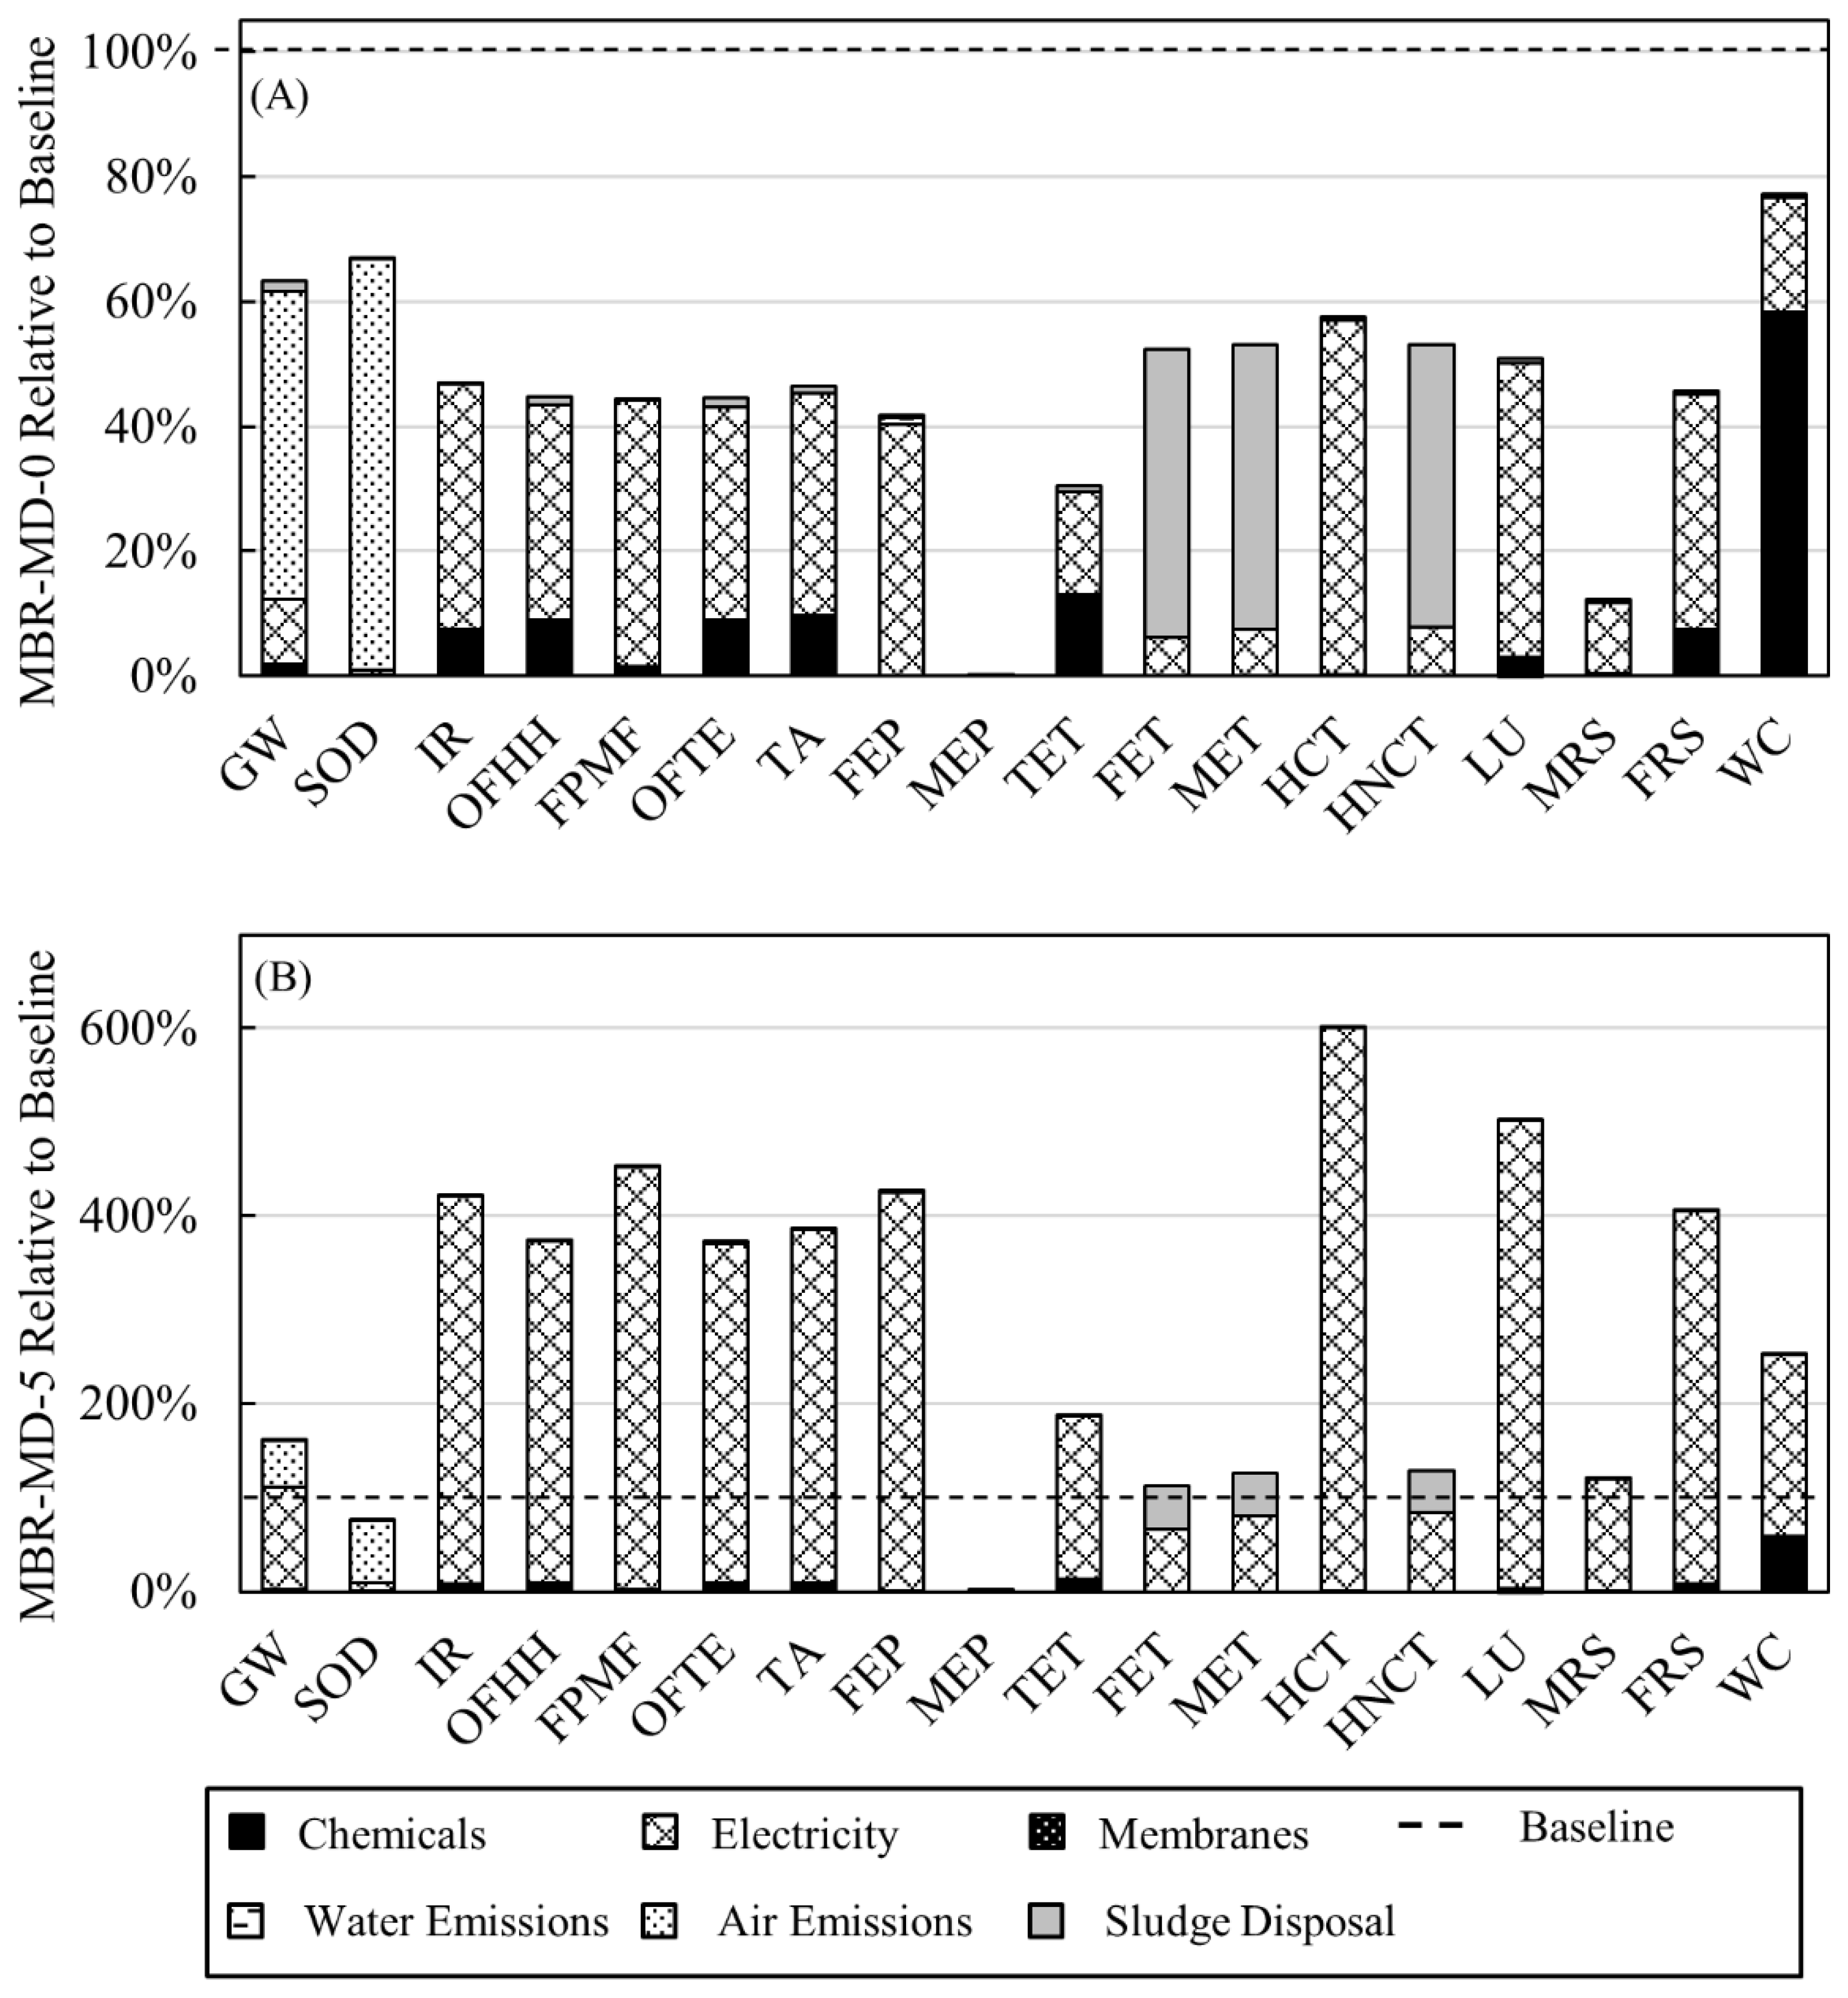
3.2. Environmental Impacts

Environmental impacts due to energy consumption, chemical additions, direct gas emissions, water emissions, and sludge waste from both systems were calculated and compared using the ReCiPe Midpoint (E) impact assessment method. Results for the MBR-MD system in all impact categories are shown in Figure 4 as a percentage relative to the value for the Baseline system. Results for the Baseline and MBR-MD-0 scenarios are shown separately in Figures S3 and S4, respectively. When waste heat is used to satisfy 100% of the MD energy requirements (MBR-MD-0), the MBR-MD impacts are lower than the Baseline in all categories (Figure 4A). Electricity consumption for non-MD processes is the dominant contributor to impacts in 9 of the 18 categories, while air emissions are the largest contributors in GW and SOD. Sludge disposal is the largest contributor to the FET, MET, MEP, and HNCT categories. Chemical additions are the largest contributor to WC and make up a small portion of impacts in eight other categories. Water emissions have minimal contribution to FEP. Membrane replacements do not significantly contribute to any impact category.
However, when grid electricity is used to supply a portion of the MD energy requirements, environmental impacts increase substantially. Figure 4B shows the MBR-MD impacts relative to the Baseline when grid electricity supplies only 5% of the MD energy requirements (MBR-MD-5). HCT shows the largest increase in this regard with total impacts at 600% of the Baseline. SOD and MEP are the only impact categories to maintain a total environmental impact less than the Baseline at 61.7% and 0.30%, respectively. For the 5% grid energy configuration, SOD is the only impact category where electricity consumption is not the largest contributor.
Six of the impact categories are examined in more detail for both systems (Figure 5). These six impact categories were selected because GW and SOD are valuable indicators for climate change; FEP and MEP are important categories for eutrophication often associated with wastewater effluents, and FET and MET were included due to the notable contribution of sludge waste on ecotoxicity. Environmental impacts for the MBR-MD-0 configuration were reduced by 31.0%, 44.8%, 50.9%, 99.9%, 43.2%, and 42.1% of the Baseline for the GW, SOD, FEP, MEP, FET, and MET, respectively.
The dominant processes contributing to environmental impacts vary depending on the category. The dominant contributor to GW is air emissions of CH4 released during biological treatment of the wastewater (Figure 5A) for both the Baseline (67% of the total system GW) and the MBR-MD system (75%). While N2O is also released during treatment, the amount is much smaller (Table 3), resulting in a negligible contribution to GW from N2O in both systems. Conversely, in the SOD category, N2O is the largest contributor (Figure 5B) due to the reported dominance of N2O as an ozone-depleting gas [72]. N2O contributes 93% and 98% of the total SOD and in the Baseline and MBR-MD, respectively. Air emissions are not a significant contributor to any other impact category.
After air emissions, the next-largest contributor to GW is electricity consumption (Figure 5A) at 23% of the total GW for the Baseline and 16% in MBR-MD. Electricity is also a major contributor to FEP for both systems (90% of the Baseline and 96% for MBR-MD). In the FET and MET categories, electricity is responsible for a smaller portion of impacts, with 14% of FET and 17% of MET in the Baseline and 12% of FET and 14% of MET in the MBR-MD system (Figure 5E,F). Electricity does not contribute to MEP in either system. Reducing electricity consumption for both systems could help improve impacts in many categories.
Water emissions are an important contributor to FEP and MEP due to the risk of eutrophication impacts when nitrogen and phosphorus are emitted to the environment. Water emissions contribute to the Baseline FEP with 9.3%, while in MBR-MD, water emissions only contribute 2.7% (Figure 5C). Reduced FEP with MBR-MD is due to the greater phosphorus removal achieved by the MBR system. Meanwhile, MEP is significantly higher in the Baseline than MBR-MD due to the offshore discharge of the RO concentrate. Since MEP only accounts for nitrogen emissions to marine water bodies, the largest contributors to the MEP for MBR-MD are the effluent NH4–N and organic nitrogen concentrations, while for the Baseline, the NH4–N and organic nitrogen in the RO concentrate dominate MEP with 99.8% of the impacts. FEP solely considers phosphorus emissions to freshwater bodies; therefore, the effluent PO4–P concentration is the only contributor to the water emissions impact [52]. Since the RO concentrate was disposed offshore, there are no freshwater eutrophication impacts from the Baseline. Due to the lower phosphorus concentrations as compared to nitrogen (Figure 3) for both the Baseline and MBR-MD systems, FEP impacts are much lower than MEP. Nitrogen and phosphorus have the largest impacts on aquatic ecosystems, specifically regarding eutrophication; thus, effluent PO4–P and NH4–N concentrations are closely monitored in wastewater treatment plants and should be carefully considered in potable reuse schemes.
Chemical additions are responsible for a small portion of GW, FET, and MET impacts (Figure 5). In GW, the Baseline chemical additions contribute 4.3%, while in MBR-MD chemicals account for 3.1%. In the Baseline FET and MET, chemicals contribute 3.4% and 1.3%, respectively, while in MBR-MD, the contribution of chemicals to these categories is negligible.
Sludge disposal is the dominant contributor of FET and MET in both systems (Figure 5E,F), accounting for 83% of FET and 82% of MET in the Baseline, and 88% and 86% of FET and MET, respectively, for the MBR-MD system. Sludge wasting for wastewater treatment processes is largely dependent on the SRT; thus, the higher SRT in the MBR-MD system is expected to lower the wasting rate and result in lower environmental impacts due to sludge waste compared to the Baseline.
For membrane replacement, the only significant contribution is by the RO membranes to SOD in the Baseline system with 5% of the impact category. MF membrane replacement has no noticeable impact on any impact category. In the MBR-MD system, replacement of UF and MD membranes has no significant contribution in any impact category.
These results are similar to those found in other MBR and MD studies. In an LCA comparing MBR to conventional treatment for fruit processing wastewater, sludge treatment was identified as the dominant contributor to 10 of the 18 categories in the ReCiPe method, including ecotoxicity categories, while the operation of the system (including electricity use) was the dominant contributor to seven of the 18 categories [73]. In addition, MBR performed better than conventional treatment in all impact categories, and MBR combined with tertiary treatment consisting of RO and UV performed best of all the scenarios considered [73]. MBR has also shown improved impacts in all categories when compared to CAS treatment for municipal wastewater [26]. MD is typically studied for the desalination of seawater; in existing studies, the environmental performance of MD is highly dependent on the source of heat or electricity [30,31].
To further emphasize the importance of utilizing waste heat rather than grid energy for MD, the environmental impacts of the MBR-MD system relative to the Baseline at varying percentages of grid energy are provided for GW, SOD, MET, FET, MEP, and FEP (Figure 6). Of these six impact categories, FEP was the most sensitive to the fraction of grid energy used in the MBR-MD system, with impacts equal to the Baseline at only 0.55% grid energy for MD. GW, MET, and FET show the next-largest increases, reaching 100% of the Baseline impacts at 1.4%, 2.5%, and 3.1% MD grid energy, respectively. SOD shows a more gradual increase, reaching 100% of the Baseline impacts at 31.7% MD grid energy. MEP was the least sensitive, reaching only 2.0% of the Baseline impacts at 50% MD grid energy. It should be noted that the other 12 impact categories were more sensitive to the amount of grid energy used (i.e., a steeper slope) than the six impact categories shown in Figure 6.
Most of the impact categories for both systems are heavily influenced by the overall electricity consumption (Figure 4 and Figure 5). Results for MBR-MD scenarios using a greater proportion of grid electricity (11% and 25%) are shown in Figures S5 and S6, respectively, relative to the Baseline. Several previous LCA studies of wastewater treatment plants have also reported this phenomenon [24,74,75]; however, using more sustainable electricity mixes (solar, geothermal, wind, hydro, etc.) has been shown to significantly lessen the environmental impacts due to electricity consumption [75]. Increased impacts for the MBR-MD system at higher MD grid energy percentages highlight the considerable unsustainability of MD without the incorporation of waste heat (Figure 4B and Figure 6). In cases where waste heat or solar thermal energy are abundant, MD has the unique benefit of being able to operate at a very low energy demand due to the small electricity consumption for the feed and coolant pumping [37]. In this study, the modeled specific electrical energy consumption for MD is just 0.076 kWh/m3, much lower than the 1.08 kWh/m3 required for the modeled RO system. MD has a clear advantage over RO regarding the specific electrical energy consumption. Furthermore, MD can be used specifically with low-quality waste heat (temperatures < 150 °C), which is a majority of waste heat discharged by industry, making the integration of MD with waste heat an extremely viable technology [76].

4. Conclusions

In this study, an LCA comparing the environmental impacts of a novel MBR-MD system to a baseline indirect potable reuse system consisting of conventional treatment, MF, RO, and UV-AOP was performed. The LCA results indicate that using waste heat for MD provides environmental benefits compared to the Baseline, while using grid energy to operate MD significantly increases environmental impacts. Operating a hybrid MBR-MD potable reuse system with 100% waste heat for MD can result in a more sustainable, environmentally friendly wastewater treatment system.
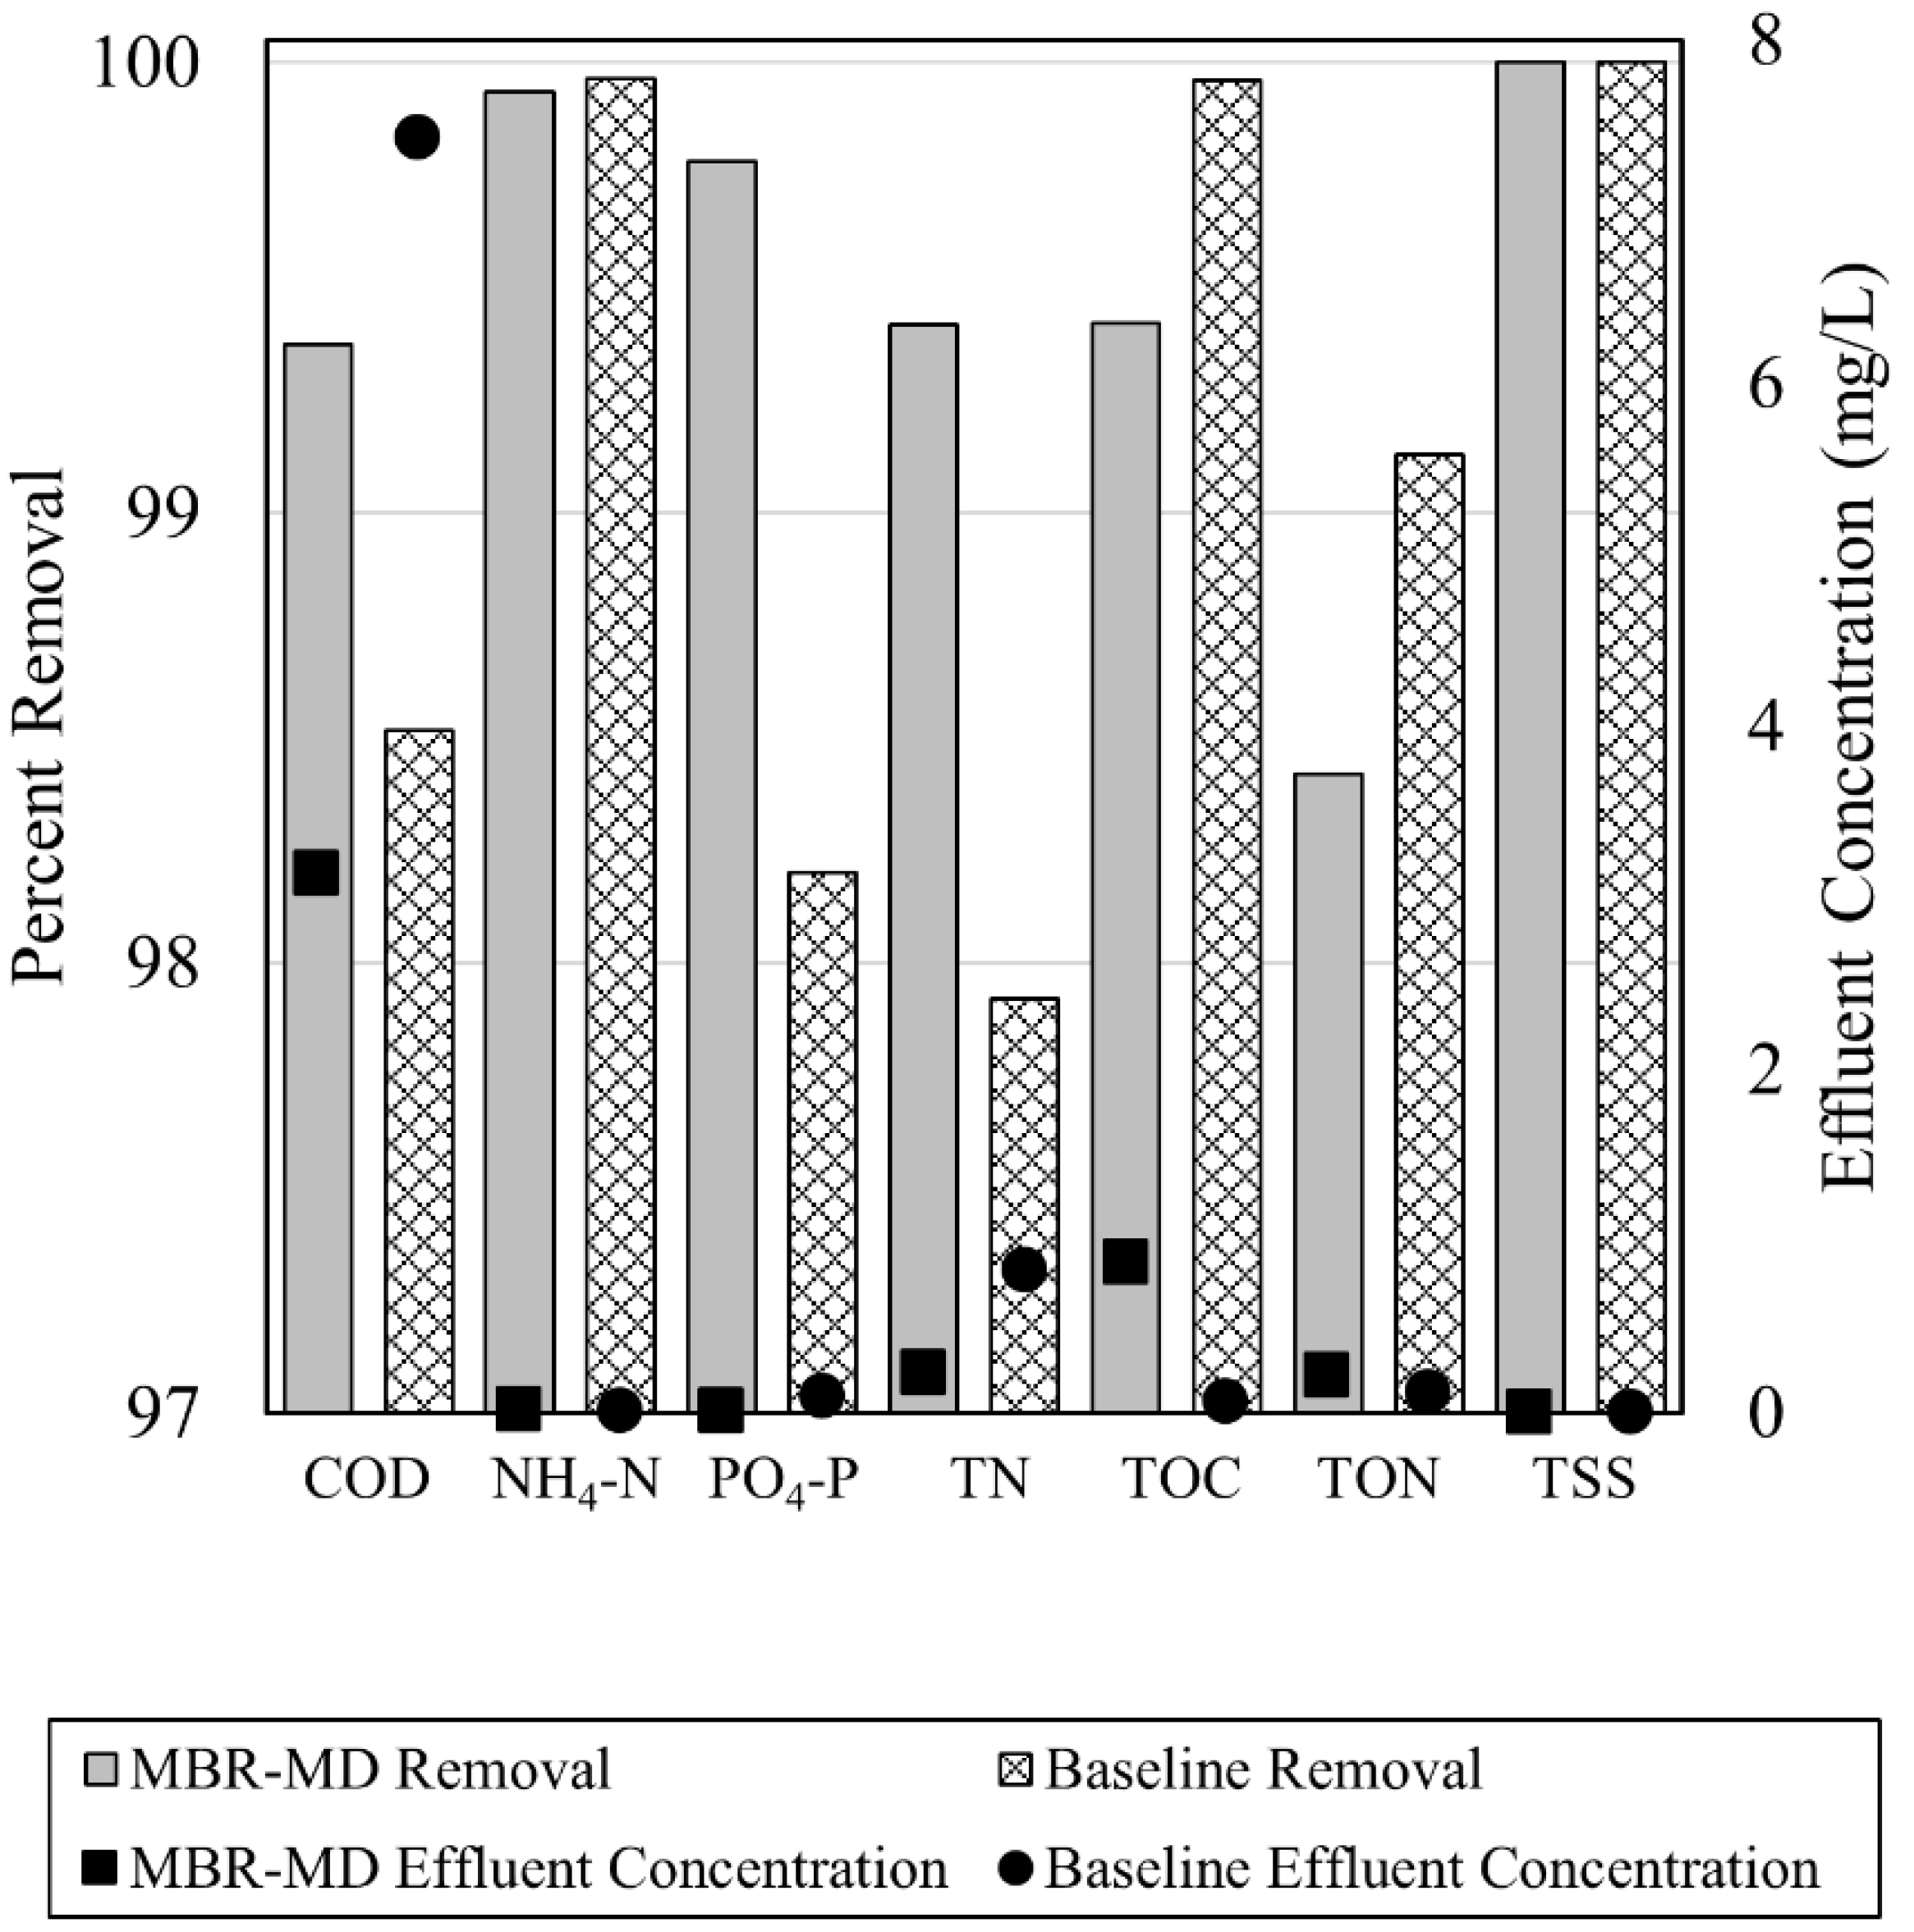
  • Effluent water quality of the MBR-MD and Baseline systems were comparable, with the MBR-MD system displaying generally lower concentrations of COD, TN, NH4–N, and PO4–P. Effluent water quality emissions were not a main contributor for any environmental impacts but did account for a small percentage of the FEP and MEP impact categories;
  • Direct GHG emissions and sludge wasting for MBR-MD are both lower than the Baseline due to more efficient biotreatment by the MBR;
  • Electricity consumption is the main driver behind the environmental impacts for both systems, with sludge wasting, chemical additions, and direct GHG emissions following behind;
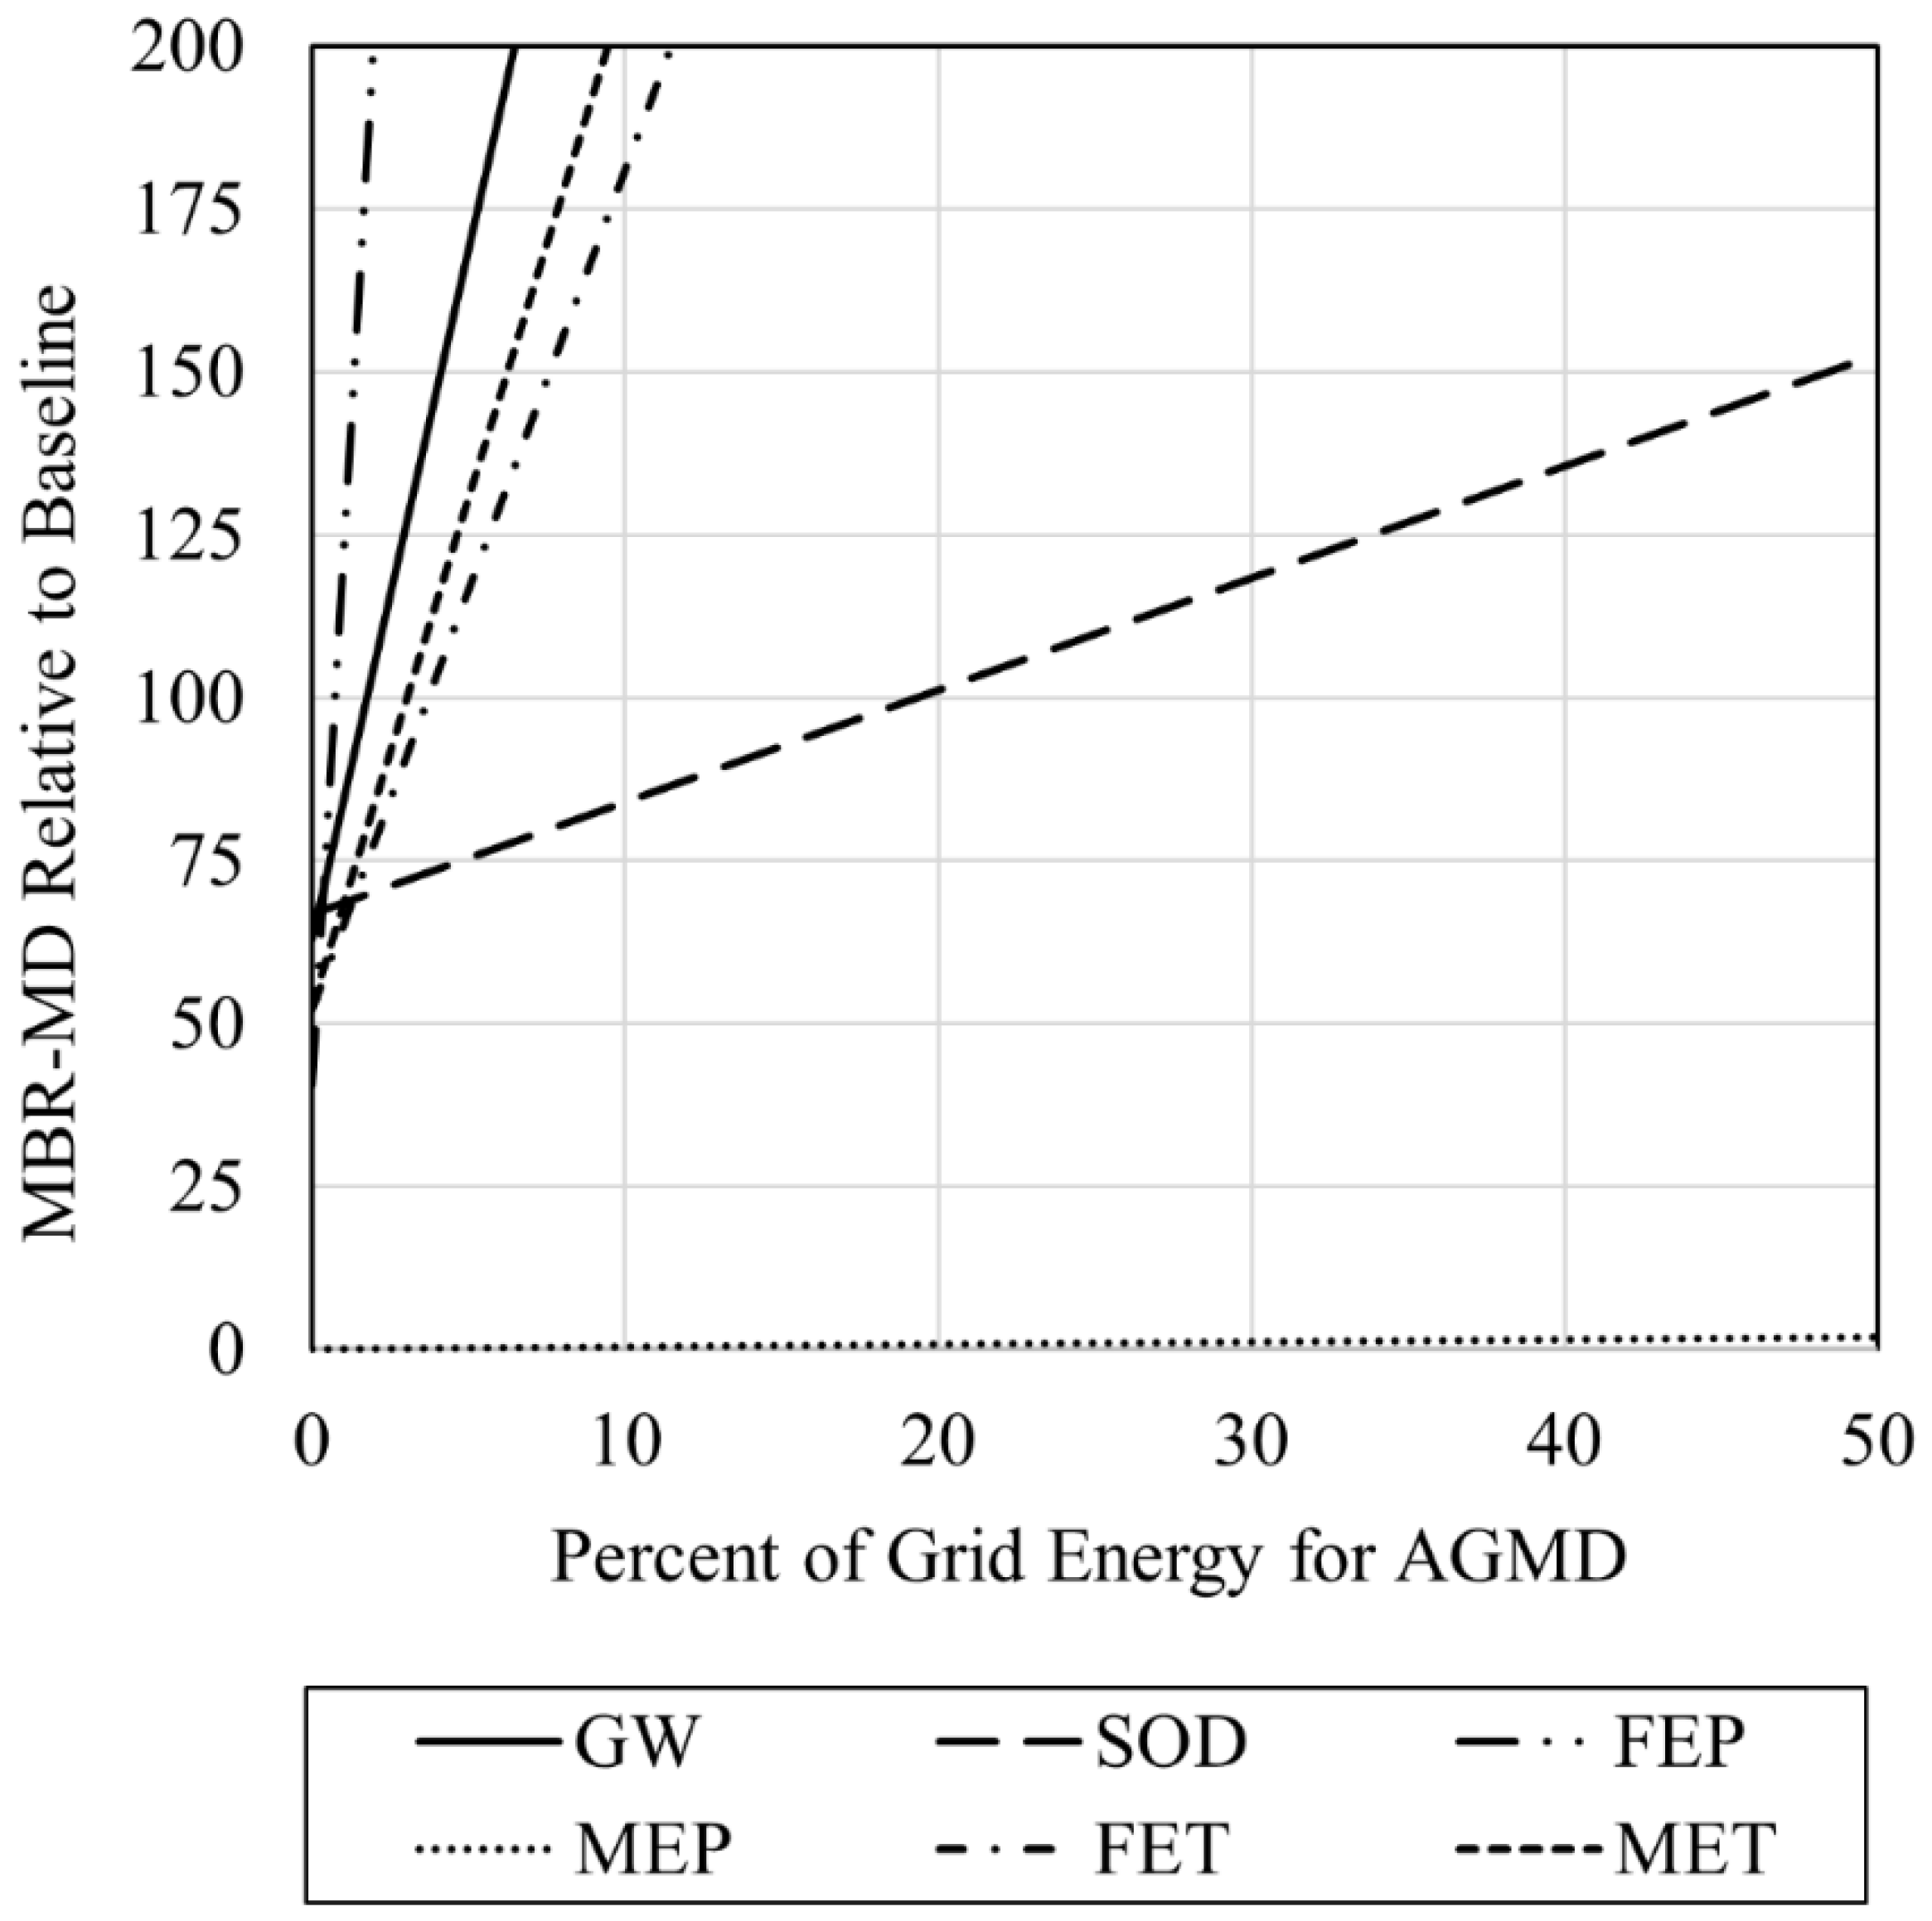
  • RO is the highest consumer of electricity for the Baseline, while the specific thermal energy consumption of the air gap MD sub-system consumes the most electricity for the MBR-MD system;
  • Using 0% grid energy (100% waste heat) for MD heating, environmental impacts for the MBR-MD system are lower for each impact category compared to the Baseline.

Supplementary Materials

The following supporting information can be downloaded at: https://www.mdpi.com/article/10.3390/separations9060151/s1, Table S1: System characteristics for the MBR-MD system; Table S2: System characteristics for the Baseline system; Figure S1: MD modeling process for a counter-current configuration; Table S3: Equations from Ref. [36] for the thermophysical properties of saline and pure water; Table S4: Rejections for common water quality contaminants; Table S5: Operational water quality data compared to modeled water quality data for the Baseline system; Table S6: Literature values for waste heat available from power plants; Table S7: Literature sources for the emissions factors; Figure S2: Process flow diagram for the Baseline system developed from OCSD and OCWD; Table S8: MBR-MD modeling results; Table S9: Baseline modeling results for the conventional treatment, MF, RO, and UV sub-systems; Figure S3: Percentage contributions to each impact category for the Baseline system. Figure S4: Percentage contributions to each impact category for the MBR-MD system. Figure S5: Percentage contributions to each impact category for the MBR-MD system scaled to the Baseline system using 11% grid energy for MD; Figure S6: Percentage contributions to each impact category for the MBR-MD system scaled to the baseline using 25% grid energy for MD [20,21,22,35,36,41,45,77,78,79,80,81,82,83,84,85,86,87,88,89,90,91,92,93,94,95,96,97,98,99,100,101,102,103,104,105,106].

Author Contributions

Conceptualization, S.R.H. and E.A.M.; methodology, S.R.H., E.A.M., J.A.P. and C.J.G.; software, J.A.P. and C.J.G.; validation, J.A.P.; formal analysis, J.A.P. and C.J.G.; investigation, J.A.P.; resources, S.R.H. and E.A.M.; data curation, J.A.P.; writing—original draft preparation, J.A.P. and C.J.G.; writing—review and editing, J.A.P., C.J.G., S.R.H. and E.A.M.; visualization, J.A.P.; supervision, S.R.H. and E.A.M.; project administration, S.R.H. and E.A.M.; funding acquisition, S.R.H. and E.A.M. All authors have read and agreed to the published version of the manuscript.

Funding

This research was funded in part by the Environmental Security Technology Certification Program (ESTCP) Award ER19-D1-5242.

Institutional Review Board Statement

Not applicable.

Informed Consent Statement

Not applicable.

Data Availability Statement

Data is contained within the article and supplementary material.

Acknowledgments

This research was funded in part by the Environmental Security Technology Certification Program (ESTCP) Award ER19-D1-5242. The authors would like to acknowledge Amy Childress and Andrea Achilli for assistance with developing the hybrid MBR-MD potable reuse train.

Conflicts of Interest

The authors declare no conflict of interest. The funders had no role in the design of the study; in the collection, analyses, or interpretation, of data; in the writing of the manuscript, or in the decision to publish the results.

References

  1. Richey, A.S.; Thomas, B.F.; Lo, M.-H.; Reager, J.T.; Famiglietti, J.S.; Voss, K.; Swenson, S.; Rodell, M. Quantifying Renewable Groundwater Stress with GRACE. Water Resour. Res. 2015, 51, 5217–5238. [Google Scholar] [CrossRef] [PubMed]
  2. Burek, P.; Satoh, Y.; Fischer, G.; Kahil, M.T.; Scherzer, A.; Tramberend, S.; Nava, L.F.; Wada, Y.; Eisner, S.; Flörke, M.; et al. Water Futures and Solution—Fast Track Initiative (Final Report); IIASA: Laxenburg, Austria, 2016. [Google Scholar]
  3. Kummu, M.; Guillaume, J.H.A.; de Moel, H.; Eisner, S.; Flörke, M.; Porkka, M.; Siebert, S.; Veldkamp, T.I.E.; Ward, P.J. The World’s Road to Water Scarcity: Shortage and Stress in the 20th Century and Pathways towards Sustainability. Sci. Rep. 2016, 6, 38495. [Google Scholar] [CrossRef] [PubMed] [Green Version]
  4. Mekonnen, M.M.; Hoekstra, A.Y. Sustainability: Four Billion People Facing Severe Water Scarcity. Sci. Adv. 2016, 2, e1500323. [Google Scholar] [CrossRef] [Green Version]
  5. Rodriguez, C.; Van Buynder, P.; Lugg, R.; Blair, P.; Devine, B.; Cook, A.; Weinstein, P. Indirect Potable Reuse: A Sustainable Water Supply Alternative. Int. J. Environ. Res. Public Health 2009, 6, 1174–1203. [Google Scholar] [CrossRef] [Green Version]
  6. Lautze, J.; Stander, E.; Drechsel, P.; da Silva, A.K.; Keraita, B. Global Experiences in Water Reuse; International Water Management Institute (IWMI): Colombo, Sri Lanka, 2014. [Google Scholar] [CrossRef]
  7. Holloway, R.W.; Miller-Robbie, L.; Patel, M.; Stokes, J.R.; Munakata-Marr, J.; Dadakis, J.; Cath, T.Y. Life-Cycle Assessment of Two Potable Water Reuse Technologies: MF/RO/UV-AOP Treatment and Hybrid Osmotic Membrane Bioreactors. J. Membr. Sci. 2016, 507, 165–178. [Google Scholar] [CrossRef] [Green Version]
  8. Bai, Y.; Shan, F.; Zhu, Y.; Xu, J.; Wu, Y.; Luo, X.; Wu, Y.; Hu, H.-Y.; Zhang, B. Long-Term Performance and Economic Evaluation of Full-Scale MF and RO Process—A Case Study of the Changi NEWater Project Phase 2 in Singapore. Water Cycle 2020, 1, 128–135. [Google Scholar] [CrossRef]
  9. Morrow, C.P.; McGaughey, A.L.; Hiibel, S.R.; Childress, A.E. Submerged or Sidestream? The Influence of Module Configuration on Fouling and Salinity in Osmotic Membrane Bioreactors. J. Membr. Sci. 2018, 548, 583–592. [Google Scholar] [CrossRef]
  10. Achilli, A.; Marchand, E.A.; Childress, A.E. A Performance Evaluation of Three Membrane Bioreactor Systems: Aerobic, Anaerobic, and Attached-Growth. Water Sci. Technol. 2011, 63, 2999–3005. [Google Scholar] [CrossRef]
  11. Carvajal, G.; Branch, A.; Sisson, S.A.; Roser, D.J.; van den Akker, B.; Monis, P.; Reeve, P.; Keegan, A.; Regel, R.; Khan, S.J. Virus Removal by Ultrafiltration: Understanding Long-Term Performance Change by Application of Bayesian Analysis. Water Res. 2017, 122, 269–279. [Google Scholar] [CrossRef]
  12. Isik, O.; Abdelrahman, A.M.; Ozgun, H.; Ersahin, M.E.; Demir, I.; Koyuncu, I. Comparative Evaluation of Ultrafiltration and Dynamic Membranes in an Aerobic Membrane Bioreactor for Municipal Wastewater Treatment. Environ. Sci. Pollut. Res. 2019, 26, 32723–32733. [Google Scholar] [CrossRef]
  13. Kitanou, S.; Hafida, A.; Soukaina, B.; Mahi, M.; Taky, M.; Elmidaoui, A. Performance of an Ultrafiltration Membrane Bioreactor (UF-MBR) in Wastewater Treatment. Desalin. Water Treat. 2019, 157, 393–398. [Google Scholar] [CrossRef] [Green Version]
  14. Phan, H.V.; Hai, F.I.; McDonald, J.A.; Khan, S.J.; Zhang, R.; Price, W.E.; Broeckmann, A.; Nghiem, L.D. Nutrient and Trace Organic Contaminant Removal from Wastewater of a Resort Town: Comparison between a Pilot and a Full Scale Membrane Bioreactor. Int. Biodeterior. Biodegrad. 2015, 102, 40–48. [Google Scholar] [CrossRef] [Green Version]
  15. Hoinkis, J.; Deowan, S.A.; Panten, V.; Figoli, A.; Huang, R.R.; Drioli, E. Membrane Bioreactor (MBR) Technology—A Promising Approach for Industrial Water Reuse. Procedia Eng. 2012, 33, 234–241. [Google Scholar] [CrossRef] [Green Version]
  16. Environmental Protection Agency. Wastewater Management Fact Sheet: Membrane Bioreactors; EPA: Washington, DC, USA, 2007. [Google Scholar]
  17. Davis, M.L. Water and Wastewater Engineering: Design Principles and Practice; McGraw-Hill Education: New York, NY, USA, 2010; ISBN 9780071713849. [Google Scholar]
  18. Viet, N.D.; Cho, J.; Yoon, Y.; Jang, A. Enhancing the Removal Efficiency of Osmotic Membrane Bioreactors: A Comprehensive Review of Influencing Parameters and Hybrid Configurations. Chemosphere 2019, 236, 124363. [Google Scholar] [CrossRef] [PubMed]
  19. Iorhemen, O.T.; Hamza, R.A.; Tay, J.H. Membrane Bioreactor (MBR) Technology for Wastewater Treatment and Reclamation: Membrane Fouling. Membranes 2016, 6, 33. [Google Scholar] [CrossRef] [PubMed] [Green Version]
  20. Shirazi, M.M.A.; Bazgir, S.; Meshkani, F. A Novel Dual-Layer, Gas-Assisted Electrospun, Nanofibrous SAN4-HIPS Membrane for Industrial Textile Wastewater Treatment by Direct Contact Membrane Distillation (DCMD). J. Water Process Eng. 2020, 36, 101315. [Google Scholar] [CrossRef]
  21. Song, X.; Luo, W.; McDonald, J.; Khan, S.J.; Hai, F.I.; Price, W.E.; Nghiem, L.D. An Anaerobic Membrane Bioreactor—Membrane Distillation Hybrid System for Energy Recovery and Water Reuse: Removal Performance of Organic Carbon, Nutrients, and Trace Organic Contaminants. Sci. Total Environ. 2018, 628–629, 358–365. [Google Scholar] [CrossRef] [Green Version]
  22. Luo, W.; Phan, H.V.; Li, G.; Hai, F.I.; Price, W.E.; Elimelech, M.; Nghiem, L.D. An Osmotic Membrane Bioreactor-Membrane Distillation System for Simultaneous Wastewater Reuse and Seawater Desalination: Performance and Implications. Environ. Sci. Technol. 2017, 51, 14311–14320. [Google Scholar] [CrossRef]
  23. Gustafson, R.D.; Hiibel, S.R.; Childress, A.E. Membrane Distillation Driven by Intermittent and Variable-Temperature Waste Heat: System Arrangements for Water Production and Heat Storage. Desalination 2018, 448, 49–59. [Google Scholar] [CrossRef]
  24. Chen, Z.; Wang, D.; Sun, M.; Hao Ngo, H.; Guo, W.; Wu, G.; Jia, W.; Shi, L.; Wu, Q.; Guo, F.; et al. Sustainability Evaluation and Implication of a Large Scale Membrane Bioreactor Plant. Bioresour. Technol. 2018, 269, 246–254. [Google Scholar] [CrossRef]
  25. Ortiz, M.; Raluy, R.G.; Serra, L. Life Cycle Assessment of Water Treatment Technologies: Wastewater and Water-Reuse in a Small Town. Desalination 2007, 204, 121–131. [Google Scholar] [CrossRef]
  26. Banti, D.C.; Tsangas, M.; Samaras, P.; Zorpas, A. LCA of a Membrane Bioreactor Compared to Activated Sludge System for Municipal Wastewater Treatment. Membranes 2020, 10, 421. [Google Scholar] [CrossRef] [PubMed]
  27. Kamble, S.; Singh, A.; Kazmi, A.; Starkl, M. Environmental and Economic Performance Evaluation of Municipal Wastewater Treatment Plants in India: A Life Cycle Approach. Water Sci. Technol. 2019, 79, 1102–1112. [Google Scholar] [CrossRef] [Green Version]
  28. Akhoundi, A.; Nazif, S. Life-Cycle Assessment of Tertiary Treatment Technologies to Treat Secondary Municipal Wastewater for Reuse in Agricultural Irrigation, Artificial Recharge of Groundwater, and Industrial Usages. J. Environ. Eng. 2020, 146, 04020031. [Google Scholar] [CrossRef]
  29. Alsebaeai, M.K.; Ahmad, A.L. Membrane Distillation: Progress in the Improvement of Dedicated Membranes for Enhanced Hydrophobicity and Desalination Performance. J. Ind. Eng. Chem. 2020, 86, 13–34. [Google Scholar] [CrossRef]
  30. Tarnacki, K.; Meneses, M.; Melin, T.; van Medevoort, J.; Jansen, A. Environmental Assessment of Desalination Processes: Reverse Osmosis and Memstill®. Desalination 2012, 296, 69–80. [Google Scholar] [CrossRef]
  31. Siefan, A.; Rachid, E.; Elashwah, N.; AlMarzooqi, F.; Banat, F.; van der Merwe, R. Desalination via Solar Membrane Distillation and Conventional Membrane Distillation: Life Cycle Assessment Case Study in Jordan. Desalination 2022, 522, 115383. [Google Scholar] [CrossRef]
  32. Metcalf & Eddy. Wastewater Engineering Treatment & Reuse; McGraw Hill: New York, NY, USA, 2003. [Google Scholar]
  33. Bill & Melinda Gates Foundation. Sludge Thickening, Dewatering and Drying Technologies. Gates Open Res. 2021, 5, 14. [Google Scholar] [CrossRef]
  34. Krzeminski, P.; Van Der Graaf, J.H.J.M.; Van Lier, J.B. Specific Energy Consumption of Membrane Bioreactor (MBR) for Sewage Treatment. Water Sci. Technol. 2012, 65, 380–392. [Google Scholar] [CrossRef]
  35. Noamani, S.; Niroomand, S.; Rastgar, M.; Azhdarzadeh, M.; Sadrzadeh, M. Modeling of Air-Gap Membrane Distillation and Comparative Study with Direct Contact Membrane Distillation. Ind. Eng. Chem. Res. 2020, 59, 21930–21947. [Google Scholar] [CrossRef]
  36. Sharqawy, M.H.; Lienhard, J.H.; Zubair, S.M. Thermophysical Properties of Seawater: A Review of Existing Correlations and Data. Desalin. Water Treat. 2010, 16, 354–380. [Google Scholar] [CrossRef]
  37. Duong, H.C.; Cooper, P.; Nelemans, B.; Cath, T.Y.; Nghiem, L.D. Evaluating Energy Consumption of Air Gap Membrane Distillation for Seawater Desalination at Pilot Scale Level. Sep. Purif. Technol. 2016, 166, 55–62. [Google Scholar] [CrossRef] [Green Version]
  38. Hardikar, M.; Marquez, I.; Phakdon, T.; Sáez, A.E.; Achilli, A. Scale-up of Membrane Distillation Systems Using Bench-Scale Data. Desalination 2022, 530, 115654. [Google Scholar] [CrossRef]
  39. Orange County Sanitation District. District Overview and Compliance: Introduction Compliance with NPDES Permit Requirements Waste Discharge Requirements for Sewage Collection Agencies; Orange County Sanitation District: Fountain Valley, CA, USA, 2005. [Google Scholar]
  40. Yang, X.-L.; Song, H.-L.; Chen, M.; Cheng, B. Characterizing Membrane Foulants in MBR with Addition of Polyferric Chloride to Enhance Phosphorus Removal. Bioresour. Technol. 2011, 102, 9490–9496. [Google Scholar] [CrossRef]
  41. Orange County Water District. Groundwater Replenishment System 2019 Annual Report; Orange County Water District: Fountain Valley, CA, USA, 2020. [Google Scholar]
  42. Klüppel, H. The Revision of ISO Standards 14040-3. Int. J. Life Cycle Assess. 2005, 10, 165. [Google Scholar] [CrossRef]
  43. Fenu, A.; De Wilde, W.; Gaertner, M.; Weemaes, M.; de Gueldre, G.; Van De Steene, B. Elaborating the Membrane Life Concept in a Full Scale Hollow-Fibers MBR. J. Membr. Sci. 2012, 421–422, 349–354. [Google Scholar] [CrossRef]
  44. Coutinho de Paula, E.; Amaral, M.C.S. Extending the Life-Cycle of Reverse Osmosis Membranes: A Review. Waste Manag. Res. 2017, 35, 456–470. [Google Scholar] [CrossRef]
  45. Dow, N.; Gray, S.; Li, J.; Zhang, J.; Ostarcevic, E.; Liubinas, A.; Atherton, P.; Roeszler, G.; Gibbs, A.; Duke, M. Pilot Trial of Membrane Distillation Driven by Low Grade Waste Heat: Membrane Fouling and Energy Assessment. Desalination 2016, 391, 30–42. [Google Scholar] [CrossRef]
  46. Lokare, O.R.; Tavakkoli, S.; Rodriguez, G.; Khanna, V.; Vidic, R.D. Integrating Membrane Distillation with Waste Heat from Natural Gas Compressor Stations for Produced Water Treatment in Pennsylvania. Desalination 2017, 413, 144–153. [Google Scholar] [CrossRef] [Green Version]
  47. Robbins, C.A.; Carlson, K.H.; Garland, S.D.; Bandhauer, T.M.; Grauberger, B.M.; Tong, T. Spatial Analysis of Membrane Distillation Powered by Waste Heat from Natural Gas Compressor Stations for Unconventional Oil and Gas Wastewater Treatment in Weld County, Colorado. ACS ES&T Eng. 2020, 1, 192–203. [Google Scholar] [CrossRef]
  48. Agamaliyev, M.M.; Ahmadova, J.A.; Aliyeva, O.O. Waste Heat Utilization of Diesel Power Plant Cooling System for Seawater Desalination by Membrane Distillation. Membr. Membr. Technol. 2022, 4, 48–58. [Google Scholar] [CrossRef]
  49. National Renewable Energy Laboratory. U.S. Life Cycle Inventory Database; NREL: Golden, CO, USA, 2012. [Google Scholar]
  50. Wernet, G.; Bauer, C.; Steubing, B.; Reinhard, J.; Moreno-Ruiz, E.; Weidema, B. The Ecoinvent Database Version 3 (Part I): Overview and Methodology. Int. J. Life Cycle Assess. 2016, 21, 1218–1230. [Google Scholar] [CrossRef]
  51. The Intergovernmental Panel on Climate Change. 2006 IPCC Guidelines for National Greenhouse Gas Inventories; Institute for Global Environmental Strategies (IGES): Kanagawa, Japan, 2006. [Google Scholar]
  52. Huijbregts, M.A.J.; Steinmann, Z.J.N.; Elshout, P.M.F.; Stam, G.; Verones, F.; Vieira, M.; Zijp, M.; Hollander, A.; van Zelm, R. ReCiPe2016: A Harmonised Life Cycle Impact Assessment Method at Midpoint and Endpoint Level. Int. J. Life Cycle Assess. 2017, 22, 138–147. [Google Scholar] [CrossRef]
  53. Lee, S.; Kim, Y.; Kim, A.S.; Hong, S. Evaluation of Membrane-Based Desalting Processes for RO Brine Treatment. Desalin. Water Treat. 2015, 57, 7432–7439. [Google Scholar] [CrossRef]
  54. Couto, C.F.; Santos, A.V.; Amaral, M.C.S.; Lange, L.C.; de Andrade, L.H.; Foureaux, A.F.S.; Fernandes, B.S. Assessing Potential of Nanofiltration, Reverse Osmosis and Membrane Distillation Drinking Water Treatment for Pharmaceutically Active Compounds (PhACs) Removal. J. Water Process Eng. 2020, 33, 101029. [Google Scholar] [CrossRef]
  55. Miyoshi, T.; Nguyen, T.P.; Tsumuraya, T.; Tanaka, H.; Morita, T.; Itokawa, H.; Hashimoto, T. Energy Reduction of a Submerged Membrane Bioreactor Using a Polytetrafluoroethylene (PTFE) Hollow-Fiber Membrane. Front. Environ. Sci. Eng. 2018, 12, 1. [Google Scholar] [CrossRef]
  56. Electric Power Research Institute. Water & Sustainability (Volume 4): U.S. Electricity Consumption for Water Supply & Treatment—The Next Half Century; Technical Report; EPRI: Palo Alto, CA, USA, 2002. [Google Scholar]
  57. Livingston, D. Beyond Conventional MBRs: Oxygen Transfer Technology Revolutionizing MBR Applications. In Proceedings of the Membrane Technology Conference & Exposition, San Diego, CA, USA, 12–15 July 2010. [Google Scholar]
  58. Bailey, J.R.; Ahmad, S.; Batista, J.R. The Impact of Advanced Treatment Technologies on the Energy Use in Satellite Water Reuse Plants. Water 2020, 12, 366. [Google Scholar] [CrossRef] [Green Version]
  59. Koschikowski, J.; Wieghaus, M.; Rommel, M.; Ortin, V.S.; Suarez, B.P.; Betancort Rodríguez, J.R. Experimental Investigations on Solar Driven Stand-Alone Membrane Distillation Systems for Remote Areas. Desalination 2009, 248, 125–131. [Google Scholar] [CrossRef]
  60. Banat, F.; Jwaied, N.; Rommel, M.; Koschikowski, J.; Wieghaus, M. Desalination by a “Compact SMADES” Autonomous Solarpowered Membrane Distillation Unit. Desalination 2007, 217, 29–37. [Google Scholar] [CrossRef]
  61. Zaragoza, G.; Ruiz-Aguirre, A.; Guillén-Burrieza, E. Efficiency in the Use of Solar Thermal Energy of Small Membrane Desalination Systems for Decentralized Water Production. Appl. Energy 2014, 130, 491–499. [Google Scholar] [CrossRef]
  62. Tow, E.W.; Hartman, A.L.; Jaworowski, A.; Zucker, I.; Kum, S.; AzadiAghdam, M.; Blatchley, E.R.; Achilli, A.; Gu, H.; Urper, G.M.; et al. Modeling the Energy Consumption of Potable Water Reuse Schemes. Water Res. X 2021, 13, 100126. [Google Scholar] [CrossRef] [PubMed]
  63. Kim, J.; Park, K.; Yang, D.R.; Hong, S. A Comprehensive Review of Energy Consumption of Seawater Reverse Osmosis Desalination Plants. Appl. Energy 2019, 254, 113652. [Google Scholar] [CrossRef]
  64. Electric Power Research Institute. Electricity Use and Management in the Municipal Water Supply and Wastewater Industries; EPRI: Palo Alto, CA, USA, 2013. [Google Scholar]
  65. Hao, X.; Liu, R.; Huang, X. Evaluation of the Potential for Operating Carbon Neutral WWTPs in China. Water Res. 2015, 87, 424–431. [Google Scholar] [CrossRef] [PubMed]
  66. Awe, O.W.; Liu, R.; Zhao, Y. Analysis of Energy Consumption and Saving in Wastewater Treatment Plant: Case Study from Ireland. J. Water Sustain. 2016, 6, 63–76. [Google Scholar] [CrossRef]
  67. Jonasson, M. Energy Benchmark for Wastewater Treatment Processes—A Comparison between Sweden and Austria; Lund University: Lund, Sweden, 2007. [Google Scholar]
  68. Longo, S.; d’Antoni, B.M.; Bongards, M.; Chaparro, A.; Cronrath, A.; Fatone, F.; Lema, J.M.; Mauricio-Iglesias, M.; Soares, A.; Hospido, A. Monitoring and Diagnosis of Energy Consumption in Wastewater Treatment Plants. A State of the Art and Proposals for Improvement. Appl. Energy 2016, 179, 1251–1268. [Google Scholar] [CrossRef] [Green Version]
  69. Miyoshi, T.; Nguyen, T.P.; Tsumuraya, T.; Kimura, K.; Watanabe, Y. Energy Consumption in a Baffled Membrane Bioreactor (B-MBR): Estimation Based on Long-Term Continuous Operation. Water Sci. Technol. 2019, 80, 1011–1021. [Google Scholar] [CrossRef]
  70. The New York State Energy Research and Development Authority. Municipal Waste Water Treatment Plant Energy Evaluation for Town of Tonawanda WWTP—Agreement No. 7185; NYSERDA: Albany, NY, USA, 2005. [Google Scholar]
  71. Kato, H.; Fujimoto, H.; Yamashina, K. Operational Improvement of Main Pumps for Energy-Saving in Wastewater Treatment Plants. Water 2019, 11, 2438. [Google Scholar] [CrossRef] [Green Version]
  72. Ravishankara, A.R.; Daniel, J.S.; Portmann, R.W. Nitrous Oxide (N2O): The Dominant Ozone-Depleting Substance Emitted in the 21st Century. Science 2009, 326, 123–125. [Google Scholar] [CrossRef] [Green Version]
  73. Chu, T.; Abbassi, B.E.; Zytner, R.G. Life-Cycle Assessment of Full-Scale Membrane Bioreactor and Tertiary Treatment Technologies in the Fruit Processing Industry. Water Environ. Res. 2022, 94, e1661. [Google Scholar] [CrossRef]
  74. Ioannou-Ttofa, L.; Foteinis, S.; Chatzisymeon, E.; Fatta-Kassinos, D. The Environmental Footprint of a Membrane Bioreactor Treatment Process through Life Cycle Analysis. Sci. Total Environ. 2016, 568, 306–318. [Google Scholar] [CrossRef] [Green Version]
  75. Liao, X.; Tian, Y.; Gan, Y.; Ji, J. Quantifying Urban Wastewater Treatment Sector’s Greenhouse Gas Emissions Using a Hybrid Life Cycle Analysis Method—An Application on Shenzhen City in China. Sci. Total Environ. 2020, 745, 141176. [Google Scholar] [CrossRef] [PubMed]
  76. Environmental Protection Agency. Waste Heat to Power Systems; Fact Sheet; US Environmental Protection Agency: Washington, DC, USA, 2012. [Google Scholar]
  77. Volpin, F.; Jiang, J.; El Saliby, I.; Preire, M.; Lim, S.; Hasan Johir, M.A.; Cho, J.; Han, D.S.; Phuntsho, S.; Shon, H.K. Sanitation and Dewatering of Human Urine via Membrane Bioreactor and Membrane Distillation and Its Reuse for Fertigation. J. Clean. Prod. 2020, 270, 122390. [Google Scholar] [CrossRef]
  78. Nguyen, N.C.; Nguyen, H.T.; Chen, S.S.; Ngo, H.H.; Guo, W.; Chan, W.H.; Ray, S.S.; Li, C.W.; Hsu, H. Te A Novel Osmosis Membrane Bioreactor-Membrane Distillation Hybrid System for Wastewater Treatment and Reuse. Bioresour. Technol. 2016, 209, 8–15. [Google Scholar] [CrossRef] [PubMed]
  79. Zhou, Y.; Huang, M.; Deng, Q.; Cai, T. Combination and Performance of Forward Osmosis and Membrane Distillation (FO-MD) for Treatment of High Salinity Landfill Leachate. Desalination 2017, 420, 99–105. [Google Scholar] [CrossRef]
  80. Han, L.; Tan, Y.Z.; Netke, T.; Fane, A.G.; Chew, J.W. Understanding Oily Wastewater Treatment via Membrane Distillation. J. Membr. Sci. 2017, 539, 284–294. [Google Scholar] [CrossRef]
  81. Lu, D.; Liu, Q.; Zhao, Y.; Liu, H.; Ma, J. Treatment and Energy Utilization of Oily Water via Integrated Ultrafiltration-Forward Osmosis–Membrane Distillation (UF-FO-MD) System. J. Membr. Sci. 2018, 548, 275–287. [Google Scholar] [CrossRef]
  82. Mikielewicz, D.; Wajs, J.; Ziółkowski, P.; Mikielewicz, J. Utilisation of Waste Heat from the Power Plant by Use of the ORC Aided with Bleed Steam and Extra Source of Heat. Energy 2016, 97, 11–19. [Google Scholar] [CrossRef]
  83. Tai, C.; Tian, G.; Lei, W. A Water-Heat Combined Supply System Based on Waste Heat from a Coastal Nuclear Power Plant in Northern China. Appl. Therm. Eng. 2022, 200, 117684. [Google Scholar] [CrossRef]
  84. Su, Z.; Yang, L. A Novel and Efficient Cogeneration System of Waste Heat Recovery Integrated Carbon Capture and Dehumidification for Coal-Fired Power Plants. Energy Convers. Manag. 2022, 255, 115358. [Google Scholar] [CrossRef]
  85. Fathi, N.; McDaniel, P.; Aleyasin, S.S.; Robinson, M.; Vorobieff, P.; Rodriguez, S.; de Oliveira, C. Efficiency Enhancement of Solar Chimney Power Plant by Use of Waste Heat from Nuclear Power Plant. J. Clean. Prod. 2018, 180, 407–416. [Google Scholar] [CrossRef]
  86. Obara, S.; Tanaka, R. Waste Heat Recovery System for Nuclear Power Plants Using the Gas Hydrate Heat Cycle. Appl. Energy 2021, 292, 116667. [Google Scholar] [CrossRef]
  87. Wealer, B.; Bauer, S.; Landry, N.; Seiß, H.; von Hirschhausen, C. Navigating the Roadmap for Clean, Secure and Efficient Energy Innovation: Nuclear Power Reactors Worldwide-Technology Developments, Diffusion Patterns, and Country-by-Country Analysis of Implementation (1951–2017); DIW Berlin: Berlin, Germany, 2019. [Google Scholar]
  88. Yu, M.G.; Nam, Y. Feasibility Assessment of Using Power Plant Waste Heat in Large Scale Horticulture Facility Energy Supply Systems. Energies 2016, 9, 112. [Google Scholar] [CrossRef] [Green Version]
  89. Jacob, P.; Phungsai, P.; Fukushi, K.; Visvanathan, C. Direct Contact Membrane Distillation for Anaerobic Effluent Treatment. J. Membr. Sci. 2015, 475, 330–339. [Google Scholar] [CrossRef]
  90. Czepiel, P.M.; Crill, P.M.; Harriss, R.C. Methane Emissions from Municipal Wastewater Treatment Processes. Environ. Sci. Technol. 1993, 27, 2472–2477. [Google Scholar] [CrossRef]
  91. Czepiel, P.; Crill, P.; Harriss, R. Nitrous Oxide Emissions from Municipal Wastewater Treatment. Environ. Sci. Technol. 1995, 29, 2352–2356. [Google Scholar] [CrossRef]
  92. Sümer, E.; Weiske, A.; Benckiser, G.; Ottow, J.C.G. Influence of Environmental Conditions on the Amount of N2O Released from Activated Sludge in a Domestic Waste Water Treatment Plant. Experientia 1995, 51, 419–422. [Google Scholar] [CrossRef]
  93. Benckiser, G.; Eilts, R.; Linn, A.; Lorch, H.J.; Sümer, E.; Weiske, A.; Wenzhöfer, F. N2O Emissions from Different Cropping Systems and from Aerated, Nitrifying and Denitrifying Tanks of a Municipal Waste Water Treatment Plant. Biol. Fertil. Soils 1996, 23, 257–265. [Google Scholar] [CrossRef]
  94. Wang, J.; Zhang, J.; Xie, H.; Qi, P.; Ren, Y.; Hu, Z. Methane Emissions from a Full-Scale A/A/O Wastewater Treatment Plant. Bioresour. Technol. 2011, 102, 5479–5485. [Google Scholar] [CrossRef]
  95. STOWA. Emissies van Broeikasgassen van Rwzi’s; STOWA: Engelsbrand, Germany, 2010. [Google Scholar]
  96. VROM Protocol. 8136 Afvalwater, t.b.v NIR 2008 Uitgave Maart 2008 6B: CH4 En N2O Uit Afvalwater; Directie Klimaatverandering en Industrie: The Hague, The Netherlands, 2008. [Google Scholar]
  97. Daelman, M.R.J.; van Voorthuizen, E.M.; van Dongen, U.G.J.M.; Volcke, E.I.P.; van Loosdrecht, M.C.M. Methane Emission during Municipal Wastewater Treatment. Water Res. 2012, 46, 3657–3670. [Google Scholar] [CrossRef]
  98. Tumendelger, A.; Alshboul, Z.; Lorke, A. Methane and Nitrous Oxide Emission from Different Treatment Units of Municipal Wastewater Treatment Plants in Southwest Germany. PLoS ONE 2019, 14, e0209763. [Google Scholar] [CrossRef]
  99. Tibi, F.; Guo, J.; Ahmad, R.; Lim, M.; Kim, M.; Kim, J. Membrane Distillation as Post-Treatment for Anaerobic Fluidized Bed Membrane Bioreactor for Organic and Nitrogen Removal. Chemosphere 2019, 234, 756–762. [Google Scholar] [CrossRef] [PubMed]
  100. Kwon, D.; Bae, W.; Kim, J. Hybrid Forward Osmosis/Membrane Distillation Integrated with Anaerobic Fluidized Bed Bioreactor for Advanced Wastewater Treatment. J. Hazard. Mater. 2021, 404, 124160. [Google Scholar] [CrossRef] [PubMed]
  101. Mokhtar, N.M.; Lau, W.J.; Ismail, A.F.; Kartohardjono, S.; Lai, S.O.; Teoh, H.C. The Potential of Direct Contact Membrane Distillation for Industrial Textile Wastewater Treatment Using PVDF-Cloisite 15A Nanocomposite Membrane. Chem. Eng. Res. Des. 2016, 111, 284–293. [Google Scholar] [CrossRef] [Green Version]
  102. Wu, Y.; Kang, Y.; Zhang, L.; Qu, D.; Cheng, X.; Feng, L. Performance and Fouling Mechanism of Direct Contact Membrane Distillation (DCMD) Treating Fermentation Wastewater with High Organic Concentrations. J. Environ. Sci. 2018, 65, 253–261. [Google Scholar] [CrossRef]
  103. Davey, C.J.; Liu, P.; Kamranvand, F.; Williams, L.; Jiang, Y.; Parker, A.; Tyrrel, S.; McAdam, E.J. Membrane Distillation for Concentrated Blackwater: Influence of Configuration (Air Gap, Direct Contact, Vacuum) on Selectivity and Water Productivity. Sep. Purif. Technol. 2021, 263, 118390. [Google Scholar] [CrossRef]
  104. Zoungrana, A.; Zengin, İ.H.; Elcik, H.; Özkaya, B.; Çakmakci, M. The Treatability of Landfill Leachate by Direct Contact Membrane Distillation and Factors Influencing the Efficiency of the Process. Desalin. Water Treat. 2017, 71, 233–243. [Google Scholar] [CrossRef]
  105. Zoungrana, A.; Zengin, I.; Karadag, D.; Cakmakci, M. Treatability of Municipal Wastewater with Direct Contact Membrane Distillation. Sigma J. Eng. Nat. Sci. 2017, 8, 245–254. [Google Scholar]
  106. Li, F.; Huang, J.; Zia, Q.; Lou, M.; Yang, B.; Tian, Q.; Liu, Y. Direct Contact Membrane Distillation for the Treatment of Industrial Dyeing Wastewater and Characteristic Pollutants. Sep. Purif. Technol. 2018, 195, 83–91. [Google Scholar] [CrossRef]
Figure 1. Process flow diagram of the MBR-MD hybrid system.
Separations 09 00151 g001
Figure 2. System boundaries of the MBR-MD and Baseline systems.
Separations 09 00151 g002
Figure 3. Effluent water quality results for the MBR-MD and Baseline system models and overall percent removal values for chemical oxygen demand (COD), ammonia (NH4–N), phosphate (PO4–P), total nitrogen (TN), total organic carbon (TOC), total organic nitrogen (TON), and total suspended solids (TSS).
Separations 09 00151 g003
Figure 4. Percentage contributions to each category for the MBR-MD system scaled to the total Baseline impacts for (A) MBR-MD-0 (using all MD energy requirements satisfied with waste heat); or (B) MBR-MD-5 (grid electricity supplying 5% of the MD energy requirements with the remaining 95% of energy needs satisfied by waste heat).
Separations 09 00151 g004
Figure 5. Total environmental impacts for the Baseline and MBR-MD (MBR-MD-0) systems for (A) GW, (B) SOD, (C) FEP, (D) MEP, (E) FET, and (F) MET impact categories. Error bars represent the standard deviation from uncertainty analysis of the total environmental impacts in each category.
Separations 09 00151 g005
Figure 6. MBR-MD environmental impacts relative to the Baseline at varying MD grid energy percentages for the GW, SOD, FEP, MEP, FET, and MET impact categories.
Separations 09 00151 g006
Table 1. Characteristics of the medium-strength municipal wastewater [32] used as the influent wastewater for the MBR-MD and Baseline system models.
ParameterValueUnits
Influent Flow2500m3/day
Total COD500mg/L
TKN40mg/L
Total P10mg/L
Nitrate N0mg/L
pH7.04-
VSS198mg/L
TSS218mg/L
Table 2. Average, minimum, and maximum rejections recorded for MD systems for common wastewater quality parameters with the number of sources for each parameter.
ParameterAverageMinimumMaximumNumber of Sources
Ammonia N72.1934.0099.899
COD89.5146.2099.9911
Nitrate N99.8199.8199.811
Nitrite N99.9999.9999.991
Phosphate P95.5091.0099.992
TN88.9063.7099.824
TOC88.4949.1099.506
Table 3. The complete LCI for the MBR-MD and Baseline systems based on a functional unit of 1 m3 product water.
InputsUnitsMBR-MD Baseline
Energy Inputs
MBR PumpingkWh/m30.049-
Aerobic/UF tankkWh/m30.520-
Anoxic tankkWh/m30.055-
Anaerobic tankkWh/m30.055-
MD PumpingkWh/m30.076-
UVkWh/m30.055-
MD HeatingkWh/m3174-
Conventional treatment pumpingkWh/m3-0.009
Aeration tankkWh/m3-0.403
Sludge dewateringkWh/m30.0270.030
MFkWh/m3-0.274
ROkWh/m3-1.08
UV-AOPkWh/m3-0.070
Chemical Inputs
NaClOmg/L1111
FeCl3mg/L-12
H2SO4mg/L-24
Citric acidmg/L-0.2
NaOHmg/L-3.6
Ca(OH)2mg/L-15
H2O2mg/L-3
Gas Emissions
CH4g/day7.91 × 1057.91 × 105
N2Og/day17101710
Influent & Effluent Flows
Influent flowm3/day25002500
Effluent flowm3/day24161840
Water Emissions
Effluent
Ammonia-Nmg/L0.0170.010
CODmg/L3.147.43
Organic Nitrogenmg/L0.2150.118
Phosphate-Pmg/L0.0110.09
Total Nitrogenmg/L0.2330.83
Total Organic Carbonmg/L0.8720.06
RO Concentrate
Ammonia-Nmg/L-1.44
CODmg/L-273
Organic Nitrogenmg/L-9.87
Phosphate-Pmg/L-17.6
Total Nitrogenmg/L-146
Total Organic Carbonmg/L-88.9
Membranes
MF/UFm2213365
MDm27.2-
ROm2-341
Waste
Sludge wastekg/day479608
RO Concentratem3/day-324
Publisher’s Note: MDPI stays neutral with regard to jurisdictional claims in published maps and institutional affiliations.

