Article

Efficient Extraction of an Anthraquinone Physcion Using Response Surface Methodology (RSM) Optimized Ultrasound-Assisted Extraction Method from Aerial Parts of Senna occidentalis and Analysis by HPLC-UV

1
Department of Pharmacognosy, College of Pharmacy, King Saud University, Riyadh 11451, Saudi Arabia
2
College of Pharmacy, King Saud University, Riyadh 11451, Saudi Arabia
*
Authors to whom correspondence should be addressed.
Separations 2022, 9(6), 142; https://doi.org/10.3390/separations9060142
Submission received: 24 April 2022 / Revised: 29 May 2022 / Accepted: 2 June 2022 / Published: 6 June 2022
(This article belongs to the Section Analysis of Natural Products and Pharmaceuticals)

Abstract

:
In this experiment, the Box–Behnken design (BBD) of the response surface methodology (RSM) was used to optimize the ultrasound-assisted extraction variables (liquid-to-solid ratio, extraction temperature, and time) to obtain the maximum yield of physcion from the methanol extract of S. occidentalis (aerial parts). The analysis of physcion in the extracts obtained by using the optimized extraction condition was carried out in a gradient system by the HPLC-UV method with 0.5% formic acid in ultra-pure water (Solvent A) and acetonitrile (Solvent B) in different ratios as the mobile phase. The optimal extraction conditions for the maximum physcion extraction were found as: a liquid-to-solid ratio of 20.16 mL/g, extraction temperature of 52.2 °C, and extraction time of 46.6 min. Under these optimal ultrasonic extraction conditions, the experimental yield (% w/w of the dried extract) of the physcion was found to be 2.43%, which agreed closely with the predicted value (2.41). The experimental value was consistent with the value predicted by the RSM model, thus validating the fitness of the employed model and the success of the RSM in optimizing the extraction conditions. In future, this optimized ultrasonic extraction condition can be used in the maximum extraction of physcion from marketed herbal supplements containing S. occidentalis as well as other Senna species.

1. Introduction

Senna occidentalis L. belonging to the family Caesalpiniaceae is an Ayurvedic plant that grows throughout the tropics and subtropics including the United States, Africa, Asia, and Australia [1,2]. It is a straight, branched, and smooth shrub (0.8–1.5 m tall) that varies from semi-woody (temperate areas) to woody (in frost free areas) [3]. S. occidentalis possesses numerous medicinal properties and hence is used to treat or prevent eye inflammation, diarrhea, fever, cancer, and venereal diseases, along with its various parts such as the root, leaves, seeds, and pods, are used for the treatment of incipient dropsy, wounds, cutaneous diseases, high blood pressure, and mental disorders, respectively [4]. This plant is consumed by local people as a substitute for coffee. It is also used as an active ingredient of Liv. 52 (a hepatoprotective polyherbal formulation) [5]. The infusion of S. occidentalis roots, along with the roots of other species (Caesalpinia sepiaria Roxb. and Azadirachta indica A. Juss.) are given to ladies to control a white discharge. There are several phytoconstituents that have been reported to be isolated from S. occidentals such as aloe-emodin, emodin, chrysophanol, physcion, quercetin, rhein, and rubrofusarin. The roots of S. occidentalis reportedly possesses 1.9% free and 4.5% total anthaquinones while young roots have been found to contain chrysophanol and emodin. It is also reported to contain physcion (free, bonded, reduced, and oxidized), together with chrysophanol. The 1-glucoside of physcion (0.018%) along with physcion (0.0068%) and two new anthraquinones were found in the seeds of S. occidentalis. Free physcion has also been isolated from the leaves of S. occidentalis [6]. Various research has indicated that the nature and amount of phytochemicals in C. occidentalis vary according to climate (e.g., the leaves of S. occidentalis from the Ivory Coast and Africa contain no alkaloids while leaves from Ethiopia contain large amounts of alkaloids) [7].
Physcion (Figure 1) is an anthraquinone and is one of the major phytoconstituents reported from S. occidentalis [8]. Physcion exerts anti-inflammatory and anticancer properties with minimum or no side effects. Additionally, it exhibits antimicrobial and hepatoprotective activities [9,10]. Physcion has been found to be a potent anticancer compound and exhibits its anticancer properties by inducing apoptosis [11] and regulating numerous cell signaling pathways by modulating various cell cycle regulators, protein kinases, microRNAs, and transcriptional factors [12]. The analysis of physcion was conducted on danning tablets (a widely used prescription of traditional Chinese medicine) by HPLC-ESI-MS and in Cassiae Semen (traditional Chinese medicine) by HPLC [13]. Physcion was found in a good quantity in Polygonum cuspidatum Sieb. et Zucc., a traditional and popular Chinese medicinal herb used in jaundice, to improve blood circulation, and cough suppression [14]. The UPLC-MS/MS method and ultrafast liquid chromatography-tandem mass spectrometry were developed to analyze physcion quantitatively in slimming health foods [15] and in rat plasma [16], respectively. Up until now, no research has been reported on the analysis of physcion in S. occidentalis using the HPLC-UV method.
Extraction is an essential method for the isolation and identification of important chemical compounds from medicinal plants. There are several methods for the extraction of medicinal plants such as water extraction, maceration, and solid-phase micro extraction, but all of these methods are slow, costly, and inefficient. However, in recent years, many new extraction methods have been discovered, in particular, the ultrasound-assisted extraction (UAE) method, which is considered more efficient and has been used to extract compounds from various sources. The main benefit of UAE is its low operation cost and high efficiency when compared with the traditional method of extraction. The UAE method works on the principal of acoustic cavitation, which causes damage to the cell walls, thus supporting the release of bioactive compounds. UAE may be applied to extract different phytochemicals, of which flavonoids and anthraquinones are good examples [17]. Therefore, we designed our research to optimize the various parameters (extraction temperature, extraction time, and liquid-to-solid ratio) used in UAE by the Box–Behnken design (BBD) of the response surface methodology (RSM) to obtain the optimum physcion yield from the S. occidentalis methanol extract and its analysis through the high-performance liquid chromatography-UV (HPLC-UV) method.

2. Materials and Methods

2.1. Plant Material

The aerial parts of S. occidentalis (voucher specimen no. 16388) was collected in 2014 from Fayfa (Saudi Arabia) by Dr. Md. Yusuf (field taxonomist at the Pharmacognosy Department, Riyadh, Saudi Arabia) and a specimen was deposited in the herbarium. The collected plant parts were cut into small pieces and washed with water. Then, the washed plant materials were dried and kept in a tightly packed glass jar. Before extraction, the aerial parts were coarsely powdered.

2.2. Apparatus and Reagents

The reference standard of physcion (≥98.0%) were procured from Sigma-Aldrich (St. Louis, MO, USA). Methanol and acetonitrile (Analytical grade) were purchased from WINLAB (Market Harborough, UK). For pure water of high quality, a Millipore Milli-Q® (Bedford, MA, USA) assembly was used. For solvent filtration, a Millipore-Millex-HV® filter unit with a membrane filter (0.45 µm pore size) was used, and for the sample preparations, a syringe filter of 0.22 µm was used. An Alliance 2695 separation module fitted with a 2487 dual wavelength absorbance detector (Waters Instruments, Inc., Milford, MA, USA), was used for the quantitative analysis.

2.3. Ultrasound-Assisted Extraction of Aerial Parts of S. occidentalis

The dried aerial parts of S. occidentalis were coarsely powdered. One gram of the powdered material was kept in a 50 mL conical flask and extracted with methanol by UAE using a Sonics vibra cell (Model VCX-750; Sonics, Newtown, CT, USA). After completion of the extraction, the extract was cooled. Next, it was filtered and the obtained residue was washed three times with methanol to attain the final volume of the S. occidentalis methanol extract (SOME). The obtained final volume of SOME was filtered by a syringe filter (0.45 µm, Phenomenex, Torrance, CA, USA) and dried with a rotavapor (R-300, Buchi, Flawil, Switzerland) to obtain the final % w/w of the dried extract of S. occidentalis.

2.4. BBD Experimental Design

2.4.1. Single Factor Experimental Design

To investigate the impact extraction factors (independent variables) of the UAE (liquid to solid ratio, extraction temperature, and extraction time) on the efficient extraction of physcion (dependent variable) from SOME, a range of these factors (for the optimization by the BBD method of RSM) were selected using the observations of the single-factor effects on the extraction yield of physcion. The evaluation of the single factor effect on physcion extraction was carried out using a range for each and every factor. When one factor was used as a variable, the other two remaining factors remained constant.

2.4.2. Optimization of Extraction Variables Using the BBD Method and Method Validity Testing

A 3-factorial (33) BBD (version 13, Design-Expert Software, Stat-Ease Inc., Minneapolis, MN, USA) was used to optimize the different independent variables [liquid to solid ratio (M1), extraction temperature (M2), and extraction time (M3)], at low (−1), medium (0), and high levels (+1) (Table 1).
It generated 17 experimental runs (comprising five central points) fitted to a second-order polynomial equation to find the total yields of physcion (R). The effects of the independent variables on the physcion yields were deduced by using two-dimensional contour plots and three-dimensional response surface plots. The “biggest-is-best” principle was used for each variable to obtain the optimum outcome, with p-values ≤ 0.05 considered as significant. A confirmatory experiment (n = 3) was carried out using optimized independent variables and the experimental values were compared with the predicted values for model validation.

2.5. HPLC-UV Analysis of Physcion in BBD Run SOMEs

The dependent variable physcion (R) was quantitatively analyzed in all SOMEs including SOME obtained (using UAE) after using the optimized independent extraction variables by HPLC-UV [an Alliance 2695 Separations Module equipped with a 2487 dual wavelength absorbance detector (Waters Instruments, Inc., Milford, MA, USA)]. The HPLC-UV analysis was carried out in a gradient system using the following equipment: built-in quaternary pump, Pinnacle C18 column (Bellefonte, Pennsylvania, PA, USA; 4.6 × 250 mm, 5 μm), four-channel degasser, and auto sampler with programmable temperature (25 °C). Preparations of 0.5% formic acid in ultra-pure water (A) and acetonitrile (B) in different ratios were used as a mobile phase with a flow rate of 1 mL/min. The gradient program was optimized as: 0–15 min (15–30% B), 15–18 min (30–34% B), 18–20 min (34–40% B), 20–21 min (40–15% B), and 21–30 min (15% B). A total of 10 µL of the samples with a concentration of 1 mg/mL was injected into the system. The output signal was detected at a wavelength of 271 nm and processed by EMPOWER software version 2.

2.6. Statistical Analysis

All the values are presented as mean ± standard error of the mean (SEM). Data were statistically analyzed using the Student’s t-test for a comparison between the means, applying a significance level of p < 0.05.

3. Results

3.1. Single-Factor Effect on Physcion Yield

To optimize the different UAE variables (liquid to solid ratio, extraction temperature, and extraction time) by the BBD method, a range was fixed of these independent variables by investigating the single factor effect on the physcion yield. Various ranges of liquid-to-solid ratio (8–32 mL/g), extraction temperature (30–90 °C), and time (20–80 min) were selected to study the single factor on the physcion yield. During this study, two factors remained constant while the third factor varied and its impact on the physcion extraction was noted. The constant level for the three factors were: liquid-to-solid ratio (20 mL/g), temperature (40 °C), and time (30 min).
The single factor experiment results showed that the physcion yield was lowest at 8 mL/g of the liquid-to-solid ratio, 30 °C temperature, and 20 min of extraction time. The highest amount of physcion was obtained at 20 mL/g of the liquid-to-solid ratio, 60 °C extraction temperature, and 40 min of extraction time. An increase in the values of the liquid-to-solid ratio (above 20 mL/g), extraction temperature (above 60 °C), and extraction time (above 40 min) did not exhibit any marked changes in the physcion yields (Figure 2). Based on these findings, the ranges for the independent extraction variable were set as 12–24 mL/g of the liquid-to-solid ratio, extraction temperature of 45–75 °C, 25–55 min of extraction time, and finally, the optimization of independent variables was carried out by applying the BBD method.

3.2. BBD Method Optimization of the Extraction Conditions

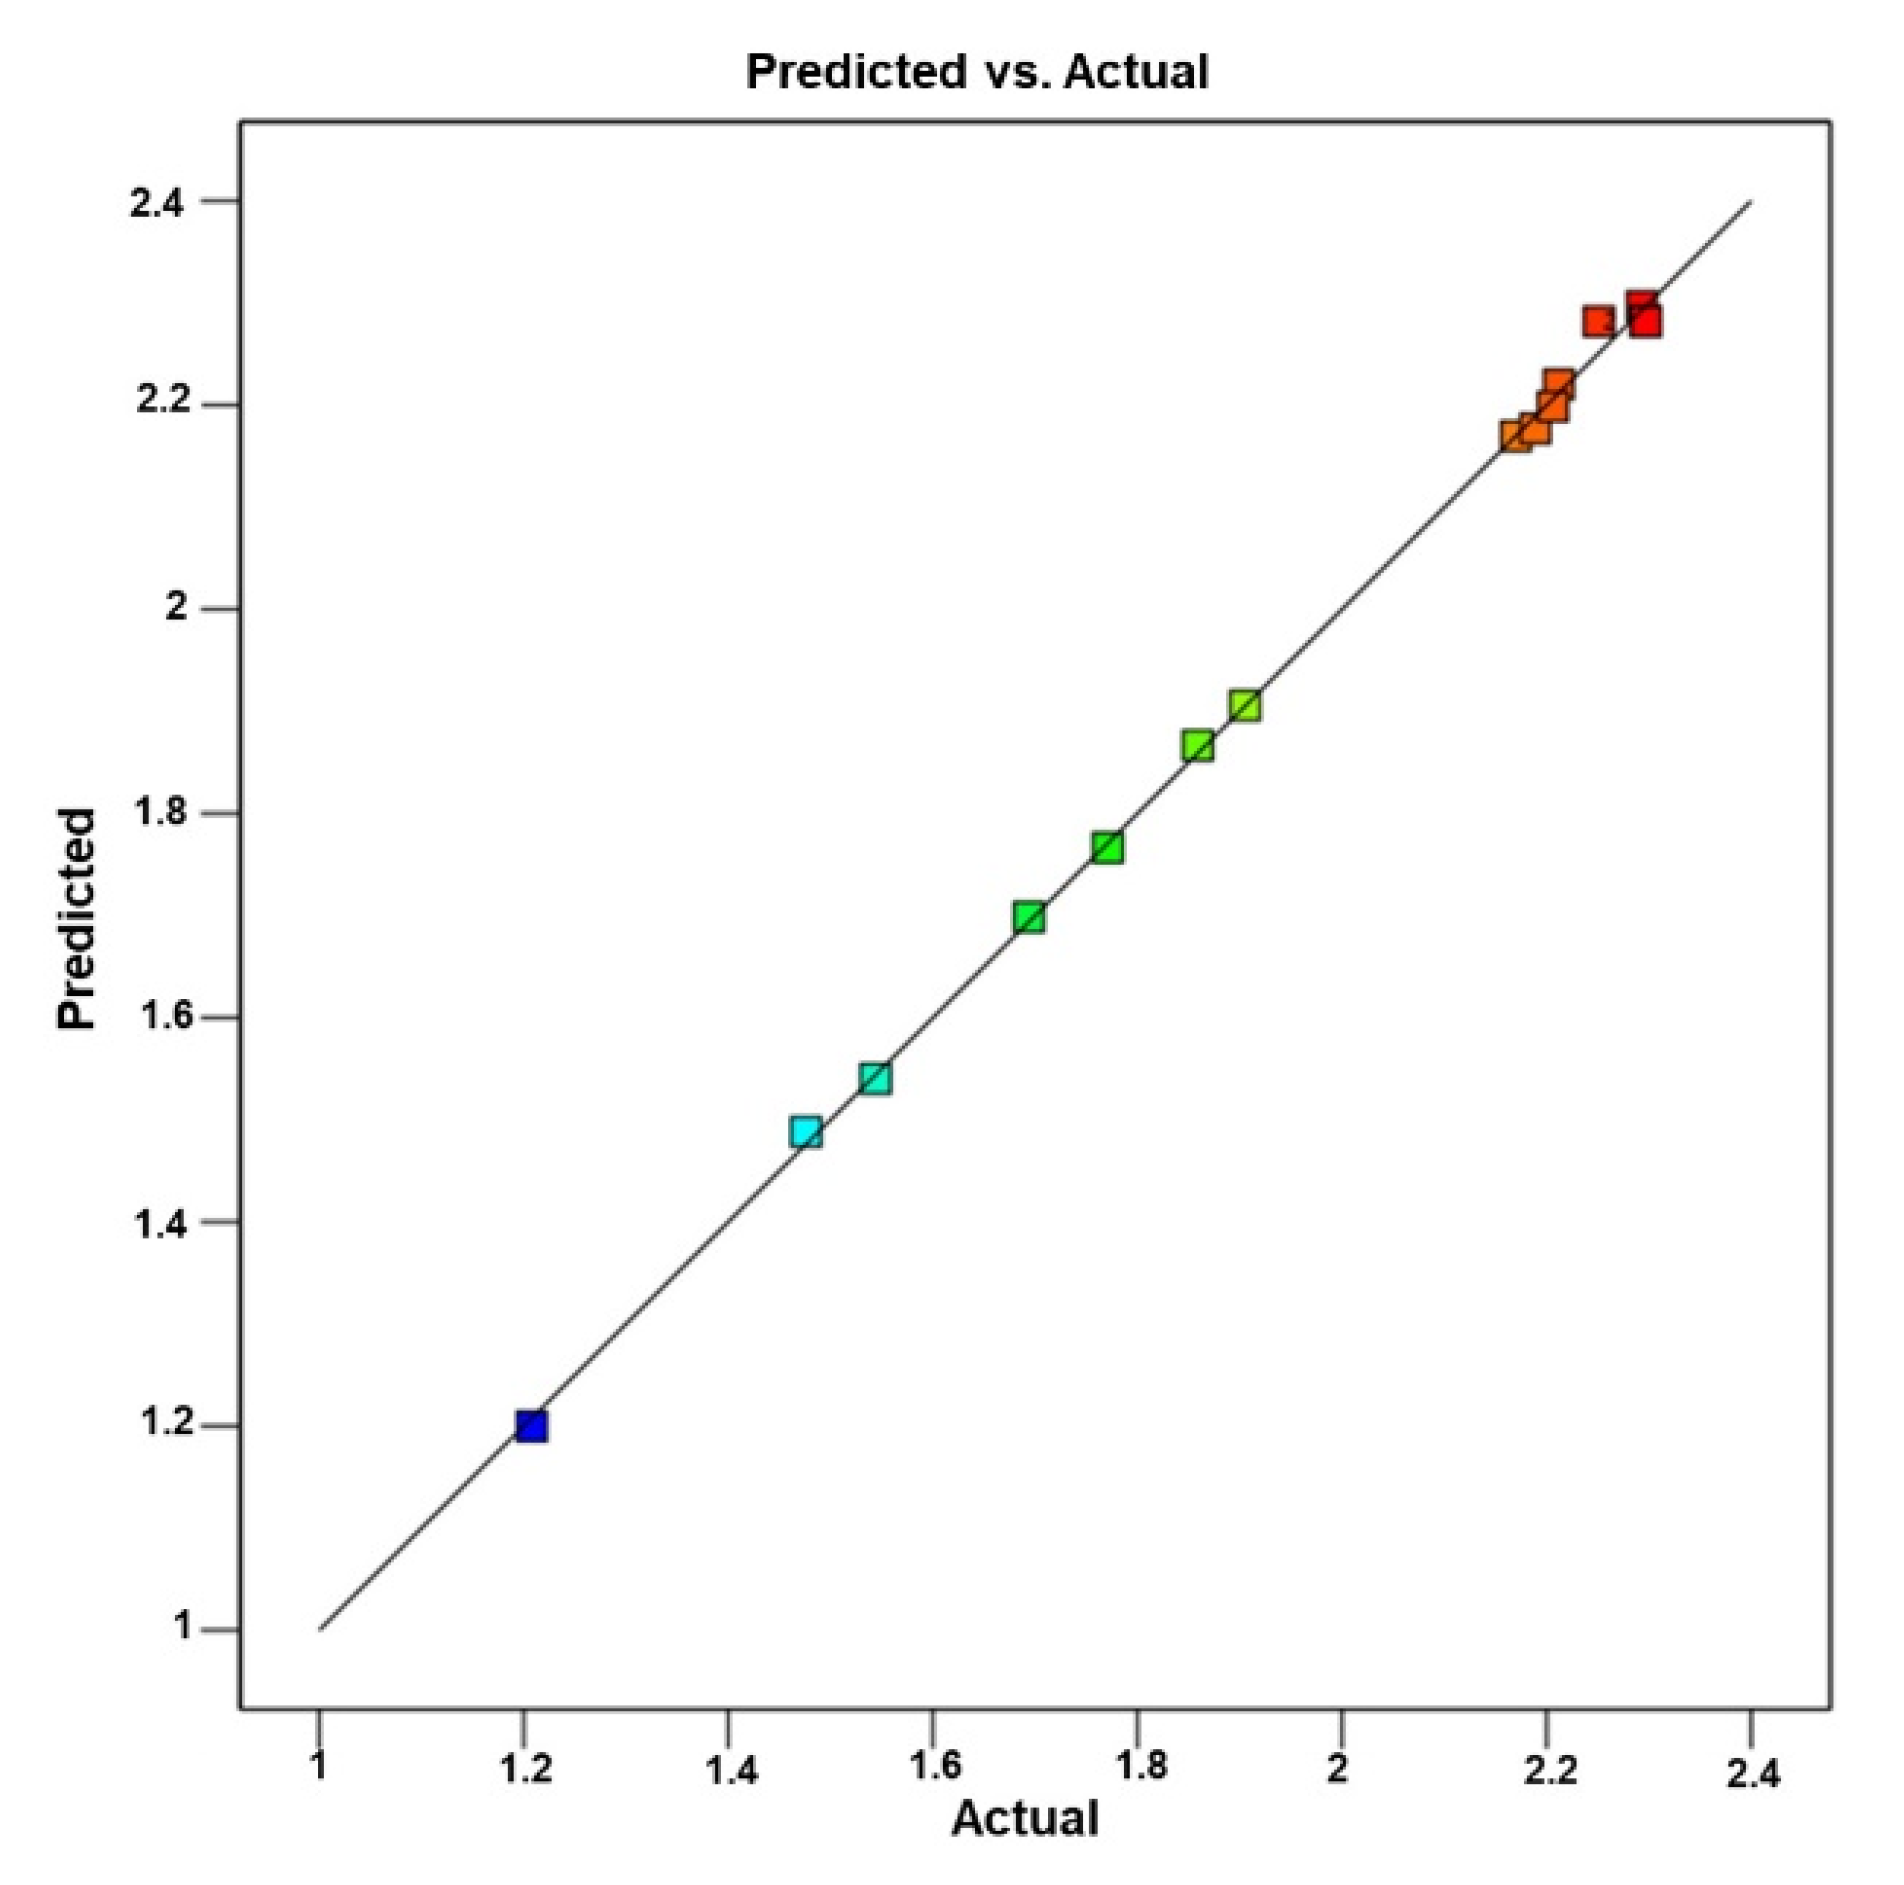
3.2.1. Statistical Analysis and Model Fitting

Seventeen combinations were generated for the three independent variables during the process of extraction condition optimization using the BBD method and the results of these combinations in the form of the total yield of physcion (R) is incorporated in Table 2. The obtained results were fitted in a second-order polynomial equation, which generated an equation with a coded factor for R:
R = 2.28 + 0.2381 M1 − 0.2721 M2 + 0.1063 M3 + 0.0113 M1M2 − 0.1025 M1M3 + 0.0570 M2M3 − 0.3005 M12 − 0.2601 M22 − 0.0462 M32.
Using the BBD-based experimental design, a quadratic model with an R2 value of 0.9988 was found as the best-fit model for the analysis of physcion (R). Table 3 presents the data obtained for the regression analysis and response regression equation of the suggested model for R.
The adjusted and predicted R2 values for R were found to be 0.9967 and 0.9925, respectively, which were close to 1, displaying a formidable correlation between the adjusted and predicted values. In addition, there was a difference of less than 0.2 between the adjusted and predicted R2 values, indicating well-fitting of the models fitted. The signal-to-noise ratio was found to be 25.47, which indicated that the precision of the model was adequate and the model was fit (a precision of more than 4 was required to fit the model). The fitting of the model suggests that the proposed model can be used to navigate the design space.
Table 4 contains the ANOVA (analysis of variance) results for the quadratic model of R.
The model F-value for R was found to be 474.84, suggesting that the model was significant and there was only a 0.01% chance that an F-value this large could occur due to noise. The p-value for the proposed model was found to be very low (<0.0001), indicating that the developed model for the analysis of all variables was significant. The Lack of Fit F-value was found to be 0.29, and was not significant relative to the pure error, which is good for the model to be fit. The obtained Lack of Fit F-value suggests that there was an 83.19% chance that a Lack of Fit F-value this large could occur due to noise.

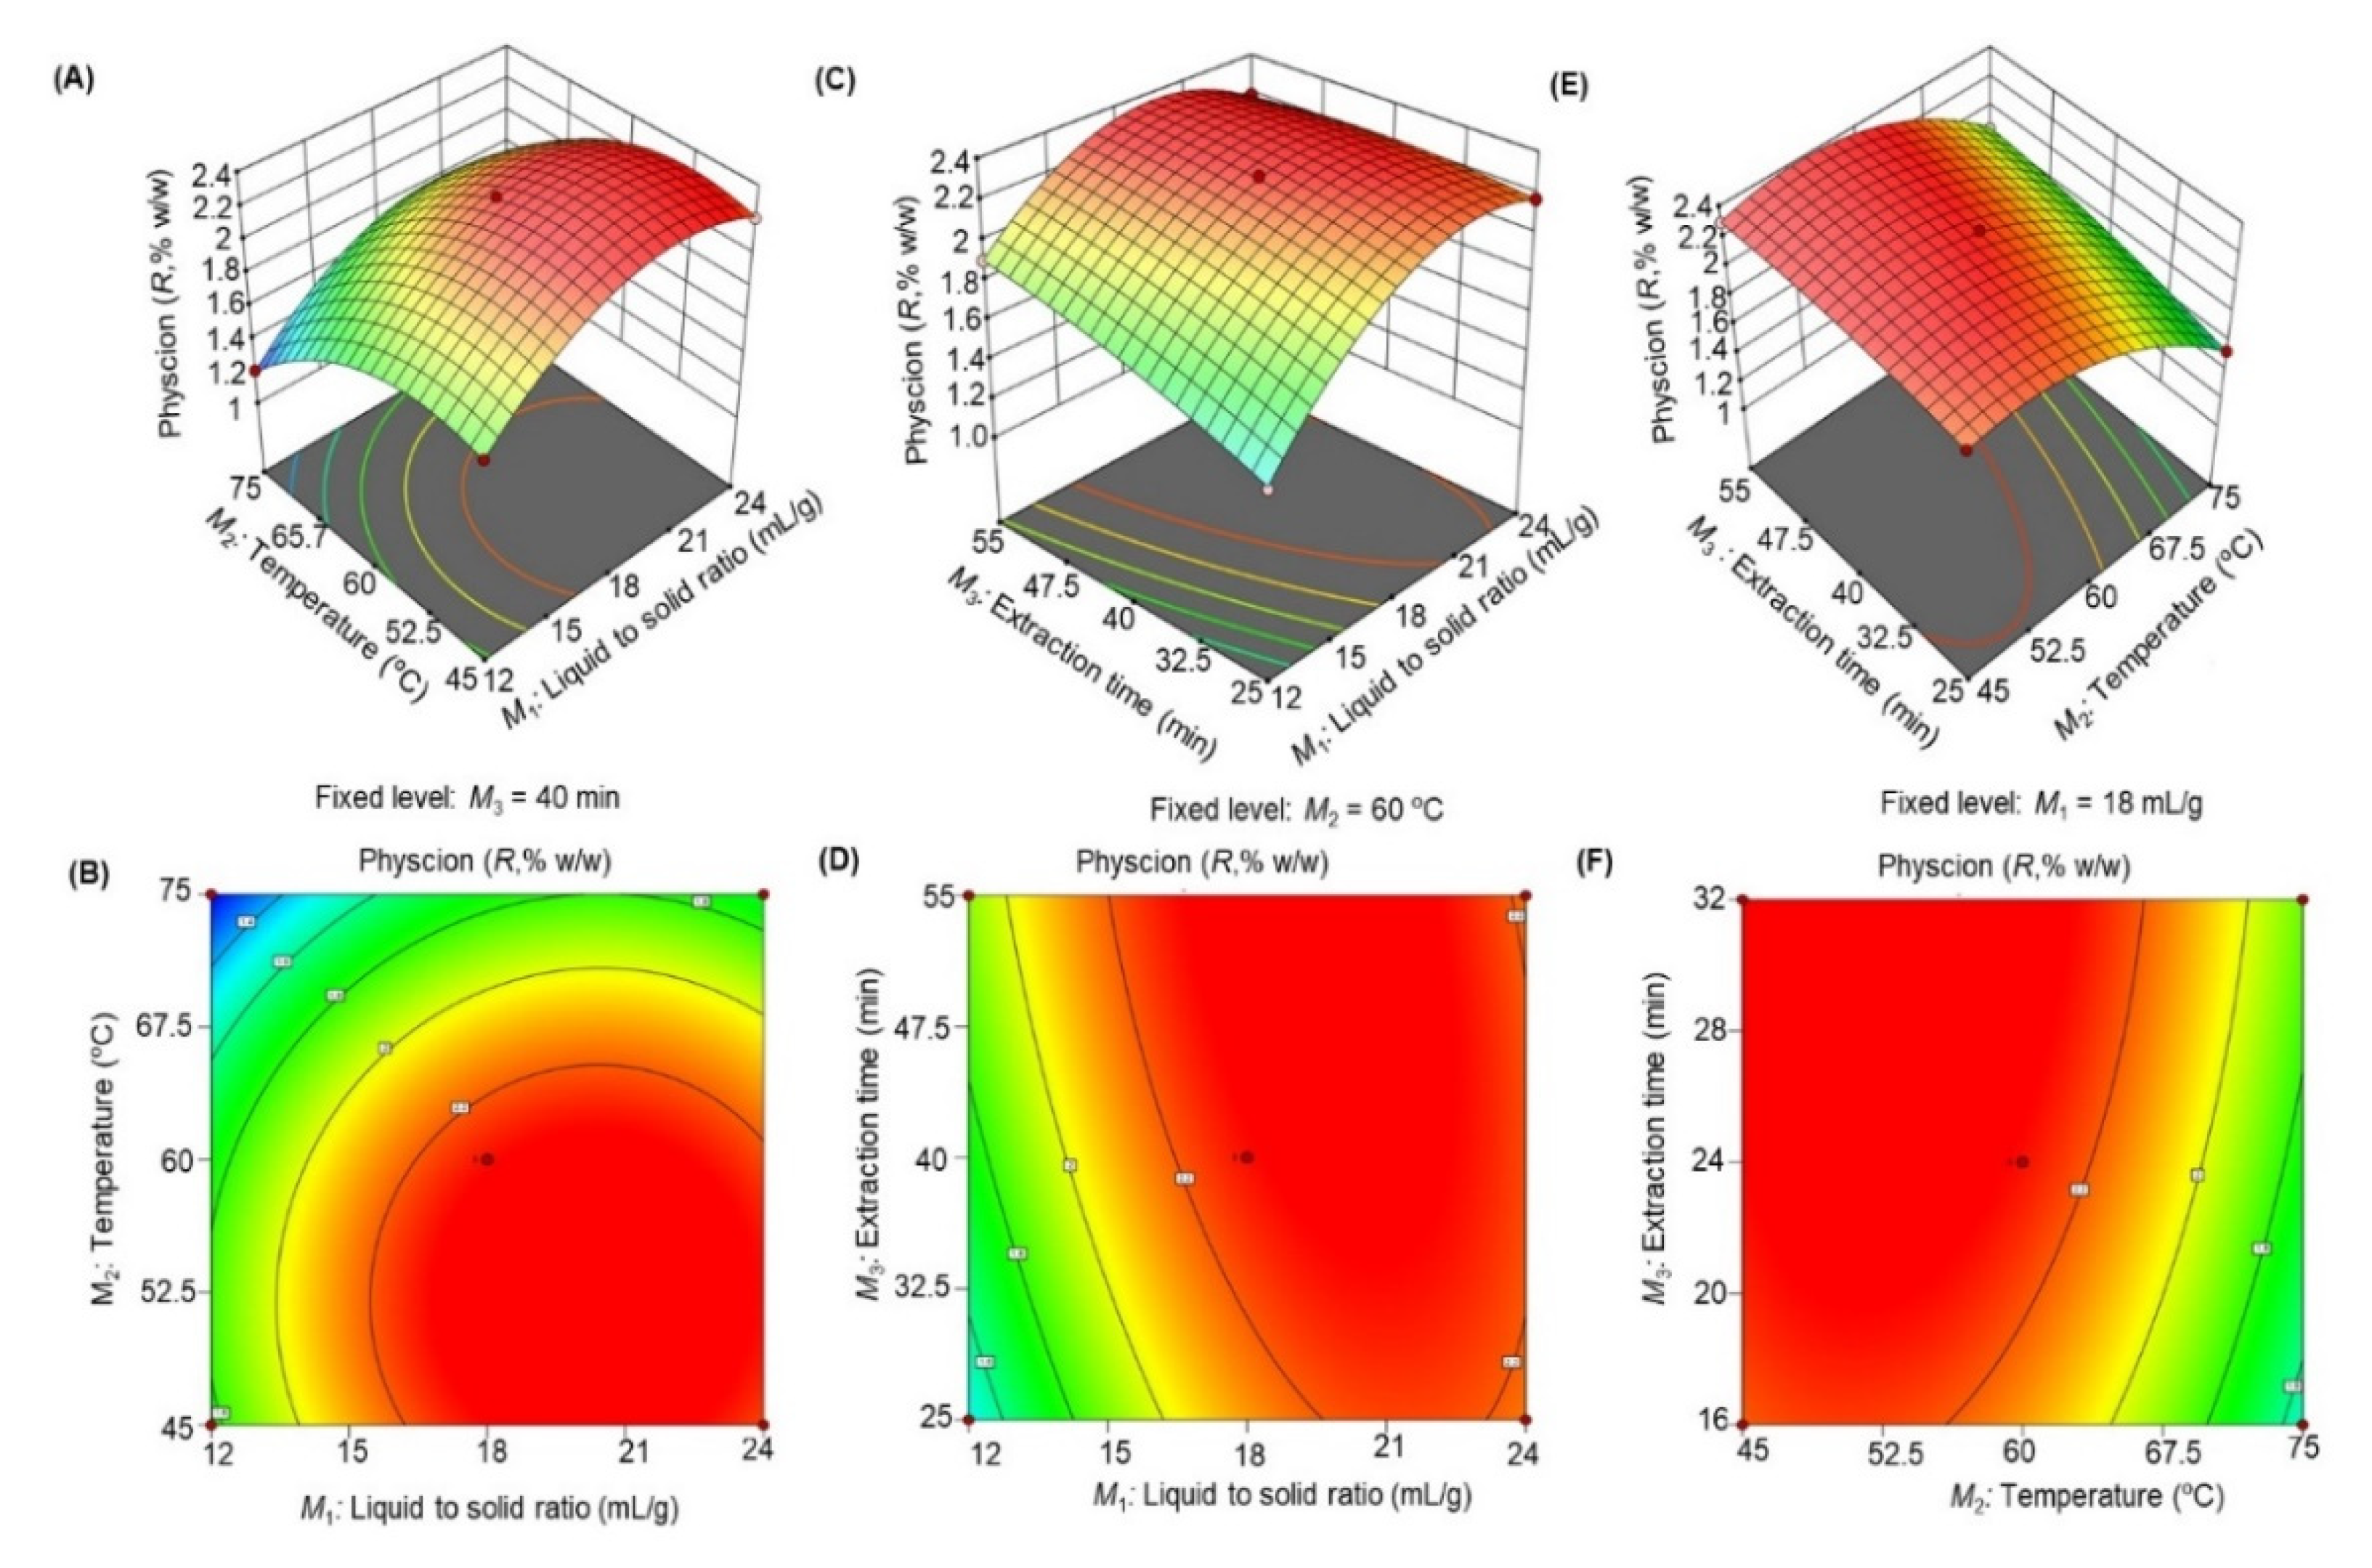
3.2.2. Linear, Quadratic, and Interaction Effect of M1, M2, and M3 of Ultrasonic Extraction on R Yield

The linear, quadratic, and interaction effects of M1, M2, and M3 are listed in Table 5. The linear (M1, M2, and M3) as well as quadratic (M12, M22, and M32) effects of all the independent variables were found to be significant (p < 0.05) on the extraction yield of physcion. The effects of interaction of M1M3 and M2M3 were found to be significant (p < 0.05) on the physcion yield while the interaction of M1M2 was found to furnish a non-significant (p > 0.05) effect on the physcion yield. The high F-values of the linear and quadratic effects of M1 and M2 indicated that both the liquid-to-solid ratio and extraction temperature had a good impact on the extraction yield of physcion. Thus, it is suggested that there is an increase in the extraction of physcion with an increasing liquid-to-solid ratio and extraction temperature, but that at high range, the physcion yield will decrease. Furthermore, time has very limited impact on the yield of physcion as suggested by the low F-values.
The 3D plot and 2D contour plot (Figure 3) of the response surface were designed to demonstrate the interaction effects of the independent variables (M1, M2, and M3) on the yields of physcion (R). Every panel exhibited the effect of two factors on the extraction yield of R while the third factor was fixed at a base level (18 mL/g for M1, 60 °C for M2, and 40 min for M3). The effects of M1 and M2 (Figure 3A,B), M1 and M3 (Figure 3C,D), and M2 and M3 (Figure 3E,F) on R were recorded.
Figure 3A,B shows that the physcion yield was the maximum at an M1 of 20.16 mL/g and M2 of 52.2 °C. When M1 increased above 20.16 mL/g, the physcion yield was decreased. Similarly, the extraction yields of physcion increased when M1 was set at 20.16 mL/g and M3 at 46.6 min, as shown in Figure 3C,D. The effect of the M2 and M3 interaction on the physcion yield, as shown in Figure 3E,F, showed that no significant changes were recorded with an increase in M3, however, a significant increase was observed with the increase in M2. Based on these observations, it was concluded that the maximal physcion could be extracted from S. occidentalis (aerial parts) by UAE using the liquid-to-solid ratio of 20.16 mL/g at an extraction temperature of 52.2 °C and 51.6 min of extraction time.

3.2.3. BBD Method Validation

The BBD method validation was accomplished by comparing the experimental and predicted values of the response (R). Determination of the appropriateness of the generated polynomial equation and BBD application was achieved by using the percentage prediction error. A small percentage prediction error validates the generated polynomial equation and BBD model application. The linear correlation between the actual and predicted values of R demonstrated high R2 values of 0.9983, exhibiting excellent goodness of fit (p < 0.001) (Figure 4).

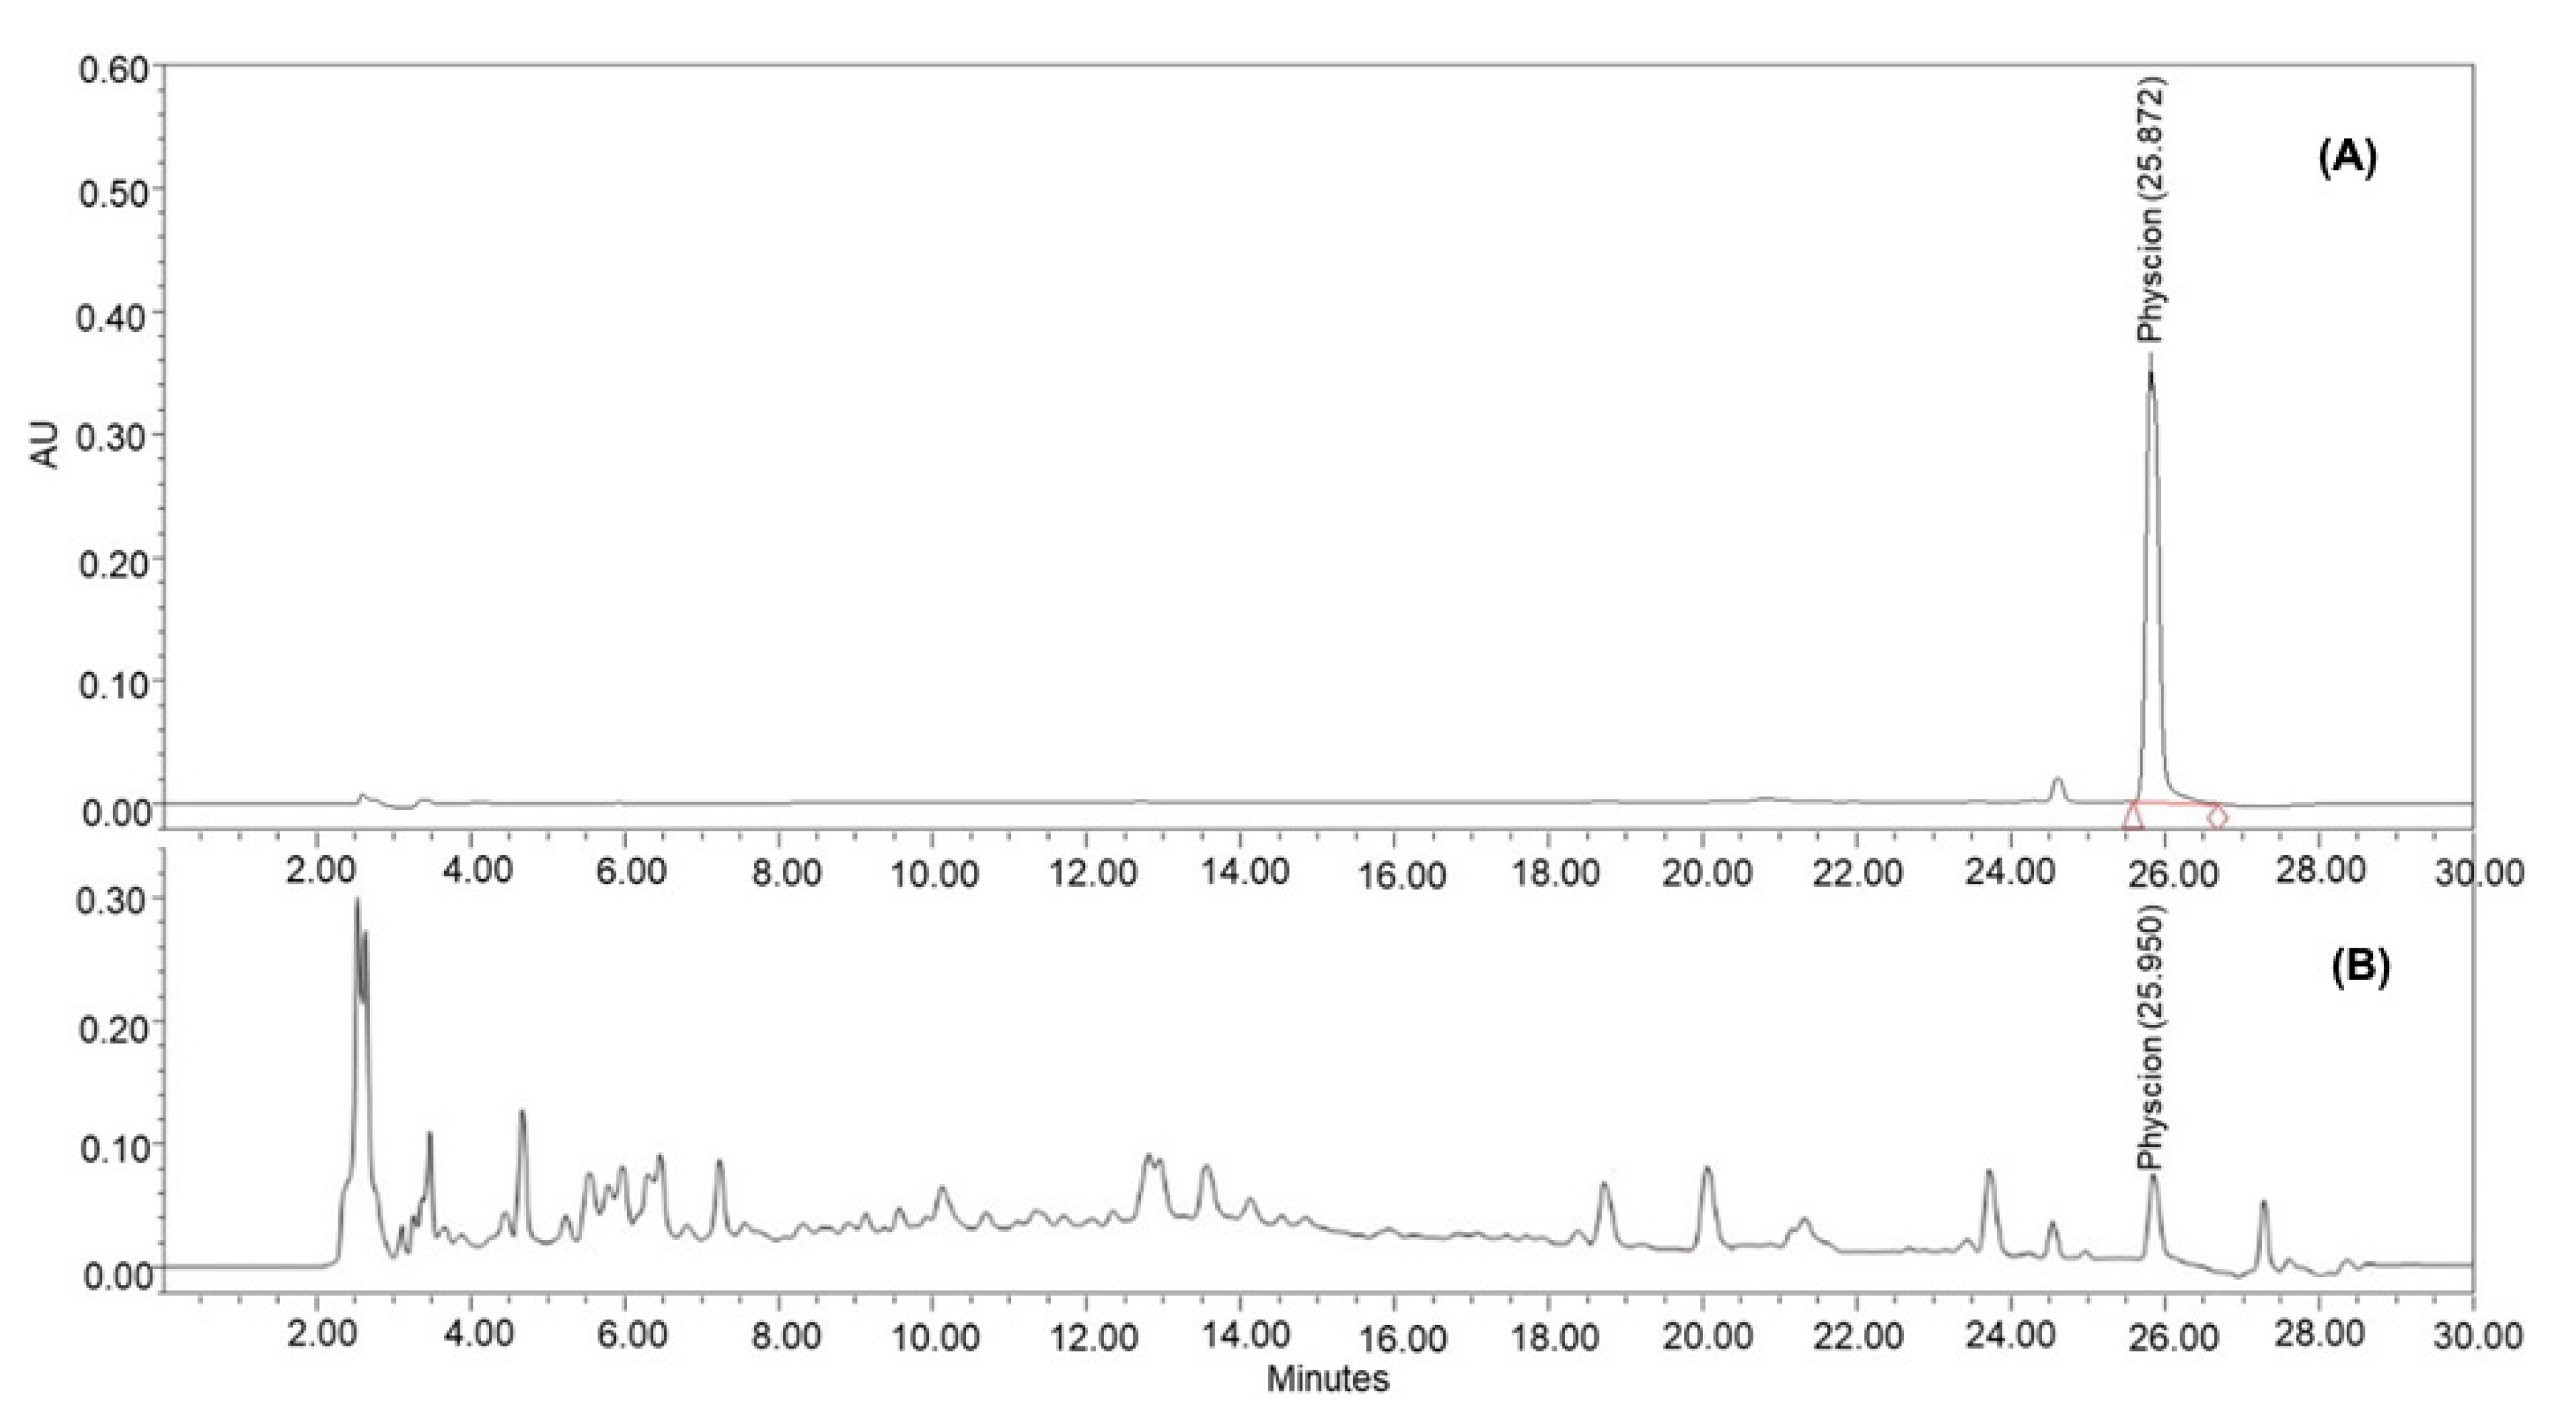
3.3. HPLC Analysis of BBD Optimized SOME

The analysis of physcion in SOME was conducted by RP-HPLC. Figure 5A,B illustrates the separation of physcion and the different phytoconstituents available in SOME (obtained by using the optimized extraction parameters), respectively, at 272 nm, and the baseline was achieved in 28 min. A gradient system for the elution of the physcion and SOME was used as it increases the elution strength, sensitivity, and efficiency of the HPLC column, improves the quality of separation and limit of detection, and decreases the time of analysis and degradation of column because of the strongly retained analytes. Under these conditions, the retention time of physcion was found to be 25.872 min.
The developed HPLC-UV method furnished a high linearity for physcion (r2 = 0.998) in the linearity range of 0.5–20 µg/mL, and very low values of limit of detection (LOD; 0.013 µg/mL) and limit of quantification (LOQ; 0.041 µg/mL). The intraday and interday precision (%RSD) for physcion analysis was recorded at concentration levels of 5, 10, and 15 µg/mL and found as 4.73–5.69% and 3.79–4.834%, respectively. Such low precision values for physcion indicated that the method was repeatable.

3.4. Verification of Optimized Microwave-Assisted Extraction Conditions

The selected extraction factors (M1M3) exhibited diverse effects on the physcion yield (R) (Table 6). The predicted optimal yield for the physcion extraction was found to be 2.41% w/w at the optimized extraction condition of M1 at 20.16 mL/g, M2 at 52.2 °C, and M3 at 46.6 min. By using the modified extraction condition, the amounts of physcion were found to be 2.43 ± 0.16% w/w of the dried extract of S. occidentalis. The residual percentage for physcion was found to be 1.08%, which indicated that the model was reliable.

4. Discussion

In this research, we studied the effects of different optimized parameters of ultrasonic extraction such as liquid-to-solid ratio (M1), extraction temperature (M2), and extraction time (M3) on the physcion extraction from S. occidentalis (aerial parts) using the response surface methodology (RSM). The ultrasonication technique was efficiently used in the past for the maximum extraction of several important phytoconstituents such as sennoside A and sennoside B from the leaves of C. angustifolia [18], and aloe-emodin, emodin, chrysophanol, and physcion from the bark of Rhamnus alpinus [19]. These findings motivated us to optimize the extraction parameters of the ultrasonic extraction method to obtain the maximum yield of physcion, and to optimize these extraction parameters, the BBD of RSM was used, which helped in determining the optimal values of the extraction parameters and is in line with the findings of Zhang et al. (2010) [20]. The correlation between the extraction yield and various levels of the extraction parameters (liquid-to-solid ratio, extraction temperature, and extraction time) as well as the interactions between the different extraction parameters can be illustrated by using a 3D-response surface plot as well as a 2D-contour plot [21]. In this study, we found that the extraction yield of physcion increased with the increase in temperature at fixed levels of the liquid-to-solid ratio and extraction time, which is line with the observations by Zhao et al. [22]. This finding indicated that with the increase in extraction temperature, the solubility of physcion increased and hence the total physcion yield also increased. Moreover, the physcion yield increased to the maximum with an increase in the methanol (solvent) ratio to the drug to a maximum level and a further increase in the methanol level led to a decrease in the physcion yield. The increase in the yield may be because more solvent tends to show an increase in thee solubility of the maximum physcion at a particular temperature and time. The physcion yield was found to decrease with the increase in the extraction time, which may be attributed to the degradation of the phytoconstituents due to long ultrasound action, as is supported by the findings of Wang et al. [23]. According to Mason et al. [24], the ultrasound may cause the formation of acoustic cavities in the plant cell, which lead to the cracks in the plant cell wall. When the extraction time increased during the experiment, the plant cells cracked completely because of the acoustic cavity formation, which led to the increase in the extraction yield of the desired phytoconstituents. In the meantime, the insoluble constituents became suspended in the extraction solvent, which resulted in a decrease in the solvent permeability. Furthermore, the desired phytoconstituent becomes re-adsorbed on the ruptured plant particles because of their comparatively more specific surface areas, leading to the decrease in the extraction yield of the desired constituents [25]. The optimization of the extraction parameters was performed by using the BBD of RSM to decide the optimum level of various extraction parameters to achieve the maximum yield of physcion. A liquid-to-solid ratio of 20.16 mL/g, an extraction temperature of 52.2 °C, and 46.6 min of extraction time were found to be the optimal conditions of the ultrasonication technique to obtain the maximum yield of physcion. The maximum predicted as well as the experimental values (% w/w) of physcion yield using the optimum extraction parameters of the ultrasonication technique were found to be 2.41 and 2.43 ± 0.16, respectively. The obtained experimental value was found to be close to the predicted values, which established the RSM model validity and also indicated the fitness of the model for the extraction procedure.

5. Conclusions

In this experiment, the BBD method was used to optimize the different extraction variables of ultrasound-assisted extraction (liquid-to-solid ratio, extraction temperature, and time) to obtain the maximum yield of physcion from the S. occidentalis aerial parts. The results found showed that the liquid-to-solid ratio and extraction temperature had a very distinct impact on the yield of physcion in comparison to the extraction time. The optimal extraction conditions for the ultrasonic extraction of physcion were found as follows: liquid-to-solid ratio of 20.16 mL/g, extraction temperature of 52.2 °C, and extraction time of 46.6 min. Under these optimal extraction conditions, the experimental yield (% w/w) of physcion was found to be 2.43%, which agreed closely with the predicted yield (2.41). The experimental value was consistent with the value predicted by the RSM model, thus validating the fitness of the employed model and the success of RSM in optimizing the extraction conditions. In future, this optimized ultrasonic extraction condition can be used in the maximum extraction of physcion from marketed herbal supplements containing S. occidentalis as well as other Senna species.

Author Contributions

Conceptualization, methodology, investigation, writing—original draft preparation, P.A.; Software, A.A.; Validation, formal analysis, R.N.H. and O.M.N.; Investigation, writing—review and editing, O.M.A.; Resources, supervision, project administration, funding acquisition, A.S.A. All authors have read and agreed to the published version of the manuscript.

Funding

This research received no external funding.

Institutional Review Board Statement

Not applicable.

Informed Consent Statement

Not applicable.

Data Availability Statement

Samples of SAME are available from the authors upon reasonable request.

Acknowledgments

The authors are thankful to the Researchers Supporting Project number (RSP 2021/132), King Saud University, Riyadh, Saudi Arabia.

Conflicts of Interest

The authors declare no conflict of interest.

References

  1. Liogier, H.A. Descriptive Flora of Puerto Rico and Adjacent Islands, Spermatophyla, Second Volume; Editorial de la Universidad de Puerto Rico: Rio Piedras, Puerto Rico, 1988; p. 481. [Google Scholar]
  2. Stevens, W.D.; Ulloa-U, C.; Pool, A.; Monitel, O.H. Flora de Nicaragua. Monographs of Systematic Botany, Volume 85; Missouri Botanical Garden Press: St. Louis, MO, USA, 2001; pp. 1–943. [Google Scholar]
  3. Haselwood, E.L.; Motter, G.G. Handbook of Hawaiian Weeds, Experiment Sattion; Hawaiian Sugar Planters Association: Honolulu, HI, USA, 1966; p. 479. [Google Scholar]
  4. Hu, S. Food Plants of China; Chinese University Press: Hong Kong China, 2005. [Google Scholar]
  5. Kolhapure, S.A.; Mitra, W.S. Meta-analysis of 50 phase III clinical trials in evaluation of efficacy and safety of Liv. 52 in infective hepatitis. Med. Update 2004, 12, 51–61. [Google Scholar]
  6. Yadav, J.P.; Arya, V.; Yadav, S.; Panghal, M.; Kumar, S.; Dhankhar, S. Cassia occidentalis L.: A review on its ethnobotany, phytochemical and pharmacological profile. Fitoterapia 2010, 81, 223–230. [Google Scholar] [CrossRef] [PubMed]
  7. Smolenski, I.J.; Silinis, H.; Farnsworth, N.R. Alkaloid screening. VI. Lloydia 1975, 38, 225–255. [Google Scholar]
  8. Agarwal, S.K.; Singh, S.S.; Verma, S.; Kumar, S. Antifungal activity of anthraquinone derivatives from Rheum emodi. J. Ethnopharmacol. 2000, 72, 43–46. [Google Scholar] [CrossRef]
  9. Ghosh, S.; Das Sarma, M.; Patra, A.; Hazra, B. Anti-inflammatory and anticancer compounds isolated from Ventilago madraspatana Gaertn, Rubia cordifolia Linn. and Lantana camara Linn. J. Pharm. Pharmacol. 2010, 62, 1158–1166. [Google Scholar] [CrossRef] [PubMed]
  10. Tamokou, J.d.D.; Tala, M.F.; Wabo, H.K.; Kuiate, J.R.; Tane, P. Antimicrobial activities of methanol extract and compounds from stem bark of Vismia rubescens. J. Ethnopharmacol. 2009, 124, 571–575. [Google Scholar] [CrossRef]
  11. Hong, J.Y.; Chung, H.J.; Bae, S.Y.; Trung, T.N.; Bae, K.; Lee, S.K. Induction of cell cycle arrest and apoptosis by physcion, an anthraquinone isolated from rhubarb (Rhizomes of Rheum tanguticum), in MDA-MB-231 human breast cancer cells. J. Cancer Prev. 2014, 19, 273–278. [Google Scholar] [CrossRef] [Green Version]
  12. Adnan, M.; Rasul, A.; Hussain, G.; Shah, M.A.; Sarfraz, I.; Nageen, B.; Riaz, A.; Khalid, R.; Asrar, M.; Selamoglu, Z.; et al. Physcion and Physcion 8-O-β-D-glucopyranoside: Natural Anthraquinones with Potential Anticancer Activities. Curr. Drug Targets 2021, 22, 488–504. [Google Scholar] [CrossRef]
  13. Cao, L.J.; Miao, J.; Liu, J.X.; Gao, W.Y.; Li, X. Research on contents of anthraquinones in Cassiae semen by principal component analysis. Zhongguo Zhong Yao Za Zhi 2015, 40, 2589–2593. [Google Scholar]
  14. Yan, J.; Wang, Y.; Wu, H.; Sun, Z.; Tan, S.; Wang, W.; Gong, L.; Xia, X.; Li, S. Development of a Method for Simultaneous Determination of Two Stilbenes and Four Anthraquinones from Polygonum cuspidatum by RP-HPLC. J. AOAC Int. 2019, 1, 69–74. [Google Scholar] [CrossRef] [PubMed]
  15. Diao, F.; Xie, Q.; Wu, X.; Liu, C.; Li, X.; Li, Q. Determination of sennoside B, sennoside A and physcion in slimming health foods. Wei Sheng Yan Jiu 2020, 49, 809–814. [Google Scholar]
  16. Liu, X.; Li, H.; Wu, L.; Xing, J.; Poh, Y.; Cai, H.; Cai, B.C. Simultaneous quantification of chrysophanol and physcion in rat plasma by ultrafast liquid chromatography-tandem mass spectrometry and application of the technique to comparative pharmacokinetic studies of Radix et Rhei Rhizoma extract alone and Dahuang Fuzi Decoction. J. Chromatogr. B Anal. Technol. Biomed. Life Sci. 2015, 980, 88–93. [Google Scholar]
  17. Alam, P.; Noman, O.M.; Herqash, R.N.; Almarfadi, O.M.; Akhtar, A.; Alqahtani, A.S. Response Surface Methodology (RSM)-Based Optimization of Ultrasound-Assisted Extraction of Sennoside A, Sennoside B, Aloe-Emodin, Emodin, and Chrysophanol from Senna alexandrina (Aerial Parts): HPLC-UV and Antioxidant Analysis. Molecules 2022, 27, 298. [Google Scholar] [CrossRef]
  18. Dhanani, T.; Singh, R.; Reddy, N.; Trivedi, A.; Kumar, S. Comparison on extraction yield of sennoside A and sennoside B from Senna (Cassia angustifolia) using conventional and non-conventional extraction techniques and their quantification using a validated HPLC-PDA detection method. Nat. Prod. Res. 2017, 31, 1097–1101. [Google Scholar] [CrossRef] [PubMed]
  19. Genovese, S.; Tammaro, F.; Menghini, L.; Carlucci, G.; Epifano, F.; Locatelli, M. Comparison of three different extraction methods and HPLC determination of the anthraquinones aloe-emodine, emodine, rheine, chrysophanol and physcione in the bark of Rhamnus alpinus L. (Rhamnaceae). Phytochem. Anal. 2010, 21, 261–267. [Google Scholar] [CrossRef] [PubMed]
  20. Zhang, L.L.; Xu, M.; Wang, Y.M.; Wu, D.M.; Chen, J.H. Optimizing ultrasonic ellagic acid extraction conditions from infructescence of Platycarya strobilacea using response surface methodology. Molecules 2010, 15, 7923–7932. [Google Scholar] [CrossRef]
  21. Zhong, K.; Wang, Q. Optimization of ultrasonic extraction of polysaccharides from dried longan pulp using response surface methodology. Carbohydr. Polym. 2010, 80, 19–25. [Google Scholar] [CrossRef]
  22. Zhao, L.C.; Liang, J.; Li, W.; Cheng, K.M.; Xia, X.; Deng, X.; Yang, G.L. The use of response surface methodology to optimize the ultrasound-assisted extraction of five anthraquinones from Rheum palmatum L. Molecules 2011, 16, 5928–5937. [Google Scholar] [CrossRef] [Green Version]
  23. Wang, X.S.; Wu, Y.F.; Dai, S.L.; Chen, R.; Shao, Y. Ultrasound-assisted extraction of geniposide from Gardenia jasminoides. Ultrason. Sonochem. 2012, 19, 1155–1159. [Google Scholar] [CrossRef] [PubMed]
  24. Mason, T.J.; Paniwnyk, L.; Lorimer, J.P. The uses of ultrasound in food technology. Ultrason. Sonochem. 1996, 3, S253–S260. [Google Scholar] [CrossRef]
  25. Zhao, S.; Kwok, K.C.; Liang, H. Investigation on ultrasound-assisted extraction of saikosaponins from Radix Bupleuri. Sep. Purif. Technol. 2007, 55, 307–312. [Google Scholar] [CrossRef] [PubMed]
Figure 1. The chemical structure of physcion.
Separations 09 00142 g001
Figure 2. The effects of single factors on the % yield of physcion. (A) Effect of the liquid-to-solid ratio (at constant temperature of 40 °C and time of 30 min). (B) Effect of the extraction temperature (at constant liquid-to-solid ratio of 20 mL/g and time of 30 min). (C) Effect of the extraction time (at constant liquid-to-solid ratio of 20 mL/g and temperature of 40 °C). Each value represents a mean ± SD (n = 5).
Separations 09 00142 g002
Figure 3. The response surface 3D plots and 2D contour plots showing the interaction effects of the liquid-to-solid ratio (M1), extraction temperature (M2), and extraction time (M) on the yields of physcion (R). (A) 3D plot of interaction effect of M1 and M2 on R; (B) 2D contour plot of interaction effect of M1 and M2 on R; (C) 3D plot of interaction effect of M1 and M3 on R; (D) 2D contour plot of interaction effect of M1 and M3 on R; (E) 3D plot of interaction effect of M2 and M3 on R; (F) 2D contour plot of interaction effect of M2 and M3 on R.
Separations 09 00142 g003
Figure 4. The linear correlation plot between the actual and predicted values for R.
Separations 09 00142 g004
Figure 5. The chromatogram of physcion estimation in SOME by the HPLC-UV method [Conditions: Pinnacle C18 column (4.6 × 250 mm, 5 µm); mobile phase, acetonitrile: 0.5% formic acid in ultra-pure water (gradient system); flow rate: 1 mL/min; UV-detection at λmax = 272 nm at temperature (25 ± 1 °C)]. (A) Representative chromatogram of physcion (Rt = 25.872). (B) Representative chromatogram of SOME containing physcion.
Separations 09 00142 g005
Table 1. The extraction factors (independent variables) selected for BBD optimization.
Independent VariableFactor levelDependent VariableGoal
−10+1
Liquid-to-solid ratio (M1)121824Physcion yield
(% w/w)
(R)
Maximized
Extraction temperature (°C) (M2)456075
Extraction time (min) (M3)254055
Table 2. The experimental parameters of the Box–Behnken design and the analysis of physcion (R) by HPLC-UV (n = 3).
RunFactor (Coded)Actual VariablesPhyscion Yield (R)
(M1)
(mL/g)
(M2)
(°C)
(M3)
(min)
(M1)
(mL/g)
(M2)
(°C)
(M3)
(min)
Experimental
(% w/w)
Predicted
(% w/w)
Residual
10−111845552.29 ± 0.082.30−0.0039
21012460552.19 ± 0.082.180.0121
3−1011260551.91 ± 0.051.91−0.0006
40−1−11845252.21 ± 0.082.200.0076
51−102445402.21 ± 0.072.22−0.0083
60001860402.25 ± 0.082.28−0.0307
70001860402.30 ± 0.092.280.0153
8−10−11260251.48 ± 0.031.49−0.0121
901−11875251.54 ± 0.041.540.0039
10−1101275401.21 ± 0.021.200.0082
1110−12460252.17 ± 0.022.170.0006
120001860402.31 ± 0.032.280.0153
131102475401.69 ± 0.041.70−0.0045
140111875551.86 ± 0.041.87−0.0076
15−1−101245401.77 ± 0.041.770.0045
160001860402.24 ± 0.082.220.0018
170001860402.24 ± 0.072.230.0013
Table 3. The regression analysis and response regression equation results for the final proposed model.
Dependent VariablesSourceR2Adjusted R2Predicted R2SD
RLinear0.65470.56050.44100.2334
2FI0.68670.45170.09060.2607
Quadratic0.99880.99670.99250.0201
Table 4. The ANOVA for the fitted quadratic polynomial model of R.
Dependent VariablesSourceSum of SquareDegree of FreedomMean SquareF-Valuep Value
RModel1.7390.1926474.84<0.0001
Residual0.002050.0004--
Lack of fit0.000630.00020.29190.8319
Pure error0.001420.0007--
Table 5. The significance of each response variable effect shown by using the F ratio and p-value in the nonlinear second-order model.
Dependent
Variables
Independent VariablesSS aDF bMS cF-Valuep-Value d
RLinear effects
M10.453610.45361118.18<0.0001
M20.592410.59241460.29<0.0001
M30.090310.0903222.62<0.0001
Quadratic effects
M120.009910.3333821.64<0.0001
M220.001410.2495615.06<0.0001
M320.003510.007919.430.0070
Interaction effects
M1M20.000310.00051.250.3147
M1M30.000210.0420103.590.0002
M2M30.000310.013032.030.0024
a Sum of squares; b Degree of freedom; c Mean sum of squares; d p-values < 0.05 were considered to be significant; ns: insignificant.
Table 6. The observed and predicted levels for the optimal extraction conditions.
FactorOptimal Level
M1(mL/g)20.16
M2 (°C)52.2
M3 (min)46.6
ResponsePredicted (%w/w)Experimental (%w/w, n = 3)Residual (%)
Physcion (% w/w)2.412.43 ± 0.160.52
Publisher’s Note: MDPI stays neutral with regard to jurisdictional claims in published maps and institutional affiliations.

