Article

Anti-Osteoporotic Effect of Viscozyme-Assisted Polysaccharide Extracts from Portulaca oleracea L. on H2O2-Treated MC3T3-E1 Cells and Zebrafish

Jilin Ginseng Academy, Key Laboratory of Active Substances and Biological Mechanisms of Ginseng Efficacy, Ministry of Education, Changchun University of Chinese Medicine, Changchun 130117, China
*
Authors to whom correspondence should be addressed.
Separations 2022, 9(5), 128; https://doi.org/10.3390/separations9050128
Submission received: 22 April 2022 / Revised: 9 May 2022 / Accepted: 17 May 2022 / Published: 20 May 2022

Abstract

:
This study aims to screen and characterize the protective effect of polysaccharides from Portulaca oleracea L. (POP) against H2O2-stimulated osteoblast apoptosis in vivo and in vitro. The enzymes viscozyme, celluclast, α-amylase, and β-glucanase were used to extract POPs. Among all enzyme-assisted POPs, the first participating fraction of viscozyme extract POP (VPOP1) exhibited the highest antioxidant activity. Hoechst 33342 and acridine orange/ethidium bromide staining and flow cytometry of MC3T3 cells revealed that VPOP1 inhibited apoptosis in a dose-dependent manner. Moreover, VPOP1 increased the expression levels of heme oxygenase-1 (HO-1) and NADPH quinine oxidoreductase 1 (NQO1) and decreased the expression levels of nuclear factor (erythroid-derived 2)-like 2 (Nrf2) and Kelch-like ECH-associated protein 1 (Keap1) in H2O2-induced cells compared with their controls. The results of an in vivo experiment show that VPOP1 significantly reduced reactive oxygen species generation and lipid peroxidation in zebrafish at 72 h post-fertilization and promoted bone growth at 9 days post-fertilization. Furthermore, VPOP1 was identified via 1-phenyl-3-methyl-5-pyrazolone derivatization as an acidic heteropolysaccharide comprising mannose and possessing a molecular weight of approximately 7.6 kDa. Collectively, VPOP1 was selected as a potential anti-osteoporotic functional food because of its protective activity against H2O2-induced damage in vitro and in vivo.

Graphical Abstract

1. Introduction

With the intensification of global aging, osteoporosis (OP) has gradually become an international research hotspot [1]. OP is a systemic metabolic disease characterized by bone mass reduction, bone microstructure destruction, and bone fragility increase [2]. Bone loss is related to a lack of estrogen [3], and age-related OP is closely related to oxidative stress [4]. Bone growth and maintenance require mesenchymal stem cells (MSCs) for osteogenic differentiation [5]. MSCs undergo metabolic switches such as reduced glycolysis and increased mitochondrial respiration to ensure adequate energy supply for differentiation [6]. In cells, mitochondrial electron transport is the main mechanism for reactive oxygen species (ROS) production [7]. Hence, an increase in mitochondrial metabolism is usually accompanied by an increase in endogenous ROS. During normal metabolism, ROS can be scavenged by antioxidants [8]. However, oxidative stress occurs when ROS production is not counterbalanced by the antioxidant activity of cells [9]. Oxidative stress can decrease osteoblast (OB) activity, induce OB apoptosis to accelerate bone flow, and promote osteoclast (OC) differentiation to disrupt bone homeostasis [10]. The current treatment for OP is estrogen therapy, but it has several non-skeletal adverse consequences [11]. Recent studies have strongly recommended the use of extracts from natural products to prevent OP, as the antioxidant activities of these extracts have been reported to reduce oxidative damage to a certain extent and improve the symptoms of OP [12].
With its tenacious vitality, Portulaca oleracea L. (POL) is distributed in tropical and subtropical regions [13]. POL is an edible plant used as a folk medicine to treat a wide range of ailments in several countries [14]. The major bioactive components of POL are proteins, polysaccharides, flavonoids, alkaloids, and vitamins [15,16]. Conventional extraction techniques have reduced extraction yield due to compounds bound to the cell wall. Various extraction strategies, such as enzyme-assisted extraction, have been employed to maximize the extraction efficiency of bioactive macromolecules [17]. Enzyme-assisted extraction releases intracellular components by disrupting plant cell walls. [18]. α-Amylase can improve the liberation of non-extractable polyphenols and increase extract yield [19]. Enzymes serve several functions in the recovery of polysaccharides [20]. Hydrolysate of viscozyme exerts high peroxide-free radical scavenging activity [21]. The internal sites of the polysaccharide chain will be randomly attacked by cellulase to generate small oligosaccharides of varied lengths. [22] Therefore, the embedded molecules are more easily released. The enzyme-assisted degradation of cell walls increases the yield of polysaccharide extraction [23]. Moreover, polysaccharides from POL (POPs) can scavenge superoxide anion. However, POL has many components and exerts complex pharmacological effects, and its pharmacologic anti-osteoporotic mechanism has yet to be elucidated. Therefore, in this study, the anti-osteoporotic activities of four enzyme-extracted POPs were screened and characterized.

2. Materials and Methods

2.1. Polysaccharides Extracted from POL

Four different enzymes, including viscozyme, celluclast, α-amylase, and β-glucanase, were employed for polysaccharide extraction. POL was purchased from a pharmacy in Changchun, Jilin Province, China. POL was sun-dried and ground, then soaked in petroleum ether for 24 h. The defatted powder was suspended in 95% ethanol for 24 h to remove any pigment and small molecules. The ethanol was removed using a vacuum evaporator. Subsequently, the dried powder was mixed with 1% enzyme and suspended in deionized water at a ratio of 1:15 (g mL−1). In order to avoid the protein being highly insoluble and hindering the release of biomolecules [24], various enzymes were selected to obtain the optimum pH. The optimum pH of viscozyme and celluclast was 4.5, and that of α-amylase and β-glucanase was 6.0. Therefore, the mixture was divided into four flasks, in which the pH was adjusted to 4.5, 4.5, 6.0, and 6.0, respectively, by diluted HCl and NaOH. Viscozyme- and celluclast-assisted aqueous extraction was agitated for 8 h at 50 °C, whereas α-amylase- and β-glucanase-assisted aqueous extraction was agitated for 8 h at 60 °C. The particles were removed using a large-scale filter. Four enzymes in the supernatants were denatured by incubating the mixture at 100 °C for 20 min. The supernatants were treated with Sevag reagent to remove proteins [25], and then the collected supernatants were regarded as crude POP. Step gradient alcohol precipitation was performed to obtain POPs [26]. The crude POP was gradually precipitated by approximately 30%, 60%, 80%, and 90% ethanol, and the four fractions were denoted as “POP1”, “POP2”, “POP3”, and “POP4”.

2.2. Survival Rate and ROS Detection

Mouse OB cell line MC3T3-E1 was purchased from the American Type Culture Collection. Depending on the different degrees of influence on the cell state, the appropriate concentration was screened and determined as the modeling concentration; POPs with different concentrations were used to intervene in the damaged cells. A colorimetric 3-(4,5)-dimethylthiahiazo(-z-y1)-2,5-diphenytetrazoliumromide (MTT; Solarbio, Beijing, China) assay was carried out to detect cell viability in H2O2-stimulated MC3T3 cells [27]. A density of 1 × 10⁴ cells well−1 MC3T3 cells were seeded in 96-well plates. Upon reaching 80% confluence, the cells were added to increasing concentrations (12.5–100 μg mL−1) of POPs, and then treated with H2O2 for 24 h. Subsequently, each plate was added to 50 μL of PBS solution with 2 mg mL−1 of MTT. Following incubation for 3 h, the medium was gently removed, and precipitate was dissolved in 200 μL of dimethyl sulfoxide. The absorbance was obtained with a microplate reader at 540 nm. Cell survival rate was calculated as a percentage of formazan absorption in the control cells.
Determination of intracellular ROS levels in MC3T3 cells was performed using a DCFH-DA probe [28]. The cells seeding and sample treating were the same by cell viability assay. After being treated with H2O2, the cells were treated with 10 μL of DCFH-DA (0.5 mg mL−1) after 3 h of incubation. A fluorescence microscope was used to detect the cell fluorescence intensity. Excitation and emission wavelength were operated at 485 nm and 530 nm, respectively.

2.3. Hoechst 33342 and Acridine Orange/Ethidium Bromide Staining

Hoechst 33342 and acridine orange/ethidium bromide (AO/EB) staining are morphological probes to reveal apoptotic changes in cells. A density of 1 × 10⁵ cells mL−1 MC3T3 cells was pre-seeded in 12-well culture plates, and H2O2-induced cells were added to increasing concentrations of POPs and incubated for 24 h. Controls were not treated with POPs and H2O2. For Hoechst 33342 staining, each plate was added to 10 μL of Hoechst 33342 (1 mg mL−1) solution for 10 min at room temperature in the dark. For acridine orange/ethidium bromide (AO/EB) staining, 10 µL of AO/EB (100 µg mL−1) was added to each well for 10 min at room temperature in the dark, and then washed with PBS three times. The image was then captured under a fluorescence microscope (Nikon, Tokyo, Japan).

2.4. Flow Cytometry Analysis

MC3T3 cells were seeded at a density of 2 × 10⁵ cells mL−1 in 6-well culture plates and then added to indicated concentrations of POPs. Following a 24 h incubation, the culture medium was rinsed by pre-cooled PBS. The cell pellet was suspended in 1× binding buffer. The cells were continuously stained with PI and Annexin V-FITC (Becton Dickinson, Frankly Lakes, NJ, USA) for 15 min in the dark. Samples were analyzed within 1 h after staining. Cells were analyzed using a flow cytometer system (FlowSight, Merck Millipore, Seattle, WA, USA) and data were analyzed using the IDEAS (FlowSight, Merck Millipore, Seattle, WA, USA).

2.5. Western Blot Analysis

A density of 2 × 10⁶ cells mL−1 MC3T3 cells was seeded in 6-well culture plates for 24 h incubation. The H2O2-induced MC3T3 cells were added to increasing concentrations of POPs and then collected after 24 h. The cells were suspended and homogenized in lysis buffer for 1 h. Then, the suspension was centrifuged to remove the pellet. A BCA kit (Solebao, Beijing, China) was employed to detect protein content. Polyacrylamide gels (10%) were loaded with 20 µg of protein from each sample treated with lysis buffer. Different molecular weights of protein were separated by electrophoresis. The separated protein bands were subsequently transferred onto a nitrocellulose membrane. Then, blocking buffer blocked the membrane for 3 h at room temperature. The membrane was incubated with primary antibodies at 4 °C for 8 h, followed by secondary antibodies at room temperature for 3 h. All immunoblots were processed using the Chemiluminescence Substrate Kit (Biosharp, Beijing, China) and visualized through chemiluminescence imaging (Tanon 5200, Shanghai, China). Band intensities were measured using ImageJ software (National Institutes of Health, Bethesda, MD, USA).

2.6. Analysis of Zebrafish Embryos

AB wild-type zebrafish (Danio rerio) were obtained from EzeRinka Biotechnology Co., Ltd. (Nanjing, China). Zebrafish were incubated in a water tank at 28.5 °C with a light/dark cycle of 14/10 h, and fed three times a day with live brine shrimp (Artemia). Embryos were obtained from natural spawning. The embryos were collected and incubated in E3 medium. The levels of H2O2-induced ROS and lipid peroxidation in the embryos were evaluated. Each group was randomly set with fifteen embryos into 6-well plates at 7 h post-fertilization (hpf). The embryos were added to concentrations of POPs followed by H2O2 treatment. Fresh medium was added every 24 h until the third day. Fluorescent probes, DCFH-DA and diphenyl-1-pyrenylphosphine, were used to detect ROS production and lipid peroxidation, respectively. The microscopic fluorescence images of the embryos were obtained under a fluorescence microscope (Nikon, Tokyo, Japan).
Each group was randomly set with fifty embryos into Petri dishes at 5 hpf. The embryos were added to H2O2 and POPs at 7 hpf and collected at 72 hpf. The collected embryos were homogenized with lysis buffer, and subsequently for Western blot analysis.
Bone development in the larval stage of zebrafish was visualized using the fluorescent chromophore calcein. The embryos were added to increasing concentrations of POPs and then incubated for 1 h. A fresh medium of H2O2 was added to each well containing 5-day post-fertilization (dpf) embryos. Fresh culture medium was added after every 24 h of incubation and then transferred onto 24-well plates at 9 dpf. After adding calcein-containing solution (2 mg mL−1), the embryos were incubated in the dark at room temperature for 5 min and then washed with E3 water until colorless. After zebrafish staining, images of the embryos were obtained under a fluorescence microscope (Nikon, Tokyo, Japan).

2.7. Molecular Weight of POPs

High-performance liquid chromatography and gel permeation chromatography (HPLC-GPC) were employed to determine the molecular weight (Mw) of POPs. Dextran standards and POPs were dissolved in 0.7% sodium sulfate solution at a concentration of 10 mg mL−1 and analyzed on an LC-2030C 3D Series HPLC (Shimadzu Corporation, Kyoto, Japan) system equipped with a RID (RID-20A) and a Sepex SRT SEC-100 column (7.8 × 300 mm, 5 μm). The column was maintained at 35 °C. The 0.7% sodium sulfate solution was used as the mobile phase at a flow rate of 0.5 mL min−1. A total of 10 μL of sample was injected. The Mw ranges of dextran standards are from 100 Da to 100,000 Da, analyzed by Agilent Chem Station GPC Data Analysis Software (Rev. A.02.01, Agilent Technologies, Palo Alto, CA, USA). The Mw of POPs was calculated and compared with that of dextran standards.

2.8. Monosaccharide Composition of POPs

The monosaccharide composition of POPs was determined using the HPLC method of PMP [29]. Briefly, 2 mol L−1 trifluoroacetic acid (2 mL) was added to the polysaccharide sample in a small ampoule, which was then kept in full nitrogen atmosphere for 8 h at 100 °C. The residue was mixed with 1 mL of methanol, then dried by nitrogen stream. The above procedure was repeated five times. The dried residue dissolved in 10 mL of distilled water. The aqueous solution of hydrolyzed polysaccharide or monosaccharide standard mixture was mixed with 5 mL of 0.3 mol L−1 sodium hydroxide. The mixture was treated with a 0.5 mol L−1 methanolic solution (6 mL) of PMP and well mixed. The mixture was incubated at 70 °C for 1 h, then neutralized with 0.3 mol L−1 hydrochloric acid. Extraction was performed three times with an equal volume of chloroform. The aqueous solution was collected and allowed to stand overnight. Following filtration, the aqueous solution was analyzed by HPLC instrument (Agilent1260, Agilent Technologies, Palo Alto, CA, USA) equipped with a Diamonsil C18 analytical column (250 × 4.6 mm, 5 μm). The PMP derivatives were eluted with mobile phases A and B at a flow rate of 0.9 mL min−1. A total of 10 μL of sample was injected. Mobile phase A contained phosphate buffer (pH 6.8) and acetonitrile in a ratio of 85:15 (v/v, %). Mobile phase B contained PBS (pH 6.8) and acetonitrile in a ratio of 60:40 (v/v, %). The column was maintained at 35 °C, and UV absorbance was set up at 250 nm. A linear gradient was used as follows: 0–10 min, 8% A/B; 10–40 min, 8–13% A/B; 40–51 min, 13–20% A/B; 51–52 min, 0% A/B; and 52–60 min, 0% B. The monosaccharide composition of POPs was compared with standards.
Standard monosaccharides (mannose, glucuronic acid, fucose, arabinose, xylose, galactose, galacturonic acid, rhamnose, and glucose) and dextran standards (1000, 5000, 12,000, and 150,000 Da) were purchased from Sigma-Aldrich Co., St Louis, MO, USA.

2.9. Statistical Analysis

Experiments in this study were performed in triplicate. Data are expressed as mean ± standard deviation (SE), and statistical analysis was performed using Excel and Origin 8.0 software. Means in GraphPad prism 5 were subjected to one-way ANOVA. Means of parameters were analyzed using Student’s t-test. * p < 0.05, ** p < 0.01, and *** p < 0.001 were regarded as significant differences.

3. Results

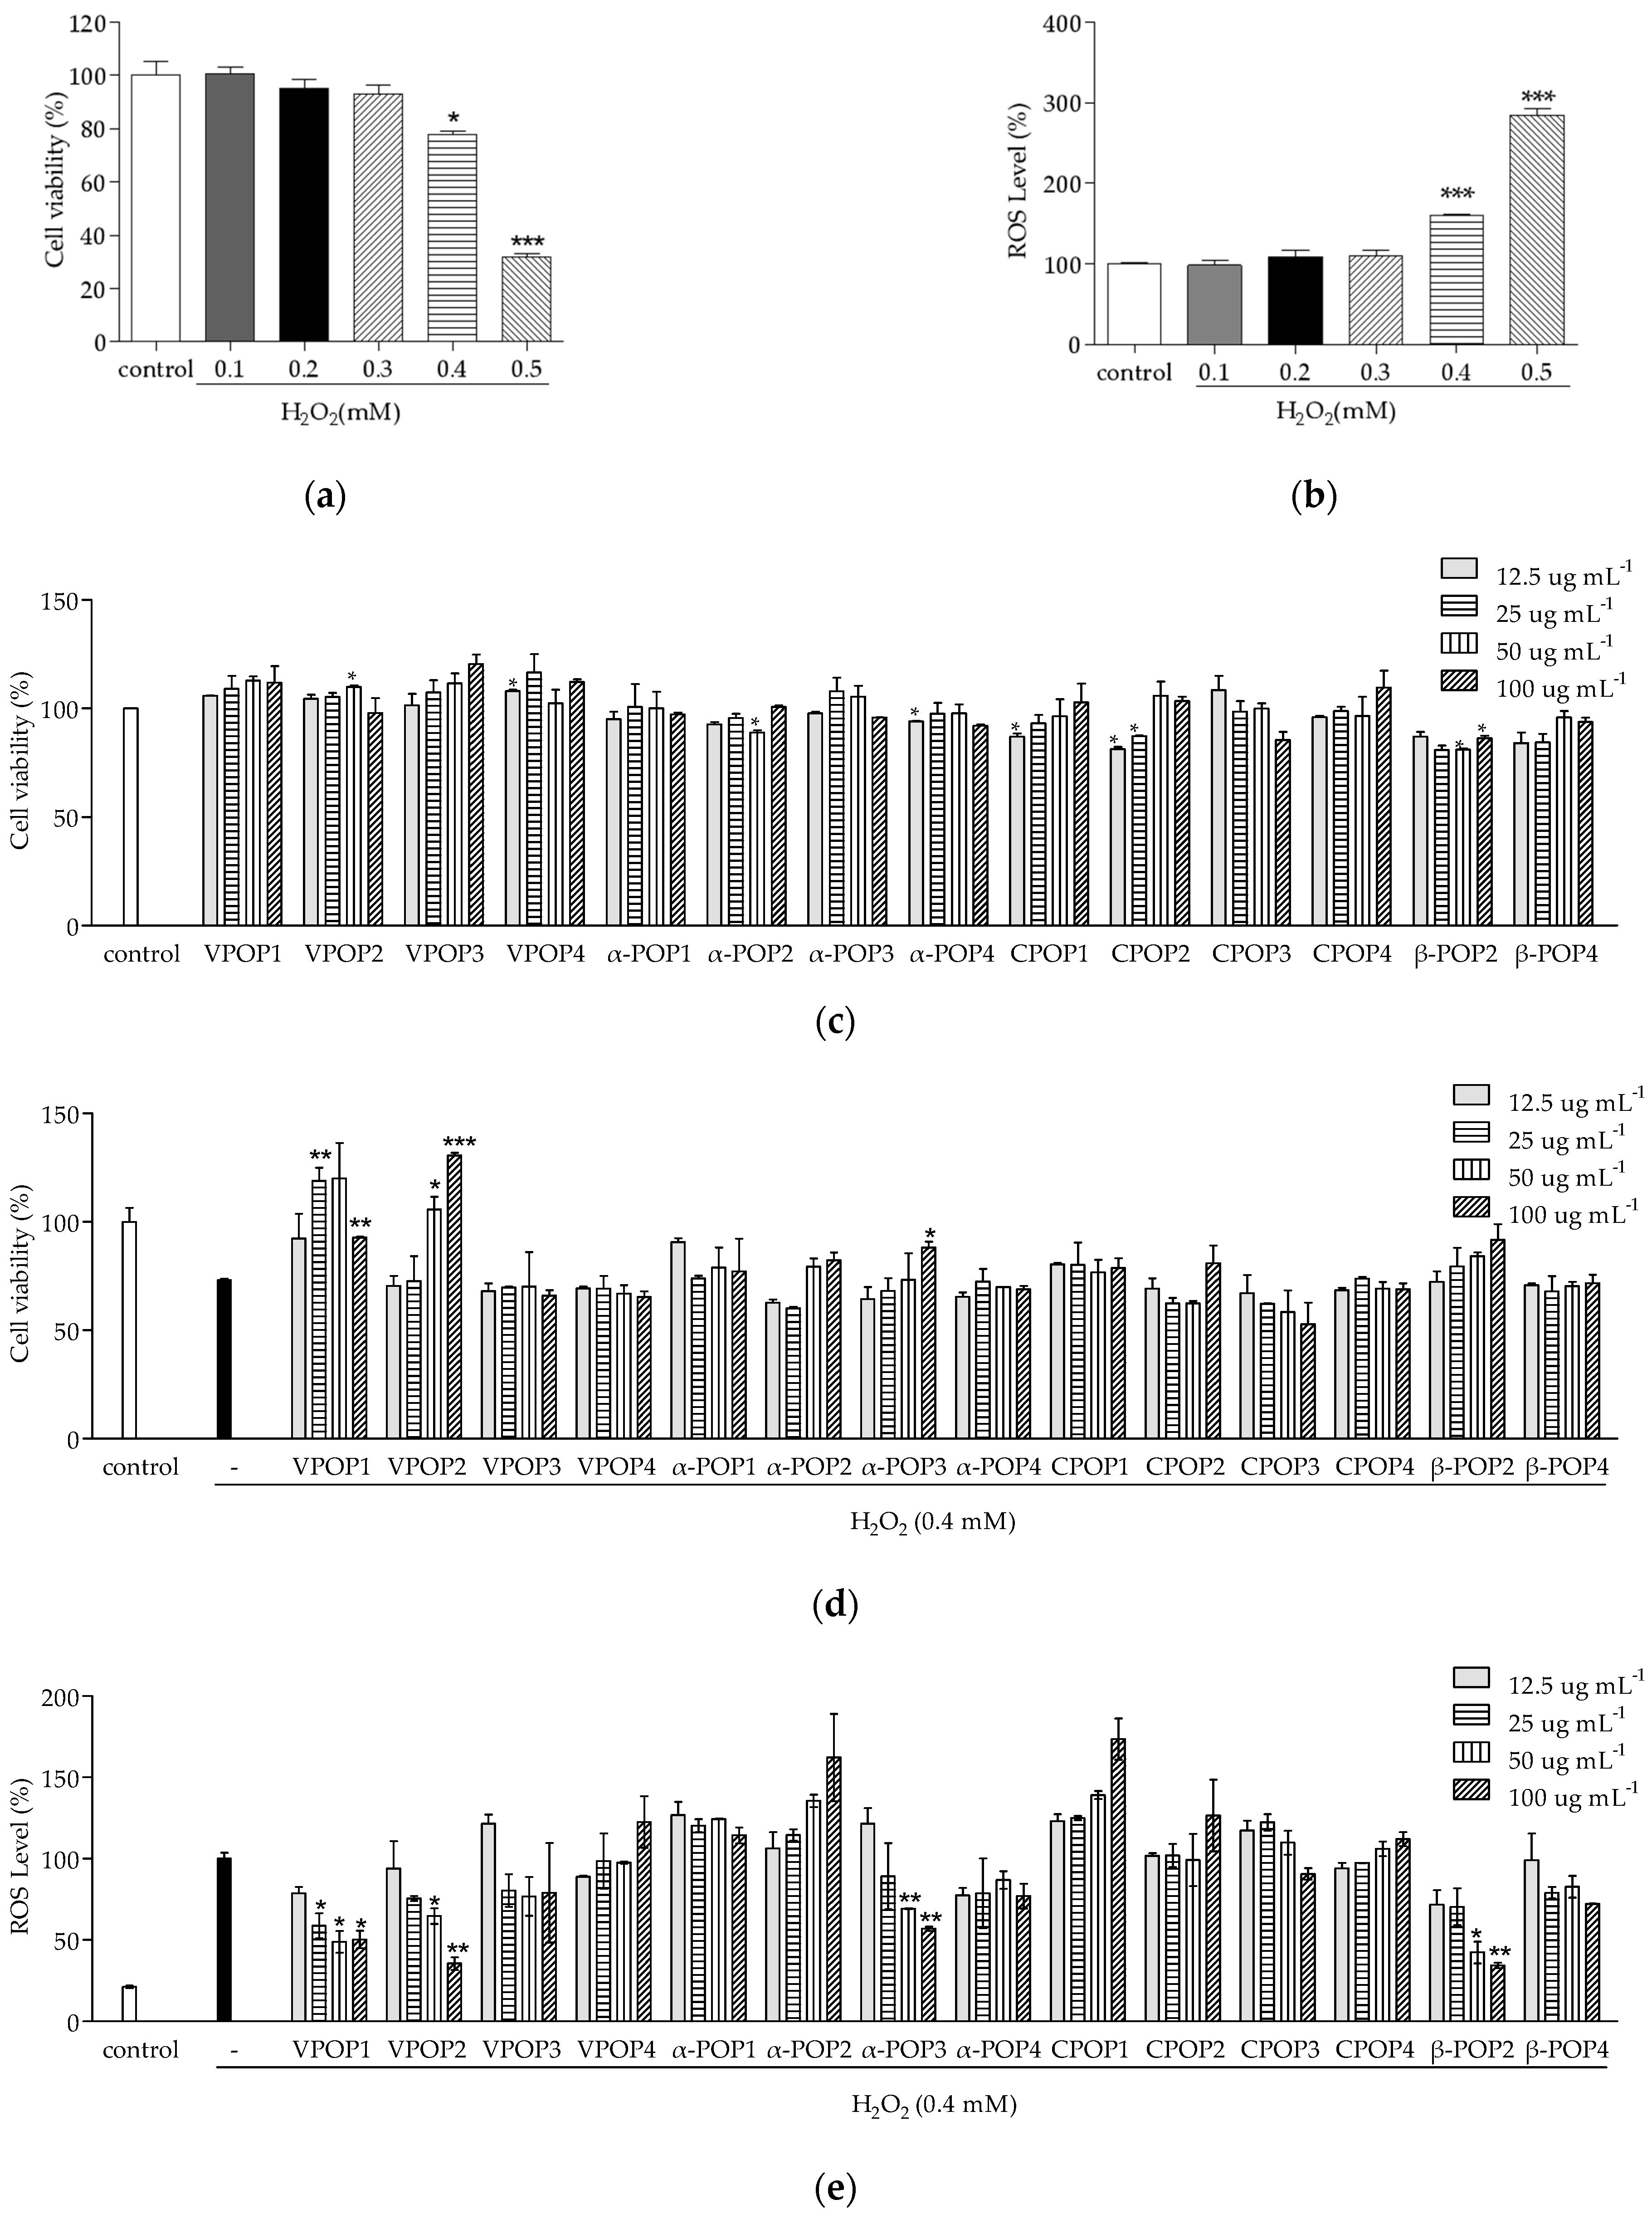
3.1. Separation and Protective Effect of POPs

POPs extracted using the enzymes viscozyme, celluclast, α-amylase, and β-glucanase were denoted as “VPOP”, “CPOP”, “α-POP”, and “β-POP”, respectively. Fourteen different POPs were extracted, including 30% ethanol-precipitated polysaccharides (VPOP1, α-POP1, and CPOP1), 60% ethanol-precipitated polysaccharides (VPOP2, α-POP2, CPOP2, and β-POP2), 80% ethanol-precipitated polysaccharides (VPOP3, α-POP3, and CPOP3), and 90% ethanol-precipitated polysaccharides (VPOP4, α-POP4, CPOP4, and β-POP4). The yields of viscozyme-, celluclast-, α-amylase-, and β-glucanase-assisted extract were 12.15 ± 1.31%, 25.35 ± 1.69%, 13.78 ± 1.78%, and 11.64 ± 0.96%, respectively. The yields obtained from step gradient ethanol precipitation were inversely related to fractions. For instance, the first fraction of VPOP1 gave the highest yield, which was 14.42%.
The results show that 0.4 mM and 0.5 mM H2O2 significantly decreased cell viability compared with the blank group (Figure 1a) and increased cellular ROS levels (Figure 1b). H2O2 can cause acute oxidative damage and induce ROS overproduction. In addition, 0.4 mM H2O2 was selected as the final concentration for simulating oxidative stress. The four enzyme-assisted extracted polysaccharides improved cell viability in a dose-dependent manner. Initially, different concentrations of POPs were added to the cells for evaluating the cytotoxicity of POPs using an MTT assay (Figure 1c). Cytotoxicity screening showed that 14 fractions had survival rates above 80% at the indicated concentration. Hence, these concentrations, ranging from 12.5 μg mL−1 to 100 μg mL−1, were selected for further investigation. VPOP1, VPOP2, β-POP2, and α-POP3 improved cell viability to varying degrees compared with the model group (Figure 1d) and significantly decreased intracellular ROS levels (Figure 1e). Among all extracts, VPOP1 showed the strongest protective effect on H2O2-induced MC3T3 cells.

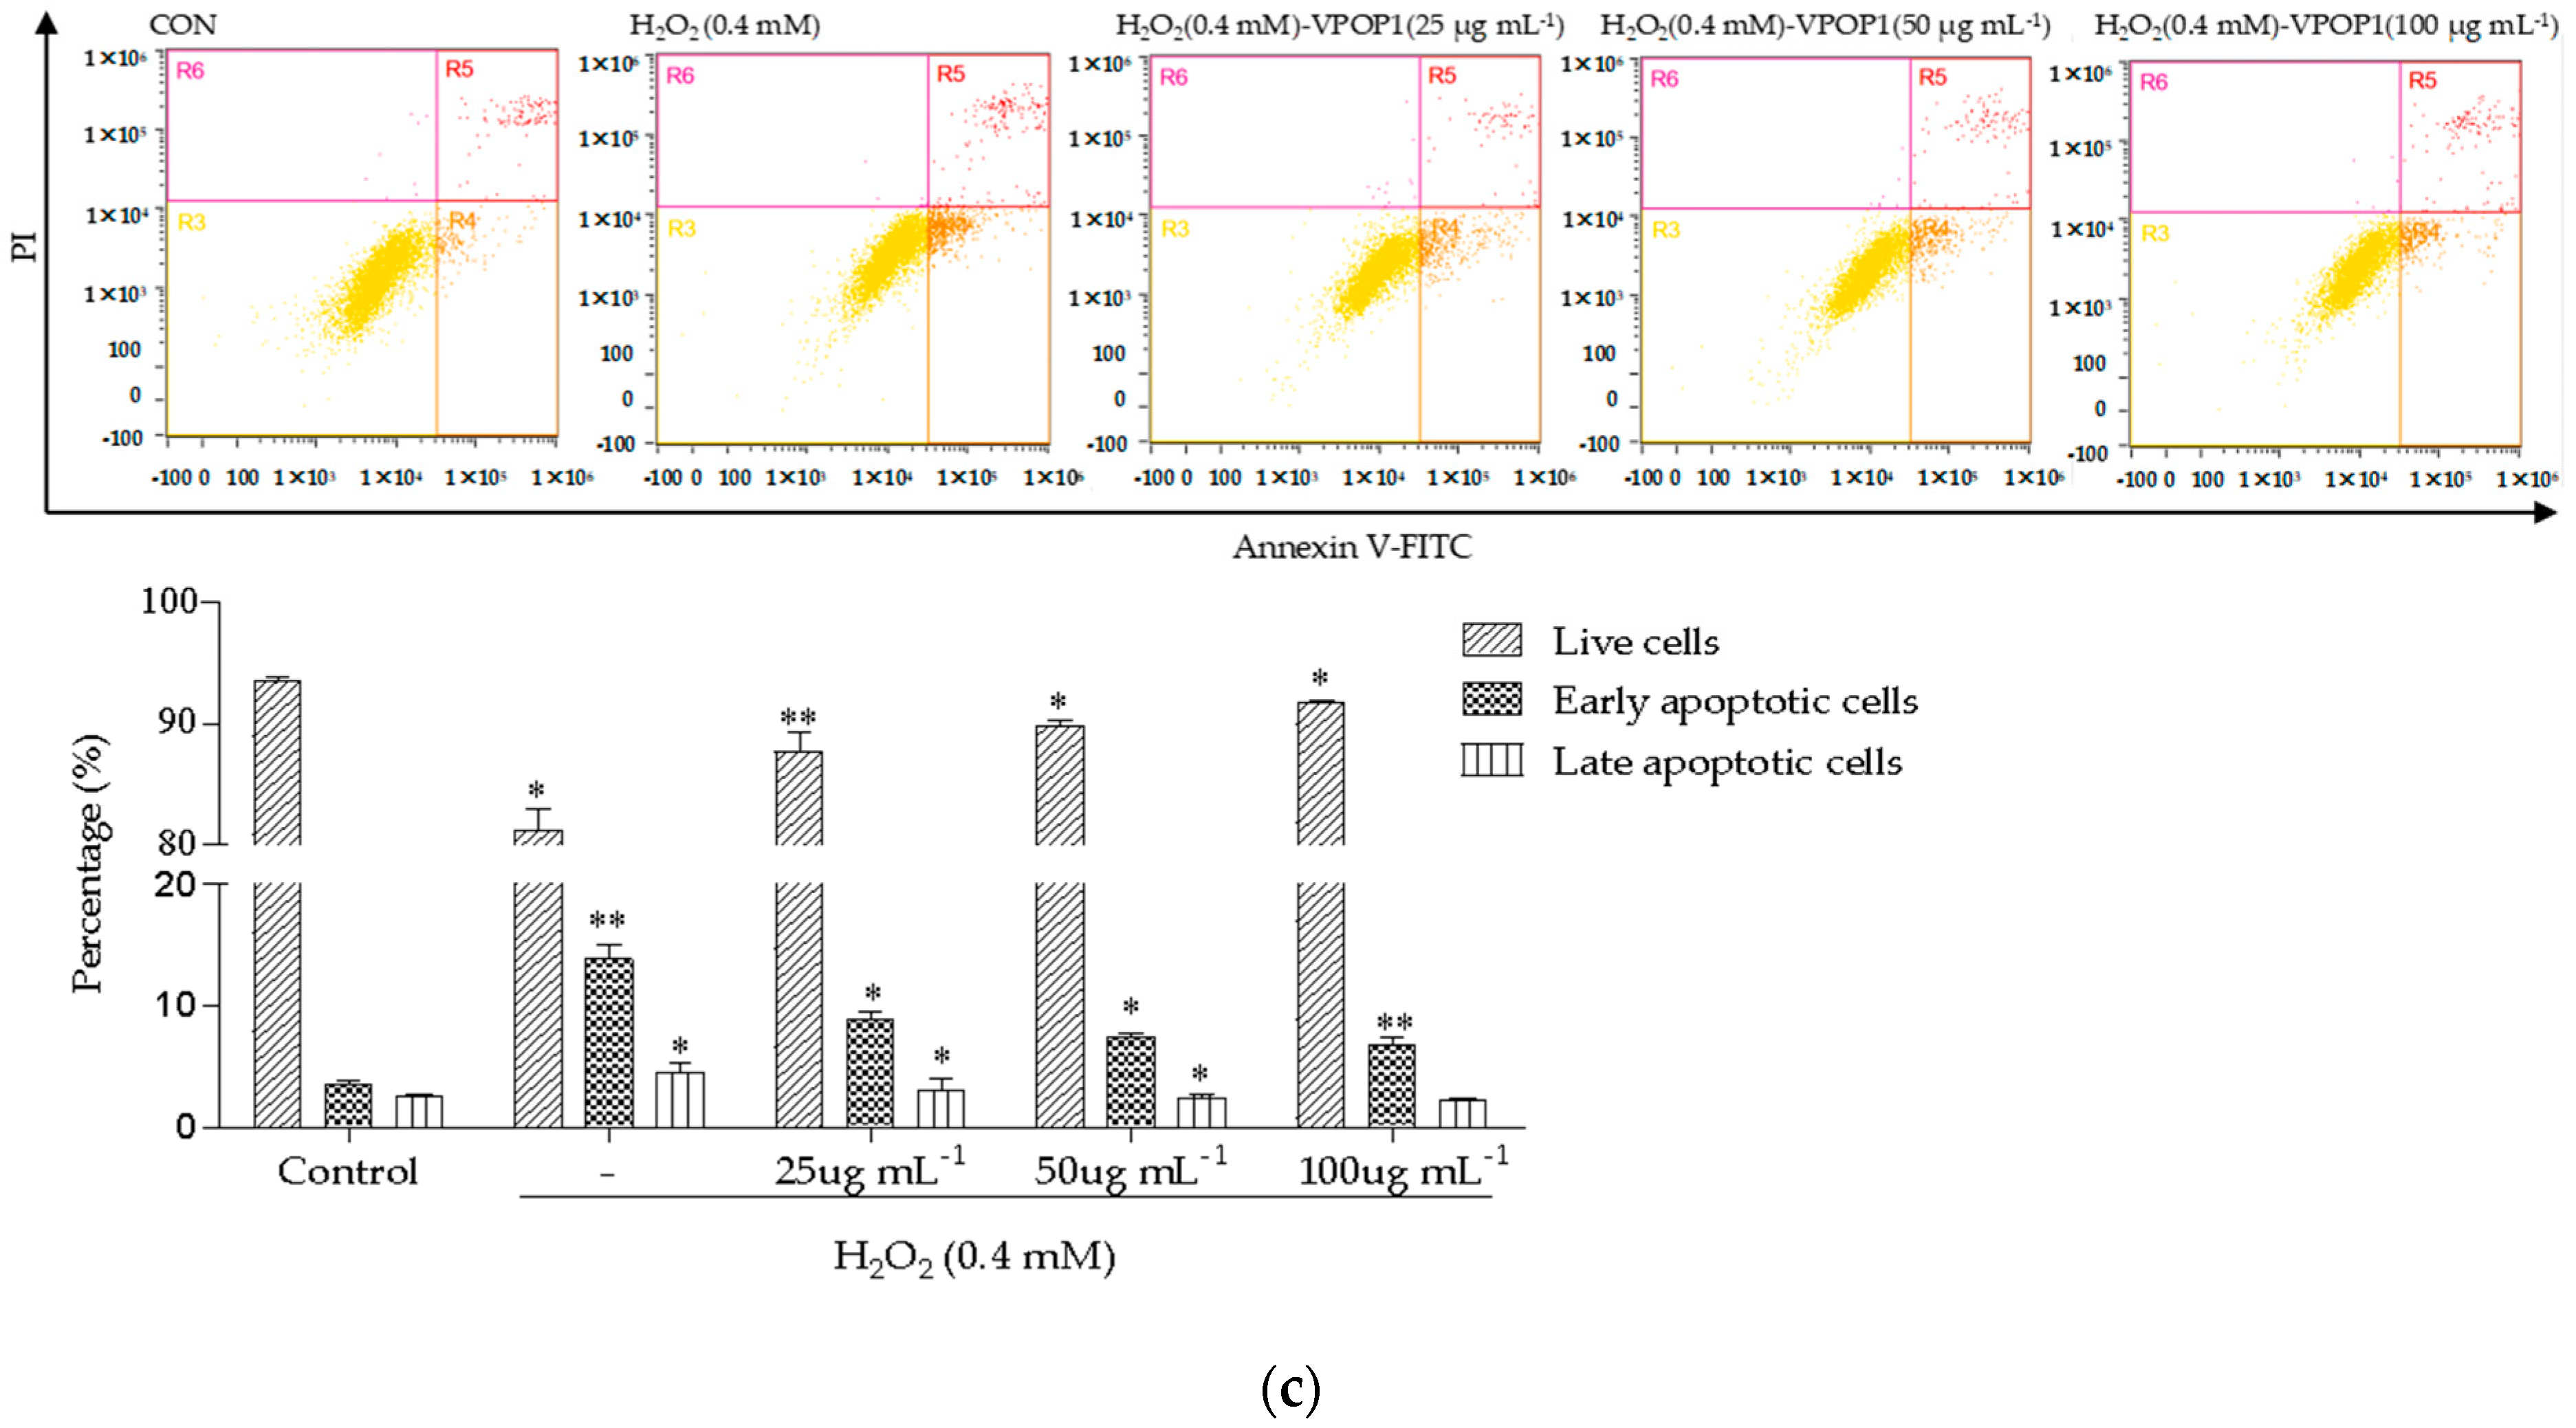
3.2. Apoptotic Morphology of MC3T3 Cells

Hoechst 33342, a blue fluorescent dye, enters normal cell membranes in small amounts, causing them to stain a low blue color. For apoptotic cells, Hoechst 33342 entered apoptotic cells more than normal cells. Hence, the fluorescence intensity in apoptotic cells was stronger than that in normal cells. As shown in Figure 2a, the control group showed an intact nuclear morphology, whereas apoptotic body formation was clearly identified in the H2O2-treated MC3T3 cells. VPOP1 significantly inhibited the formation of apoptotic bodies, and the inhibitory effect was stronger with the increase in the treatment concentration. This indicated that VPOP1 could inhibit the formation of apoptotic bodies by remarkably reducing the total cellular ROS levels.
AO/EB staining was performed to characterize cell morphology. As shown in Figure 2b, fragmented green patches of early apoptotic cells were observed in the control, H2O2-treated, and VPOP1 groups. The control group showed a large number of viable cells with green homogeneous nuclei, whereas apoptotic body formation was clearly identified in the H2O2-treated group. Apoptotic bodies (necrotic cells) appeared homogenously red and showed damaged cytoplasmic membranes. In addition, late apoptotic cells with green and orange or orange particulate matter were observed in the model group and the low-concentration VPOP1 group. Furthermore, VPOP1 remarkably reduced the formation of apoptotic bodies in a dose-dependent manner.
The apoptosis of cells treated with increasing concentrations (25–100 μg mL−1) of VPOP1 was detected using flow cytometry to further evaluate the protective effect of VPOP1 on H2O2-induced MC3T3 apoptosis. As shown in Figure 2c, the occurrence of events in the early apoptotic cells (the lower right quadrant R4) and late apoptotic cells (the upper right quadrant R5) markedly decreased with increasing VPOP1 concentration. These results are consistent with the cell staining data presented above.

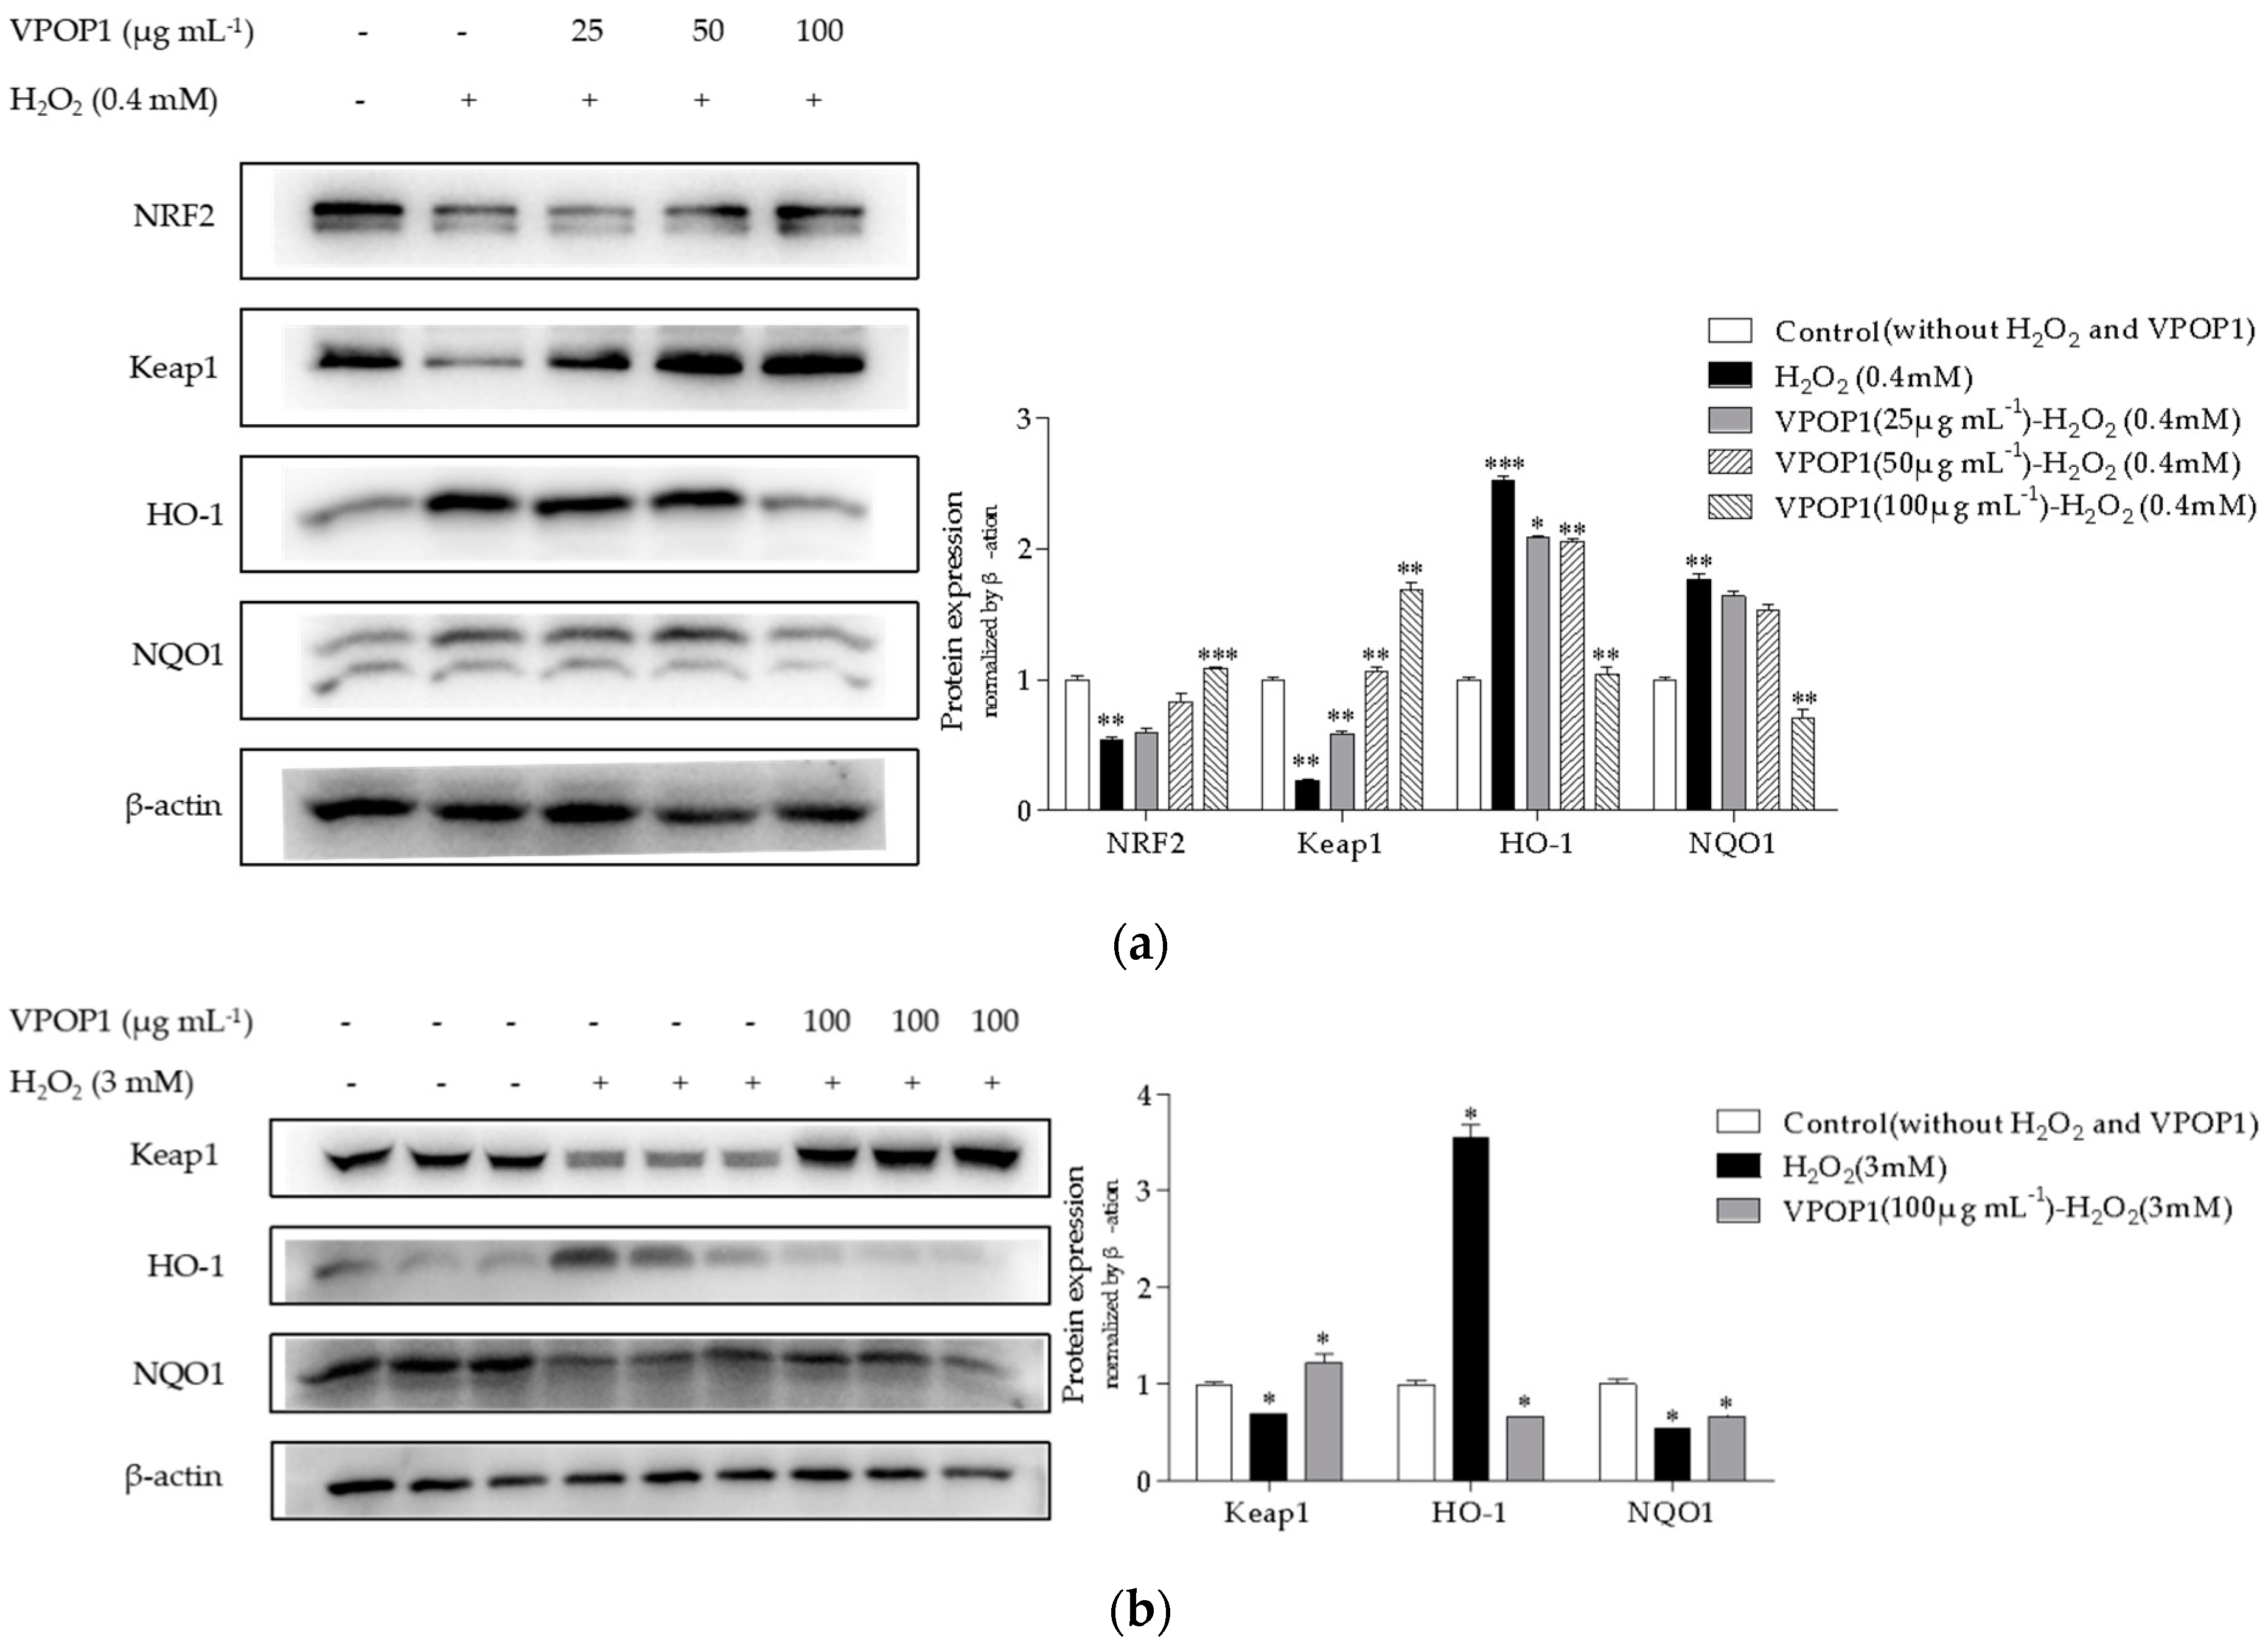
3.3. VPOP1 against Oxidative Stress via the Nrf2/Keap1 Pathway

The nuclear factor (erythroid-derived 2)-like 2 (Nrf2)/Kelch-like ECH-associated protein 1 (Keap1) signaling pathway is the direct downstream pathway of ROS and regulates the transcription of ARE-dependent genes to maintain cellular redox homeostasis. As shown in Figure 3a, the expression of Nrf2 and Keap1 was inhibited during H2O2-induced oxidative stress. However, the expression levels of these proteins significantly increased after treatment with increasing concentrations (25–100 μg mL−1) of VPOP1. Heme oxygenase-1 (HO-1) and NADPH quinine oxidoreductase 1 (NQO1) are key genes in the Nrf2/ARE pathway. The expression levels of NQO1 and HO-1 significantly increased in the H2O2-induced group but dose-dependently decreased in the VPOP1 group.
The Nrf2/Keap1 system is not only present in mammals but also in zebrafish with similar functions. The optimal H2O2 concentration in zebrafish was selected as 3 mM. As shown in Figure 3b, declined expression of Keap1 and elevated expression of HO-1 and NQO1 proteins were found in the H2O2-exposed groups compared with the control. However, the protein expression in the VPOP1 group was consistent with that in the control group. These results show that VPOP1 can resist apoptosis by regulating the Nrf2-Keap1 pathway to exert an anti-osteoporotic effect.

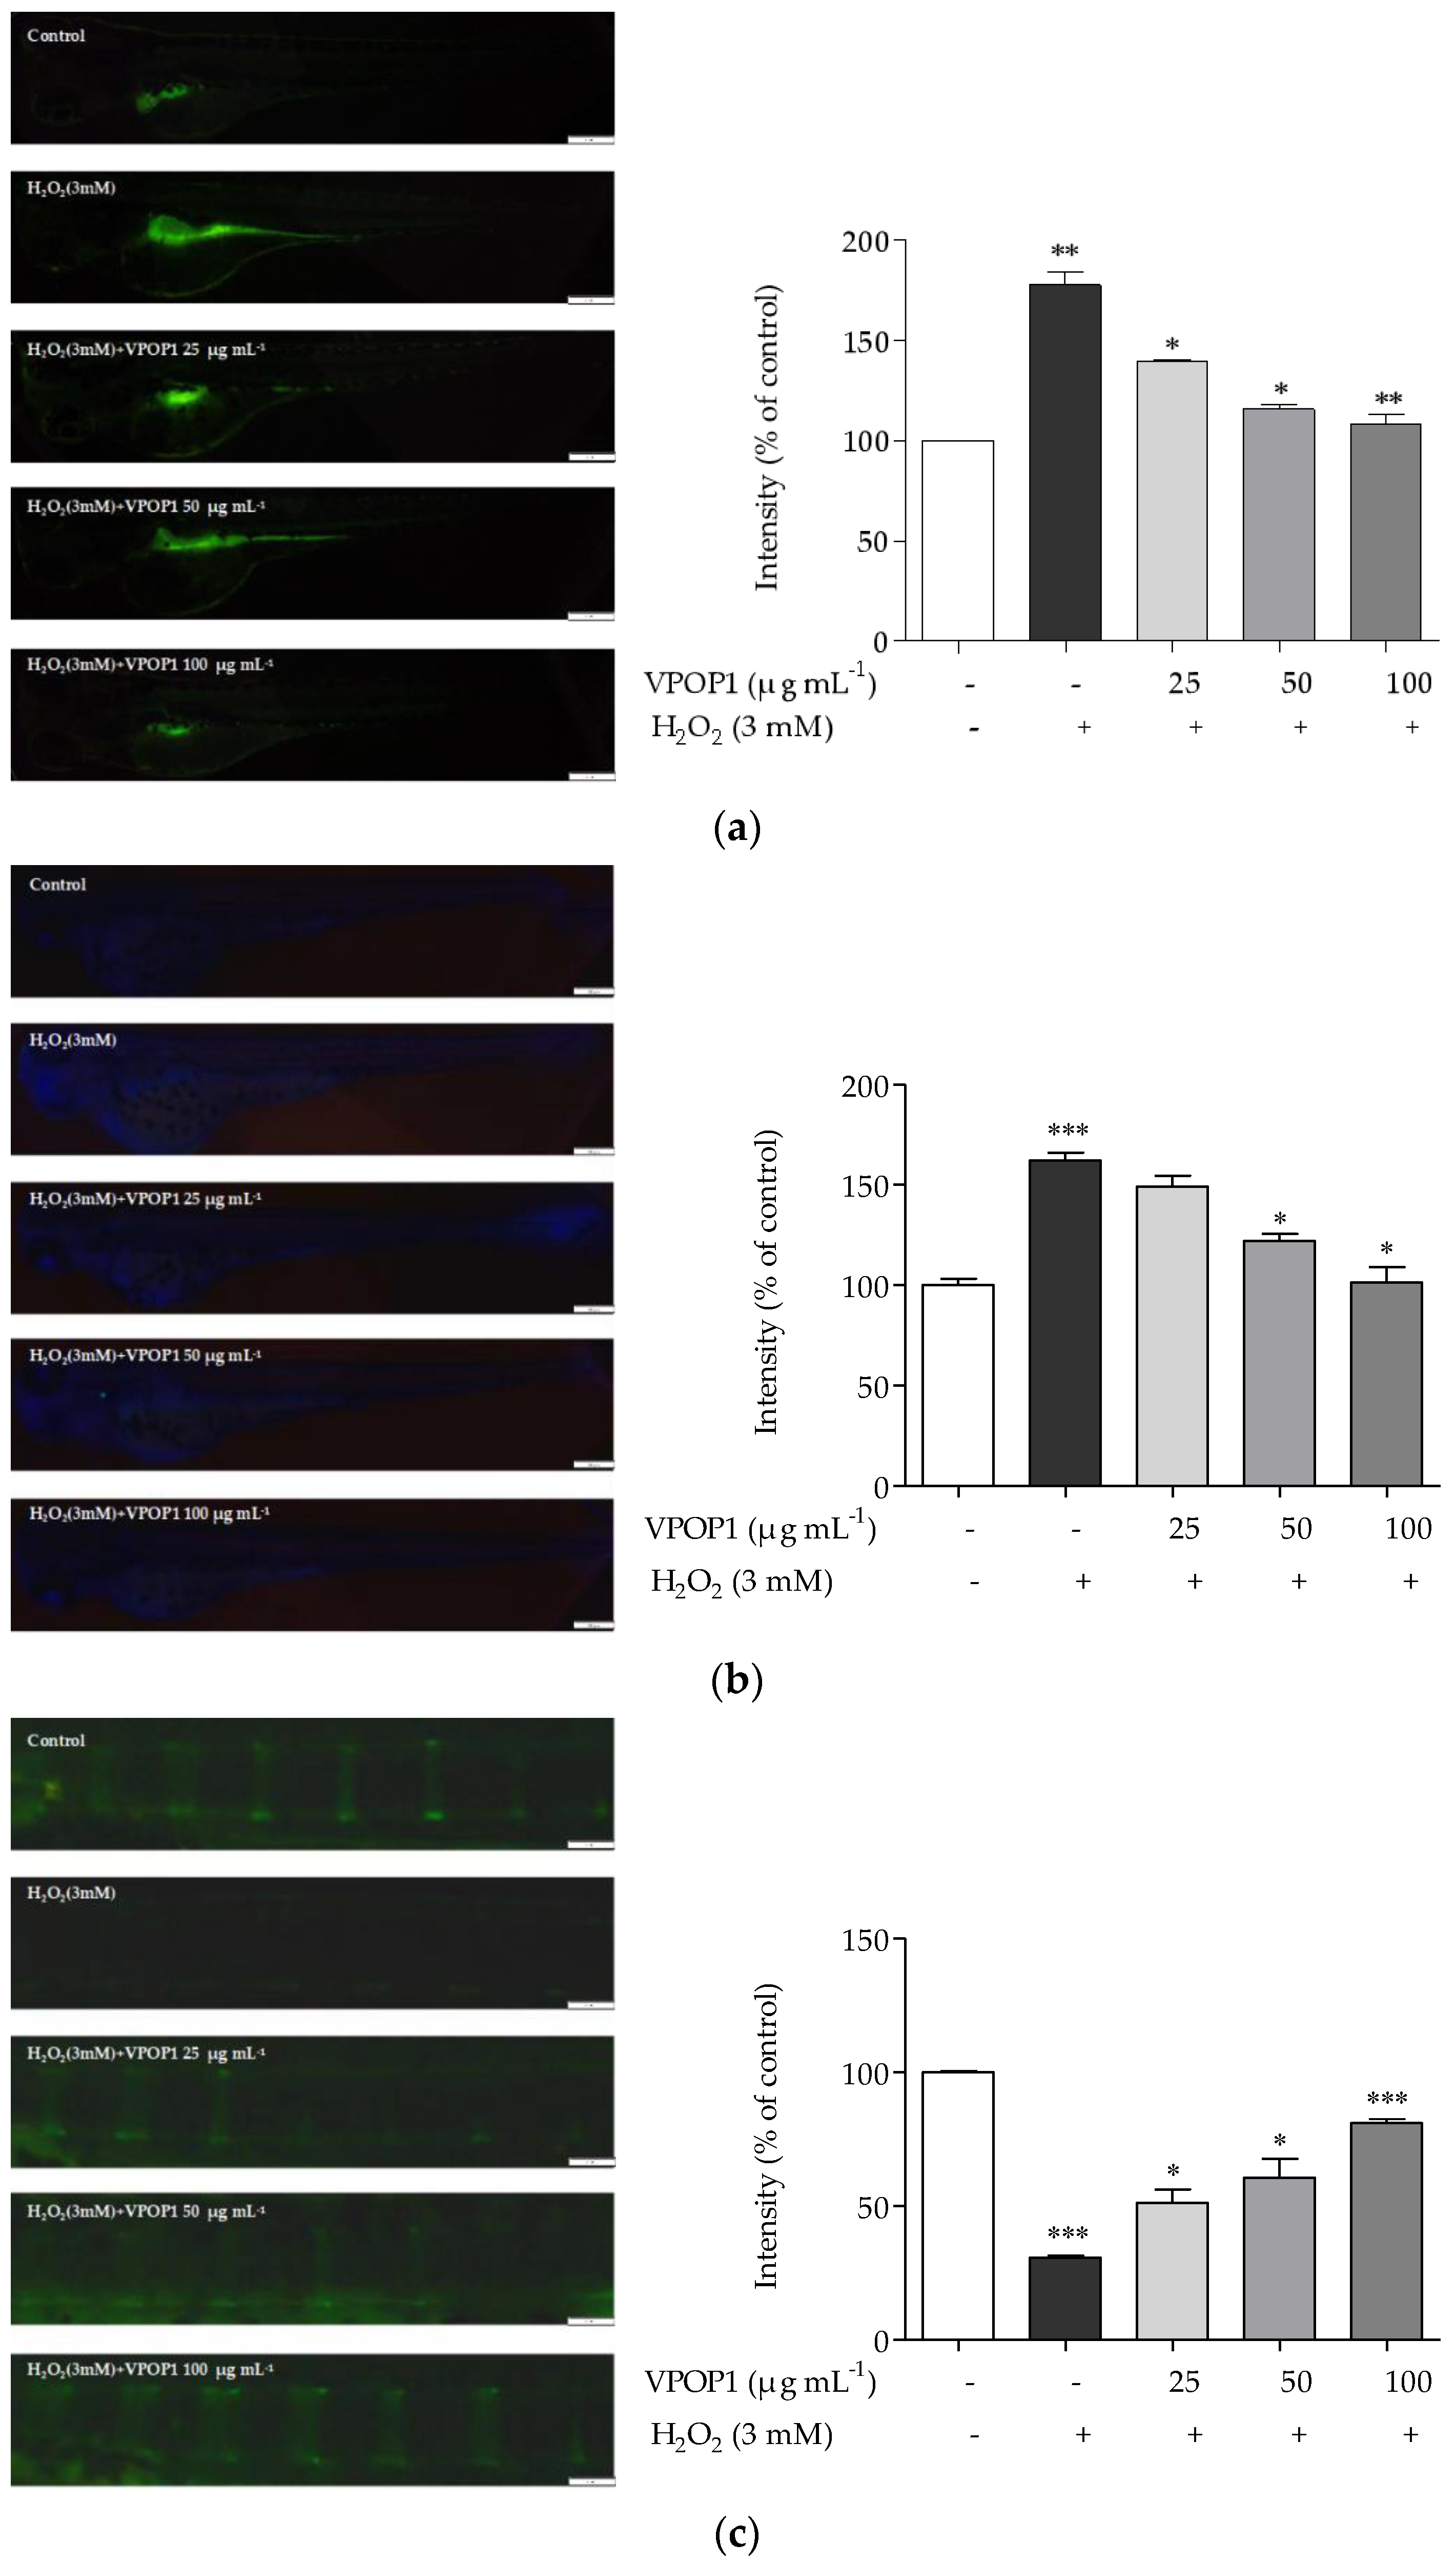
3.4. Protective Effect of VPOP1 against H2O2-Treated Zebrafish Embryonic (72 hpf) and Larvae (9 dpf)

As shown in Figure 4a,b, high ROS and lipid peroxidation levels were observed in the H2O2-exposed embryos compared with the control. However, the ROS production and lipid peroxidation levels in the larvae significantly decreased following treatment with VPOP1 prior to H2O2 treatment. Treatment of the zebrafish embryos with VPOP1 inhibited ROS production and lipid peroxidation in a concentration-dependent manner. These results indicate that VPOP1 markedly decreased oxidative stress in the H2O2-exposed zebrafish embryos.
Zebrafish embryos of 9 dpf were immersed in a calcein solution and observed under a fluorescence microscope (Nikon, Tokyo, Japan) to test whether VPOP1 and H2O2 could affect the bone structure of zebrafish embryos. The vertebrae of the H2O2-exposed zebrafish embryos were clearly narrower and had lower fluorescence intensity than those of the controls (Figure 4c). Fluorescence intensity increased in the VPOP1-treated group compared with the H2O2-treated group. The results demonstrate that H2O2 exposure inhibited bone growth and development. Moreover, treatment with different concentrations of VPOP1 ameliorated the situation in a concentration-dependent manner.

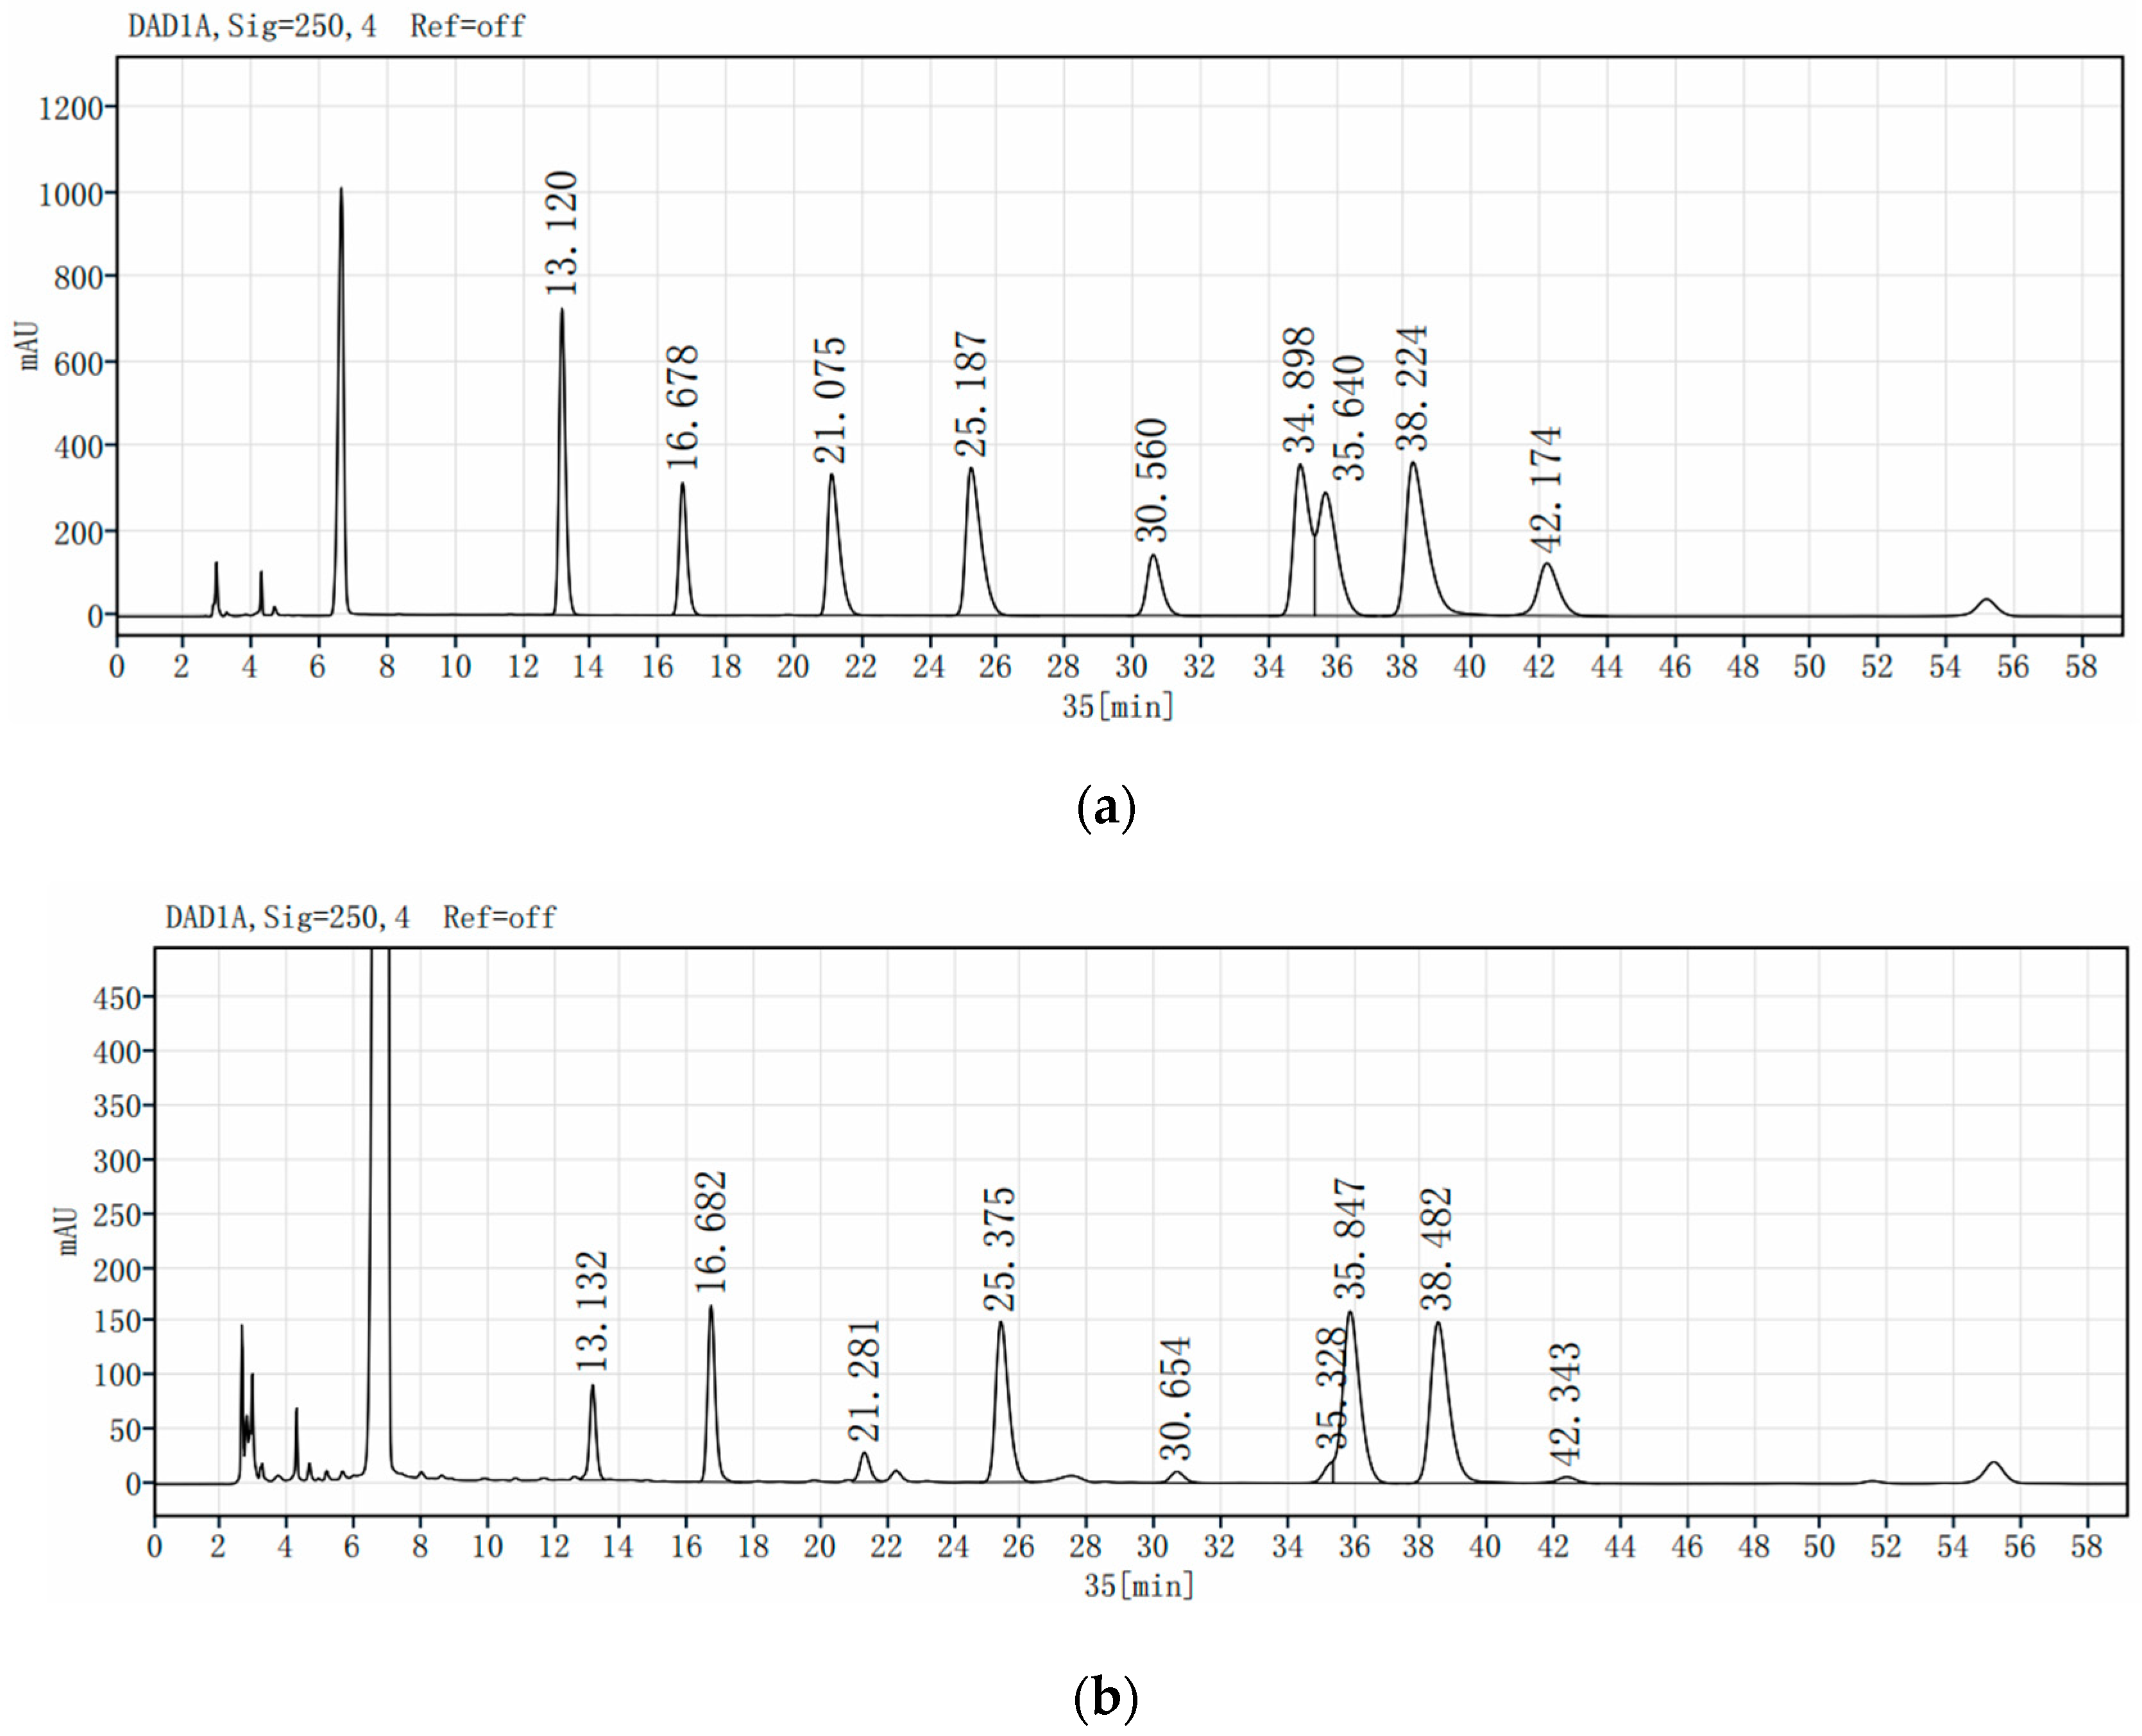
3.5. Chemical Composition of VPOP1

The macromolecular characteristics of VPOP1 were determined using HPLC-GPC with an Mw of approximately 7.6 kDa (40.0236%) and a low polydispersity index (Table 1). The Mw range of VPOP1 accounted for 21.4236% in the low-Mw polysaccharide standard (Mw ≈ 492) and for 27.6988% in the high-Mw polysaccharide standard (Mw ≈ 62526).
The monosaccharide standards and the PMP-derivatized VPOP1 were analyzed using HPLC. The derivatives of mannose, rhamnose, glucuronic acid, galacturonic acid, glucose, xylose, galactose, arabinose, and fucose showed absorption peaks at 13.120, 16.678, 21.075, 25.187, 30.560, 34.898, 35.640, 38.224, and 42.174 min, respectively (Figure 5a). The chromatographic peaks of standards indicated that VPOP1 comprised mannose, rhamnose, galacturonic acid, galactose, and arabinose (Figure 5b), with the substance ratio of 1:0.219:0.403:0.185:0.233, respectively (Table 2).

4. Discussion

The root cause of OP is the disruption of OB and OC homeostasis. ROS overproduction triggers oxidative stress, which inhibits bone resorption. This process leads to the disruption of homeostasis and bone remodeling. A multitude of studies reported that oxidative stress is associated with the occurrence of OP [30], which may trigger the apoptosis, necrosis, or autophagy of OB cells [31]. H2O2 diffuses across biological membranes and induces the apoptosis of various types of cells [32], which eventually initiates or aggravates the pathogenesis of OP. In the present study, treatment of OB with H2O2 reduced cell viability with subsequent increases in intracellular ROS generation and apoptosis compared with the controls. Increasing studies have shown that antioxidant phytochemicals confer protection against H2O2-induced OB apoptosis [33]. Moreover, in agreement with previous reports, the cytoprotective capabilities of POPs are primarily due to their anti-oxidative properties [13]. Therefore, the protective effects of POPs inhibiting OB apoptosis by ameliorating oxidative stress were explored in the current study.
The available literature suggests that the master eukaryotic redox-active factor Nrf2 plays an essential role in the cellular defense against inflammatory and oxidative stress-induced OP [34]. The amino-terminal Neh2 domain in the six functional Neh domains of Nrf2 controls the binding of Keap1. Oxidative stress generated during H2O2 conditions may switch on electrophiles and oxidants. Electrophiles can modify the reactive cysteines of Keap1 and lead to Keap1 inactivation and Nrf2 stabilization [35]. However, Nrf2 is released after dissociation from Keap1, and then enters the nucleus and binds to a consensus sequence [36]. In normal organisms, Nrf2 binds to Keap1 and exists in the cytoplasm. Under H2O2 induction, the body produces oxidative stress. The phosphorylation of Nrf2 or modification of the –SH group in Keap1 not only releases Nrf2 from Keap1, but also promotes Nrf2 to enter the nucleus to bind Maf protein. After binding proteins, AREs are activated and promote the transcription of HO-1 and NQO-1 [37]. In addition, in primary cells with high HO-1 expression, the expression of microRNAs and regulated mRNAs changes, which can be associated with apoptosis-induced cell death [38]. This study used MC3T3 cells to evaluate the antioxidant effect of POP on H2O2-induced cell death. VPOP1 treatment not only increased cell viability but also reduced ROS production in H2O2-induced MC3T3 cells. Staining and flow cytometry results show that VPOP1 regulated the apoptosis of MC3T3 cells in a dose-dependent manner. These phenomena clearly exhibited their protective effects against oxidative damage. Furthermore, VPOP1 treatment notably enhanced Nrf2 transcriptional activity and thus further promoted Keap1 protein expression, which contributed to the suppression of apoptosis in MC3T3 cells. Interestingly, HO-1 and NQO1 protein expression was significantly upregulated in the H2O2-induced group compared with the control group. The H2O2-induced group showed low expression of Nrf2 and Keap1 and high expression of HO-1 and NQO-1, which was consistent with the above result. We conjecture that the antioxidant properties of VPOP1 inhibit the formation of electrophiles and promote the expression of Nrf2 and Keap1. In addition, VPOP1 can reduce the binding of Nrf2 to ARE and the protein expression of HO-1 and NQO1.
In pharmacological studies, zebrafish is routinely used for screening in predictive toxicology [39]. We also tested our hypothesis using zebrafish embryos as an in vivo model system. The mRNA levels of genes for NQO1 and HO-1 increased, whereas Keap1 decreased in the treated groups compared with their controls. The increase in Keap1 protein levels in the VPOP1-treated fish confirmed its key regulatory role in H2O2-induced oxidative stress. Furthermore, VPOP1 inhibits H2O2-induced ROS production and lipid peroxidation in zebrafish. Lipid peroxidation is usually triggered by excess ROS, and H2O2 can induce lipid peroxidation in cells [40]. Lipid peroxidation is a chain reaction in which lipids react with free radicals, and lipid hydroperoxides and peroxy fatty acid free radicals generated during this process attack different biomolecules. The attacked biomacromolecules induce corresponding physicochemical changes, and eventually cause damage [41]. VPOP1 showed a strong protective effect on ROS production and lipid peroxidation in H2O2-treated zebrafish embryos. The larval-stage zebrafish were stained with calcein to confirm whether VPOP1 can alleviate OP caused by oxidative damage. After entering the zebrafish, calcein can bind to the calcified bone matrix in the bones, producing strong green fluorescence. Therefore, calcein can be used to mark zebrafish’s osteogenic bone structure, and it is the best stain for living zebrafish bone [42]. The present results show that treatment with different concentrations of VPOP1 ameliorated the H2O2-exposed inhibited bone growth and development in a concentration-dependent manner. These results suggest that VPOP1 exerts a protective effect against oxidative-stress-induced OP.
In the process of cellulase-assisted polysaccharide extraction, the internal sites of polysaccharide chains are attacked to generate small oligosaccharides with varied lengths. Hence, the entrapped molecules are easily released, thereby increasing the yield [22]. Furthermore, the high antioxidant activity of polysaccharides by viscozyme-assisted extraction can be attributed to the polysaccharide chains containing more galactose sugars and mannose [21]. In our study, the polysaccharides obtained from POL using different enzymes were characterized. Among four enzyme-assisted extractions, cellulase-assisted extraction had the highest yield. The viscozyme-assisted POP extracts exhibited high antioxidant activity. In addition, the conventional method for obtaining polysaccharides from plant species is water extraction and alcohol precipitation, and step-type alcohol precipitation is rarely used in the purification of polysaccharides [43]. Hence, in this study, the polysaccharides of different fractions were extracted by step gradient ethanol precipitation. VPOP1 and VPOP2 with different MW distributions obtained by step gradient ethanol precipitation showed higher activities than the other extracts. VPOP1 was an acidic heteropolysaccharide comprising mannose. The composition of VPOP1 (Mw = 7.6 kDa) confirmed that small-molecule polysaccharide fractions of POL can be developed as natural antioxidants for the treatment of free-radical-related diseases [44].
Experiments using MC3T3 cells and zebrafish embryos demonstrated the antioxidant activity of POP. VPOP1 reduces H2O2-induced oxidative stress in MC3T3 and zebrafish at concentrations ranging from 25 to 100 μg mL−1, thereby reducing apoptosis through mitochondria-mediated apoptotic pathways. These effects are carried out by activating the Nrf2/keap1 antioxidant pathway. The results show that POPs exerted protective effects and inhibited OB apoptosis by ameliorating oxidative stress. However, future research should conduct in-depth investigations to elucidate the causal relationship between oxidative stress and OP.

5. Conclusions

Among four enzyme-assisted extractions, cellulase-assisted extraction had the highest yield. VPOP1 with strong anti-osteoporosis activity was screened as an acidic heteropolysaccharide comprising mannose. VPOP1 protected osteoblasts from oxidative damage in vivo and in vitro by regulating the Nrf2-Keap1 pathway. Hence, low-Mw VPOP1 from POL can be developed as a potential anti-osteoporotic functional food.

Author Contributions

Conceptualization, Y.D. and H.Y.; Data curation, Y.F.; Formal analysis, X.H. and D.Z.; Funding acquisition, Y.D. and H.Y.; Investigation, X.T.; Methodology, X.H.; Project administration, F.Z. and Y.D.; Resources, D.Y.; Software, X.L.; Supervision, X.H.; Validation, Y.F.; Visualization, D.Z.; Writing—original draft, Y.F.; Writing—review and editing, Y.F. and Y.D. All authors have read and agreed to the published version of the manuscript.

Funding

This research was funded by the Scientific and Technological Development Program of Jilin province of China, grant numbers 20210401065YY and 20210204046YY.

Institutional Review Board Statement

The animal study protocol was approved by the Institutional Review Board (or Ethics Committee) of Animal Experimental Ethical Inspection Form of Changchun University of Chinese Medicine (protocol code 2020098 and date of approval: 3 April 2020).

Informed Consent Statement

Not applicable.

Data Availability Statement

All data, models, and code generated or used during the study appear in the submitted article.

Conflicts of Interest

The authors declare no conflict of interest.

References

  1. Rachner, T.D.; Khosla, S.; Hofbauer, L.C. Osteoporosis: Now and the future. Lancet 2011, 377, 1276–1287. [Google Scholar] [CrossRef] [Green Version]
  2. Brandi, M.L. Microarchitecture, the key to bone quality. Rheumatology 2009, 48 (Suppl. S4), iv3–iv8. [Google Scholar] [CrossRef] [PubMed] [Green Version]
  3. Weitzmann, M.N.; Pacifici, R. Estrogen deficiency and bone loss: An inflammatory tale. J. Clin. Investig. 2006, 116, 1186–1194. [Google Scholar] [CrossRef] [PubMed] [Green Version]
  4. Manolagas, S.C. From estrogen-centric to aging and oxidative stress: A revised perspective of the pathogenesis of osteoporosis. Endocr. Rev. 2010, 31, 266–300. [Google Scholar] [CrossRef] [PubMed] [Green Version]
  5. Li, Q.; Gao, Z.; Chen, Y.; Guan, M.X. The role of mitochondria in osteogenic, adipogenic and chondrogenic differentiation of mesenchymal stem cells. Protein Cell 2017, 8, 439–445. [Google Scholar] [CrossRef] [Green Version]
  6. Hsu, Y.C.; Wu, Y.T.; Yu, T.H.; Wei, Y.H. Mitochondria in mesenchymal stem cell biology and cell therapy: From cellular differentiation to mitochondrial transfer. Semin. Cell Dev. Biol. 2016, 52, 119–131. [Google Scholar] [CrossRef]
  7. Angelova, P.R.; Abramov, A.Y. Functional role of mitochondrial reactive oxygen species in physiology. Free Radic. Biol. Med. 2016, 100, 81–85. [Google Scholar] [CrossRef]
  8. El-Bahr, S.M. Biochemistry of free radicals and oxidative stress. Biochemistry 2013, 1, 11. [Google Scholar] [CrossRef] [Green Version]
  9. Monaghan, P.; Metcalfe, N.B.; Torres, R. Oxidative stress as a mediator of life history trade-offs: Mechanisms, measurements and interpretation. Ecol. Lett. 2009, 12, 75–92. [Google Scholar] [CrossRef]
  10. Kondo, H.; Yumoto, K.; Alwood, J.S.; Mojarrab, R.; Wang, A.; Almeida, E.A.; Searby, N.D.; Limoli, C.L.; Globus, R.K. Oxidative stress and gamma radiation-induced cancellous bone loss with musculoskeletal disuse. J. Appl. Physiol. 2010, 108, 152–161. [Google Scholar] [CrossRef] [Green Version]
  11. Khajuria, D.K.; Razdan, R.; Mahapatra, D.R. Drugs for the management of osteoporosis: A review. Rev. Bras. Reumatol. 2011, 51, 365–382. [Google Scholar] [PubMed]
  12. Zhang, N.D.; Han, T.; Huang, B.K.; Rahman, K.; Jiang, Y.P.; Xu, H.T.; Qin, L.P.; Xin, H.L.; Zhang, Q.Y.; Li, Y.M. Traditional Chinesemedicine formulas for the treatment of osteoporosis: Implication for antiosteoporotic drug discovery. J. Ethnopharmacol. 2016, 189, 61–80. [Google Scholar] [CrossRef] [PubMed]
  13. Zhou, Y.X.; Xin, H.L.; Rahman, K.; Wang, S.J.; Peng, C.; Zhang, H. Portulaca oleracea L.: A review of phytochemistry and pharmacological effects. BioMed Res. Int. 2015, 2015, 925631. [Google Scholar] [CrossRef] [PubMed] [Green Version]
  14. Lee, A.S.; Kim, J.S.; Lee, Y.J.; Kang, D.G.; Lee, H.S. Anti-TNF-alpha activity of Portulaca oleracea in vascular endothelial cells. Int. J. Mol. Sci. 2012, 13, 5628–5644. [Google Scholar] [CrossRef] [PubMed] [Green Version]
  15. Iranshahy, M.; Javadi, B.; Iranshahi, M.; Jahanbakhsh, S.P.; Mahyari, S.; Hassani, F.V.; Karimi, G. A review of traditional uses, phytochemistry and pharmacology of Portulaca oleracea L. J. Ethnopharmacol. 2017, 205, 158–172. [Google Scholar] [CrossRef] [PubMed]
  16. Miao, L.; Tao, H.; Peng, Y.; Wang, S.; Zhong, Z.; El-Seedi, H.; Dragan, S.; Zengin, G.; Cheang, W.S.; Wang, Y.; et al. The anti-inflammatory potential of Portulaca oleracea L. (purslane) extract by partial suppression on NF-κB and MAPK activation. Food Chem. 2019, 290, 239–245. [Google Scholar] [CrossRef]
  17. Acosta-Estrada, B.A.; Gutiérrez-Uribe, J.A.; Serna-Saldívar, S.O. Bound phenolics in foods, a review. Food Chem. 2014, 152, 46–55. [Google Scholar] [CrossRef]
  18. Zhang, S.B.; Wang, Z.; Xu, S.Y. Optimization of the aqueous enzymatic extraction of rapeseed oil and protein hydrolysates. J. Am. Oil. Chem. Soc. 2007, 84, 97–105. [Google Scholar] [CrossRef]
  19. Mushtaq, M.; Sultana, B.; Akram, S.; Anwar, F.; Adnan, A.; Rizvi, S.S.H. Enzyme-assisted supercritical fluid extraction: An alternative and green technology for non-extractable polyphenols. Anal. Bioanal. Chem. 2017, 409, 3645–3655. [Google Scholar] [CrossRef]
  20. Nadar, S.S.; Rao, P.; Rathod, V.K. Enzyme assisted extraction of biomolecules as an approach to novel extraction technology: A review. Food Res. Int. 2018, 108, 309–330. [Google Scholar] [CrossRef]
  21. Fleita, D.; El-Sayed, M.; Rifaat, D.J.L. Evaluation of the antioxidant activity of enzymatically-hydrolyzed sulfated polysaccharides extracted from red algae; Pterocladia capillacea. LWT-Food Sci. Technol. 2015, 63, 1236–1244. [Google Scholar] [CrossRef]
  22. Fernandes, P.; Carvalho, F. Chapter 19—Microbial Enzymes for the Food Industry. In Biotechnology of Microbial Enzymes; Brahmachari, G., Ed.; Academic Press: New York, NY, USA, 2017; pp. 513–544. [Google Scholar]
  23. Wang, L.; Liu, F.; Li, T.; Liu, D.; Xu, Y.; Yang, Y. Enzyme Assisted Extraction, Purification and Structure Analysis of the Polysaccharides from Naked Pumpkin Seeds. Appl. Sci. 2018, 8, 1866. [Google Scholar] [CrossRef] [Green Version]
  24. Talley, K.; Alexov, E.J. On the pH-optimum of activity and stability of proteins. Proteins 2010, 78, 2699–2706. [Google Scholar] [CrossRef] [PubMed] [Green Version]
  25. Zha, X.-Q.; Xiao, J.-J.; Zhang, H.-N.; Wang, J.-H.; Pan, L.-H.; Yang, X.-F.; Luo, J.-P.J. Polysaccharides in Laminaria japonica (LP): Extraction, physicochemical properties and their hypolipidemic activities in diet-induced mouse model of atherosclerosis. Food Chem. 2012, 134, 244–252. [Google Scholar] [CrossRef]
  26. Fernando, I.P.S.; Dias, M.; Madusanka, D.M.D.; Han, E.J.; Kim, M.J.; Jeon, Y.J.; Ahn, G. Step gradient alcohol precipitation for the purification of low molecular weight fucoidan from Sargassum siliquastrum and its UVB protective effects. Int. J. Biol. Macromol. 2020, 163, 26–35. [Google Scholar] [CrossRef]
  27. Mosmann, T.J. Rapid colorimetric assay for cellular growth and survival: Application to proliferation and cytotoxicity assays. J. Immunol. Methods. 1983, 65, 55–63. [Google Scholar] [CrossRef]
  28. Wang, H.; Joseph, J.A.J. Quantifying cellular oxidative stress by dichlorofluorescein assay using microplate reader. Free Radic. Biol. Med. 1999, 27, 612–616. [Google Scholar] [CrossRef]
  29. Dai, J.; Wu, Y.; Chen, S.W.; Zhu, S.; Yin, H.P.; Wang, M.; Tang, J. Sugar compositional determination of polysaccharides from Dunaliella salina by modified RP-HPLC method of precolumn derivatization with 1-phenyl-3-methyl-5-pyrazolone. Carbohydr. Polym. 2010, 82, 629–635. [Google Scholar] [CrossRef]
  30. Yang, Y.H.; Li, B.; Zheng, X.F.; Chen, J.W.; Chen, K.; Jiang, S.D.; Jiang, L.S. Oxidative damage to osteoblasts can be alleviated by early autophagy through the endoplasmic reticulum stress pathway—Implications for the treatment of osteoporosis. Free Radic. Biol. Med. 2014, 77, 10–20. [Google Scholar] [CrossRef]
  31. Li, H.; Li, D.; Ma, Z.; Qian, Z.; Kang, X.; Jin, X.; Li, F.; Wang, X.; Chen, Q.; Sun, H.; et al. Defective autophagy in osteoblasts induces endoplasmic reticulum stress and causes remarkable bone loss. Autophagy 2018, 14, 1726–1741. [Google Scholar] [CrossRef] [Green Version]
  32. Gardner, A.M.; Xu, F.H.; Fady, C.; Jacoby, F.J.; Duffey, D.C.; Tu, Y.; Lichtenstein, A. Apoptotic vs. nonapoptotic cytotoxicity induced by hydrogen peroxide. Free Radic. Biol. Med. 1997, 22, 73–83. [Google Scholar] [CrossRef]
  33. Yang, Y.; Su, Y.; Wang, D.; Chen, Y.; Wu, T.; Li, G.; Sun, X.; Cui, L.J. Tanshinol attenuates the deleterious effects of oxidative stress on osteoblastic differentiation via Wnt/FoxO3a signaling. Oxid. Med. Cell Longev. 2013, 2013, 351895. [Google Scholar] [CrossRef] [PubMed] [Green Version]
  34. Sykiotis, G.P.; Bohmann, D. Stress-activated cap’n’collar transcription factors in aging and human disease. Sci. Signal. 2010, 3, re3. [Google Scholar] [CrossRef] [PubMed] [Green Version]
  35. Ibáñez, L.; Ferrándiz, M.L.; Brines, R.; Guede, D.; Cuadrado, A.; Alcaraz, M.J. Effects of Nrf2 deficiency on bone microarchitecture in an experimental model of osteoporosis. Oxid. Med. Cell Longev. 2014, 2014, 726590. [Google Scholar] [CrossRef] [PubMed]
  36. Hwang, Y.P.; Jeong, H.G. Ginsenoside Rb1 protects against 6-hydroxydopamine-induced oxidative stress by increasing heme oxygenase-1 expression through an estrogen receptor-related PI3K/Akt/Nrf2-dependent pathway in human dopaminergic cells. Toxicol. Appl. Pharmacol. 2010, 242, 18–28. [Google Scholar] [CrossRef]
  37. Kansanen, E.; Kuosmanen, S.M.; Leinonen, H.; Levonen, A.L. The Keap1-Nrf2 pathway: Mechanisms of activation and dysregulation in cancer. Redox. Biol. 2013, 1, 45–49. [Google Scholar] [CrossRef] [Green Version]
  38. Lin, S.H.; Song, W.; Cressatti, M.; Zukor, H.; Wang, E.; Schipper, H.M. Heme oxygenase-1 modulates microRNA expression in cultured astroglia: Implications for chronic brain disorders. Glia 2015, 63, 1270–1284. [Google Scholar] [CrossRef]
  39. Howe, K.; Clark, M.D.; Torroja, C.F.; Torrance, J.; Berthelot, C.; Muffato, M.; Collins, J.E.; Humphray, S.; McLaren, K.; Matthews, L.; et al. The zebrafish reference genome sequence and its relationship to the human genome. Nature 2013, 496, 498–503. [Google Scholar] [CrossRef] [Green Version]
  40. Dai, Y.-L.; Kim, G.H.; Kang, M.-C.; Jeon, Y.-J. Protective effects of extracts from six local strains of Pyropia yezoensis against oxidative damage in vitro and in zebrafish model. ALGAE 2020, 35, 189–200. [Google Scholar] [CrossRef]
  41. Miki, M.; Tamai, H.; Mino, M.; Yamamoto, Y.; Niki, E. Free-radical chain oxidation of rat red blood cells by molecular oxygen and its inhibition by alpha-tocopherol. Arch. Biochem. Biophys. 1987, 258, 373–380. [Google Scholar] [CrossRef]
  42. Du, S.J.; Frenkel, V.; Kindschi, G.; Zohar, Y. Visualizing normal and defective bone development in zebrafish embryos using the fluorescent chromophore calcein. Dev. Biol. 2001, 238, 239–246. [Google Scholar] [CrossRef] [PubMed] [Green Version]
  43. Hu, X.; Goff, H.D. Fractionation of polysaccharides by gradient non-solvent precipitation: A review. Trends Food Sci. Technol. 2018, 81, 108–115. [Google Scholar] [CrossRef]
  44. Li, Y.-P.; Yao, L.-H.; Wu, G.-J.; Pi, X.-F.; Gong, Y.-C.; Ye, R.-S.; Wang, C.-X.J. Antioxidant activities of novel small-molecule polysaccharide fractions purified from Portulaca oleracea L. Food Sci. Biotechnol. 2014, 23, 2045–2052. [Google Scholar] [CrossRef]
Figure 1. Protective effect against H2O2−induced damage in MC3T3 cells of POPs. Compared with the control group, the viability of cells damaged by different concentrations of H2O2 (a) and the effect of different concentrations of H2O2 on the ROS level of cells (b). Cytotoxicity experiment of POPs on MC3T3 cells (c). Compared with the model group, the effect of purslane polysaccharide on the survival rate of damaged cells (d) and the effect on the level of ROS in damaged cells (e). Graphical representations are means ± SE based on three replications. * p < 0.05, ** p < 0.01 and *** p < 0.001 indicate that the values were significantly different from those for the control or H2O2−treated group.
Separations 09 00128 g001
Figure 2. Protective effect of VPOP1 on apoptotic body formation induced by H2O2 in MC3T3 cells. Apoptotic body formation was observed using a fluorescence microscope after Hoechst 33342 staining (a) and acridine orange/ethidium bromide (AO/EtBr) staining (b) after 48 h incubation. Arrows point to apoptotic bodies, which decreased with increasing concentration of VPOP1. Flow cytometry analysis of VPOP1 on the nuclear morphology in MC3T3 cells. Cells were stained with propidium iodide and Annexin V−FITC (c). Experiments were performed in triplicate and the data are expressed as the mean ± SE. * p < 0.05 and ** p < 0.01 were considered as significant compared to the control.
Separations 09 00128 g002aSeparations 09 00128 g002b
Figure 3. Protective effects of VPOP1 against oxidative stress via the Nrf2−Keap1 pathway. Western blot analyses of MC3T3 cells for measuring the expression of Nrf2, Keap1, HO−1and NQO1 (a). Western blot analysis of Keap1, HO−1 and NQO1 in the tissues of H2O2−induced zebrafish treated with the different concentrations of VPOP1 for 72 h and untreated controls (b). The “+” indicates that MC3T3 cells or zebrafish embryos were H2O2−induced, while the “-” indicates that the samples were not treated with VPOP1 or H2O2. Experiments were performed in triplicate and the data are expressed as the mean ± SE. * p < 0.05, ** p < 0.01 and *** p < 0.001 indicate that the values were significantly different from those for the control or H2O2−treated group.
Separations 09 00128 g003
Figure 4. Protective effects of VPOP1 against the H2O2−induced zebrafish model. The microscopic fluorescence images of the embryos 72 hpf and relative fluorescence intensities indicate the ROS levels (a) and lipid peroxidation level (b) in the embryos stained with DCFH−DA and DPPP. Visualization of calcified axial skeletal structures in developing zebrafish embryos. The microscopic fluorescence images of the embryos at 9dpf and relative fluorescence intensities indicate the calcification initiation site of the vertebrae stained with calcein (c). Experiments were carried out in triplicate, and the results are represented as means ± SE. * p < 0.05, ** p < 0.01 and *** p < 0.001 indicate that the values were significantly different from those for the control or H2O2−treated group.
Separations 09 00128 g004
Figure 5. Chemical composition of VPOP1. HPLC separation of PMP−labeled monosaccharide standards (a) and VPOP1 (b).
Separations 09 00128 g005
Table 1. Molecular weight distribution of VPOP1.
MwMnComposition (%)PDI (Mw/Mn)
62,52640,34227.69881.5499
7655736340.02361.0397
3644342010.25371.0655
153315250.60031.0052
49237321.42361.3190
Mw: weight−average molecular weights; Mn: number−average molecular weights; Composition: the proportion of molecular weight (%).
Table 2. The ratio of the amount of monosaccharide in VPOP1.
MonosaccharideAA′m/(umol∙L−1)R1/2
Mannose9489.6491195.76542.6701
Rhamnose4989.3722618.68446.8300.219
Galacturonic acid10811.6974052.16235.5900.403
Galactose11670.8125856.28157.7800.185
Arabinose15805.2265884.44261.8700.233
A: Monosaccharide peak area in mixed standard solution. A′: Monosaccharide peak area in the VPOP1. Results are given as the R1/2 based on a formula: R1/2 = (A2/m2)/(A1/m1) × (A′1/A′2). For a specific element, 1 and 2 were considered the values of mannose and other polysaccharides, respectively.
Publisher’s Note: MDPI stays neutral with regard to jurisdictional claims in published maps and institutional affiliations.

