Article

Influence and Mechanism of Polar Solvents on the Retention Time of Short-Chain Fatty Acids in Gas Chromatography

1
Department of Chemistry, School of Mathematic and Natural Science, Mongolian National University of Education, Ulaanbaatar 210648, Mongolia
2
Agilent Technologies China Co., Ltd., Beijing 100102, China
*
Author to whom correspondence should be addressed.
Separations 2022, 9(5), 124; https://doi.org/10.3390/separations9050124
Submission received: 8 April 2022 / Revised: 11 May 2022 / Accepted: 12 May 2022 / Published: 16 May 2022
(This article belongs to the Special Issue Chromatography-Mass Spectrometry Technology Research)

Abstract

:

Featured Application

Short-chain fatty acids (SCFAs), produced by microbes when dietary fiber ferments in the colon, are one of the most studied microbial products despite their volatility and complex matrices, which make analysis challenging. In the current study, we sought to address research gaps by exploring the commonalities and differences between the retention time changes for SCFAs in polar solvents. In one such solvent, dimethyl sulfoxide (DMSO), the retention time of the SCFA acetic acid shows a linear positive correlation with the equal volume increase in the DMSO solvent. Then, some experiments and quantum chemical calculations enabled us to identify the mechanism for changes in the retention time for SCFAs in polar solvents because we found that, when the solute compound contains active hydrogens that form hydrogen bonds, this results in an important force that affects retention behavior.

Abstract

Short-chain fatty acids (SCFAs), produced by microbes when dietary fiber ferments in the colon, are one of the most studied microbial products despite their volatility and complex matrices, which make analysis challenging. In the current study, we sought to address research gaps by exploring the commonalities and differences between the retention time changes for SCFAs in polar solvents. In one such solvent, dimethyl sulfoxide (DMSO), the retention time of the SCFA acetic acid shows a linear positive correlation with the equal volume increase in the DMSO solvent. We used gas chromatography–mass spectrometry to analyze the retention times of mixed solutions of formic acid, acetic acid, butyric acid, valeric acid, and toluene in the solvents DMSO and water and found that only the retention times of formic acid and acetic acid changed. We further compared the effect of three solvents with similar polarities, DMSO, N-methylpyrrolidone (NMP), and dimethylformamide (DMF), on the retention time of acetic acid and found that it increased in the DMSO–water solution more than in the NMP–water solution and remained unchanged in the DMF–water solution. This finding is consistent with quantum chemical calculations showing that the strength of the hydrogen bond between DMSO and acetic acid is greater than between NMP and acetic acid. Taken together, the chromatographic results and quantum chemical calculations indicate that, in all three solvents, the portion of the molecule with the smallest negative electrostatic potential (red) has high electron density and can easily donate electrons, forming a hydrogen bond with acetic acid. However, the portion with the largest positive electrostatic potential (blue) forms a bond with polyethylene glycol, a column stationary solution with a strong dipole moment, and is adsorbed on the stationary solution in the direction of the dipole moment. Therefore, the retention times of formic acid and acetic acid change under the combined influence of a series of complex intermolecular forces. In the chromatographic column, the outflow rate of DMF is higher than that of acetic acid, and the force of the hydrogen bond between DMF and acetic acid cannot overcome the outflow resistance of acetic acid, so the retention time of the acetic acid in the DMF–water solution does not change. The retention times of butyric acid and valeric acid are unchanged in aprotic polar solvents for the same reason.

1. Introduction

Short-chain fatty acids (SCFAs) are saturated fatty acids consisting of five or fewer carbon atoms in which the carboxyl group (C(=O)OH) is attached to a chain of additional carbons through carbon–carbon bonds [1]. SCFAs are well-studied microbial products that have a strong influence on gut metabolism, the immune system, and neurological function [2], and they can effectively inhibit cancer, diabetes, and cardiovascular diseases [1]. Changes in the gut concentration of SCFAs can trigger neurological diseases, such as Parkinson’s disease, Alzheimer’s disease, and anorexia [3,4,5].
For measuring SCFA content, several methods can be used, but each has its weaknesses. Chromatography is the most commonly used method [6,7,8,9,10,11], and polar aprotic solvents are one of several organic solvents employed [12]. During gas chromatography, the strong polarity of the carboxyl group generates different forces in the gas chromatography column, resulting in poor reproducibility, especially at low concentrations of SCFAs. Derivatization methods are typically used to measure SCFAs to avoid the problems inherent to gas chromatography and reduce the evaporative loss of these volatile acids [13]. However, with this method, it is impossible to explore the mechanism regulating SCFA retention time change in capillary chromatographic columns.
A polar solvent is an organic compound with a dipole, making it soluble in ionic liquids or polar compounds. Polar solvents can effectively control the elution strength of the mobile phase and achieve selective interactions with solutes by adjusting the capacity of both the mobile and stationary phases [14]. In chromatography, the retention time of each component is primarily determined by the strength of the interaction between the component and the stationary phase when the same chromatographic column is used to separate the mixed component under the same column temperature and carrier gas flow rate conditions [15]. Therefore, chromatography selectivity is determined by the physicochemical interactions between the solute molecules and the stationary phase. Selectivity is the ability of the stationary phase to differentiate between two solute molecules based on their chemical or physical properties. Separation is possible when the interaction forces between the stationary phase and the solute differ.
Three main interactions determine the liquid or colloidal stationary phase (polysiloxane and polyethylene glycol) in the capillary column: London dispersion force, dipole–dipole force, and hydrogen bonding force. Of these, the London dispersion and dipole–dipole forces have been demonstrated to affect retention time, although the effect of hydrogen bonds has not yet been determined. Hydrogen bonds are one of the most important intermolecular interactions [16], and their bond energy is between that of van der Waals attraction and chemical bond attraction [17]. When the solute compound contains active hydrogens that form hydrogen bonds, this results in an important force that affects retention behavior. Although hydrogen bonding has been well-studied for decades, it is difficult to identify general principles regarding hydrogen bonding, and the specifics of how hydrogen bonding affects retention time and how polar solvents affect the interaction between the substance and the stationary phase are poorly understood. This is due to both the breadth of the subject and the complexity of the research.
In the current study, gas chromatography–mass spectrometry (GC–MS) was used to determine the mechanism regulating the retention time of SCFAs with different carbon numbers in polar aprotic solvents. GC was used to compare the retention time of the same acetic acid solution in three different aprotic solvents with similar polarities, while quantum chemical calculations were performed using the B3LYP/6-31+G(d,p) method for the three solvents with similar polarities and determining the hydrogen bonds formed. These experiments and quantum chemical calculations enabled us to identify the mechanism for changes in retention time for SCFAs in polar solvents.

2. Materials and Methods

Formic acid (HCOOH; >99.5%), butyric acid (C3H7COOH; >99.5%), and valeric acid (C4H9COOH; >99.5%) were purchased from Dikma Technologies Inc.; acetic acid (CH3COOH; >99.5%) was purchased from Tianjin Kemiou Chemical Reagent Co., Ltd. (TianJin, China); dimethyl sulfoxide (DMSO; >99.5%), N-methylpyrrolidone (NMP; >99.5%), and dimethylformamide (DMF; >99.5%) were purchased from ACS Co., Ltd. (Shanghai, China). All solutions were prepared with deionized water (DI H2O, Milli-Q system, Germany, Purchased in China).
The volume concentration ratio ranged from 0 to 100%. 10% DMSO–water solution was prepared according to the following DMSO: water volume ratios: 0:10, 1:9, 2:8, 3:7, 4:6, 5:5, 6:4, 7:3, 8:2, 9:1, and 10:0.
The 5% acetic acid DMSO–water solution was prepared by volume: 50 μL acetic acid was added to 950 μL of 10% DMSO–water solution.
Aqueous solutions were prepared with different acid concentrations: 100 μL formic acid, 50 μL acetic acid, 20 μL butyric acid, 20 μL valeric acid, and 10 μL toluene were diluted to 1000 μL with water.
DMSO solutions were prepared with different acid concentrations: 100 µL formic acid, 50 µL acetic acid, 20 µL butyric acid, 20 µL valeric acid, and 10 µL toluene were diluted to 1000 µL with DMSO.
NMP–water solution was prepared with a volume concentration ratio of 0 to 100% and a concentration gradient of 10%: the volume ratios of NMP to water were 0:10, 1:9, 2:8, 3:7, 4:6, 5:5, 6:4, 7:3, 8:2, 9:1, and 10:0.
The 5% acetic acid solute and solvent was prepared with NMP–water gradient: 50 μL acetic acid was added to 950 μL of 10% NMP–water gradient.
The DMF–water solution was prepared with a 0 to 100% volume concentration ratio and 10% concentration gradient: the volume ratios of DMF to water were 0:10, 1:9, 2:8, 3:7, 4:6, 5:5, 6:4, 7:3, 8:2, 9:1, and 10:0.
The 5% (by volume) acetic acid solute and solvent was prepared with gradient DMF–water: 50 μL acetic acid was added to 950 μL of 10% gradient of DMF–water.
A 8890 Gas Chromatograph (GC-FID, DB-624, DB-WAX, Agilent Technologies, Inc., Santa Clara, CA, USA) with different chromatographic columns was used to perform gas chromatographic separation for samples, including 5% acetic acid solute and solvent gradient DMSO–water solution, 5% acetic acid solute and solvent gradient NMP–water, and 5% acetic acid solute and solvent gradient DMF–water.
A 7890 gas chromatography-5977 (quadrupole mass spectrometer GC-FID-MSD, Agilent Technologies, Inc., Santa Clara, CA, USA, Purchased in China) was used to perform chromatographic separation for samples, including a solution of 10% formic acid solute and a gradient of DMSO–water as the solvent, mixed aqueous solutions of formic acid, acetic acid, butyric acid, valeric acid, and toluene, and a mixed DMSO solution of formic acid, acetic acid, butyric acid, valeric acid, and toluene; we also used a GCK3308 automatic gas source (Beijing BCHP Analytical Technology Institute, Beijing, China) and a TH-500 pure water type high-purity hydrogen generator (Beijing BCHP Analytical Technology Institute, Beijing, China); Gaussian16 and GaussView6 software were used for quantum chemical calculations.
Gas chromatography parameters: GC-FID: Sample injection: ALS; Injection volume: 0.2 μL; Inject temperature: 260 °C; Injection mode: Split, Split ratio: 100:1; Columns: DB-624, UI 30 m × 0.25 mm × 1.40 µm (P/N: 122-1334UI) and DB-WAX, UI 30 m × 0.25 mm × 0.25 µm (P/N: 122-7032UI); Carrier gas types: Nitrogen, Constant flow, 1.5 mL/min; Initial oven temperature: 40 °C; Initial Time: 1 min; Oven ramp rate 10 °C/min; Oven final first ramp: 70 °C; Final time first ramp: 0 min; Oven ramp rate: 20 °C/min; Oven final temperature: 220 °C; Final time: 3 min; Detector: FID; Heater temperature: 250 °C; H2 flow: 30 mL/min; Air flow: 300 mL/min; Makeup flow: ~25 mL/min. GC–MS: Sample injection: ALS; Injection volume: 0.2 μL; Inject temperature: 260 °C; Injection mode: Split, Split ratio: 100:1; Columns: DB-WAX, UI 30 m × 0.25 mm × 0.25 µm (P/N: 122-7032UI); Carrier gas types: Helium, Constant flow, 1.5 mL/min; Initial oven temperature: 40 °C; Initial Time: 1 min; Oven ramp rate 10 °C/min; Oven final first ramp: 70 °C; Final time first ramp: 0 min; Oven ramp rate: 20 °C/min; Oven final temperature: 220 °C; Final time: 3 min; GC outlet: Mass selective detector; Tune type: EI; energy: 70 eV; Ion source temperature: 230 °C; MS transfer temperature: 250 °C; Quadrupole temperature: 150 °C; Solvent delay: 0 min; Acquisition mode: Scan; Scan Range: 15–300.

3. Results and Discussion

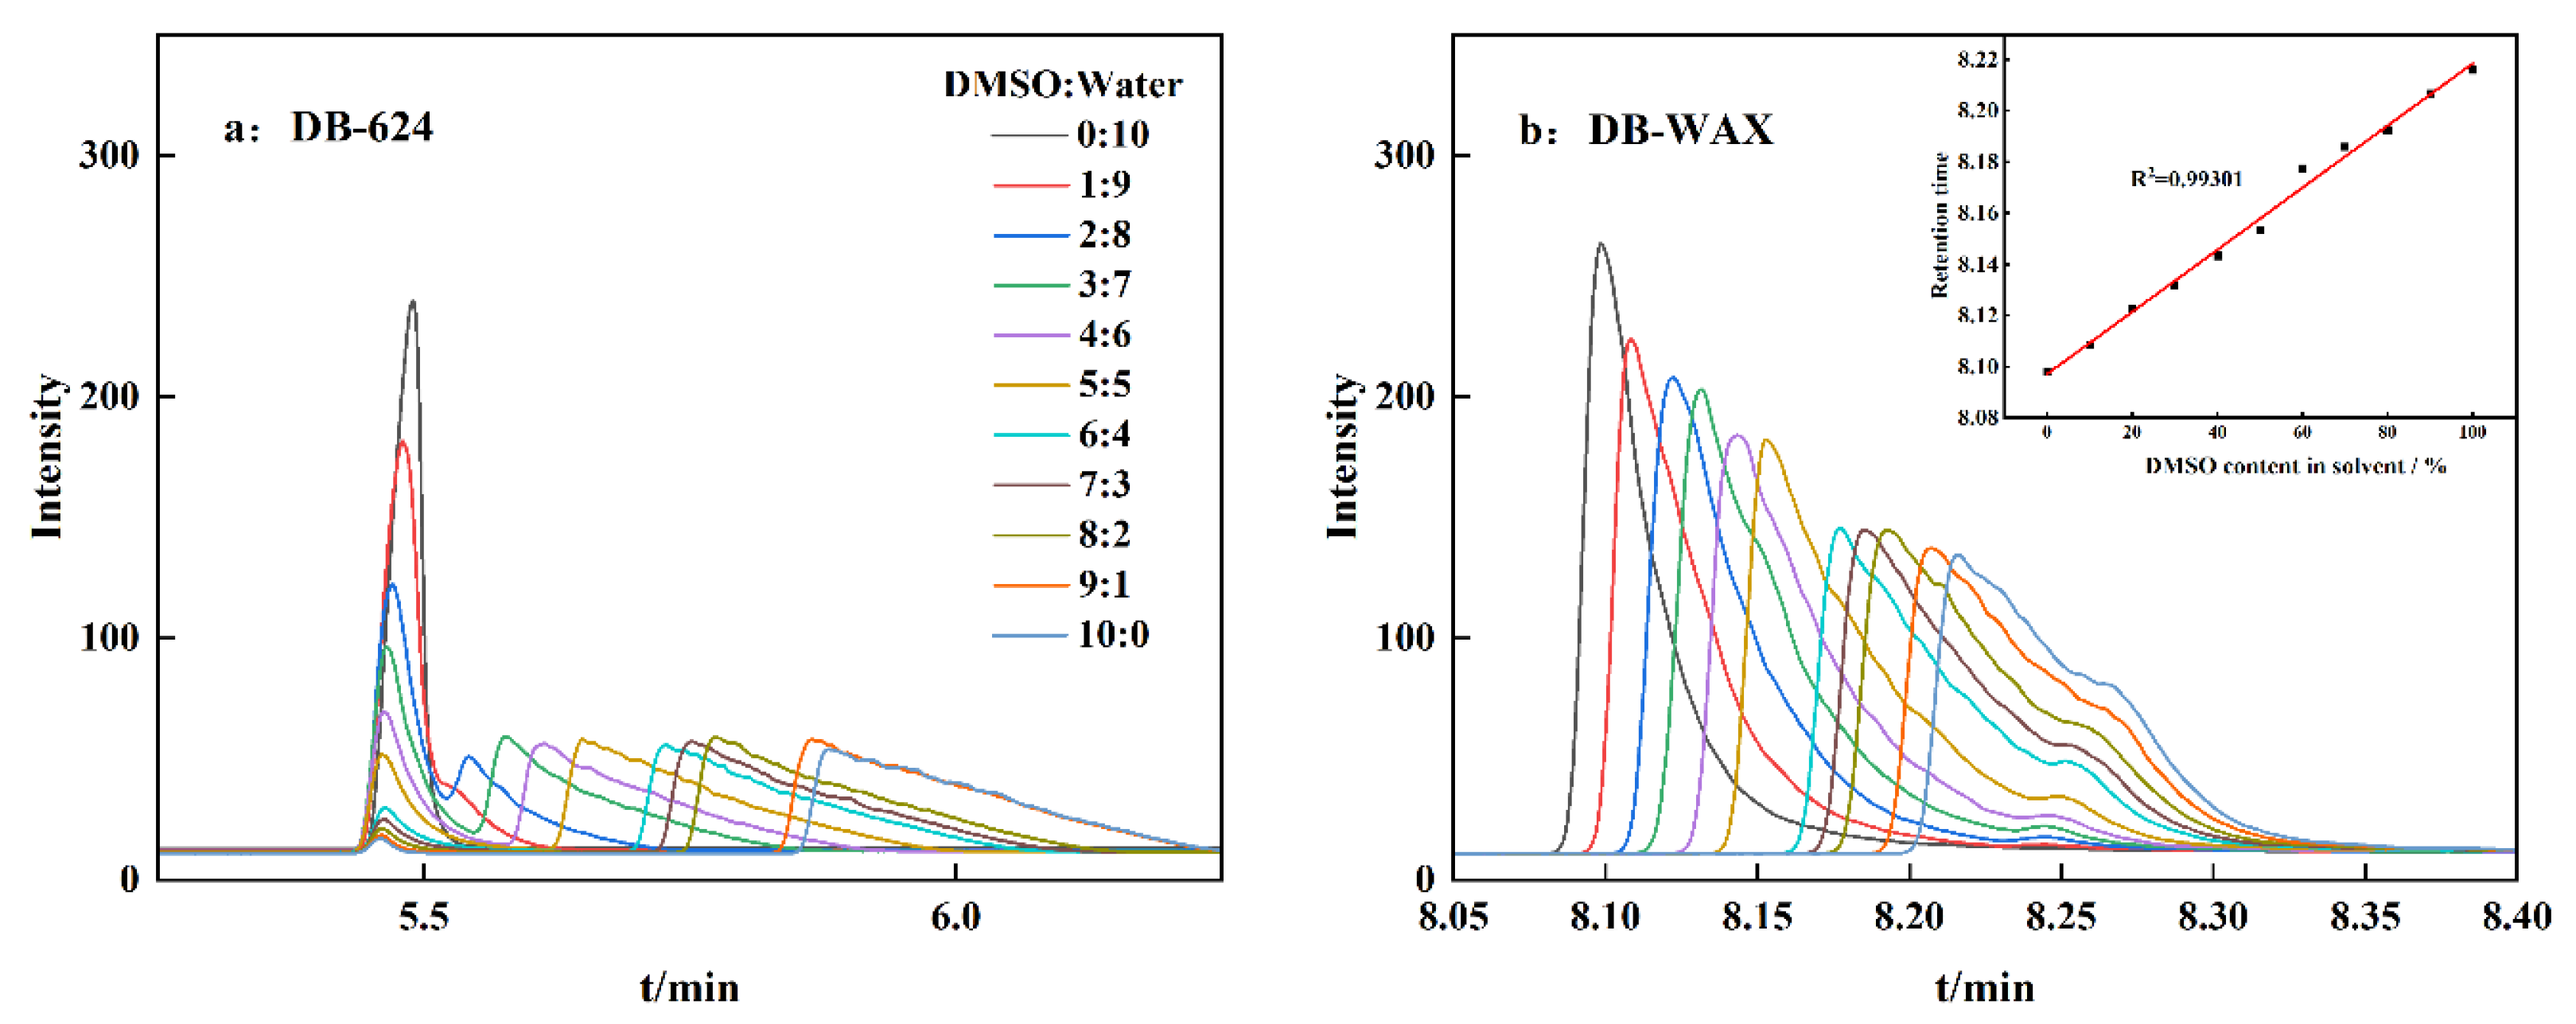
3.1. Acetic Acid Separation Results in Capillary Columns with Different Polarities

The commonly used capillary gas chromatography columns primarily include non-polar (DB-1), polar (DB-624), and strong polar columns (DB-WAX) (Table 1). The strong polar column has an adequate separation effect for SCFAs [18,19,20]. The change in retention time for acetic acid with increasing DMSO concentration in DMSO–water with a gradient of 5% acetic acid was determined using DB-624 and DB-WAX capillary columns under GC-FID conditions (Figure 1). The retention time of acetic acid in water was 8.099 min when DB-WAX was used. The acetic acid retention time in gradient DMSO–water solution was 8.108, 8.123, 8.132, 8.143, 8.153, 8.178, 8.186, 8.193, 8.207, 8.216 min when V(DMSO):V(H2O) = 1:9, 2:8, 3:7…10:0, respectively. Linear fitting demonstrated that the volume equivalent increase in DMSO had a linear positive correlation with the change in acetic acid retention time (R2 = 0.99301). The acetic acid peak was split, and more severe tailing was observed, with the same DMSO concentration when the DB-624 column was used. Therefore, the strong polar column DB-WAX was selected for use in the follow-up experiments.

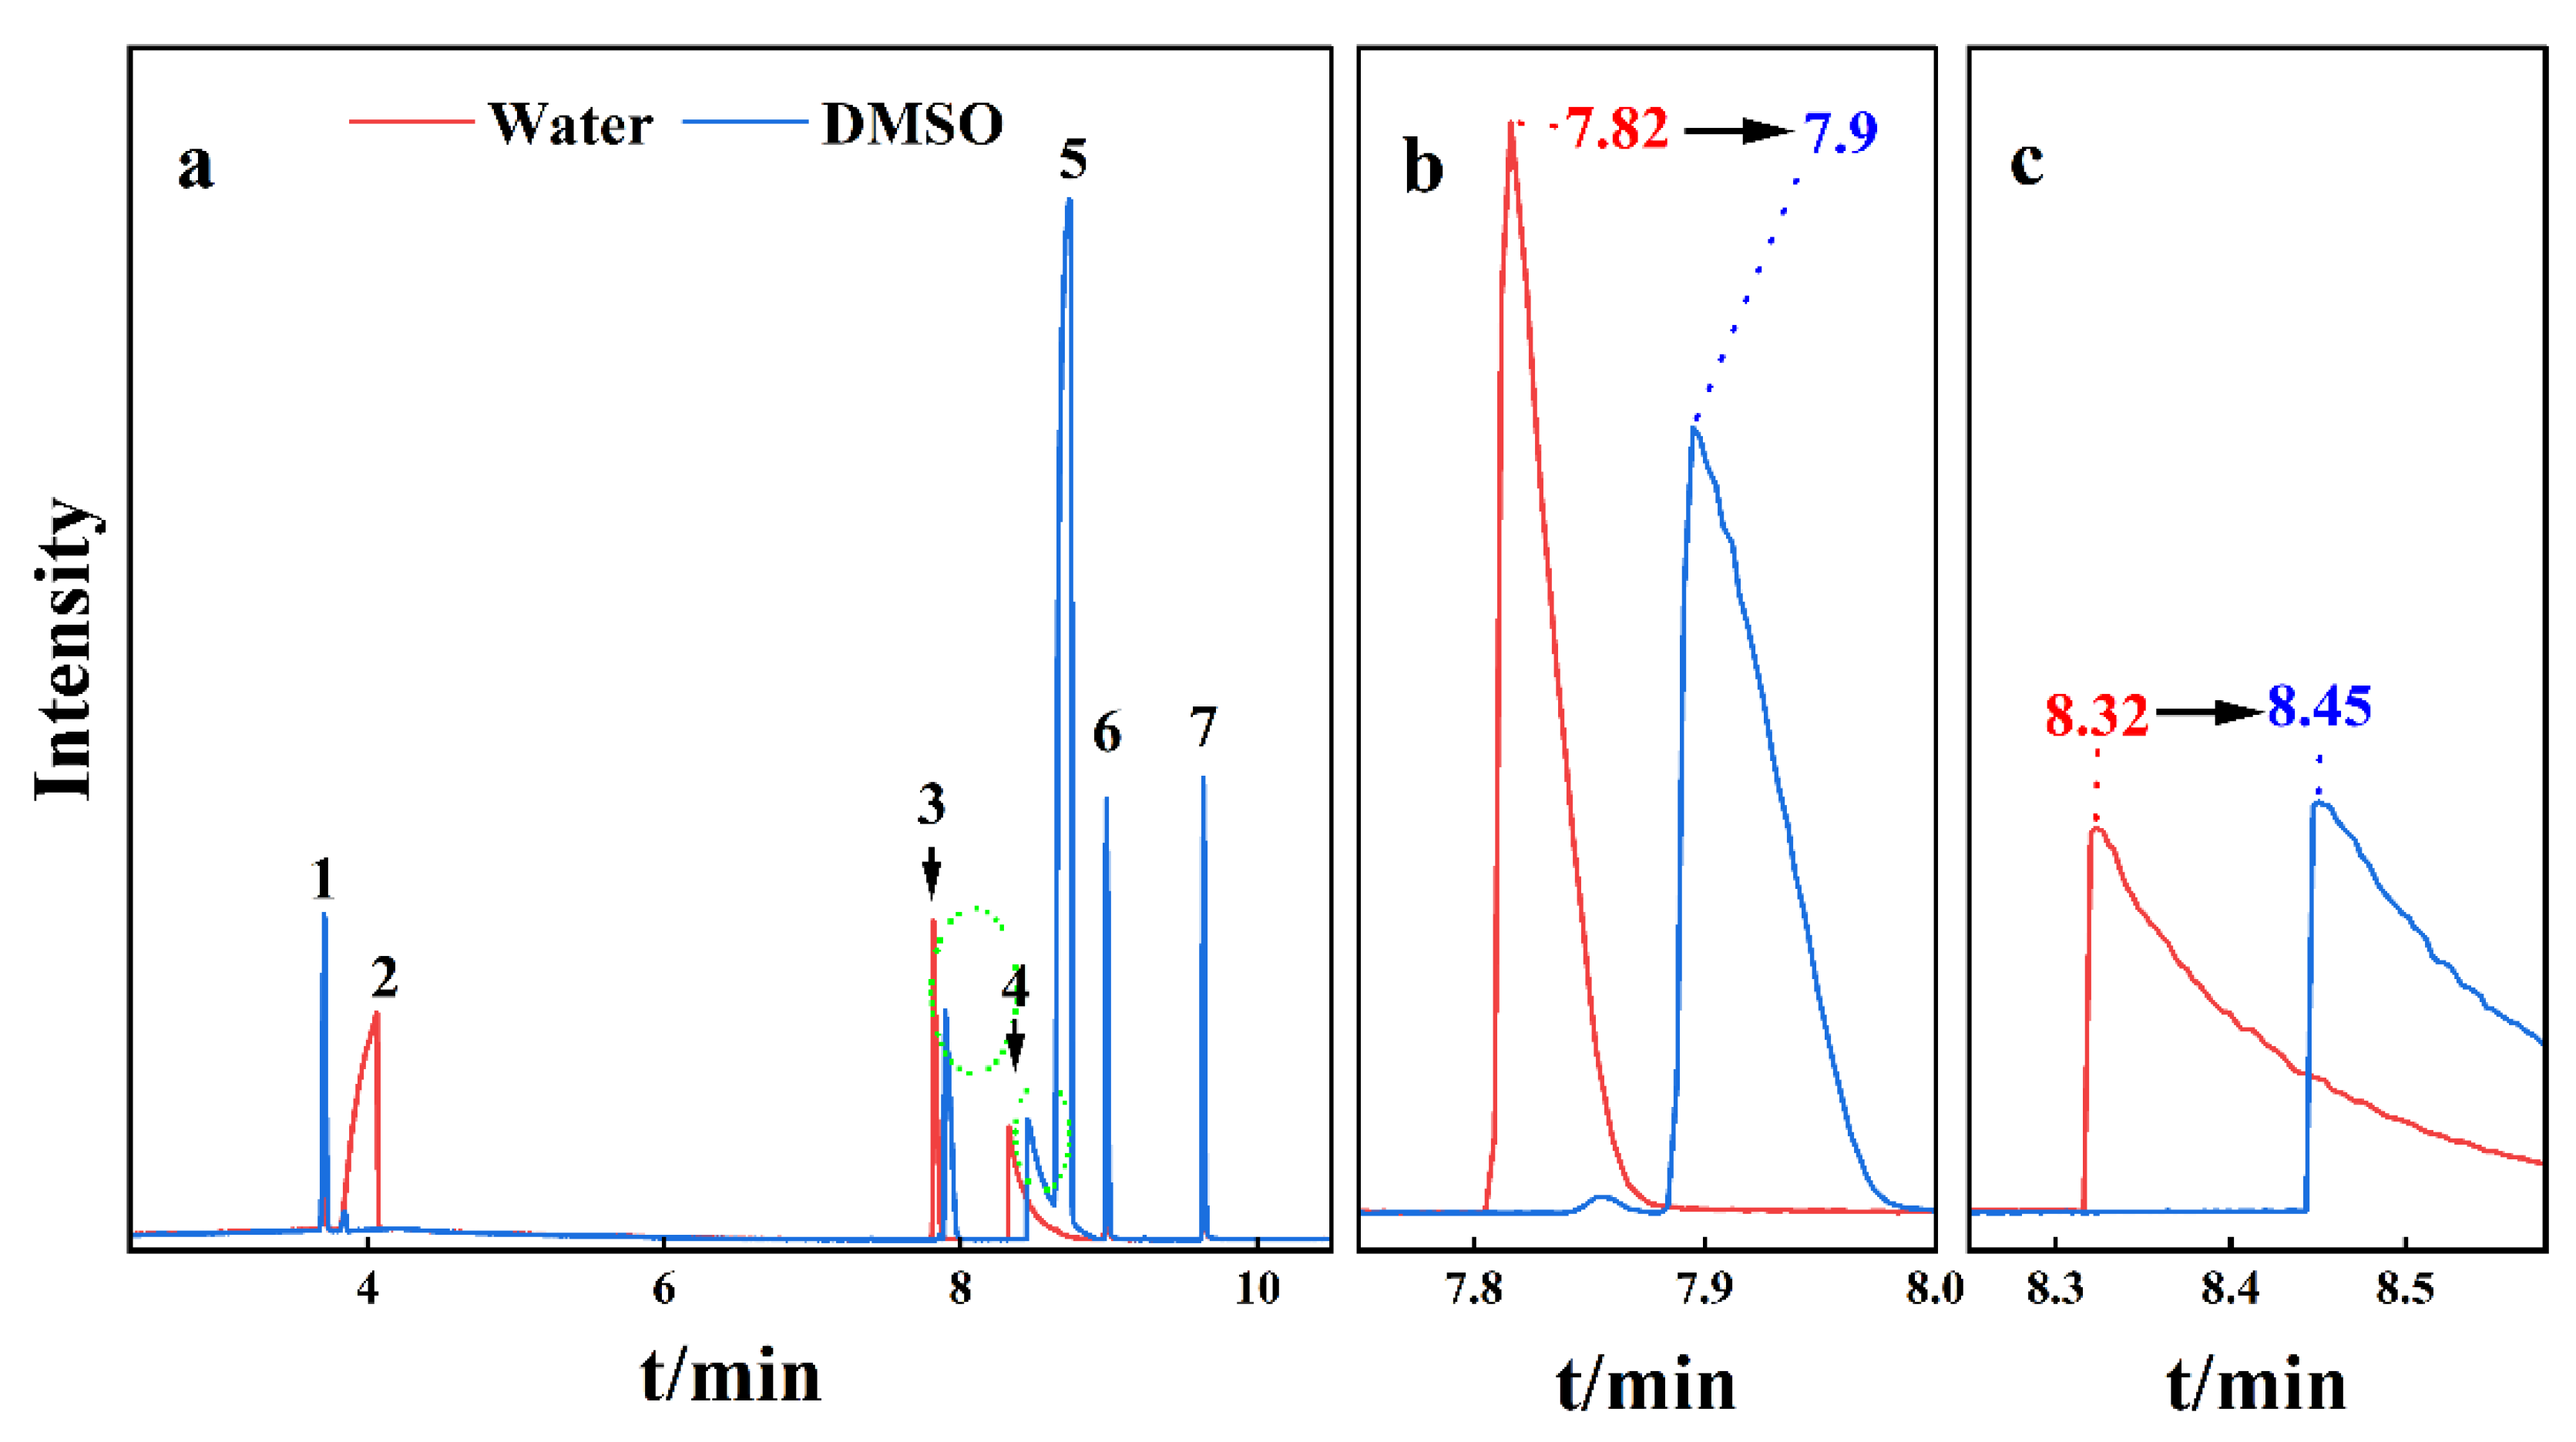
3.2. Gas Chromatographic Separation of SCFAs in Water and DMSO

Formic acid is the simplest carboxylic acid and typically requires derivatization when it is measured by gas chromatography [21,22]. To verify the commonalities and differences in the SCFA retention time changes, we first directly detected and analyzed formic acid without derivatization. To improve the detection accuracy and analyte resolution, the high-accuracy GC–MS method and the strong-polarity DB-WAX capillary column were used. When we tested formic acid using GC-FID under the same conditions as the acetic acid determination, the formic acid sensitivity could not meet the observation requirements. Therefore, we chose GC–MS based on the results of a comparative test that determined it could meet our experimental requirements.
The retention time change of the tested substance was detected using both water and DMSO as solvents. The solute was a mixture of formic acid, acetic acid, butyric acid, valeric acid, and toluene. Only the retention times of formic acid and acetic acid in the mixture changed (Figure 2a), increasing from 8.32 min to 8.45 min for formic acid (Figure 2b) and from 7.82 min to 7.90 min for acetic acid (Figure 2c).

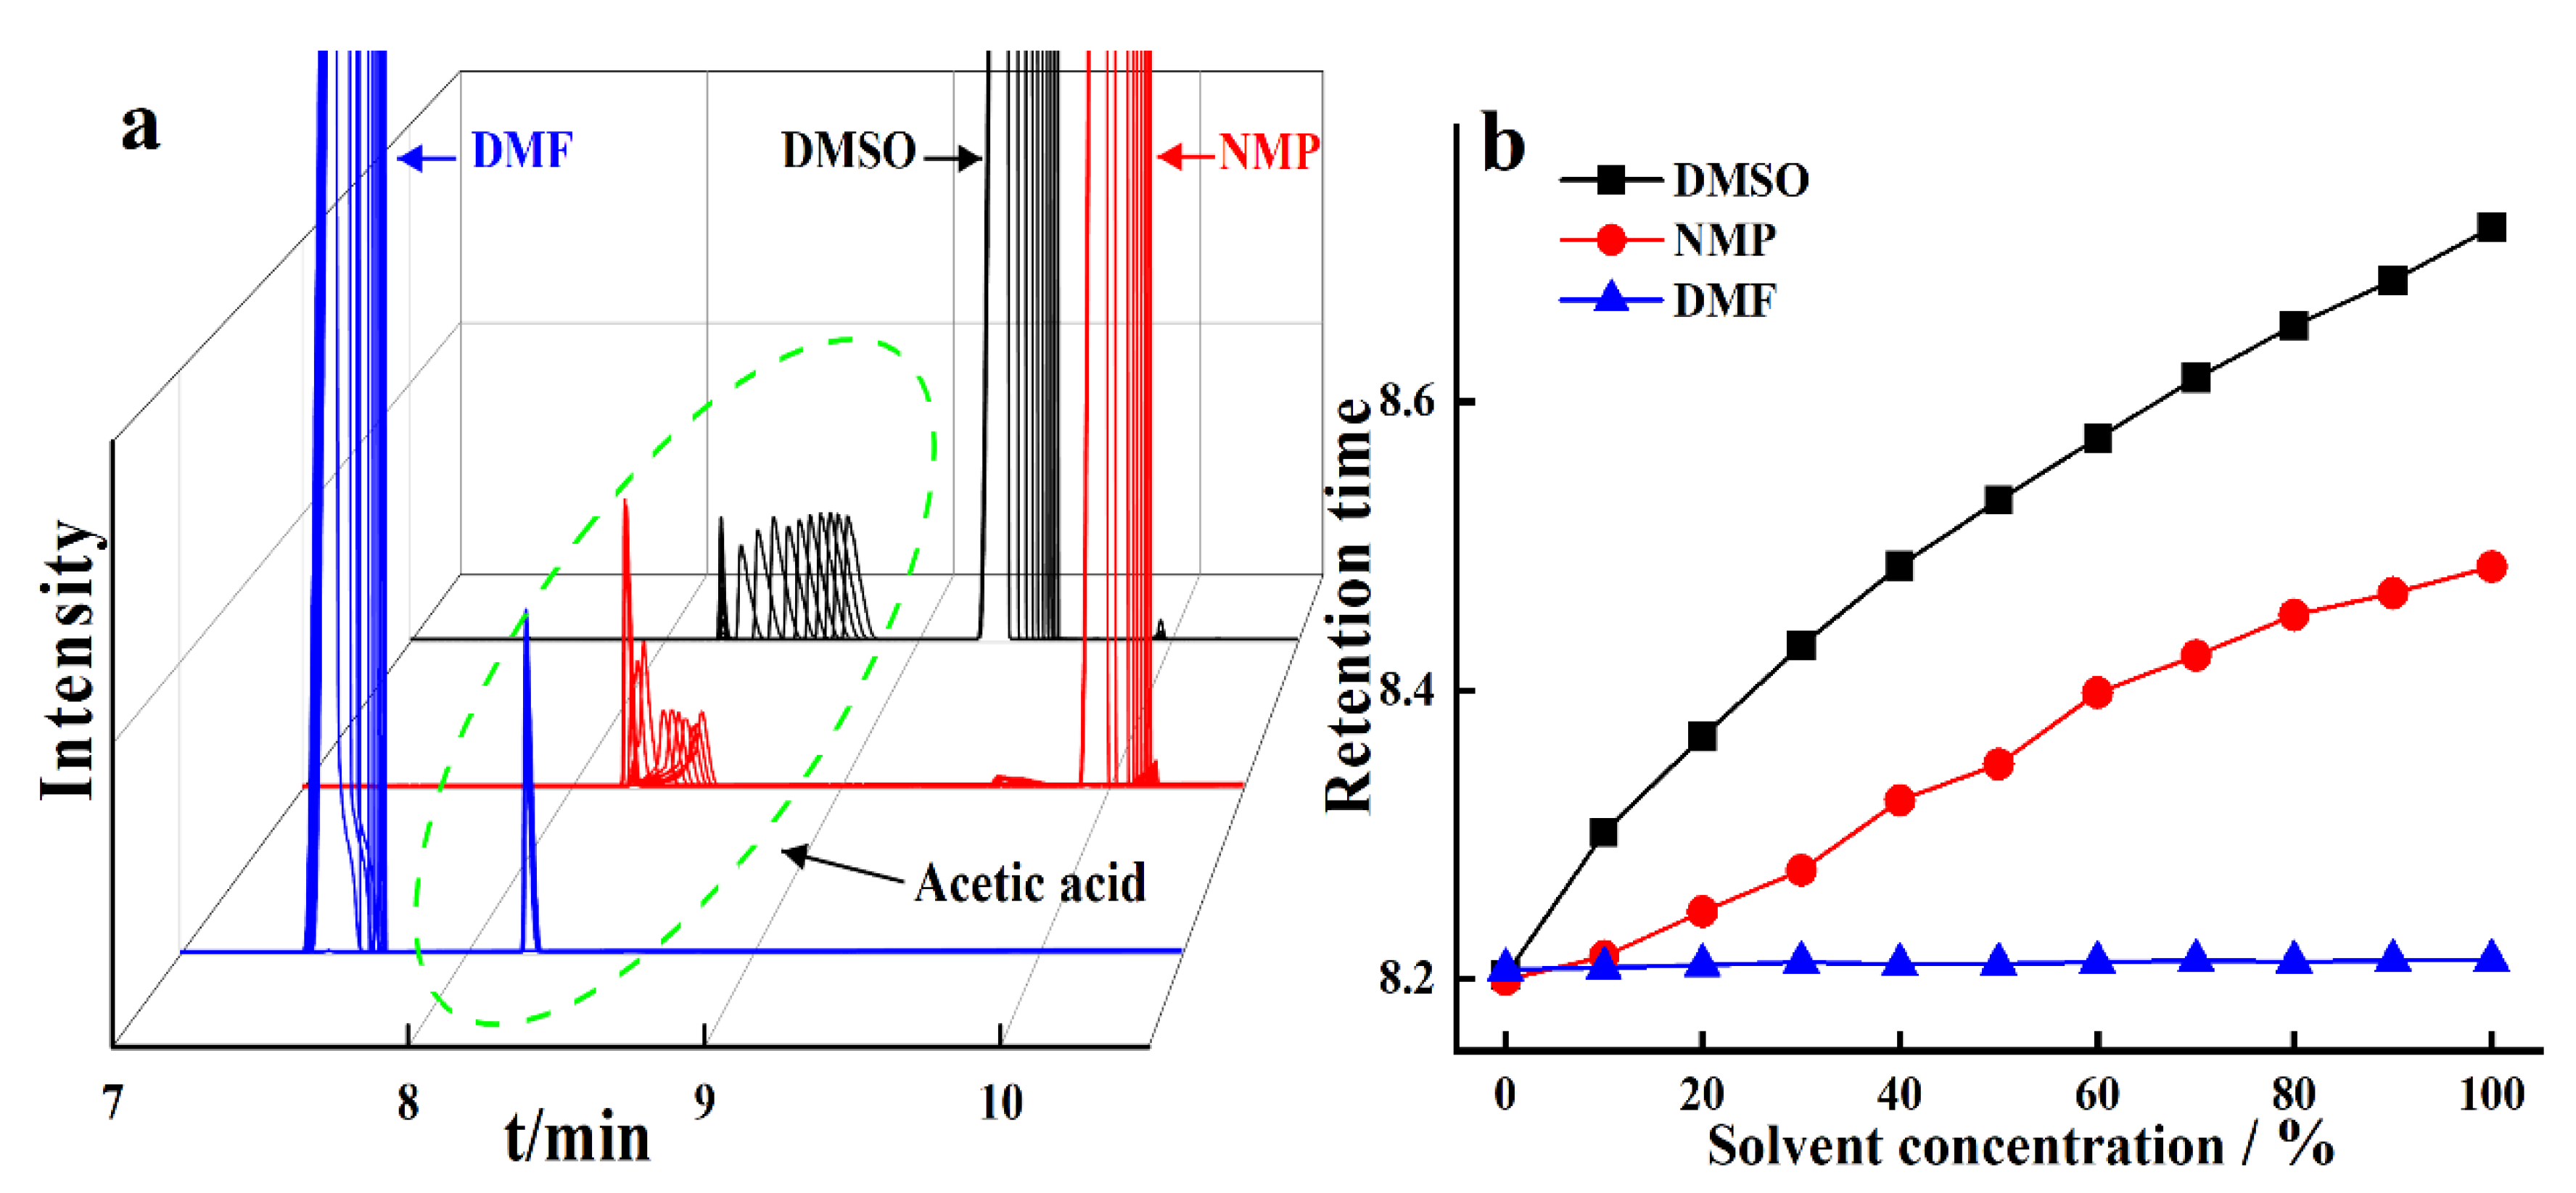
3.3. Chromatographic Separation of Acetic Acid in Three Polar Aprotic Solvents

The change in the retention time of acetic acid in solutions with gradient DMSO–water, gradient NMP–water, and gradient DMF–water, with 5% acetic acid in each solution, was measured using DB-WAX and GC-FID gas chromatography. The structure and properties of the three solvents are shown in Figure 3 and Table 2. The retention time of the acetic acid in DMSO–water and NMP–water changed as the solvent concentration increased, with greater increases observed in the DMSO–water than in the NMP–water solution. However, the retention time of the acetic acid in the DMF–water solution remained unchanged (Figure 4). Therefore, the retention time of acetic acid is affected when the outflow rate of the solvent is lower than that of acetic acid.

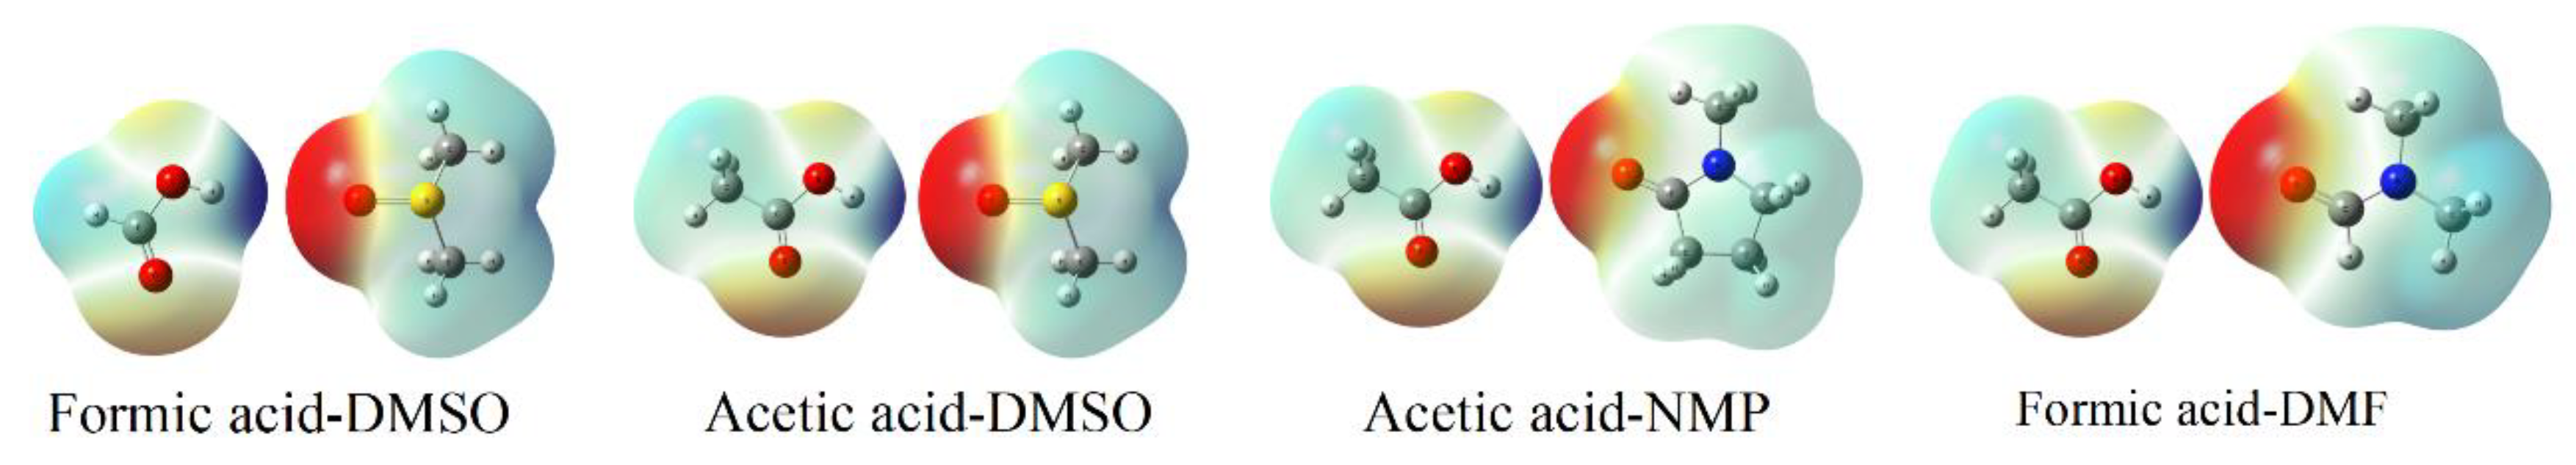
3.4. Hydrogen Bonding between Acetic Acid and Polar Aprotic Solvents

The carboxyl group in SCFAs is a combination of two functional groups attached to a single carbon atom: hydroxyl (-OH) and carbonyl (=O). These have unique properties, including polarity, highly electronegativity, and weak acidity, and are capable of hydrogen bonding by donating and accepting protons [23]. Therefore, they can interact with DMSO, NMP, and DMF isopolar aprotic solvents to produce stronger hydrogen bonds. Quantum chemical calculations can be used to characterize the interactions and interaction sites between molecules. In this study, the B3LYP/6-31+G(d,p) method and DFT-D3BJ dispersion correction were used to optimize the structure of DMSO and acetic acid molecules and to calculate their frequency. This included NBO [24] analysis and characterization of hydrogen bonding sites between the acetic acid solute and the DMSO, NMP, and DMF solvents. Structures without imaginary frequencies after optimization are considered stable structures. The structure-optimized acetic acid molecule and three solvent molecules are shown in Figure 5.
The qualitative size of the electrostatic potential corresponds to shaded regions of the molecular surface: red areas represent negative electrostatic potential with aggregated electrons, where positively charged particles can have a strong interaction and are easy to approach; blue regions represent positive electrostatic potential, where negatively charged particles are easily approached [25]. The maximum positive electrostatic potential of formic acid and acetic acid molecules is concentrated in the upper part of the carboxyl functional group -OH, while the upper part of S = O, with the smallest negative electrostatic potential in the DMSO molecule, will generate hydrogen bonds with the hydroxyl group of formic acid and acetic acid [26]. The electrostatic potential results for the solvents DMSO, NMP, DMF, and for formic acid and acetic acid, indicate that the -OH groups in the formic acid and acetic acid molecules are placed above the S = O bond of the DMSO molecule. Similarly, the -OH group in the acetic acid molecule is placed above the C = O bond of the NMP and DMF molecules. The B3LYP/6-31+G(d,p) [27,28,29,30] method and DFT-D3BJ [31,32] dispersion correction were used to optimize the structure of these three systems (Figure 6 and Table 3).
Formula for calculating hydrogen bond energy:
E (Interaction) = E (Complex Corrected)—E (Solvent)—E (Acetic acid)
E (Complex Corrected) is the BSSE correction value, while the molecular fragments in the complex molecule must be defined when calculating the BSSE correction value

3.5. Mechanism of Change in Retention Time for SCFAs in Polar Solvents

Hydrogen bonding during capillary column separation is the primary reason for changes in the retention time of formic acid and acetic acid. The part of DMSO with the smallest negative electrostatic potential (red, Figure 3) has a high electron density and can easily donate electrons, forming a hydrogen bond with formic acid and acetic acid. The part of DMSO with the largest positive electrostatic potential (blue, Figure 3) forms a bond with the column stationary phase polyethylene glycol (PEG) with a strong dipole moment and is adsorbed on the stationary phase in the direction of the dipole moment of DMSO. Compared with those of acetic acid, the hydrogen bond length between formic acid-DMSO is shorter, the bond energy is larger, and the retention time changes more (Figure 7c).
The retention time of the acetic acid in the DMSO–water solution was longer than in the NMP–water solution. This is consistent with the quantum chemical results: the strength of the hydrogen bond between DMSO and acetic acid is greater than that between NMP and acetic acid (Figure 7a,b). Additionally, the DMF molecules flow out faster than acetic acid in the chromatographic column. The hydrogen bond formed between the DMF and acetic acid flowing out of the capillary column first did not resist the outflow of acetic acid, meaning the retention time of the acetic acid in the DMF–water solution did not change.
The retention times of butyric acid and valeric acid, which also have large dipole moments, do not change in a mixed 2.2 solution. The solvent DMSO flows faster from the column than butyric acid and valeric acid, and the hydrogen bond between DMSO and butyric acid and valeric acid does not block the efflux of butyric acid and valeric acid. Therefore, the retention time of the butyric acid and valeric acid in the DMSO–water solution does not change. The retention time of the toluene did not change because toluene cannot easily generate hydrogen bonds.

4. Conclusions

We used gas chromatography, gas chromatography–mass spectrometry analysis, quantum chemical calculations, and comparative experiments to fill a research gap and examine hydrogen bonding, retention time, and polar solvents in SCFAs. We examined the interactions between molecules in the system and the interactions between solutes, solvents, and stationary solutions. SCFAs are medically important organic acids composed of carbonyl and hydroxyl groups that can generate hydrogen bonds, which can make analysis difficult. They are polar, soluble in water, and have unique aggregation characteristics at the molecular level. Their hydrogen bonds are strong, but the hydrogen bonds between the dimers will quickly break down when they are miscible with water. Their properties significantly change as the carbon chain length and molar mass both increase. In gas chromatography, the retention time is an important indicator for the qualitative determination of substances. Therefore, to accurately, effectively, and rapidly determine SCFAs using gas chromatography, the molecular force between SCFAs and the solvent, the force between the solvent and the stationary phase, the physical and chemical commonalities, and SCFA characteristics must all be considered. Our results provide important insights for the determination of SCFAs using gas chromatography.

Author Contributions

Conceptualization, M.R. and N.S.; methodology, M.R.; software, M.R.; validation, M.R., N.S. and N.N.; formal analysis, M.R.; investigation, M.R.; resources, M.R.; data curation, M.R.; writing—original draft preparation, M.R.; writing—review and editing, M.R.; visualization, M.R.; supervision, M.R.; project administration, M.R.; funding acquisition, N.S. All authors have read and agreed to the published version of the manuscript.

Funding

This research received no external funding.

Institutional Review Board Statement

Not applicable.

Informed Consent Statement

Not applicable.

Data Availability Statement

No new data were created or analyzed in this study. Data sharing is not applicable to this article.

Conflicts of Interest

The authors declare no conflict of interest.

References

  1. Mihaylova, M.M.; Stratton, M.S. Short chain fatty acids as epigenetic and metabolic regulators of neurocognitive health and disease. In Nutritional Epigenomics; Elsevier: London, UK, 2019; pp. 381–397. [Google Scholar] [CrossRef]
  2. Silva, Y.P.; Bernardi, A.; Frozza, R.L. The Role of Short-Chain Fatty Acids from Gut Microbiota in Gut-Brain Communication. Front. Endocrinol. 2020, 11, 25. [Google Scholar] [CrossRef] [PubMed] [Green Version]
  3. Aho, V.T.E.; Houser, M.C.; Pereira, P.A.B.; Chang, J.; Rudi, K.; Paulin, L.; Hertzberg, V.; Auvinen, P.; Tansey, M.G.; Scheperjans, F. Relationships of gut microbiota, short-chain fatty acids, inflammation, and the gut barrier in Parkinson’s disease. Mol. Neurodegener. 2021, 16, 1–14. [Google Scholar] [CrossRef] [PubMed]
  4. Cryan, J.F.; O’Riordan, K.J.; Cowan, C.S.M.; Sandhu, K.V.; Bastiaanssen, T.F.S.; Boehme, M.; Codagnone, M.G.; Cussotto, S.; Fulling, C.; Golubeva, A.V.; et al. The microbiota-gut-brain axis. Physiol. Rev. 2019, 99, 1877–2013. [Google Scholar] [CrossRef] [PubMed]
  5. García-Gutiérrez, M.S.; Navarrete, F.; Sala, F.; Gasparyan, A.; Austrich-Olivares, A.; Manzanares, J. Biomarkers in Psychiatry: Concept, Definition, Types and Relevance to the Clinical Reality. Front. Psychiatry 2020, 11, 432. [Google Scholar] [CrossRef] [PubMed]
  6. Liebisch, G.; Ecker, J.; Roth, S.; Schweizer, S.; Öttl, V.; Schött, H.-F.; Yoon, H.; Haller, D.; Holler, E.; Burkhardt, R.; et al. Quantification of Fecal Short Chain Fatty Acids by Liquid Chromatography Tandem Mass Spectrometry—Investigation of Pre-Analytic Stability. Biomolecules 2019, 9, 121. [Google Scholar] [CrossRef] [Green Version]
  7. Van Eijk, H.M.; Bloemen, J.G.; Dejong, C.H. Application of liquid chromatography–mass spectrometry to measure short chain fatty acids in blood. J. Chromatogr. B 2009, 877, 719–724. [Google Scholar] [CrossRef]
  8. Wang, L.-L.; Guo, H.-H.; Huang, S.; Feng, C.-L.; Han, Y.-X.; Jiang, J.-D. Comprehensive evaluation of SCFA production in the intestinal bacteria regulated by berberine using gas-chromatography combined with polymerase chain reaction. J. Chromatogr. B 2017, 1057, 70–80. [Google Scholar] [CrossRef]
  9. Yongru, L.; Xu, L.; Shengnan, T.; Yunxiao, Z.; Ruijie, L.; Qingzhe, J. Determination of short-chain fatty acids in Rancimat measuring cell water by reversed-phase high-performance liquid chromatography. China Oils Fats 2017, 42, 126–128. [Google Scholar]
  10. Meimei, G.; Liwei, X.; Hongzhao, Y.; Jiurong, W.; Xianfeng, K.; Min, W. A Determination Method Based on Gas Chromatography for Analysis of Short-chain Fatty Acids in Colonic Contents of Piglet. Prog. Mod. Biomed. 2015, 15, 1010–1014. [Google Scholar]
  11. Zhao, X.-Y.; Wang, Y.-F.; Yang, F.; Jiang, Z.-Z.; Wang, Y.; Yang, L.; Pan, Z.-H. Rapid Analysis of Seven Short-Chain Fatty Acids in Human Saliva by Gas Chromatography. Chin. J. Anal. Chem. 2016, 44, 1009–1014. [Google Scholar]
  12. Pharmacopoeia, C. Pharmacopoeia of the People’s Republic of China 2020; China Medical Science and Technology Press: Beijing, China, 2020. [Google Scholar]
  13. Tan, L.; Ju, H.; Li, J. Extraction and determination of short-chain fatty acids in biological samples. Chin. J. Chromatogr. 2006, 24, 81–87. [Google Scholar]
  14. Poole, C.F.; Berezkin, V.G.; Borisova, L.V.; Demin, Y.V.; Gatinskaya, N.G.; Ermakov, V.V.; Ryabukhin, V.A.; Bozhkov, O.D. The essence of chromatography. J. Anal. Chem. 2005, 60, 193. [Google Scholar] [CrossRef]
  15. Dai, Z.Y.; Chen, W.H.; Zhou, H.; Yang, H.Y. Studies on quantitative chromatographic retention-structure relationships. Chin. J. Chromatogr. 2000, 18, 125–127. [Google Scholar]
  16. Nie, J.; Zhi, D.; Zhou, Y. Magnetic biochar-based composites for removal of recalcitrant pollutants in water. In Sorbents Materials for Controlling Environmental Pollution; Elsevier: San Diego, CA, USA, 2021; pp. 163–187. [Google Scholar] [CrossRef]
  17. Dereka, B.; Yu, Q.; Lewis, N.H.; Carpenter, W.B.; Bowman, J.M.; Tokmakoff, A. Crossover from hydrogen to chemical bonding. Science 2021, 371, 160–164. [Google Scholar]
  18. Majid, H.A.; Cole, J.; Emery, P.W.; Whelan, K. Additional oligofructose/inulin does not increase faecal bifidobacteria in critically ill patients receiving enteral nutrition: A randomised controlled trial. Clin. Nutr. 2014, 33, 966–972. [Google Scholar] [CrossRef]
  19. Ou, J.; Carbonero, F.; Zoetendal, E.G.; DeLany, J.; Wang, M.; Newton, K.; Gaskins, H.R.; O’Keefe, S.J.D. Diet, microbiota, and microbial metabolites in colon cancer risk in rural Africans and African Americans. Am. J. Clin. Nutr. 2013, 98, 111–120. [Google Scholar] [CrossRef] [Green Version]
  20. Yu-jian, S.; Hong, S.; Jin-di, X.; Dong-zhou, K.; Song-lin, L. Advance in determination of short-chain fatty acids of gut bacterial metabolites in feces. Chin. J. Pharm. Anal. 2019, 39, 967–974. [Google Scholar]
  21. Zhou, D.; Hou, Q.; Liu, W.; Ren, X. Rapid determination of formic and acetic acids in biomass hydrolysate by headspace gas chromatography. J. Ind. Eng. Chem. 2017, 47, 281–287. [Google Scholar] [CrossRef]
  22. Fu, Z.; Jia, Q.; Zhang, H.; Kang, L.; Sun, X.; Zhang, M.; Wang, Y.; Hu, P. Simultaneous quantification of eleven short-chain fatty acids by derivatization and solid phase microextraction—Gas chromatography tandem mass spectrometry. J. Chromatogr. A 2021, 1661, 462680. [Google Scholar] [CrossRef]
  23. Klecker, C.; Nair, L.S. Matrix Chemistry Controlling Stem Cell Behavior. In Biology and Engineering of Stem Cell Niches; Elsevier: London, UK, 2017; pp. 195–213. [Google Scholar] [CrossRef]
  24. Kurt, M.; Babu, P.C.; Sundaraganesan, N.; Cinar, M.; Karabacak, M. Molecular structure, vibrational, UV and NBO analysis of 4-chloro-7-nitrobenzofurazan by DFT calculations. Spectrochim. Acta Part A Mol. Biomol. Spectrosc. 2011, 79, 1162–1170. [Google Scholar]
  25. Singh, D.K.; Jagannathan, R.; Khandelwal, P.; Abraham, P.M.; Poddar, P. In situ synthesis and surface functionalization of gold nanoparticles with curcumin and their antioxidant properties: An experimental and density functional theory investigation. Nanoscale 2012, 5, 1882–1893. [Google Scholar] [CrossRef]
  26. Orozco, M.; Alhambra, C.; Barril, X.; Luque, F.J. Theoretical Methods for the Representation of Solvent. J. Mol. Model. 1996, 2, 1–15. [Google Scholar] [CrossRef]
  27. Becke, A.D. Density-functional exchange-energy approximation with correct asymptotic behavior. Phys. Rev. A 1988, 38, 3098–3100. [Google Scholar] [CrossRef] [PubMed]
  28. Stephens, P.J.; Devlin, F.J.; Chabalowski, C.F.; Frisch, M.J. Ab Initio Calculation of Vibrational Absorption and Circular Dichroism Spectra Using Density Functional Force Fields. J. Phys. Chem. 1994, 98, 11623–11627. [Google Scholar] [CrossRef]
  29. Lee, C.; Yang, W.; Parr, R.G. Development of the Colle-Salvetti correlation-energy formula into a functional of the electron density. Phys. Rev. B 1988, 37, 785–789. [Google Scholar] [CrossRef] [PubMed] [Green Version]
  30. Hertwig, R.H.; Koch, W. On the parameterization of the local correlation functional. What is Becke-3-LYP? Chem. Phys. Lett. 1997, 268, 345–351. [Google Scholar] [CrossRef]
  31. Hohenberg, P.; Kohn, W. Inhomogeneous Electron Gas. Phys. Rev. 1964, 136, B864–B871. [Google Scholar] [CrossRef] [Green Version]
  32. Kohn, W.; Sham, L.J. Self-consistent equations including exchange and correlation effects. Phys. Rev. 1965, 140, A1133–A1138. [Google Scholar] [CrossRef] [Green Version]
Figure 1. Change in retention time of acetic acid in gradient DMSO–water solution in different columns. (a) Result with DB-624 column; (b) result with the DB-WAX column.
Separations 09 00124 g001
Figure 2. Comparison of retention times of six compounds in water and DMSO. (a) Retention times of six compounds in water and DMSO; (b) enlarged view of the peak of acetic acid (green circled area indicated by position 4 from Figure 2a; (c) Enlarged view of the peak of formic acid (green circled area indicated by position 5 from Figure 2a. Peak identifications: 1. toluene; 2. water; 3. acetic acid; 4. formic acid; 5. DMSO; 6. butyric acid; 7. valeric acid.
Separations 09 00124 g002
Figure 3. Dipole moments of three polar aprotic solvents.
Separations 09 00124 g003
Figure 4. Retention times of acetic acid in three polar aprotic solvents. (a) Acetic acid peaks in three polar aprotic solvents; (b) changes in retention time of acetic acid in three polar aprotic solvents.
Separations 09 00124 g004
Figure 5. Hydrogen bonding sites of formic acid–DMSO and acetic acid–polar aprotic solvent molecules.
Separations 09 00124 g005
Figure 6. Schematic diagram of the hydrogen bond length formed by acetic acid and three solvent molecules, and the NPA charge of each atom.
Separations 09 00124 g006
Figure 7. Effect of polar aprotic solvents on the retention time of SCFA gas chromatography and mechanism. (a) Effect of DMSO on the retention time of acetic acid gas chromatography and mechanism; (b) effect of NMP on the retention time of acetic acid gas chromatography and mechanism; (c) effect of DMSO on the retention time of formic acid gas chromatography and mechanism.
Separations 09 00124 g007
Table 1. Gas chromatography columns with three different polarities.
Stationary PhasesColumn TypePolarity Level
100% dimethylpolysiloxaneDB-1non-polar
6% cyanopropylphenyl—94%
dimethylpolysiloxane
DB-624mid-polar
100% PEG (polyethylene glycol)DB-WAXhigh-polar
Table 2. Properties of different solvents.
SolventMWBoiling
Point
(°C)
Density
(g/mL)
Solubility in H2O
(g/100 g)
Dielectric
Constant
(20 °C)
Flash
Point
(°C)
DMSO781891.092Miscible4795
NMP992021.033Miscible3291
DMF731530.9445Miscible38.2558
Table 3. NPA charges of hydrogen bond atoms, hydrogen bond length, and energy.
ProjectFormic Acid-DMSOAcetic Acid-DMSOAcetic Acid-NMPAcetic Acid-DMF
NPA charge
(Hydrogen atom) *
0.5340.5400.5460.539
NPA charge
(Oxygen atom) *
−1.028−0.997−0.69−0.732
Hydrogen bond length (Å)1.5301.5601.6051.634
Hydrogen bond energy (kJ/mol)45.66839.98731.73428.794
* NPA charge (Hydrogen atom) is the NPA charge of the hydrogen atoms of formic acid and acetic acid involved in hydrogen bonding; * NPA charge (Oxygen atom) is the NPA charge of the oxygen atoms of DMSO, NMP, and DMF involved in hydrogen bonding.
Publisher’s Note: MDPI stays neutral with regard to jurisdictional claims in published maps and institutional affiliations.

