
Analysis of Multiclass Pesticide Residues in Tobacco by Gas Chromatography Quadrupole Time-of-Flight Mass Spectrometry Combined with Mini Solid-Phase Extraction

 , ,
, ,
Abstract
:1. Introduction
2. Material and Methods
2.1. Reagents and Materials
2.2. Standard Solution Preparation
2.3. Sample Preparation
2.4. GC-QTOF/MS
2.5. Experimental Design
2.6. Analytical Parameters
3. Results and Discussion
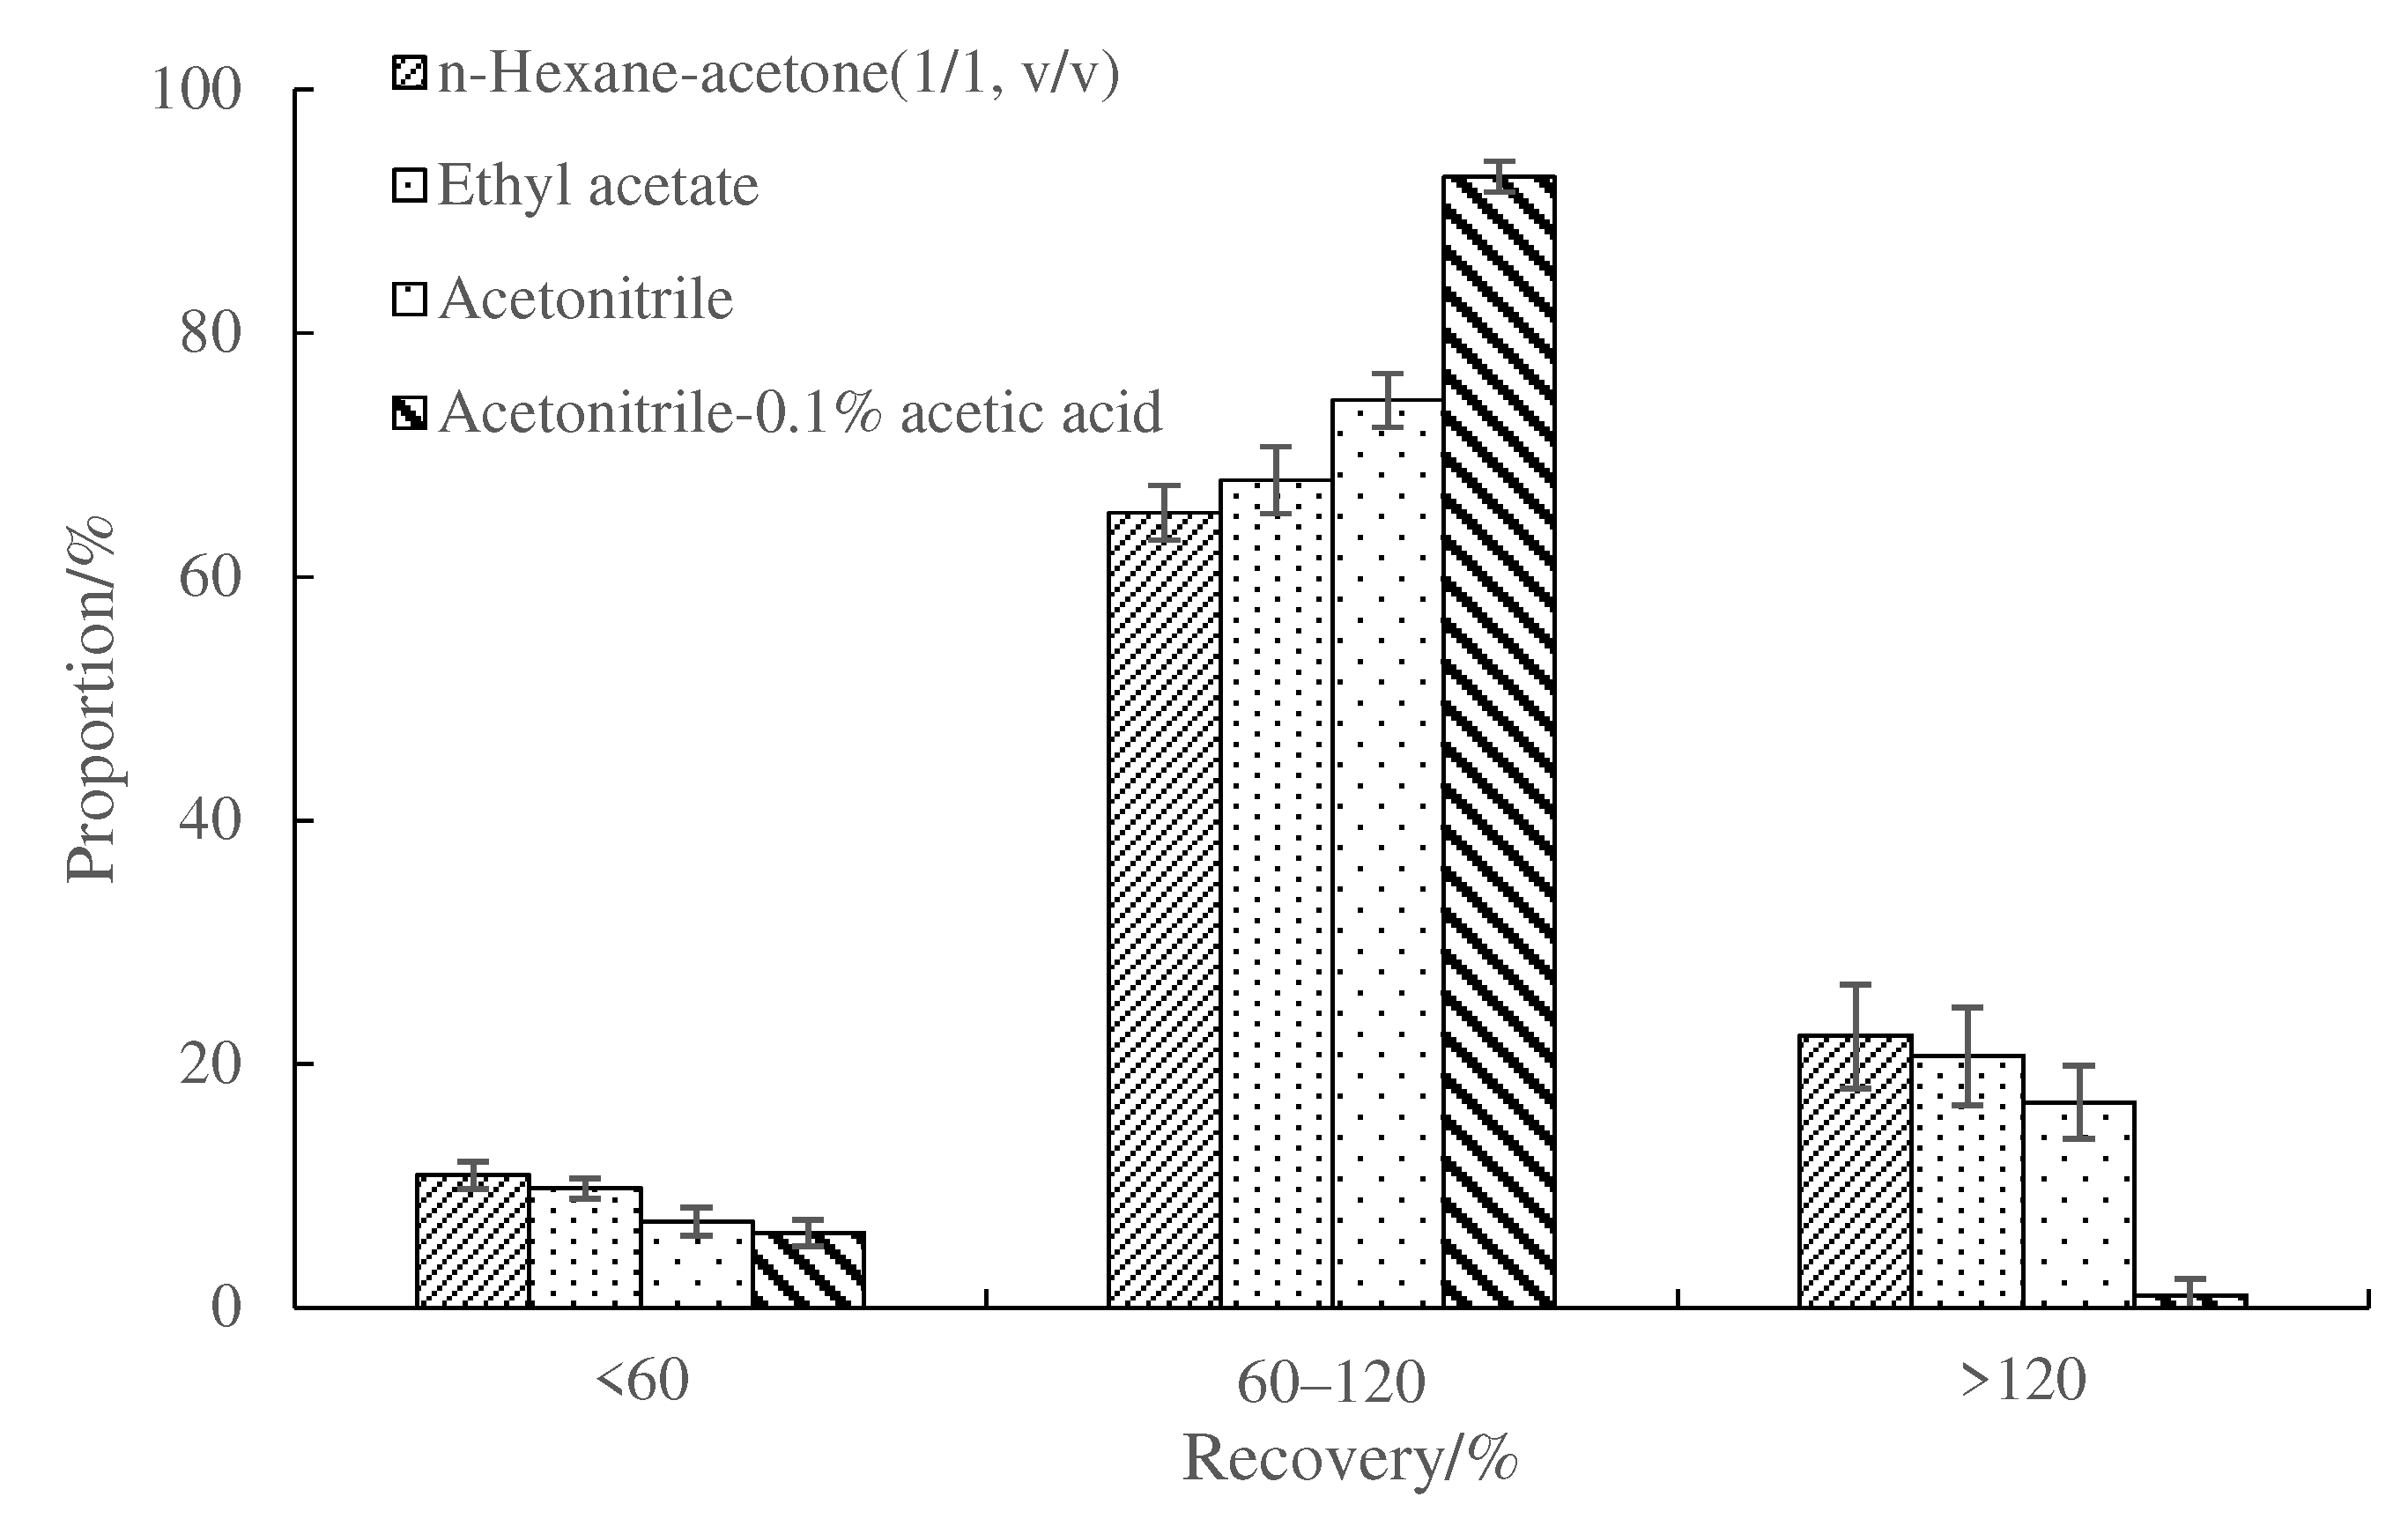
3.1. Optimization of Extraction Conditions
3.2. Optimization of Sample Preparation Conditions
3.3. Matrix Effects
3.4. Screening Method
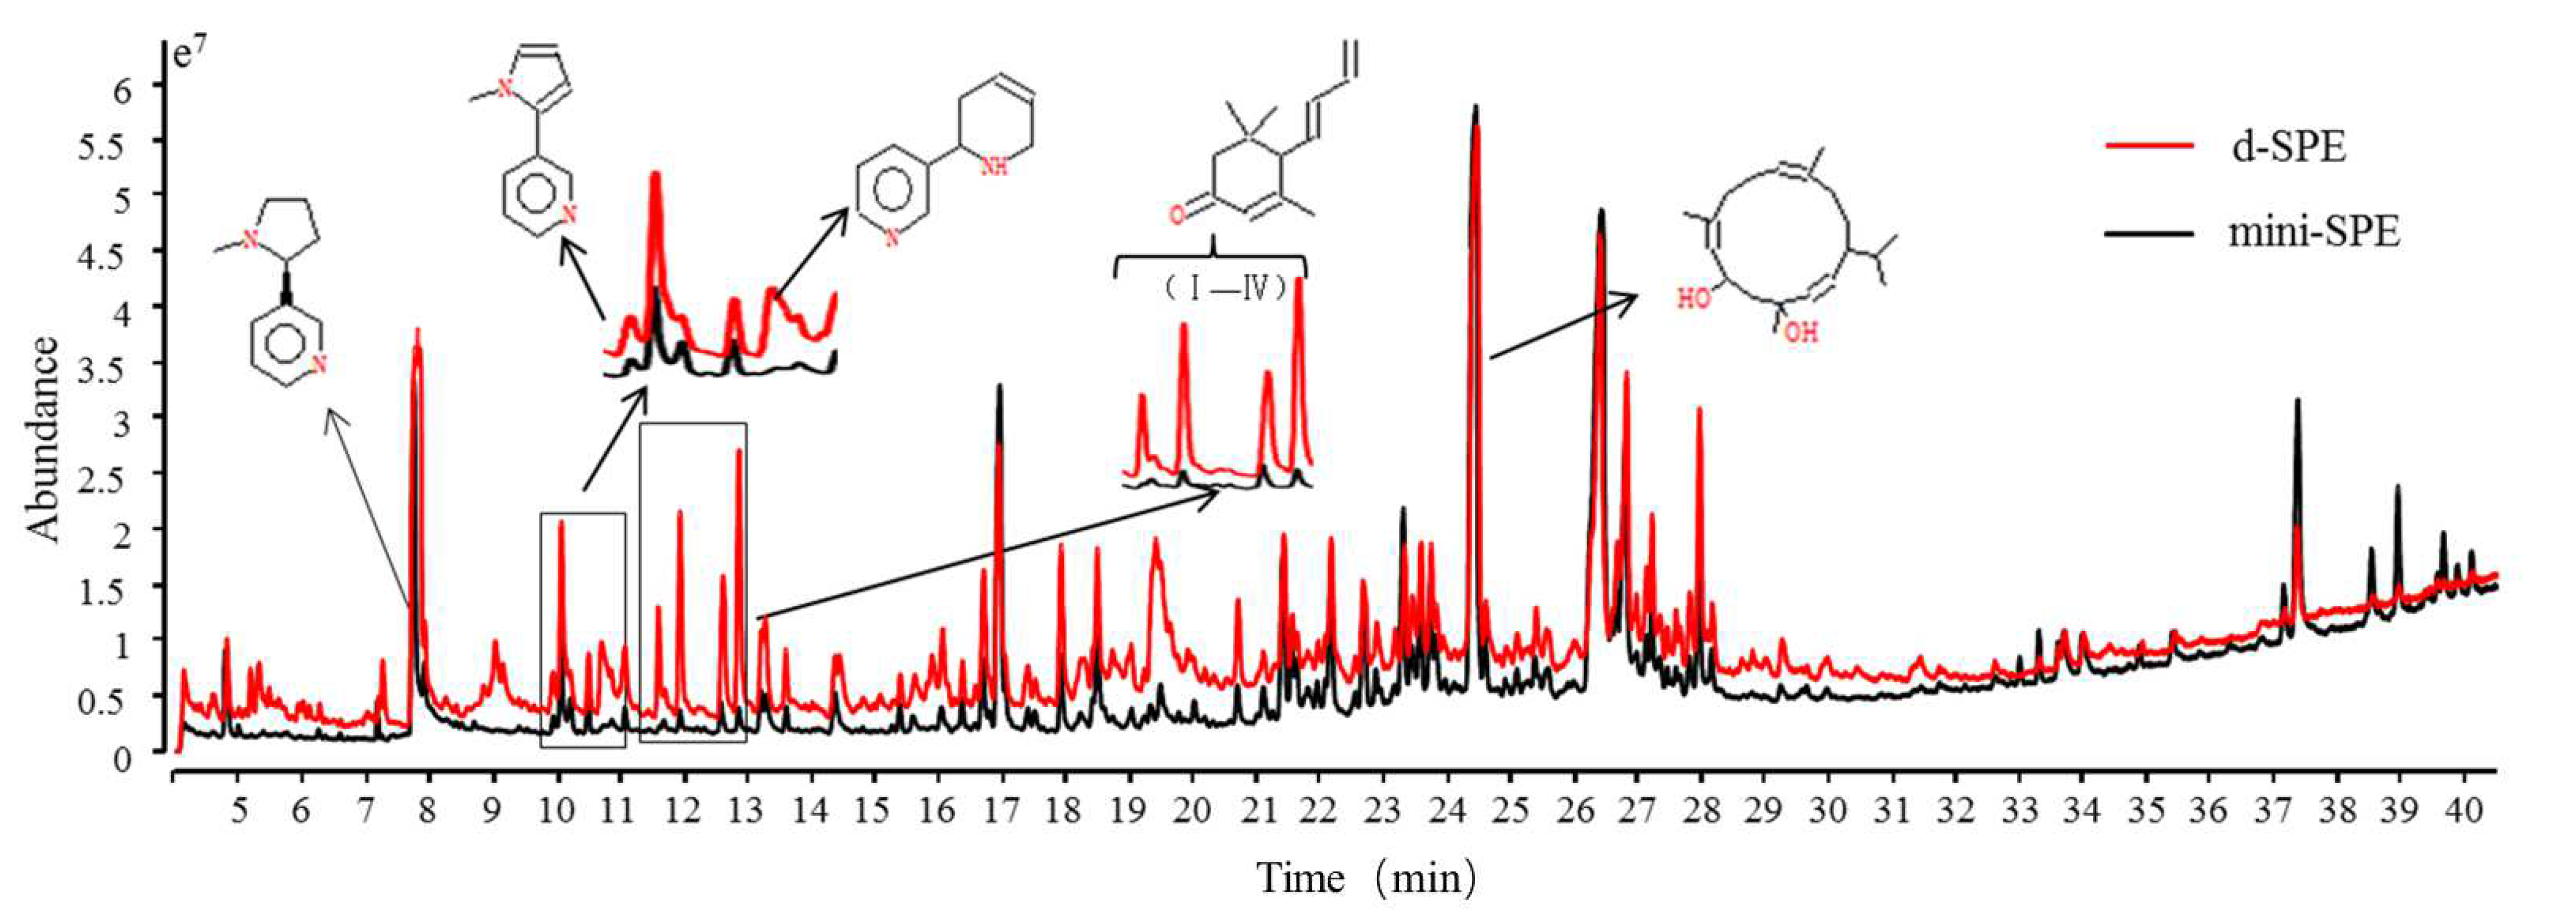
3.5. Comparison of Cleanup Efficiency of Mini-SPE and d-SPE
3.6. Analytical Parameters of Quantitative Method
3.7. Real Sample Analysis
4. Conclusions
Supplementary Materials
Author Contributions
Funding
Conflicts of Interest
Appendix A

| Pesticides | r2 | LOD (ng/g) | LOQ (ng/g) | Spiked at 50 ng/g | Spiked at 250 ng/g | Spiked at 500 ng/g | |||
|---|---|---|---|---|---|---|---|---|---|
| Recovery (%) | CV (%) | Recovery (%) | CV (%) | Recovery (%) | CV (%) | ||||
| 1,2-Dibromo-3-chloropropane | 0.997 | 4.5 | 14.8 | 40.3 | 3.6 | 49.6 | 5.7 | 49.3 | 9.6 |
| Dichlorvos | 0.997 | 4.4 | 14.6 | 100.4 | 7.1 | 72.7 | 3.7 | 80.4 | 11.8 |
| Disulfoton sulfoxide | 0.999 | 1.4 | 4.5 | 96.2 | 7.0 | 106.2 | 1.2 | 104.3 | 3.8 |
| Mevinphos(E) | 0.999 | 4.9 | 16.1 | 83.3 | 8.9 | 75.3 | 3.0 | 78.9 | 9.2 |
| Butylate | 0.998 | 2.2 | 7.2 | 71.4 | 5.4 | 107.0 | 7.0 | 117.1 | 6.5 |
| Mevinphos(Z) | 0.998 | 6.2 | 20.6 | 109.2 | 2.8 | 74.9 | 2.9 | 77.3 | 7.6 |
| Pebulate | 0.995 | 8.3 | 27.2 | 96.8 | 10.2 | 109.8 | 2.2 | 111.1 | 2.1 |
| Methacrifos | 0.997 | 3.3 | 11.0 | 110.2 | 8.9 | 114.0 | 3.6 | 106.3 | 2.1 |
| Molinate | 0.998 | 3.8 | 12.7 | 90.5 | 3.0 | 82.0 | 1.6 | 107.2 | 5.1 |
| Isoprocarb | 0.998 | 10.6 | 35.1 | 83.0 | 6.4 | 80.0 | 6.3 | 100.2 | 8.9 |
| Heptenophos | 0.998 | 3.2 | 10.4 | 100.7 | 10.1 | 110.1 | 2.8 | 120.7 | 7.6 |
| Chlorphenprop-methyl | 0.997 | 7.1 | 23.4 | 91.2 | 15.5 | 82.4 | 6.1 | 88.6 | 6.6 |
| Thionazin | 0.997 | 8.1 | 26.7 | 95.9 | 10.6 | 110.8 | 9.4 | 110.9 | 7.4 |
| Fenobucarb | 0.998 | 4.4 | 14.5 | 79.9 | 11.5 | 78.6 | 4.4 | 101.4 | 6.8 |
| Propoxur | 0.998 | 3.0 | 9.9 | 91.5 | 12.5 | 81.8 | 4.4 | 113.4 | 0.3 |
| Demeton-O | 0.998 | 7.2 | 23.9 | 88.6 | 3.8 | 100.5 | 4.5 | 98.2 | 3.4 |
| Demeton-S-methyl | 0.999 | 9.7 | 31.9 | 77.9 | 9.5 | 108.1 | 7.0 | 89.1 | 3.8 |
| Cycloate | 0.997 | 2.7 | 8.9 | 116.2 | 3.1 | 111.9 | 11.3 | 108.7 | 1.3 |
| Ethoprophos | 0.999 | 4.6 | 15.3 | 104.5 | 7.8 | 119.8 | 0.7 | 122.3 | 3.2 |
| Chlorpropham | 0.996 | 7.5 | 24.8 | 70.7 | 0.3 | 88.1 | 12.3 | 86.4 | 9.4 |
| Naled | 0.996 | 7.1 | 23.3 | 43.8 | 12.5 | 50.2 | 6.4 | 52.4 | 5.3 |
| Chlordimeform | 0.999 | 9.5 | 31.4 | 73.4 | 1.5 | 78.1 | 6.5 | 75.3 | 4.0 |
| Trifluralin | 0.995 | 0.8 | 2.7 | 102.6 | 11.5 | 121.2 | 6.1 | 126.3 | 9.7 |
| Benfluralin | 0.995 | 1.3 | 4.3 | 82.6 | 6.5 | 95.8 | 4.8 | 111.5 | 4.5 |
| Cadusafos | 0.999 | 1.5 | 5.0 | 99.2 | 5.4 | 116.8 | 3.3 | 117.6 | 1.5 |
| Phorate | 0.995 | 0.5 | 1.6 | 107.3 | 8.0 | 106.6 | 10.6 | 106.5 | 7.7 |
| BHC-alpha | 0.998 | 2.0 | 6.5 | 91.4 | 7.8 | 115.5 | 5.0 | 109.5 | 7.8 |
| Hexachlorobenzene | 0.996 | 0.3 | 0.9 | 27.5 | 13.6 | 35.4 | 5.6 | 46.5 | 1.0 |
| Dicloran | 0.999 | 11.2 | 37.0 | 73.2 | 5.5 | 86.5 | 4.2 | 80.5 | 0.7 |
| Demeton-S | 0.999 | 10.4 | 34.2 | 87.4 | 8.0 | 88.3 | 2.1 | 113.5 | 7.7 |
| Dimethoate | 0.998 | 9.2 | 30.5 | 71.4 | 4.7 | 81.4 | 10.8 | 76.2 | 6.9 |
| Carbofuran | 0.996 | 8.4 | 27.8 | 99.9 | 9.9 | 101.1 | 5.5 | 105.5 | 5.3 |
| Atrazine | 0.996 | 1.7 | 5.6 | 87.4 | 10.8 | 83.4 | 2.8 | 91.2 | 5.7 |
| BHC-beta | 0.999 | 1.3 | 4.1 | 74.1 | 8.0 | 95.0 | 10.2 | 97.6 | 6.2 |
| Clomazone | 0.998 | 2.0 | 6.5 | 119.2 | 5.2 | 114.6 | 3.7 | 114.5 | 4.7 |
| Propazine | 0.998 | 11.6 | 38.3 | 94.4 | 2.4 | 83.9 | 9.1 | 93.9 | 3.6 |
| Terbumeton | 0.996 | 8.0 | 26.3 | 77.7 | 5.1 | 78.2 | 4.4 | 84.1 | 3.6 |
| BHC-gamma | 0.998 | 1.3 | 4.4 | 104.3 | 11.8 | 112.6 | 11.1 | 110.1 | 3.9 |
| Quintozene | 0.999 | 0.1 | 0.3 | 71.6 | 8.1 | 110.2 | 7.2 | 98.0 | 3.9 |
| Terbufos | 0.997 | 4.5 | 14.7 | 99.3 | 3.4 | 107.2 | 2.2 | 124.8 | 4.4 |
| Trietazine | 0.998 | 5.5 | 18.3 | 73.3 | 3.2 | 76.9 | 3.9 | 85.7 | 2.1 |
| Fonofos | 0.998 | 6.7 | 22.1 | 110.1 | 5.6 | 112.4 | 2.4 | 116.8 | 0.6 |
| Phosphamidon(E) | 0.998 | 11.8 | 38.8 | 85.9 | 6.3 | 113.2 | 3.3 | 97.3 | 3.3 |
| Diazinon | 0.999 | 5.8 | 19.1 | 116.6 | 9.9 | 107.1 | 3.3 | 110.6 | 4.0 |
| Disulfoton | 0.999 | 7.5 | 24.9 | 102.5 | 5.5 | 88.5 | 6.4 | 94.6 | 6.7 |
| BHC-delta | 0.995 | 13.7 | 45.2 | 111.1 | 7.8 | 103.3 | 12.1 | 112.0 | 5.1 |
| Mexacarbate | 0.996 | 4.3 | 14.3 | 94.4 | 5.5 | 96.2 | 4.9 | 114.2 | 8.9 |
| Triallate | 0.997 | 1.8 | 5.8 | 88.4 | 5.8 | 117.1 | 3.4 | 116.2 | 4.1 |
| Tefluthrin | 0.996 | 3.1 | 10.1 | 116.5 | 1.2 | 116.9 | 1.5 | 127.7 | 3.0 |
| Isazofos | 0.997 | 3.1 | 10.3 | 103.3 | 12.4 | 115.2 | 1.6 | 119.8 | 4.6 |
| 3-Hydroxycarbofuran | 0.995 | 7.7 | 25.3 | 108.2 | 4.9 | 107.8 | 1.8 | 118.9 | 7.7 |
| Iprobenfos | 0.998 | 3.2 | 10.6 | 104.2 | 5.1 | 121.3 | 3.3 | 124.7 | 6.0 |
| Pirimicarb | 0.998 | 2.1 | 6.9 | 93.1 | 2.3 | 108.3 | 2.6 | 116.5 | 1.4 |
| Benfuresate | 0.998 | 4.0 | 13.3 | 90.5 | 8.4 | 79.5 | 8.8 | 85.7 | 5.1 |
| Phosphamidon(Z) | 0.999 | 6.4 | 21.2 | 101.9 | 3.7 | 78.3 | 3.3 | 76.7 | 1.3 |
| Propanil | 0.997 | 7.9 | 26.2 | 86.6 | 5.6 | 76.1 | 7.6 | 87.4 | 8.1 |
| Dimethachlor | 0.996 | 9.2 | 30.4 | 76.5 | 8.1 | 78.8 | 6.4 | 84.9 | 5.1 |
| Acetochlor | 0.998 | 19.0 | 62.8 | 93.8 | 7.4 | 110.1 | 4.9 | 99.6 | 2.6 |
| Parathion-methyl | 0.996 | 5.4 | 18.0 | 110.2 | 5.0 | 99.5 | 7.3 | 78.5 | 1.4 |
| Chlorpyrifos-methyl | 0.998 | 3.6 | 11.7 | 94.8 | 7.2 | 88.0 | 2.1 | 97.9 | 4.9 |
| Vinclozolin | 0.999 | 6.5 | 21.4 | 99.8 | 6.7 | 106.0 | 11.4 | 91.0 | 2.6 |
| Simetryn | 0.998 | 14.1 | 46.4 | 104.1 | 11.9 | 70.0 | 2.7 | 72.4 | 3.2 |
| Carbaryl | 0.996 | 14.5 | 47.7 | 73.2 | 3.5 | 77.2 | 2.8 | 107.4 | 9.8 |
| Tolclofos-methyl | 0.998 | 6.3 | 20.9 | 103.5 | 7.0 | 110.9 | 1.5 | 113.1 | 4.2 |
| Heptachlor | 0.999 | 0.4 | 1.4 | 104.7 | 4.7 | 111.0 | 7.5 | 102.2 | 1.6 |
| Alachlor | 0.999 | 4.3 | 14.3 | 100.2 | 1.0 | 97.7 | 8.8 | 104.5 | 3.7 |
| Prometryn | 0.999 | 8.4 | 27.7 | 121.7 | 9.3 | 106.0 | 4.4 | 103.1 | 5.4 |
| Metalaxyl | 0.996 | 3.9 | 12.8 | 105.8 | 8.1 | 93.7 | 6.4 | 116.0 | 7.3 |
| Fenchlorphos | 0.999 | 6.2 | 20.4 | 100.7 | 6.4 | 105.3 | 4.4 | 117.5 | 1.6 |
| Prosulfocarb | 0.997 | 5.6 | 18.3 | 91.6 | 6.1 | 72.3 | 0.1 | 104.8 | 5.1 |
| Demeton-S-methylsulfone | 0.996 | 14.5 | 47.9 | 76.4 | 8.0 | 85.7 | 0.8 | 87.7 | 1.6 |
| Thiobencarb | 0.998 | 6.7 | 22.2 | 98.1 | 7.6 | 86.2 | 9.4 | 100.4 | 3.3 |
| Orbencarb | 0.998 | 7.2 | 23.9 | 118.0 | 0.3 | 92.8 | 11.6 | 105.2 | 5.2 |
| Methiocarb | 0.996 | 2.9 | 9.5 | 95.8 | 7.1 | 98.1 | 7.4 | 104.6 | 8.8 |
| Fenitrothion | 0.998 | 11.0 | 36.4 | 113.7 | 11.3 | 113.9 | 12.8 | 110.7 | 3.6 |
| Pentanochlor | 0.998 | 8.0 | 26.4 | 100.7 | 3.7 | 74.5 | 2.3 | 101.3 | 4.1 |
| Pirimiphos-methyl | 0.999 | 14.5 | 47.8 | 108.2 | 12.0 | 114.4 | 3.0 | 113.2 | 3.8 |
| Bromacil | 0.999 | 2.3 | 7.6 | 88.4 | 11.8 | 110.9 | 12.2 | 105.1 | 6.1 |
| Ethofumesate | 0.997 | 8.3 | 27.5 | 85.5 | 1.4 | 86.0 | 6.3 | 88.6 | 5.3 |
| Aldrin | 0.999 | 6.5 | 21.6 | 113.2 | 1.0 | 110.8 | 1.8 | 107.1 | 4.4 |
| Malathion | 0.998 | 10.5 | 34.5 | 105.6 | 10.2 | 109.1 | 11.5 | 108.9 | 7.6 |
| Phorate-sulfone | 0.995 | 8.9 | 29.5 | 113.3 | 5.2 | 104.2 | 8.9 | 124.2 | 1.5 |
| Metolachlor | 0.999 | 5.4 | 17.8 | 107.6 | 4.2 | 112.1 | 1.5 | 111.4 | 4.7 |
| Fenthion | 0.999 | 3.9 | 12.7 | 99.4 | 8.6 | 108.7 | 8.7 | 114.8 | 2.7 |
| Dicofol | 0.997 | 20.3 | 67.1 | 94.8 | 3.1 | 103.5 | 0.3 | 113.1 | 3.9 |
| Parathion | 0.996 | 7.5 | 24.9 | 79.9 | 3.7 | 83.9 | 4.3 | 99.1 | 2.5 |
| Thiazopyr | 0.998 | 0.1 | 0.2 | 73.8 | 8.2 | 100.4 | 5.4 | 109.7 | 8.0 |
| Chlorpyrifos | 0.997 | 4.8 | 15.7 | 106.6 | 9.0 | 113.0 | 10.5 | 120.1 | 2.6 |
| Triadimefon | 0.996 | 9.6 | 31.7 | 105.7 | 7.9 | 122.3 | 2.9 | 120.6 | 6.0 |
| Chlorthal-dimethyl | 0.999 | 1.7 | 5.6 | 116.3 | 5.8 | 108.2 | 2.2 | 107.2 | 1.8 |
| Flufenacet | 0.998 | 9.8 | 32.3 | 106.4 | 9.9 | 111.1 | 2.2 | 108.3 | 7.5 |
| Dimetachlone | 0.999 | 5.0 | 16.4 | 117.7 | 7.7 | 82.1 | 3.8 | 103.6 | 5.8 |
| Isocarbophos | 0.998 | 4.4 | 14.4 | 118.5 | 1.1 | 104.3 | 6.0 | 105.1 | 8.3 |
| Thiamethoxam | 0.998 | 4.8 | 15.8 | 108.1 | 5.9 | 78.4 | 12.6 | 79.8 | 7.4 |
| Bromophos | 0.999 | 3.1 | 10.4 | 116.3 | 5.4 | 98.8 | 7.8 | 106.3 | 4.4 |
| Butralin | 0.996 | 2.9 | 9.6 | 109.0 | 5.7 | 96.7 | 10.4 | 103.8 | 4.2 |
| Diphenamid | 0.997 | 9.0 | 29.6 | 115.1 | 4.2 | 92.6 | 8.1 | 86.3 | 6.2 |
| Isopropalin | 0.995 | 8.1 | 26.7 | 70.0 | 5.6 | 78.4 | 9.1 | 71.0 | 4.9 |
| Oxychlordane | 0.999 | 1.8 | 5.8 | 103.0 | 11.5 | 88.3 | 5.9 | 90.9 | 4.2 |
| trans-Chlorfenvinphos | 0.996 | 2.3 | 7.7 | 87.3 | 11.3 | 105.0 | 3.6 | 99.4 | 7.9 |
| Heptachlor epoxides (cis-) | 0.997 | 3.6 | 11.7 | 106.9 | 8.4 | 111.8 | 11.1 | 98.7 | 5.2 |
| Terbufos sulfone | 0.997 | 2.6 | 8.4 | 91.9 | 4.6 | 114.5 | 7.0 | 123.3 | 1.8 |
| Pendimethalin | 0.995 | 9.6 | 31.6 | 105.7 | 3.4 | 123.0 | 3.5 | 118.1 | 1.8 |
| Penconazole | 0.999 | 10.0 | 33.1 | 114.5 | 2.2 | 101.8 | 4.7 | 101.1 | 3.5 |
| Heptachlor epoxides (trans-) | 0.998 | 5.5 | 18.3 | 110.8 | 1.4 | 98.5 | 3.1 | 82.3 | 6.5 |
| Captan | 0.998 | 10.9 | 36.1 | 80.3 | 6.6 | 74.5 | 5.4 | 86.9 | 2.0 |
| cis-Chlorfenvinphos | 0.998 | 5.6 | 18.5 | 114.3 | 4.1 | 117.4 | 3.3 | 119.7 | 0.4 |
| Isofenphos | 0.995 | 5.8 | 19.2 | 97.9 | 7.9 | 113.6 | 3.6 | 118.6 | 3.8 |
| Quinalphos | 0.999 | 3.3 | 11.0 | 88.4 | 9.3 | 102.4 | 3.8 | 106.4 | 6.2 |
| Triadimenol | 0.997 | 5.6 | 18.6 | 97.1 | 13.1 | 105.6 | 5.9 | 107.3 | 5.3 |
| Phenthoate | 0.996 | 7.4 | 24.3 | 81.8 | 8.1 | 101.7 | 14.0 | 109.8 | 2.4 |
| Folpet | 0.999 | 5.8 | 19.1 | 67.6 | 8.6 | 68.8 | 0.8 | 117.6 | 1.7 |
| Methoprene | 0.995 | 9.3 | 30.6 | 98.5 | 4.8 | 109.1 | 8.1 | 108.9 | 6.8 |
| Chlordane-trans | 0.998 | 2.0 | 6.5 | 83.5 | 7.0 | 115.7 | 5.9 | 116.4 | 2.6 |
| Methidathion | 0.995 | 8.3 | 27.4 | 109.8 | 13.0 | 124.0 | 6.5 | 119.6 | 1.1 |
| o,p’-DDE | 0.995 | 2.3 | 7.6 | 92.0 | 1.6 | 109.5 | 4.4 | 117.4 | 1.2 |
| Haloxyfop-methyl | 0.996 | 6.7 | 22.2 | 102.2 | 6.2 | 106.9 | 2.9 | 106.8 | 10.9 |
| alpha-Endosulfan | 0.997 | 4.6 | 15.0 | 83.3 | 6.1 | 119.5 | 1.7 | 109.6 | 3.9 |
| Disulfoton-sulfone | 0.997 | 9.3 | 30.8 | 118.3 | 6.5 | 110.7 | 10.1 | 115.2 | 2.3 |
| Tetrachlorvinphos | 0.998 | 4.3 | 14.3 | 90.7 | 12.5 | 109.1 | 9.2 | 103.6 | 8.2 |
| Chlordane-cis | 0.997 | 1.6 | 5.3 | 74.3 | 11.3 | 66.8 | 3.4 | 100.6 | 8.3 |
| Mepanipyrim | 0.999 | 7.9 | 25.9 | 68.0 | 6.5 | 75.5 | 0.4 | 103.9 | 8.8 |
| Butachlor | 0.999 | 10.2 | 33.5 | 109.0 | 6.5 | 108.8 | 5.8 | 115.1 | 6.9 |
| Flumetralin | 0.999 | 2.7 | 8.9 | 94.7 | 4.7 | 109.5 | 5.6 | 118.9 | 1.4 |
| Napropamide | 0.999 | 2.8 | 9.3 | 115.3 | 1.4 | 108.5 | 10.6 | 111.1 | 6.2 |
| Fenamiphos | 0.999 | 20.9 | 68.9 | 92.8 | 10.4 | 104.9 | 10.2 | 119.9 | 3.2 |
| Butamifos | 0.997 | 8.1 | 26.7 | 101.0 | 8.2 | 101.8 | 9.8 | 104.5 | 8.9 |
| Hexaconazole | 0.998 | 1.2 | 4.0 | 117.7 | 4.1 | 104.9 | 12.2 | 112.3 | 7.2 |
| Imazalil | 0.999 | 14.4 | 47.5 | 70.8 | 6.0 | 79.2 | 0.5 | 87.9 | 6.7 |
| Prothiofos | 0.999 | 3.5 | 11.6 | 102.4 | 2.1 | 96.7 | 8.8 | 122.3 | 2.1 |
| Isoprothiolane | 0.996 | 7.5 | 24.7 | 76.4 | 6.3 | 102.1 | 11.6 | 112.2 | 2.0 |
| Profenofos | 0.998 | 5.2 | 17.1 | 83.7 | 5.9 | 94.3 | 10.4 | 119.2 | 5.1 |
| Dieldrin | 0.998 | 5.9 | 19.5 | 74.8 | 9.0 | 100.2 | 8.0 | 88.4 | 8.1 |
| p,p’-DDE | 0.999 | 1.3 | 4.3 | 122.1 | 2.3 | 111.4 | 7.8 | 110.8 | 6.2 |
| Uniconazole-P | 0.997 | 0.4 | 1.4 | 104.8 | 10.8 | 93.2 | 6.6 | 88.1 | 6.2 |
| Pretilachlor | 0.999 | 0.8 | 2.6 | 98.1 | 2.3 | 108.4 | 0.5 | 105.5 | 6.1 |
| Tribufos | 0.999 | 7.4 | 24.4 | 116.9 | 8.5 | 110.6 | 10.1 | 114.1 | 3.9 |
| Oxadiazon | 0.997 | 9.3 | 30.5 | 92.8 | 7.6 | 94.2 | 6.5 | 101.5 | 3.3 |
| o,p’-DDD | 0.998 | 1.0 | 3.1 | 111.0 | 4.7 | 112.6 | 3.2 | 115.7 | 3.1 |
| Myclobutanil | 0.996 | 16.4 | 54.2 | 86.9 | 9.5 | 81.7 | 12.4 | 105.7 | 3.4 |
| Flamprop-methyl | 0.998 | 2.2 | 7.4 | 88.7 | 4.9 | 89.5 | 2.9 | 92.8 | 4.2 |
| Buprofezin | 0.995 | 11.3 | 37.2 | 80.3 | 5.4 | 94.4 | 6.5 | 101.5 | 8.4 |
| Oxyfluorfen | 0.998 | 5.0 | 16.5 | 76.4 | 5.0 | 102.4 | 9.9 | 112.4 | 4.0 |
| Bupirimate | 0.999 | 11.2 | 37.1 | 111.4 | 7.1 | 109.2 | 1.6 | 110.3 | 4.7 |
| Thifluzamide | 0.999 | 1.4 | 4.7 | 94.3 | 1.4 | 113.7 | 8.3 | 110.1 | 1.8 |
| Kresoxim-methyl | 0.997 | 6.9 | 22.7 | 82.8 | 9.1 | 99.3 | 7.3 | 99.5 | 3.8 |
| Nitrofen | 0.998 | 8.7 | 28.6 | 87.1 | 10.3 | 98.6 | 4.4 | 83.1 | 5.4 |
| Endrin | 0.999 | 4.8 | 15.9 | 90.6 | 6.2 | 97.5 | 8.9 | 103.3 | 0.5 |
| Isoxathion | 0.999 | 14.7 | 48.4 | 85.1 | 6.5 | 77.3 | 4.4 | 114.8 | 9.6 |
| Fluazifop-butyl | 0.997 | 8.0 | 26.6 | 67.1 | 2.7 | 94.7 | 10.4 | 73.2 | 1.8 |
| beta-Endosulfan | 0.999 | 18.1 | 59.6 | 115.9 | 2.8 | 96.4 | 3.5 | 63.8 | 6.7 |
| Chlorobenzilate | 0.999 | 7.4 | 24.4 | 107.9 | 10.2 | 107.5 | 7.4 | 106.8 | 9.2 |
| Fensulfothion | 0.999 | 2.4 | 7.9 | 108.3 | 8.1 | 77.6 | 6.6 | 104.1 | 2.6 |
| Fenthion sulfoxide | 0.998 | 13.6 | 44.7 | 96.3 | 10.3 | 107.1 | 4.6 | 111.5 | 2.5 |
| Aclonifen | 0.997 | 1.2 | 4.0 | 86.6 | 9.4 | 111.3 | 8.9 | 99.4 | 7.1 |
| p,p’-DDD | 0.999 | 2.4 | 8.0 | 105.0 | 2.5 | 99.9 | 2.3 | 104.9 | 8.2 |
| Fenthion sulfone | 0.998 | 12.8 | 42.2 | 86.3 | 11.4 | 117.3 | 10.2 | 96.3 | 9.4 |
| o,p’-DDT | 0.999 | 1.0 | 3.2 | 104.9 | 8.0 | 114.7 | 3.3 | 100.1 | 4.8 |
| Oxadixyl | 0.999 | 12.5 | 41.2 | 71.3 | 0.9 | 68.3 | 3.7 | 70.0 | 0.4 |
| Ethion | 0.997 | 5.2 | 17.2 | 120.8 | 3.7 | 119.3 | 1.1 | 116.2 | 4.6 |
| Chlorthiophos | 0.996 | 4.9 | 16.2 | 93.4 | 4.6 | 108.0 | 1.2 | 113.0 | 5.9 |
| Triazophos | 0.997 | 21.3 | 70.2 | 89.4 | 1.5 | 99.8 | 9.8 | 120.0 | 4.2 |
| Carbophenothion | 0.997 | 2.8 | 9.1 | 94.0 | 1.1 | 110.5 | 11.6 | 114.8 | 3.4 |
| Benalaxyl | 0.999 | 6.8 | 22.3 | 95.5 | 4.9 | 102.1 | 6.0 | 106.1 | 5.6 |
| Endosulfan sulfate | 0.998 | 1.1 | 3.7 | 98.3 | 5.6 | 106.0 | 2.1 | 105.1 | 3.9 |
| Carfentrazone-ethyl | 0.996 | 9.3 | 30.6 | 95.8 | 8.7 | 85.4 | 7.4 | 95.4 | 5.4 |
| Propiconazole I | 0.999 | 11.1 | 36.7 | 104.9 | 5.3 | 90.6 | 5.0 | 94.7 | 11.9 |
| Propiconazole II | 0.998 | 10.3 | 34.1 | 97.8 | 4.5 | 108.1 | 7.7 | 112.9 | 2.9 |
| p,p’-DDT | 0.999 | 2.8 | 9.1 | 81.6 | 8.2 | 89.1 | 8.5 | 80.7 | 5.7 |
| Hexazinone | 0.996 | 13.1 | 43.1 | 85.4 | 6.7 | 73.5 | 6.6 | 72.8 | 8.7 |
| Tebuconazole | 0.997 | 20.2 | 66.7 | 92.0 | 8.8 | 82.5 | 9.2 | 83.6 | 6.9 |
| Thenylchlor | 0.998 | 6.4 | 21.1 | 77.6 | 1.0 | 81.7 | 8.4 | 70.1 | 0.5 |
| Triphenyl phosphate | 0.999 | 4.9 | 16.0 | 105.0 | 6.7 | 81.2 | 3.8 | 79.8 | 6.1 |
| Piperonyl butoxide | 0.996 | 4.8 | 15.8 | 117.5 | 1.8 | 108.4 | 2.5 | 107.7 | 4.0 |
| Pyributicarb | 0.998 | 8.2 | 27.0 | 90.0 | 0.6 | 91.1 | 5.3 | 98.2 | 1.8 |
| Benzoylprop-ethyl | 0.996 | 2.4 | 7.8 | 86.7 | 2.0 | 91.5 | 6.0 | 90.9 | 2.9 |
| Iprodione | 0.997 | 11.7 | 38.8 | 74.8 | 10.3 | 74.0 | 0.4 | 106.3 | 7.4 |
| Bromopropylate | 0.998 | 3.5 | 11.7 | 95.6 | 8.7 | 93.1 | 6.9 | 103.4 | 2.7 |
| Carbosulfan | 0.998 | 1.8 | 5.9 | 95.9 | 6.6 | 108.4 | 2.2 | 87.9 | 10.9 |
| EPN | 0.999 | 13.7 | 45.1 | 96.1 | 11.1 | 112.9 | 5.0 | 114.3 | 5.9 |
| Picolinafen | 0.998 | 8.9 | 29.2 | 71.2 | 8.9 | 78.2 | 2.0 | 74.3 | 5.3 |
| Chlorantraniliprole | 0.996 | 10.9 | 35.9 | 73.8 | 3.1 | 72.3 | 6.2 | 73.3 | 5.2 |
| Bifenthrin | 0.997 | 8.4 | 27.7 | 94.8 | 4.3 | 104.5 | 3.4 | 120.5 | 3.2 |
| Methoxychlor | 0.999 | 5.0 | 16.6 | 86.2 | 8.0 | 104.6 | 3.6 | 110.4 | 4.9 |
| Fenamidone | 0.999 | 9.9 | 32.8 | 82.7 | 4.9 | 101.7 | 7.2 | 102.2 | 6.0 |
| Anilofos | 0.996 | 8.9 | 29.2 | 64.2 | 2.3 | 96.4 | 2.1 | 110.4 | 4.7 |
| Clomeprop | 0.998 | 4.4 | 14.4 | 81.1 | 8.5 | 71.3 | 1.7 | 76.0 | 9.8 |
| Tetradifon | 0.999 | 27.6 | 91.2 | 83.7 | 4.9 | 95.9 | 4.5 | 83.2 | 5.2 |
| Phosalone | 0.998 | 9.6 | 31.8 | 86.9 | 0.4 | 110.9 | 5.1 | 109.2 | 6.7 |
| Leptophos | 0.999 | 9.5 | 31.3 | 72.4 | 3.3 | 74.9 | 7.4 | 112.8 | 2.0 |
| Cyhalofop-butyl | 0.999 | 16.7 | 55.0 | 98.8 | 2.2 | 96.5 | 6.1 | 113.4 | 5.9 |
| Cyhalothrin | 0.997 | 20.1 | 66.4 | 101.7 | 8.7 | 95.4 | 7.4 | 110.7 | 5.0 |
| Fenarimol | 0.997 | 13.9 | 46.0 | 93.0 | 6.8 | 96.7 | 9.0 | 98.8 | 3.7 |
| Pyrazophos | 0.996 | 13.9 | 46.0 | 114.8 | 6.8 | 70.4 | 6.6 | 100.7 | 5.3 |
| Benfuracarb | 0.998 | 13.1 | 43.2 | 115.5 | 1.9 | 109.3 | 2.6 | 110.8 | 4.0 |
| Fenoxaprop-P-ethyl | 0.998 | 2.5 | 8.3 | 103.1 | 10.8 | 70.6 | 3.5 | 77.3 | 6.3 |
| Bitertanol | 0.996 | 26.9 | 88.9 | 87.4 | 5.2 | 96.5 | 3.8 | 100.6 | 1.3 |
| Permethrin-cis | 0.996 | 7.4 | 24.3 | 111.1 | 6.6 | 112.8 | 5.1 | 119.1 | 5.1 |
| Permethrin-trans | 0.997 | 6.9 | 22.7 | 91.4 | 11.8 | 110.2 | 1.2 | 113.2 | 5.1 |
| Boscalid | 0.998 | 8.5 | 28.2 | 83.8 | 6.3 | 84.3 | 5.3 | 82.0 | 3.1 |
| Quizalofop-p-ethyl | 0.999 | 9.6 | 31.7 | 101.8 | 8.7 | 100.6 | 6.3 | 95.7 | 4.9 |
| Quizalofop-ethyl | 0.996 | 8.9 | 29.3 | 110.2 | 8.7 | 99.7 | 9.5 | 111.6 | 2.1 |
| Flucythrinate I | 0.999 | 13.6 | 44.9 | 89.0 | 10.1 | 91.6 | 10.5 | 92.0 | 3.9 |
| Flucythrinate II | 0.999 | 14.4 | 47.5 | 114.0 | 12.3 | 99.8 | 6.7 | 91.4 | 5.5 |
| Fenvalerate | 0.997 | 29.9 | 98.8 | 107.9 | 8.1 | 96.1 | 4.4 | 91.7 | 4.7 |
| Deltamethrin | 0.999 | 14.1 | 46.6 | 80.3 | 6.3 | 93.0 | 3.3 | 98.2 | 6.9 |
| Indoxacarb | 0.998 | 14.2 | 47.0 | 90.2 | 11.5 | 104.6 | 14.3 | 105.0 | 6.4 |
| Dimethomorph(Z) | 0.995 | 12.6 | 41.5 | 87.3 | 8.0 | 104.9 | 6.6 | 115.0 | 5.1 |
| Dimethomorph(E) | 0.996 | 14.3 | 47.1 | 103.3 | 7.3 | 113.8 | 8.4 | 98.2 | 6.9 |
References
- Gaddamidi, V.; Zimmerman, W.T.; Ponte, M.; Ruzo, L. Pyrolysis of C-14-Chlorantraniliprole in Tobacco. J. Agric. Food Chem. 2011, 59, 9424–9432. [Google Scholar] [CrossRef]
- Davila, E.L.; Houbraken, M.; De Rop, J.; Wumbei, A.; Du Laing, G.; Romero, O.R.; Spanoghe, P. Pesticides residues in tobacco smoke: Risk assessment study. Environ. Monit. Assess. 2020, 192, 1–15. [Google Scholar] [CrossRef]
- CORESTA. Guide: No.1 Agrochemical Guidance Residue Levels (GRLs). 2021, Agro-Chemical Advisory Committee of CORESTA. Available online: https://www.coresta.org/agrochemical-guidance-residue-levels-grls-29205.html (accessed on 25 December 2021).
- Chen, X.S.; Bian, Z.Y.; Hou, H.W.; Yang, F.; Liu, S.S.; Tang, G.L.; Hu, Q.Y. Development and Validation of a Method for the Determination of 159 Pesticide Residues in Tobacco by Gas Chromatography-Tandem Mass Spectrometry. J. Agric. Food Chem. 2013, 61, 5746–5757. [Google Scholar] [CrossRef]
- Khan, Z.S.; Girame, R.; Utture, S.C.; Ghosh, R.K.; Banerjee, K. Rapid and sensitive multiresidue analysis of pesticides in tobacco using low pressure and traditional gas chromatography tandem mass spectrometry. J. Chromatogr. A 2015, 1418, 228–232. [Google Scholar] [CrossRef]
- Cao, J.M.; Sun, N.; Yu, W.S.; Pang, X.L.; Lin, Y.N.; Kong, F.Y.; Qiu, J. Multiresidue determination of 114 multiclass pesticides in flue-cured tobacco by solid-phase extraction coupled with gas chromatography and tandem mass spectrometry. J. Sep. Sci. 2016, 39, 4629–4636. [Google Scholar] [CrossRef]
- Zhu, W.; Gao, C.; Lou, X.; Zhang, X.; Shi, X.; He, Y.; Wang, C. Rapid determination of 57 pesticide residues in tobacco leaves by LC-MS/MS. Acta Tab. Sin. 2013, 19, 12–16. [Google Scholar] [CrossRef]
- Li, Y.J.; Lu, P.; Hu, D.Y.; Bhadury, P.S.; Zhang, Y.P.; Zhang, K.K. Determination of Dufulin Residue in Vegetables, Rice, and Tobacco Using Liquid Chromatography with Tandem Mass Spectrometry. J. AOAC Int. 2015, 98, 1739–1744. [Google Scholar] [CrossRef]
- Bernardi, G.; Kemmerich, M.; Ribeiro, L.C.; Adaime, M.B.; Zanella, R.; Prestes, O.D. An effective method for pesticide residues determination in tobacco by GC-MS/MS and UHPLC-MS/MS employing acetonitrile extraction with low-temperature precipitation and d-SPE clean-up. Talanta 2016, 161, 40–47. [Google Scholar] [CrossRef]
- Portoles, T.; Mol, J.G.J.; Sancho, J.V.; Lopez, F.J.; Hernandez, F. Validation of a qualitative screening method for pesticides in fruits and vegetables by gas chromatography quadrupole-time of flight mass spectrometry with atmospheric pressure chemical ionization. Anal. Chim. Acta 2014, 838, 76–85. [Google Scholar] [CrossRef]
- Li, J.X.; Li, X.Y.; Chang, Q.Y.; Li, Y.; Jin, L.H.; Pang, G.F.; Fan, C.L. Screening of 439 Pesticide Residues in Fruits and Vegetables by Gas Chromatography-Quadrupole-Time-of-Flight Mass Spectrometry Based on TOF Accurate Mass Database and Q-TOF Spectrum Library. J. AOAC Int. 2018, 101, 1631–1638. [Google Scholar] [CrossRef]
- Pang, G.F.; Fan, C.L.; Chang, Q.Y.; Li, J.X.; Kang, J.; Lu, M.L. Screening of 485 Pesticide Residues in Fruits and Vegetables by Liquid Chromatography-Quadrupole-Time-of-Flight Mass Spectrometry Based on TOF Accurate Mass Database and QTOF Spectrum Library. J. AOAC Int. 2018, 101, 1156–1182. [Google Scholar] [CrossRef]
- Li, J.; Teng, X.; Wang, W.; Zhang, Z.; Fan, C. Determination of multiple pesticide residues in teas by gas chromatography with accurate time-of-flight mass spectrometry. J. Sep. Sci. 2019, 42, 1990–2002. [Google Scholar] [CrossRef]
- Yang, F.; Bian, Z.; Chen, X.; Liu, S.S.; Liu, Y.; Tang, G. Determination of Chlorinated Phenoxy Acid Herbicides in Tobacco by Modified QuEChERS Extraction and High-Performance Liquid Chromatography/Tandem Mass Spectrometry. J. AOAC Int. 2013, 96, 1134–1137. [Google Scholar] [CrossRef]
- Xiong, W.; Jing, H.; Guo, D.; Wang, Y.; Yang, F. A Novel Method for the Determination of Fungicide Residues in Tobacco by Ultra-performance Liquid Chromatography-Tandem Mass Spectrometry Combined with Pass-Through Solid-Phase Extraction. Chromatographia 2021, 84, 729–740. [Google Scholar] [CrossRef]
- Li, M.; Jin, Y.; Li, H.-F.; Hashi, Y.; Ma, Y.; Lin, J.-M. Rapid determination of residual pesticides in tobacco by the quick, easy, cheap, effective, rugged, and safe sample pretreatment method coupled with LC-MS. J. Sep. Sci. 2013, 36, 2522–2529. [Google Scholar] [CrossRef]
- Guo, W.; Bian, Z.; Zhang, D.; Tang, G.; Liu, W.; Wang, J.; Li, Z.; Yang, F. Simultaneous determination of herbicide residues in tobacco using ultraperformance convergence chromatography coupled with solid-phase extraction. J. Sep. Sci. 2015, 38, 858–863. [Google Scholar] [CrossRef]
- Chen, Y.; Zhu, S.-C.; Zhen, X.-T.; Shi, M.-Z.; Yu, Y.-L.; Cao, J.; Zheng, H.; Ye, L.-H. Miniaturized solid phase extraction of multi-pesticide residues in food supplement using plant sorbent by microwave-induced activated carbons. Microchem. J. 2021, 171, 106814. [Google Scholar] [CrossRef]
- Goon, A.; Shinde, R.; Ghosh, B.; Banerjee, K. Application of Automated Mini-Solid-Phase Extraction Cleanup for the Analysis of Pesticides in Complex Spice Matrixes by GC-MS/MS. J. AOAC Int. 2020, 103, 40–45. [Google Scholar] [CrossRef]
- Amir, R.M.; Randhawa, M.A.; Nadeem, M.; Ahmed, A.; Ahmad, A.; Khan, M.R.; Khan, M.A.; Kausar, R. Assessing and Reporting Household Chemicals as a Novel Tool to Mitigate Pesticide Residues in Spinach (Spinacia oleracea). Sci. Rep. 2019, 9, 6. [Google Scholar] [CrossRef] [Green Version]
- Cutillas, V.; Galera, M.M.; Rajski, L.; Fernandez-Alba, A.R. Evaluation of supercritical fluid chromatography coupled to tandem mass spectrometry for pesticide residues in food. J. Chromatogr. A 2018, 1545, 67–74. [Google Scholar] [CrossRef]
- Mol, H.G.J.; Plaza-Bolanos, P.; Zomer, P.; de Rijk, T.C.; Stolker, A.A.M.; Mulder, P.P.J. Toward a Generic Extraction Method for Simultaneous Determination of Pesticides, Mycotoxins, Plant Toxins, and Veterinary Drugs in Feed and Food Matrixes. Anal. Chem. 2008, 80, 9450–9459. [Google Scholar] [CrossRef]
- Lehotay, S.J. Determination of pesticide residues in foods by acetonitrile extraction and partitioning with magnesium sulfate: Collaborative study. J. AOAC Int. 2007, 90, 485–520. [Google Scholar] [CrossRef] [Green Version]
- Chen, X.S.; Bian, Z.Y.; Tang, G.L.; Hu, Q.Y. Determination of 132 pesticide residues in tobacco by gas chromatography-tandem mass spectrometry. Chin. J. Chromatogr. 2012, 30, 1043–1055. [Google Scholar] [CrossRef]
- Kwon, H.; Lehotay, S.J.; Geis-Asteggiante, L. Variability of matrix effects in liquid and gas chromatography-mass spectrometry analysis of pesticide residues after QuEChERS sample preparation of different food crops. J. Chromatogr. A 2012, 1270, 235–245. [Google Scholar] [CrossRef]
- de Sousa, F.A.; Costa, A.I.G.; de Queiroz, M.; Teofilo, R.F.; Neves, A.A.; de Pinho, G.P. Evaluation of matrix effect on the GC response of eleven pesticides by PCA. Food Chem. 2012, 135, 179–185. [Google Scholar] [CrossRef] [Green Version]
- Hakme, E.; Lozano, A.; Gomez-Ramos, M.M.; Hernando, M.D.; Fernandez-Alba, A.R. Non-target evaluation of contaminants in honey bees and pollen samples by gas chromatography time-of-flight mass spectrometry. Chemosphere 2017, 184, 1310–1319. [Google Scholar] [CrossRef]
- Leandro, C.C.; Hancock, P.; Fussell, R.J.; Keely, B.J. Quantification and screening of pesticide residues in food by gas chromatography-exact mass time-of-flight mass spectrometry. J. Chromatogr. A 2007, 1166, 152–162. [Google Scholar] [CrossRef]
- Lewis, R.J. Sax’s Dangerous Properties of Industrial Materials, 11th ed; Wiley & Sons, Inc.: Hoboken, NJ, USA, 2004; p. 2592. [Google Scholar]
- International Labour Office. Encyclopedia of Occupational Health and Safety; International Labour Office: Geneva, Switzerland, 1983; Volume I–II, p. 621. [Google Scholar]


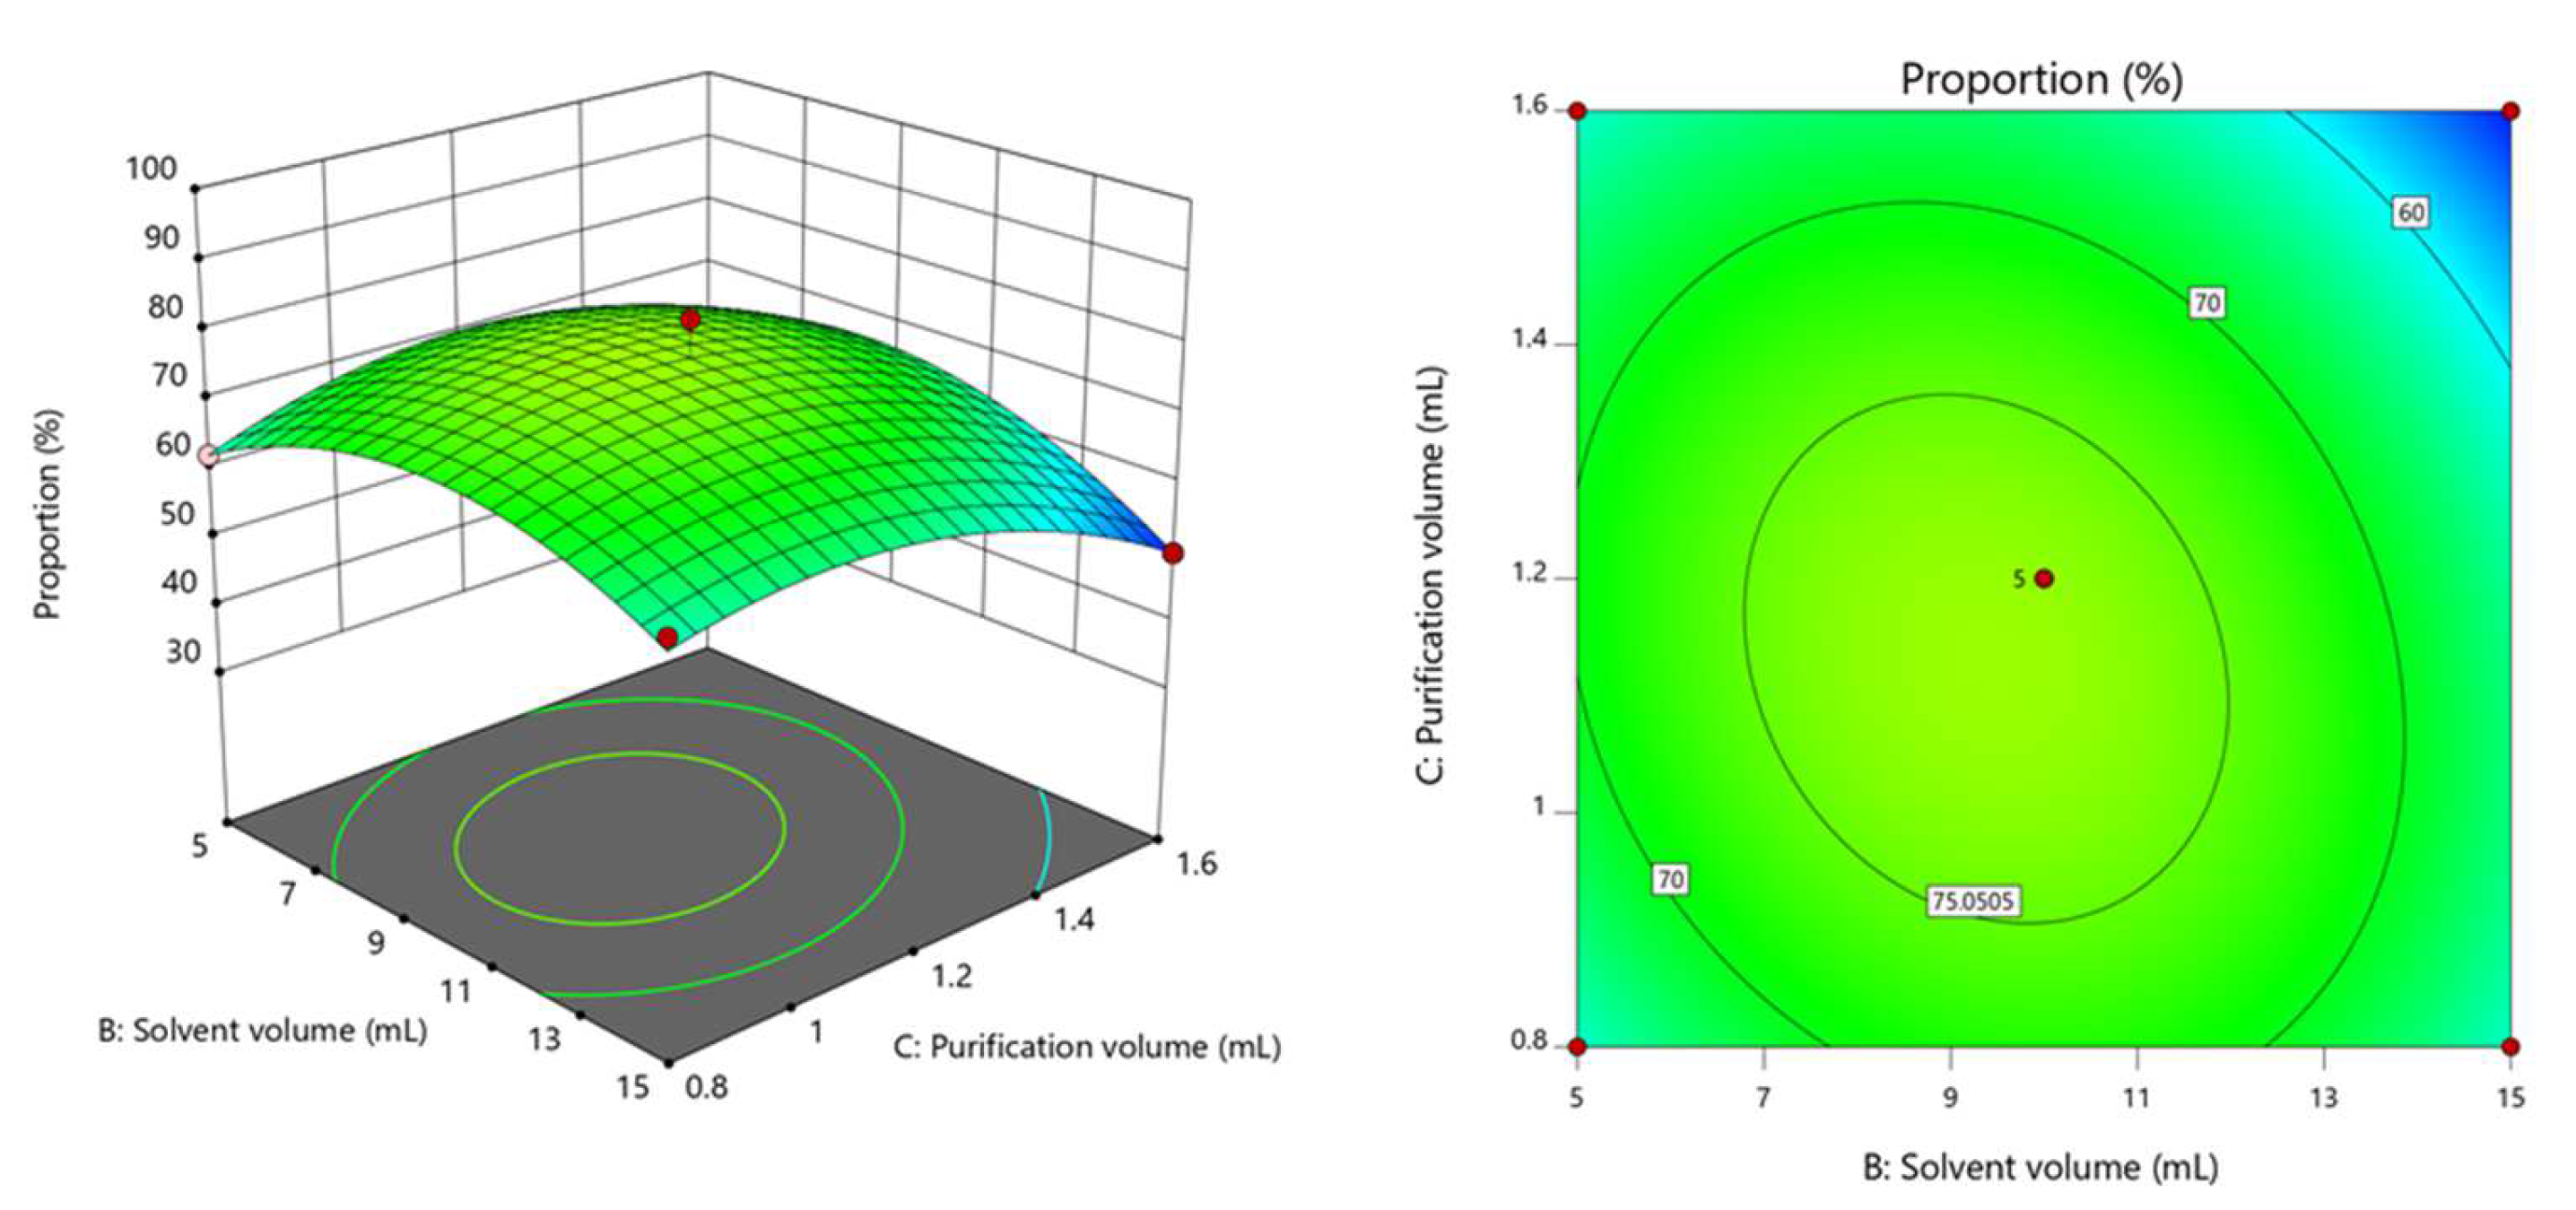

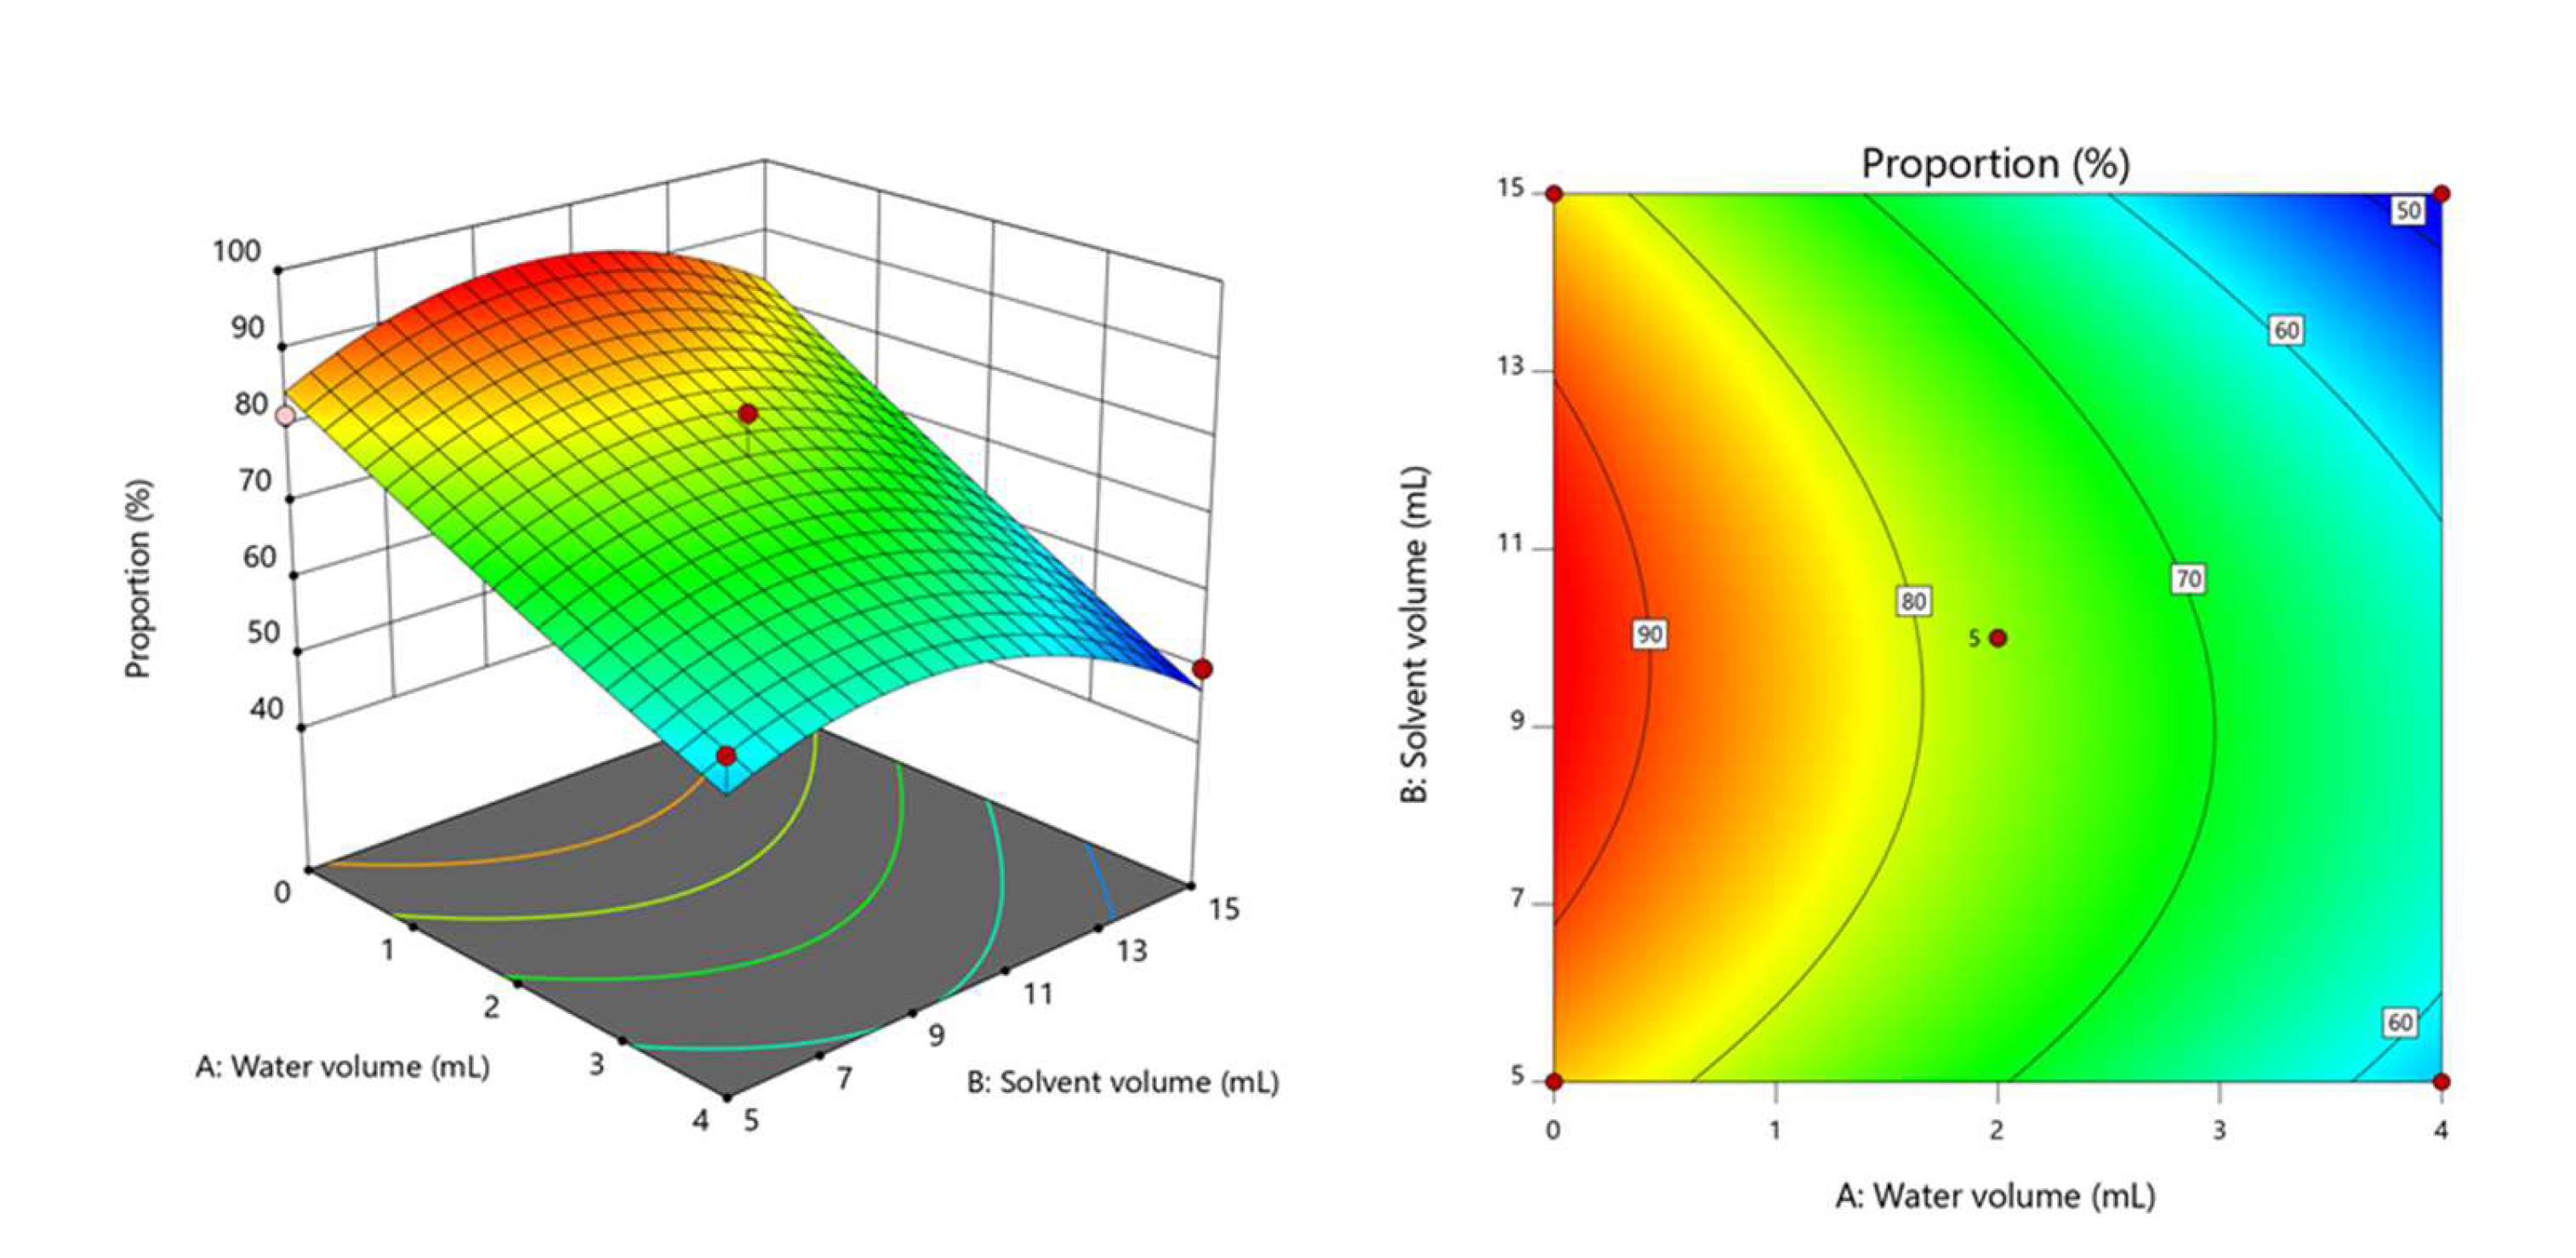
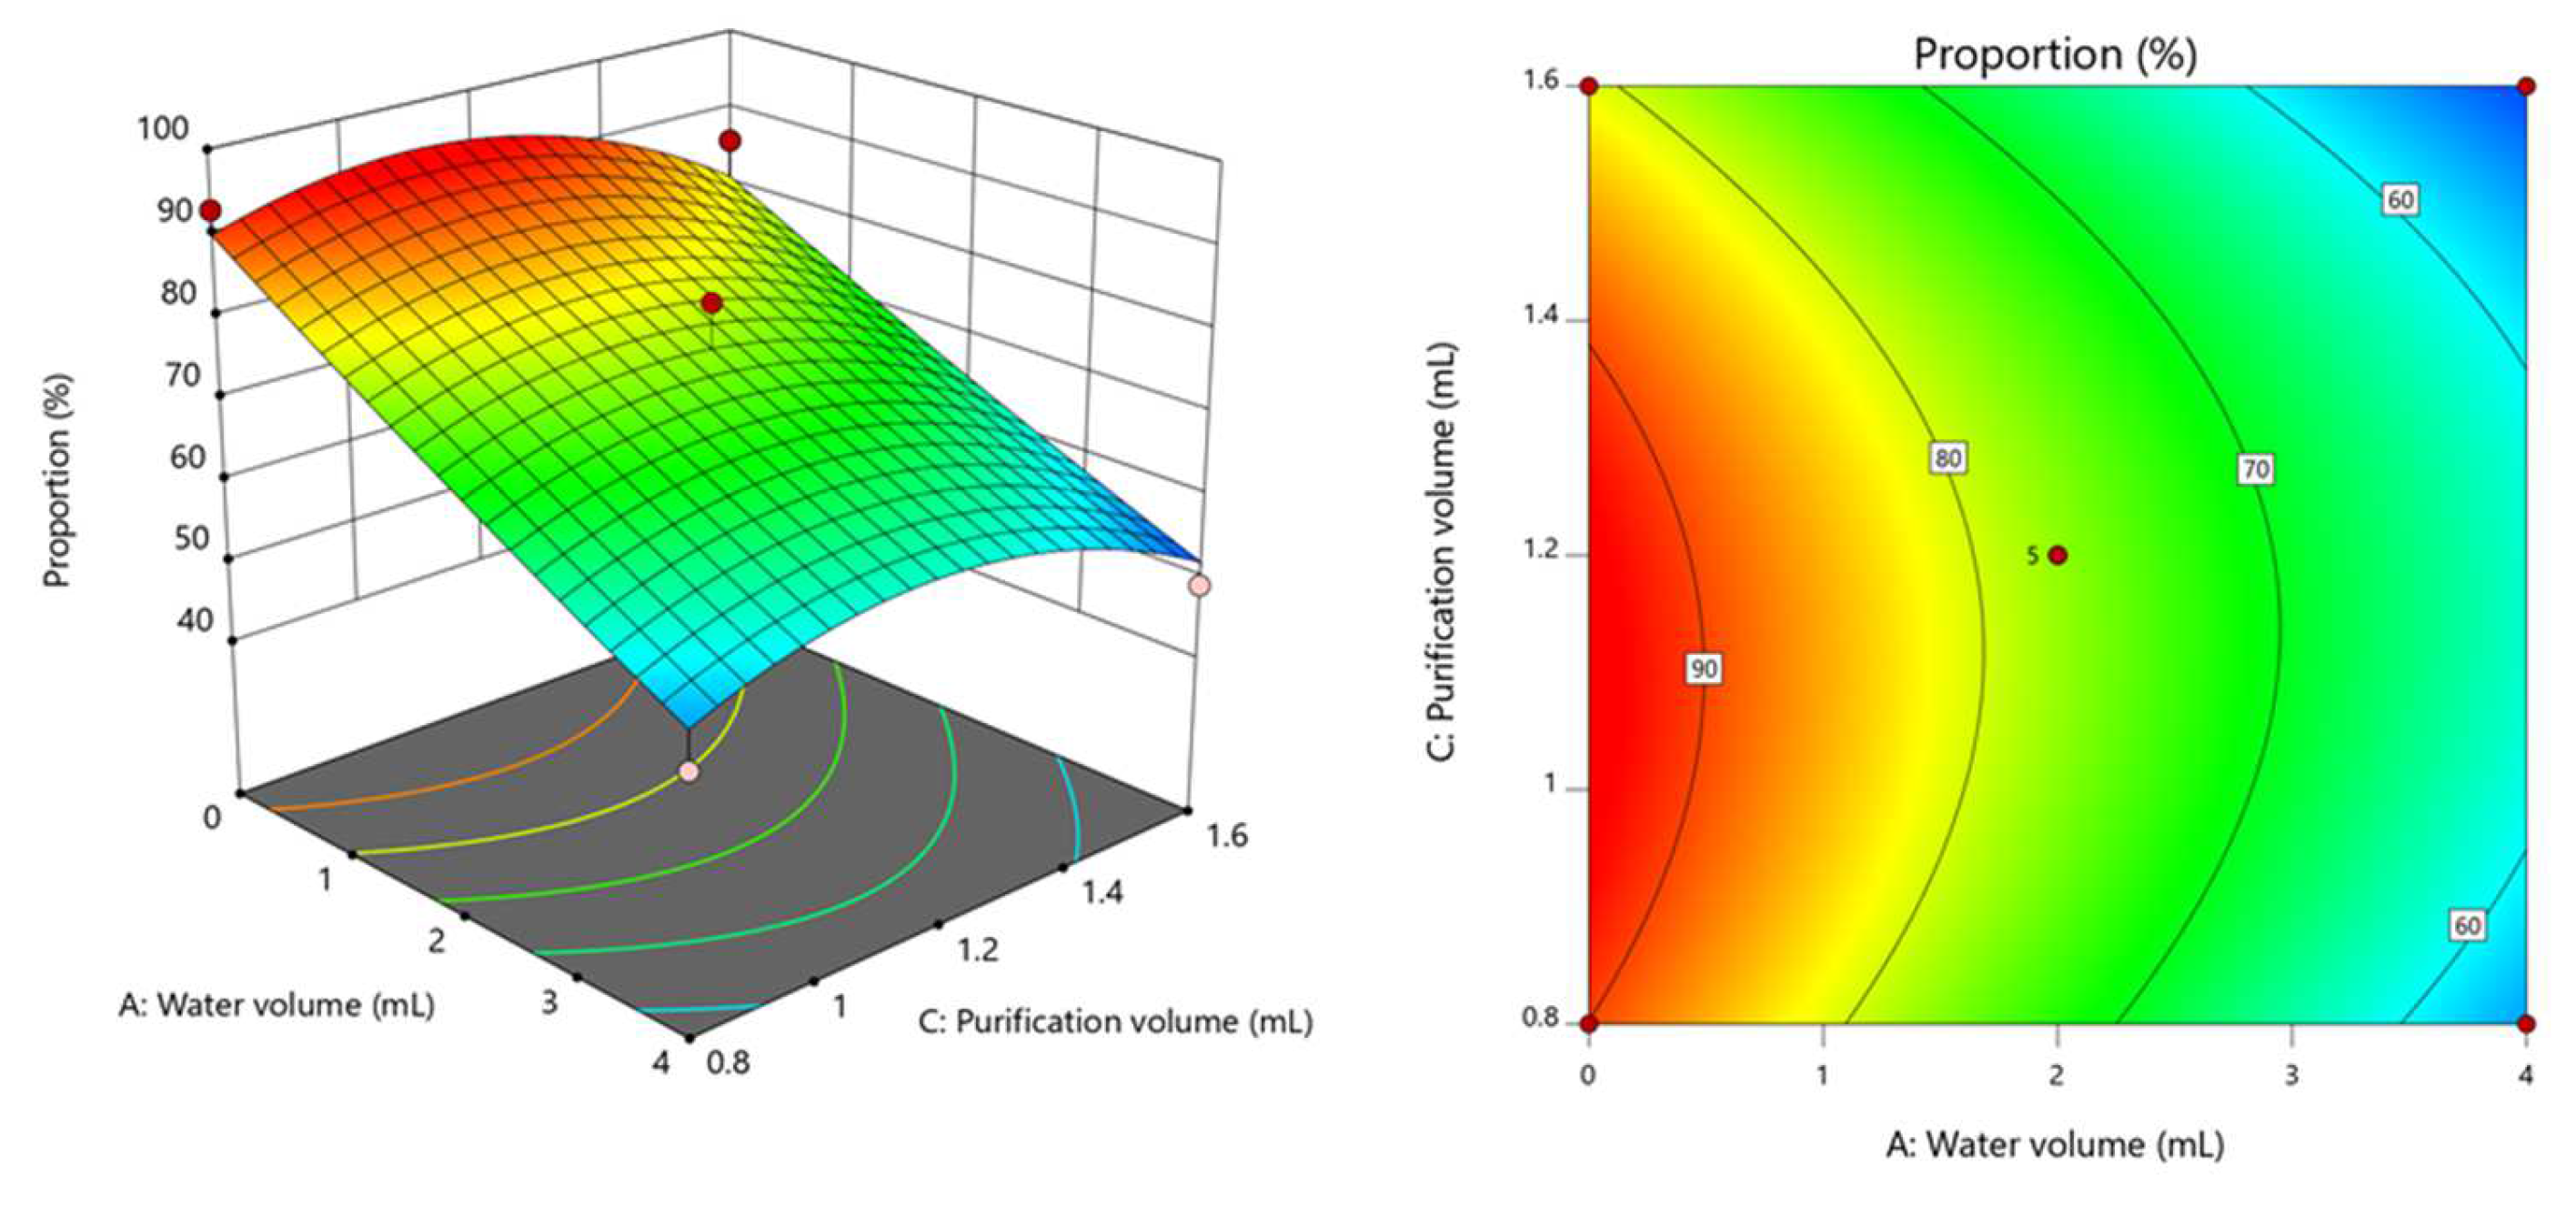
| Factor | Code | Coding Level | ||
|---|---|---|---|---|
| −1 | 0 | 1 | ||
| Water volume (mL) | A | 0 | 2 | 4 |
| Solvent volume (mL) Purification volume (mL) | B C | 5 0.8 | 10 1.2 | 15 1.6 |
Publisher’s Note: MDPI stays neutral with regard to jurisdictional claims in published maps and institutional affiliations. |
© 2022 by the authors. Licensee MDPI, Basel, Switzerland. This article is an open access article distributed under the terms and conditions of the Creative Commons Attribution (CC BY) license (https://creativecommons.org/licenses/by/4.0/).
Share and Cite
Bie, R.; Zhang, J.; Wang, Y.; Jin, D.; Yin, R.; Jiang, B.; Cao, J. Analysis of Multiclass Pesticide Residues in Tobacco by Gas Chromatography Quadrupole Time-of-Flight Mass Spectrometry Combined with Mini Solid-Phase Extraction. Separations 2022, 9, 104. https://doi.org/10.3390/separations9050104
Bie R, Zhang J, Wang Y, Jin D, Yin R, Jiang B, Cao J. Analysis of Multiclass Pesticide Residues in Tobacco by Gas Chromatography Quadrupole Time-of-Flight Mass Spectrometry Combined with Mini Solid-Phase Extraction. Separations. 2022; 9(5):104. https://doi.org/10.3390/separations9050104
Chicago/Turabian StyleBie, Rui, Jiguang Zhang, Yunbai Wang, Dongmei Jin, Rui Yin, Bin Jiang, and Jianmin Cao. 2022. "Analysis of Multiclass Pesticide Residues in Tobacco by Gas Chromatography Quadrupole Time-of-Flight Mass Spectrometry Combined with Mini Solid-Phase Extraction" Separations 9, no. 5: 104. https://doi.org/10.3390/separations9050104
APA StyleBie, R., Zhang, J., Wang, Y., Jin, D., Yin, R., Jiang, B., & Cao, J. (2022). Analysis of Multiclass Pesticide Residues in Tobacco by Gas Chromatography Quadrupole Time-of-Flight Mass Spectrometry Combined with Mini Solid-Phase Extraction. Separations, 9(5), 104. https://doi.org/10.3390/separations9050104